| Phyton-International Journal of Experimental Botany |
DOI: 10.32604/phyton.2022.020735
ARTICLE
Identification of Suitable Reference Genes for qRT-PCR Normalization in Tilia miqueliana Maxim
Jiangsu Key Laboratory for the Research and Utilization of Plant Resources, Institute of Botany, Jiangsu Province and Chinese Academy of Sciences, Nanjing, 210014, China
*Corresponding Author: Shijie Tang. Email: sjtang2021@163.com
Received: 09 December 2021; Accepted: 04 February 2022
Abstract: Quantitative real-time polymerase chain reaction (qRT-PCR) is a rapid and effective approach toward detecting the expression patterns of target genes. The selection of a stable reference gene under specific test condition is essential for expressing levels of target genes accurately. Tilia miqueliana, considered endangered, is a prominent native ornamental and honey tree in East China. No study has evaluated the optimal endogenous reference gene for qRT-PCR analysis in T. miqueliana systematically. In this study, fifteen commonly used reference genes were selected as candidate genes, and the stabilities of their expressions were assessed using four algorithms (GeNorm, NormFiner, BestKeeper, and DeltaCt) in nine experimental datasets. The final integrated evaluation was performed using a comprehensive analysis algorithm (RefFinder). Finally, a target MYB transcription factor gene (TmMYB) was used to verify the accuracy of the candidate reference genes. The results showed that PP2α was the most stable in tissue set, while RPS13 and SAMCD were optimal for heat and cold stress, respectively. Under waterlogging stress, PP2α and TUB were the most stable genes in the leaves and roots, respectively. EF1α and PP2α were optimal for drying stress in leaf and root tissues. TUB and ACT7 were the most stable genes in the leaf and root tissues under salt stress. This is the first systematic evaluation of candidate reference genes in T. miqueliana, and it will benefit future studies on expression and functional analysis of target genes in T. miqueliana.
Keywords: Tilia miqueliana; reference genes; mRNA; qRT-PCR; normalization
Quantitative real-time polymerase chain reaction (qRT-PCR) is an effective and sensitive method for quantifying target gene expression [1]. However, the accuracy of qRT-PCR is affected by the stability of the reference genes, which play a key role in reducing experimental errors among samples [2]. Commonly used internal reference genes, such as actin (ACT7), elongation factor-1 alpha (EF1α), glyceraldehyde-3-phosphate dehydrogenase (GAPDH), and 18 s ribosomal ribonucleic acid (RNA) (18 s rRNA), are usually the housekeeping genes involved in the basic biochemical metabolism process of plants, and maintain the cytoskeleton required for plant life activities [3,4]. In-depth studies show that no ideal reference gene is stably expressed independent of cells and tissues, developmental stages, or growth conditions [5]. Therefore, studies on the identification and evaluation of potential reference genes under different experimental conditions for several species have been conducted [6–16].
Tilia L. is a genus of the family Malvaceae, which contains 23 species of deciduous trees that are distinctly distributed in temperate areas across Asia, Europe, and North America. Most species are considered to be timber and honey resources, and are cultivated worldwide for ornamental purposes [17]. T. miqueliana, a unique species, is widely distributed in Jiangsu, Anhui, Zhejiang, and Jiangxi Provinces, and is currently categorized under vulnerable species in China. The deep dormancy of its seeds has resulted in poor natural regeneration [18]. Environmental factors, such as temperature, light, water, and soil, determine the survival rates of T. miqueliana seedlings. Despite recent reports on propagation techniques of T. miqueliana, the molecular mechanisms of seed dormancy and seedling adaption are crucial for the protection of T. miqueliana wild populations [19–21]. Identifying and clarifying the expression patterns of key genes in the aforementioned biological processes will be conducive to revealing the molecular mechanisms underlying seedling germination and adaption. However, no systematic research on the selection of candidate reference genes in T. miqueliana has been conducted.
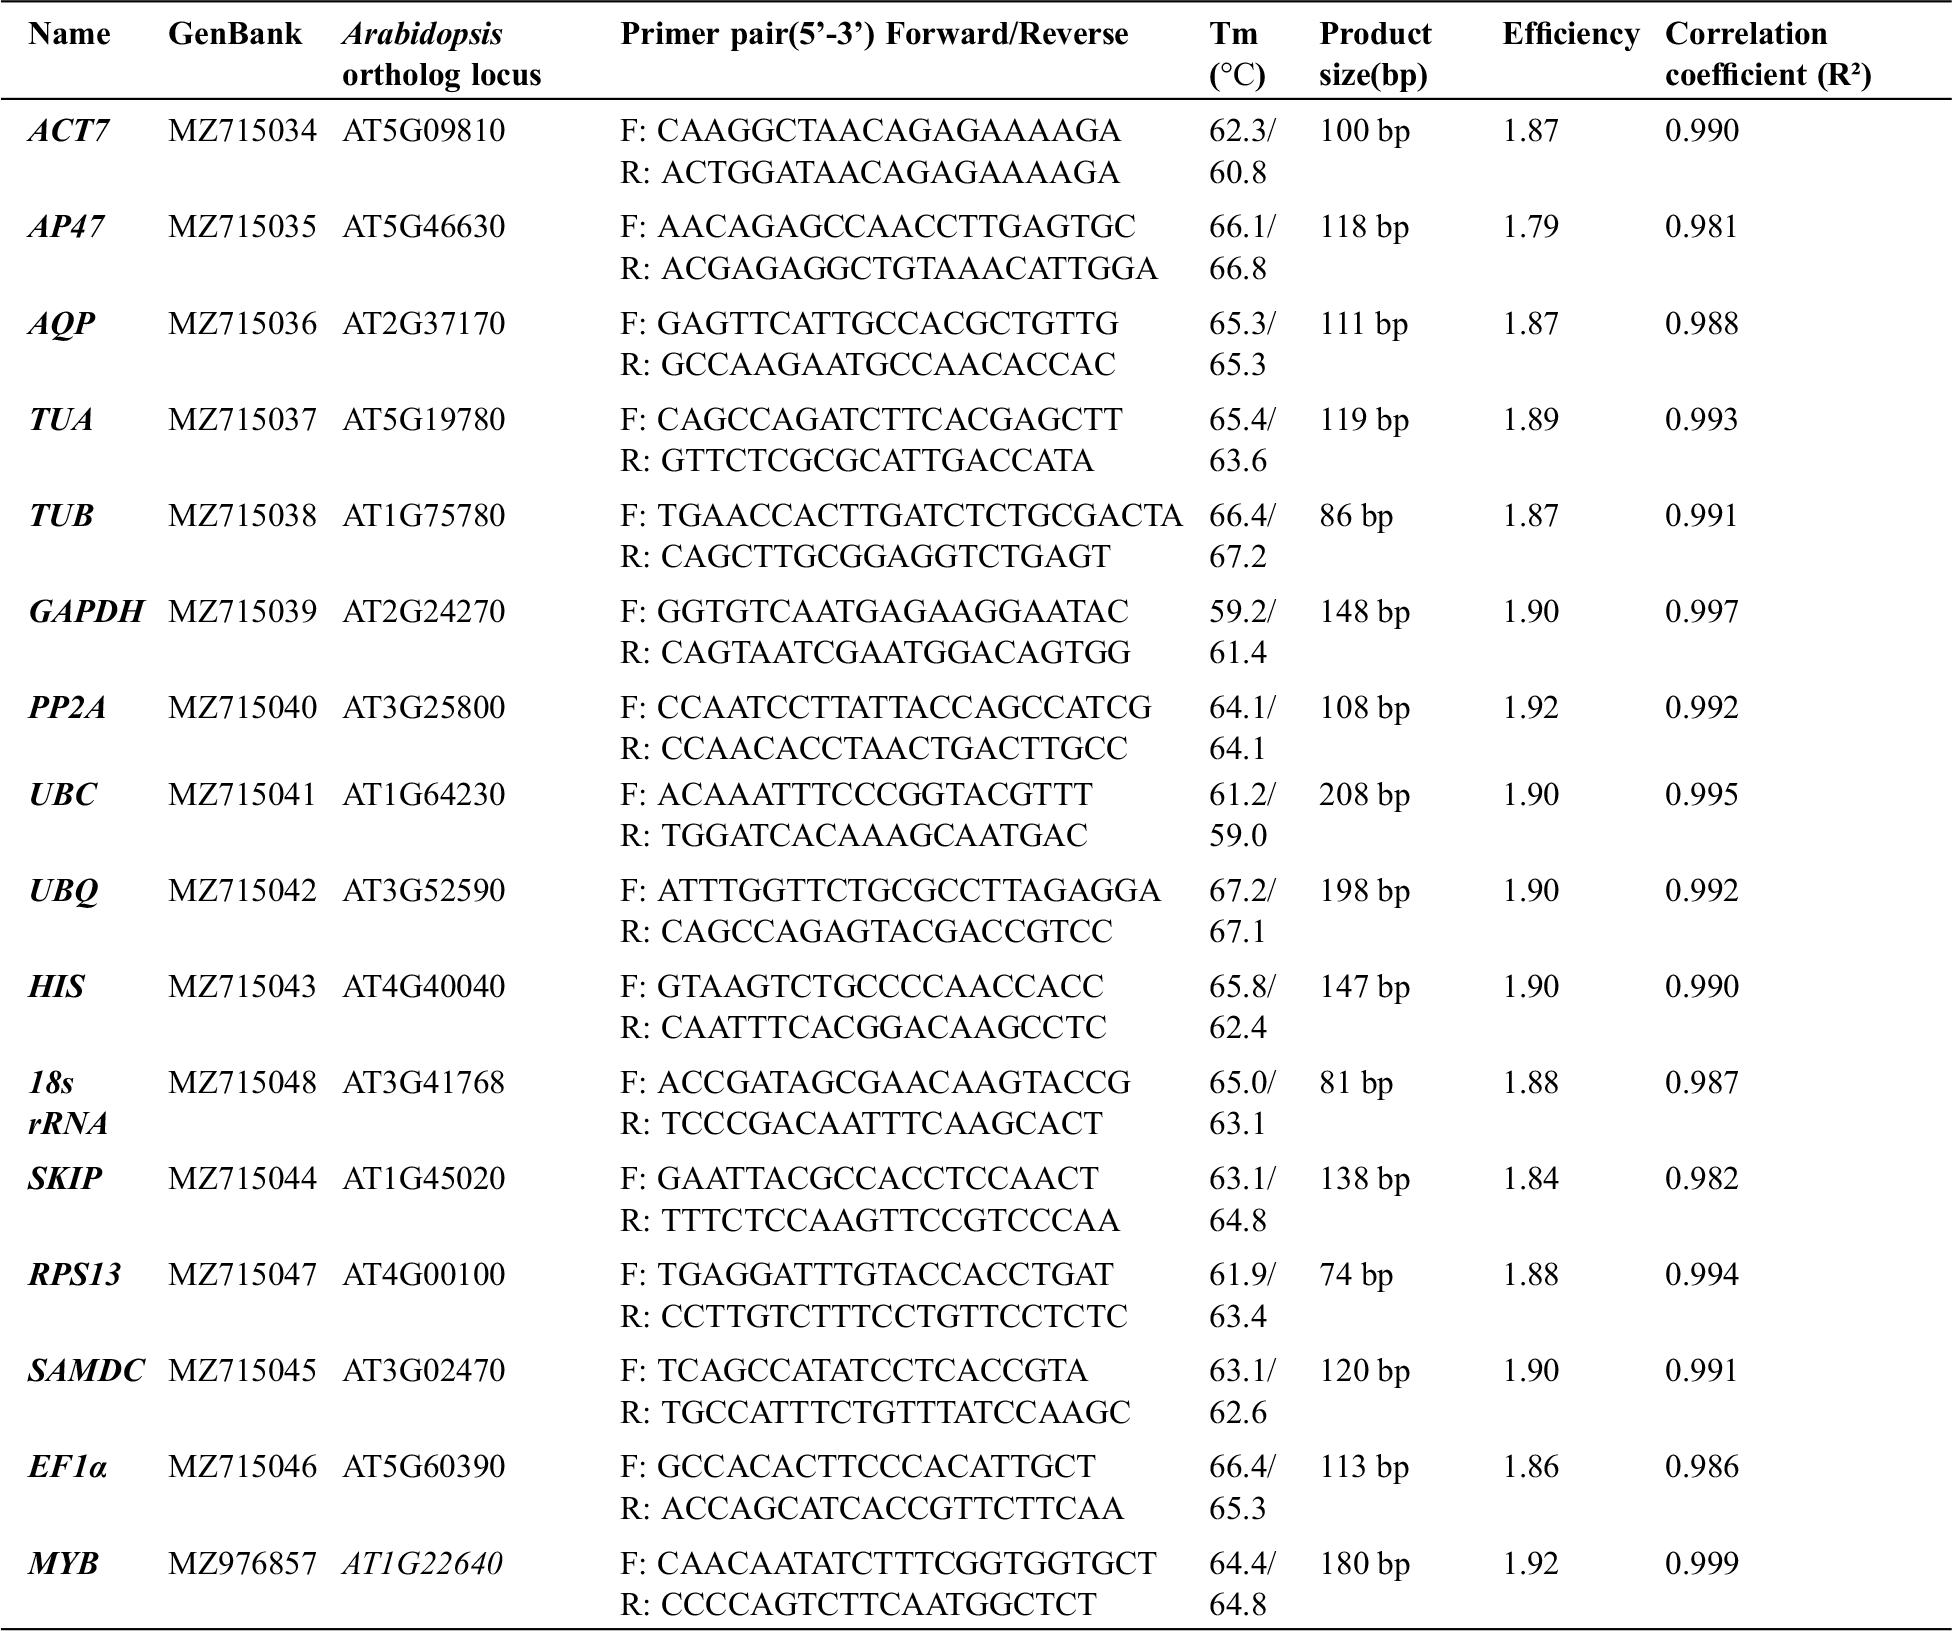
In this study, 15 candidate homologous genes (Actin7 (ACT7), Clathrin adaptor complexes medium subunit family protein (AP47), plasma membrane intrinsic protein 2B/aquaporin PIP2.2 (AQP), tubulin alpha 3/alpha 5 chain (TUA), tubulin beta-1 chain (TUB), glyceraldehyde 3-phosphate dehydrogenase (GAPDH), serine/threonine protein phosphatase 2A (PP2α), ubiquitin-conjugating enzyme (UBC), ubiquitin extension protein (UBQ10), histone superfamily protein (HIS), 18 s ribosomal RNA (18 s rRNA), SKP1/ASK-interacting protein (SKIP), ribosomal protein S13 mRNA (RPS13), S-adenosylmethionine decarboxylase (SAMDC), and elongation factor 1 alpha (EF1α)) were selected as candidate reference genes. In 9 different tissues and under five abiotic stress treatments, the expression stabilities of these 15 genes were validated using five algorithms: GeNorm [22], NormFinder [23], BestKeeper [24], DeltaCt [25], and RefFinder [26]. To verify the suitability of the selected reference genes in T. miqueliana, the relative expression levels of the target gene TmMYB (a homolog of MYB transcription factor gene (MYB3: AT1G22640) in Arabidopsis) were calculated under different experimental conditions [27]. This study provides reliable reference for gene selection in qRT-PCR normalization for future studies on gene expression in T. miqueliana.
2.1 Plant Materials and Stress Treatment
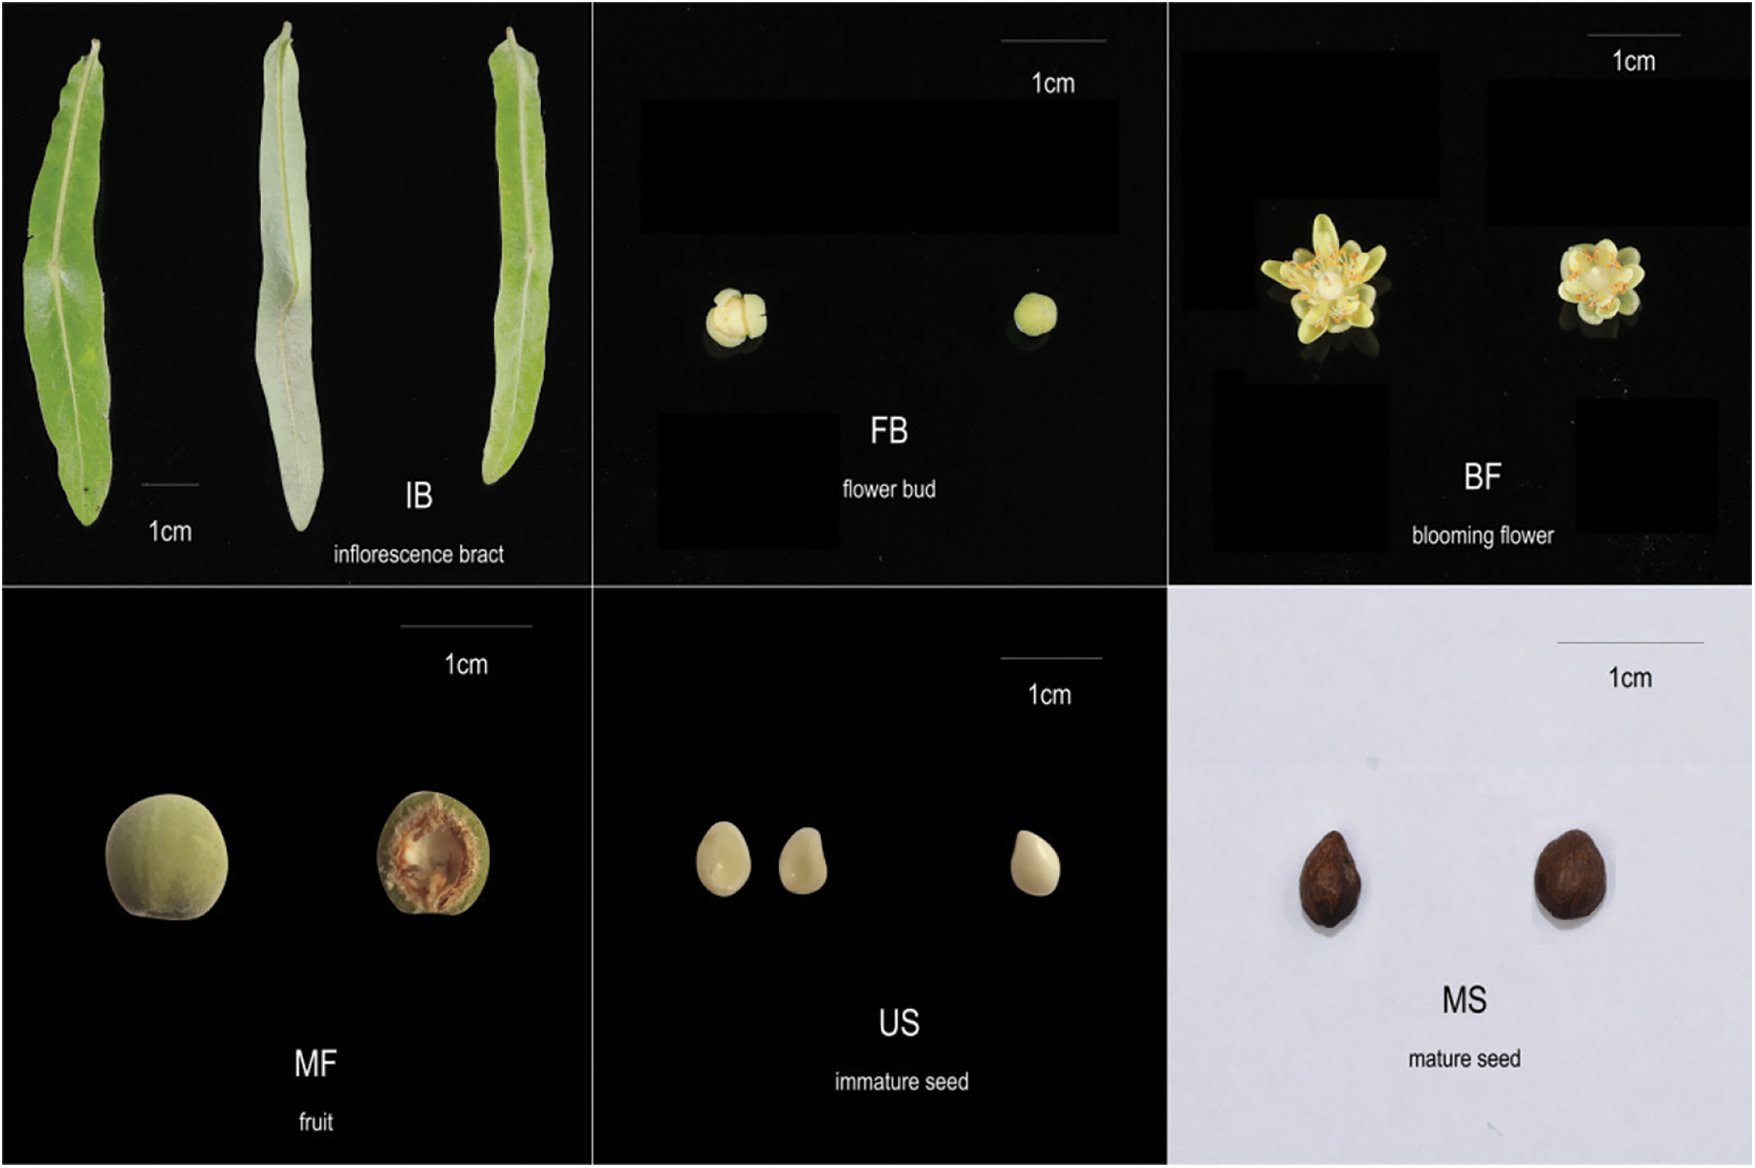
All test plants were preserved in the Jiangsu Provincial Germplasm Repository of Indigenous Landscape Tree (118°49′55″E, 32°3′32″N). Nine tissues, including leaf (LF), root (RT), stem (ST), inflorescence bract (IB), flower bud (FB), blooming flower (BF), fruit (MF), immature seed (US), and mature seed (MS), were collected from three mature plants of T. miqueliana (Appendix A). For stress treatment, T. miquelian 1-year-old plantlets were grown at 24°C, 80% humidity, and a 16 h light/8 h dark photoperiod under LED lamps (300 μmol⋅m−2⋅s−1). After 15 days the plantlets began to form new leaves, they were exposed to various stress conditions including heat, cold, waterlogging, drying and salt. Tissues were collected from 63 seedlings subjected to each stress condition at 0, 1, 3 h, 6, 12, 24, and 48 h. Three different plants were harvested randomly at each sampling time and mixed for one biological replication. We repeated this sampling three times as three biological replicates. All collected samples were frozen in liquid nitrogen immediately and maintained at −80°C until RNA isolation.
For inducing heat or cold stress, the plantlets were exposed to a chamber at 40°C or 4°C and leaves were obtained using the sampling method described above. For inducing waterlogging stress, the plantlets were flooded with deionized water at a level of 2 cm above the mixture surface. For subjecting to drying and salt stress, the plantlets were placed in PEG 6000 (15%) and NaCl (52 mmol⋅L−1) solutions. Both leaves and roots were obtained by waterlogging, drying, and salt treatments.
2.2 RNA Extraction and Complementary Deoxyribonucleic Acid Synthesis
Total RNA was isolated using the Plant RNA Extraction Kit with DNAse I (No. 0416-50 GK, Huanyueyang, Beijing, China). The integrity of total RNA was assessed using 2.0% agarose gel electrophoresis, and the RNA concentration and purity were measured with a spectrophotometer (NanoDrop 2000, Thermo Scientific, Massachusetts, USA). The cDNA was synthesized using 1 μg total RNA with the Primescript RT reagent kit (Takara, Dalian, China).
2.3 Selection of Candidate Reference Genes and Primer Design
Fifteen candidate genes, including 18S rRNA, ACT7, AQUA, AP47, EF1α, GAPDH, HIS, PP2α, RPS13, SAMDC, SKIP, TUA, TUB, UBC, and UBQ10, were selected from the transcriptome sequences of T. miquelina. The closest Arabidopsis homologs were identified using the TAIR BLAST http://www.arabidopsis.org/Blast/index.jsp. All candidate reference genes were cloned and confirmed, and the sequences were uploaded to the NCBI database (Appendix B). Primers were designed using Oligo Primer Analysis Software Version 7 to have melting temperatures ranging between 60°C and 70°C, primer lengths between 19 and 25 bp, and amplicon lengths between 80 and 200 bp.
2.4 Quantitive Real-Time PCR Analysis
The qRT-PCR reactions were performed using the StepOne™ Real-Time PCR System (Applied Biosystems, USA) with SYBR® Premix Ex TaqTM II (Takara, Dalian, China) under the following cycling conditions: 94°C for 2 min, followed by 40 cycles of 95°C for 5 s, 60°C for 30 s, followed by melting curve analysis by heating the PCR products from 60°C to 95°C. The reaction mixture (total 20 μL) contains 1 μg cDNA, 0.6 μM of each primer, 1 × SYBR Premix. Each qRT-PCR analysis was performed in triplicate as technical repetition.
2.5 Stability Analysis of the Candidate Reference Gene
The PCR efficiency (E) and correlation coefficient (R2) for each primer pair were evaluated using the LinRegPCR program [28]. The stability of the 15 potential reference genes was assessed using four programs: GeNorm [22], NormFinder [23], BestKeeper [24], and DeltaCt [25]. Finally, RefFinder [26] was used to integrate and rank candidate genes synthetically.
2.6 Validation of Identified Reference Genes
The top-and lowest-ranked genes were used to calculate TmMYB gene expression to assess the effectiveness of the reference genes. The fold change in gene expression was calculated using the 2 -ΔΔCt method [29].
3.1 Verification of Amplication and Efficiency of the Primer
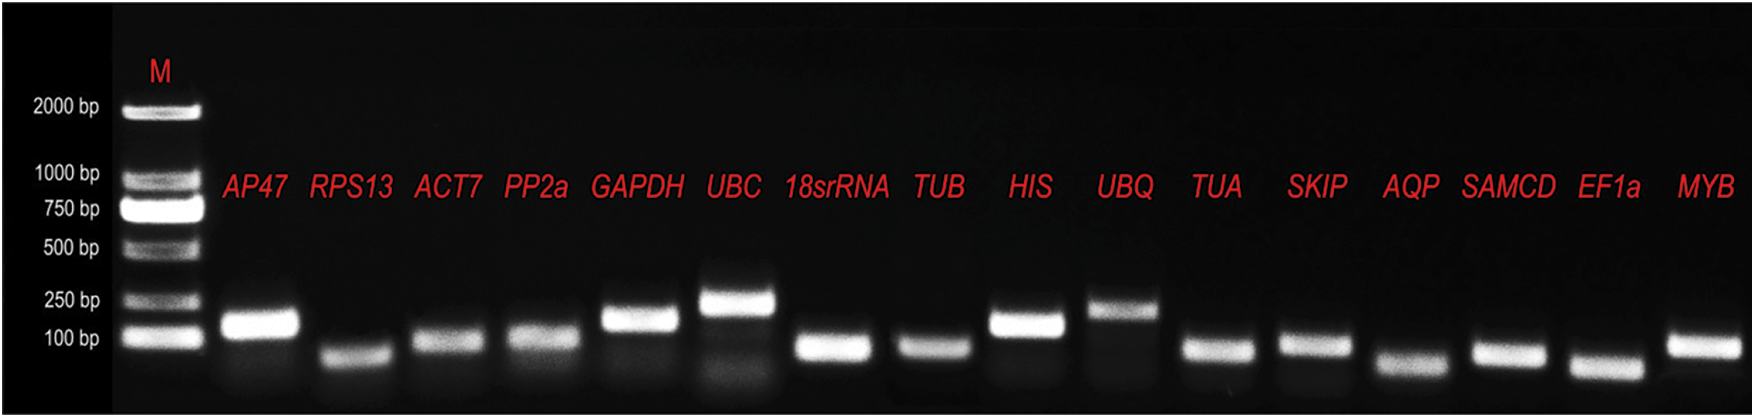
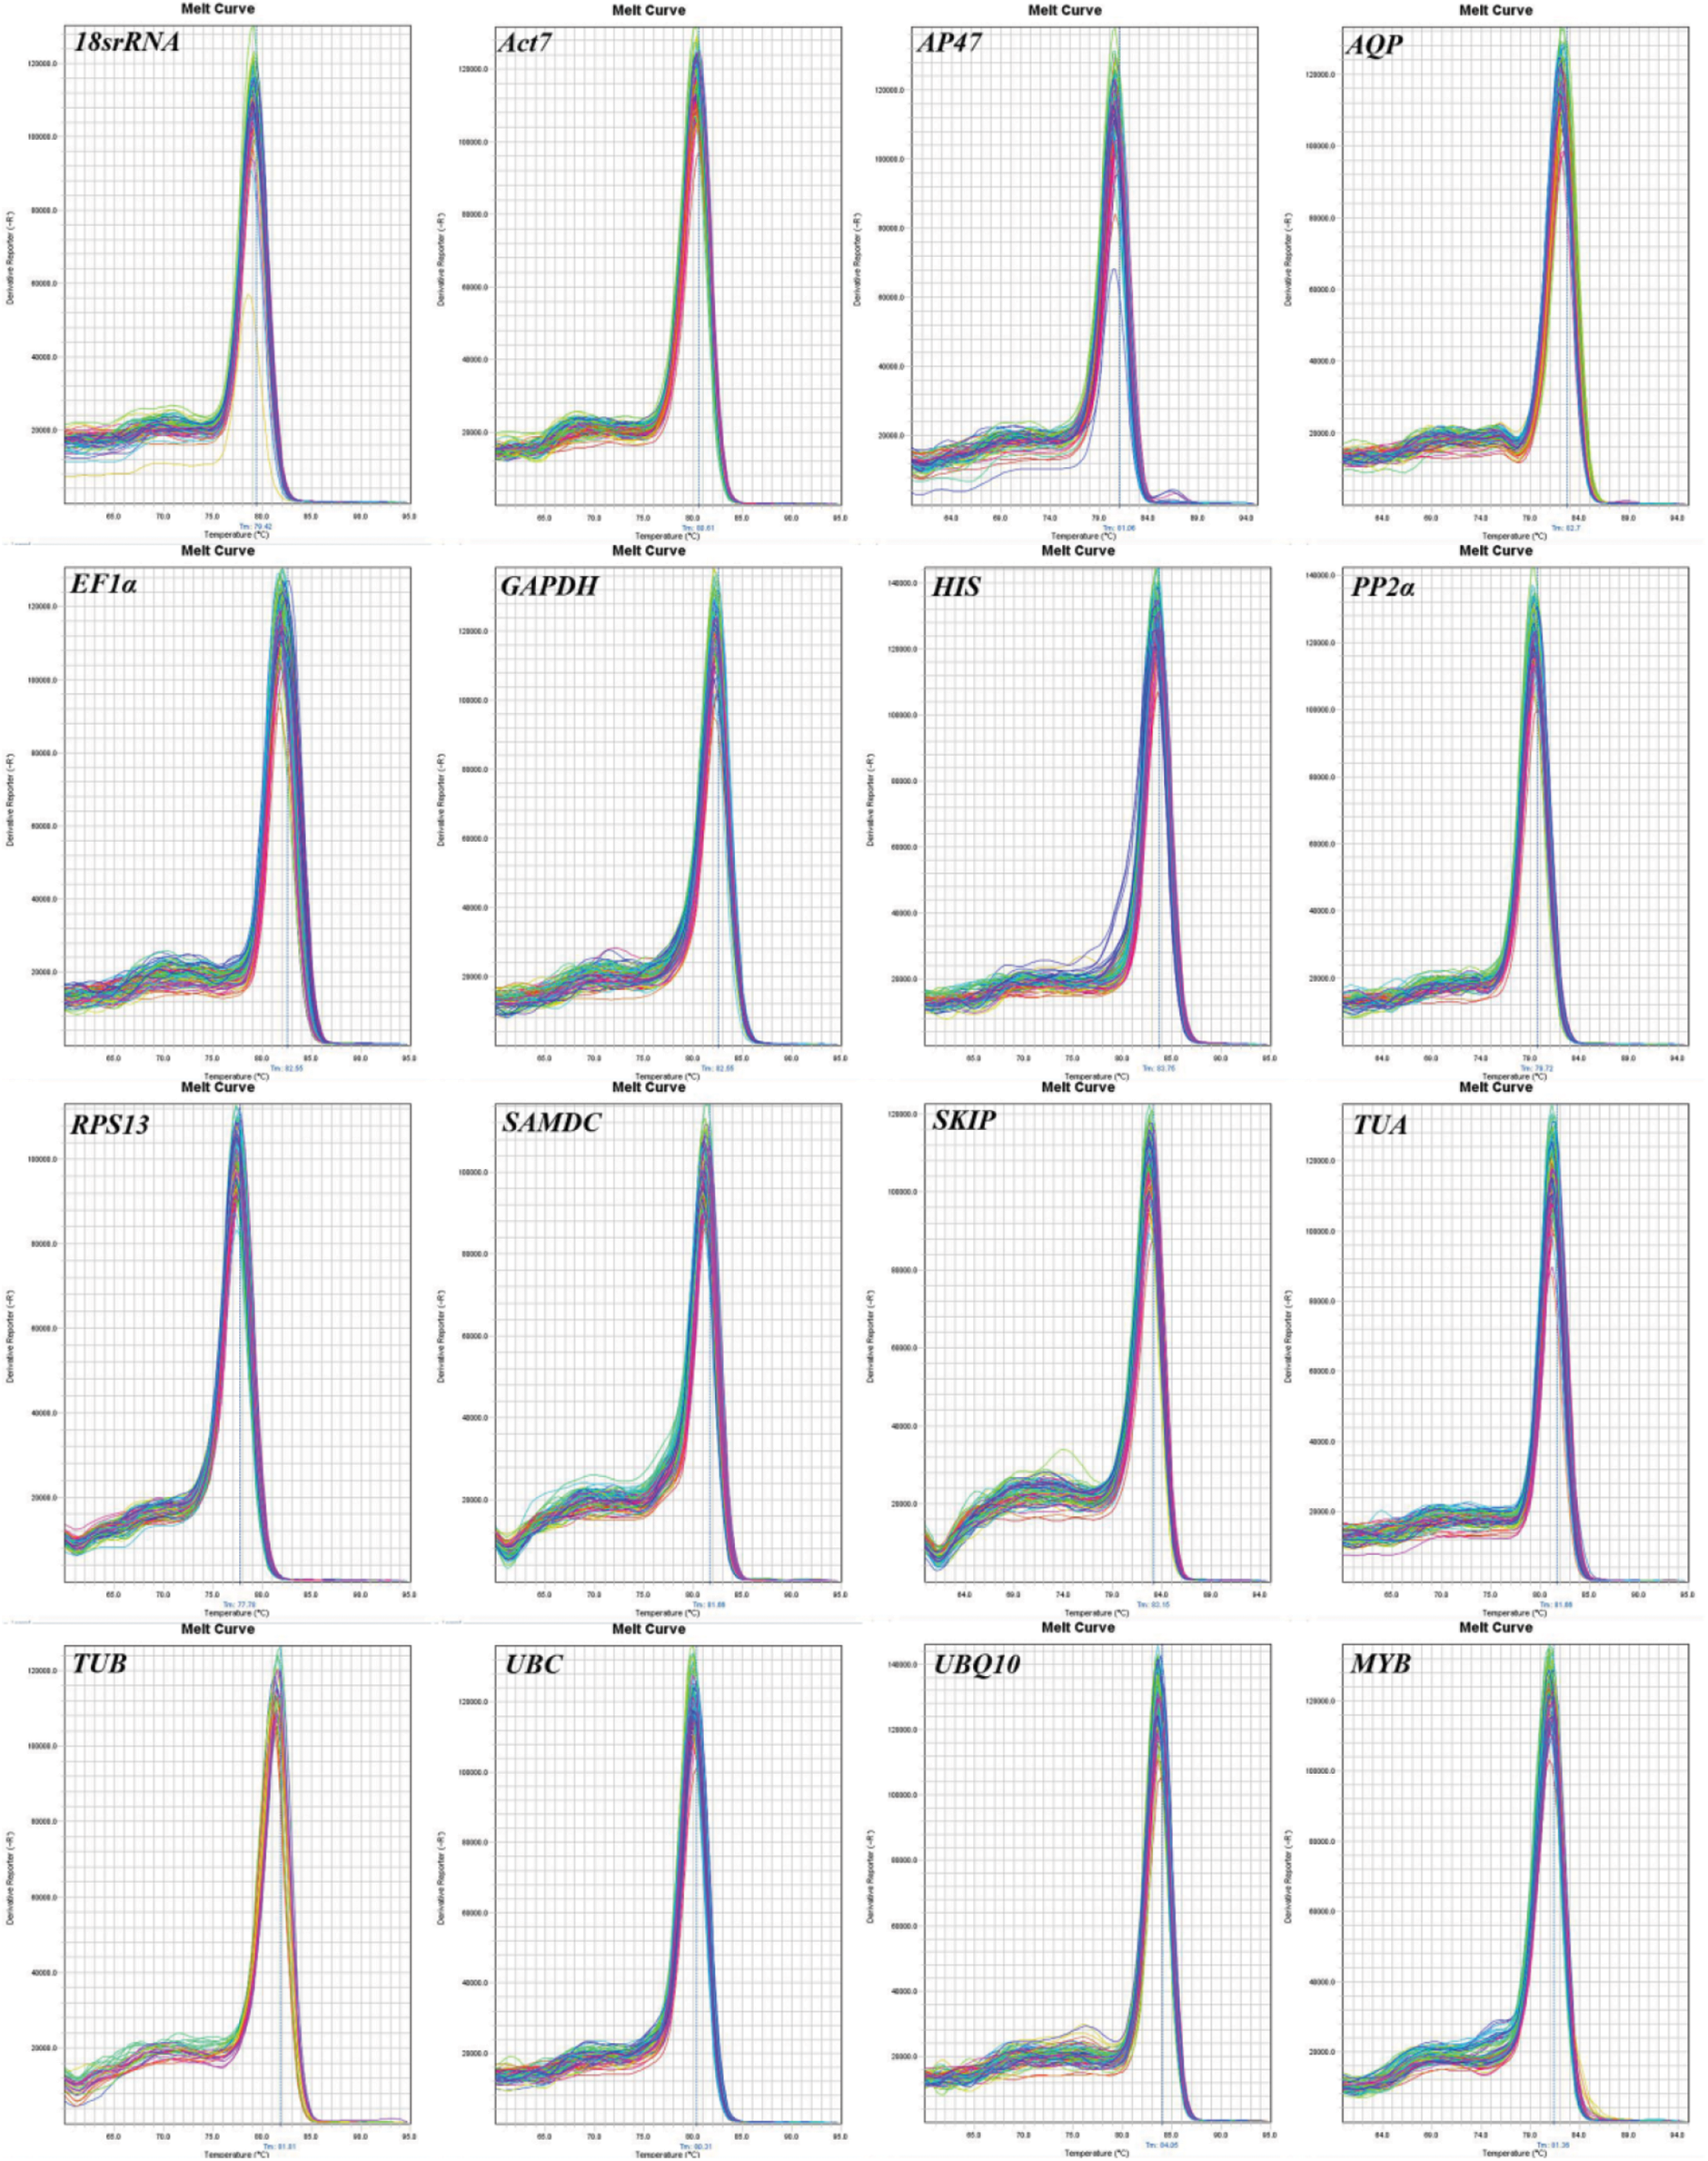
PCR products were verified by agarose gel electrophoresis and sequencing. DNA bands with the expected size in gel electrophoresis were isolated and sequencing (Appendix C). PCR amplification specificities were confirmed by melting curves. The presence of a single peak indicates that the expected amplicons were amplified (Appendix D). The correlation coefficient (R2) values ranged between 0.981 and 0.997, and PCR amplification efficiencies ranged between 1.79 and 1.90 (Appendix B).
3.2 Expression Profile of Candidate Reference Genes
To evaluate the stability of all candidate reference genes across all 192 experimental samples, the transcript abundance of the 15 reference genes was assessed based on the mean Ct values (Fig. 1). The mean Ct values for the 15 candidate reference genes ranged from 13 to 31. Among all candidate genes, 18s rRNA (Ct = 12.68 ± 3.82) had the highest expression level, whereas TUA (Ct = 30.81 ± 3.13) was the least expressed gene. SKIP (28.34 ± 1.75) was the most stable gene, while UBC (26.00 ± 4.42) was the most variable gene (Appendix E).
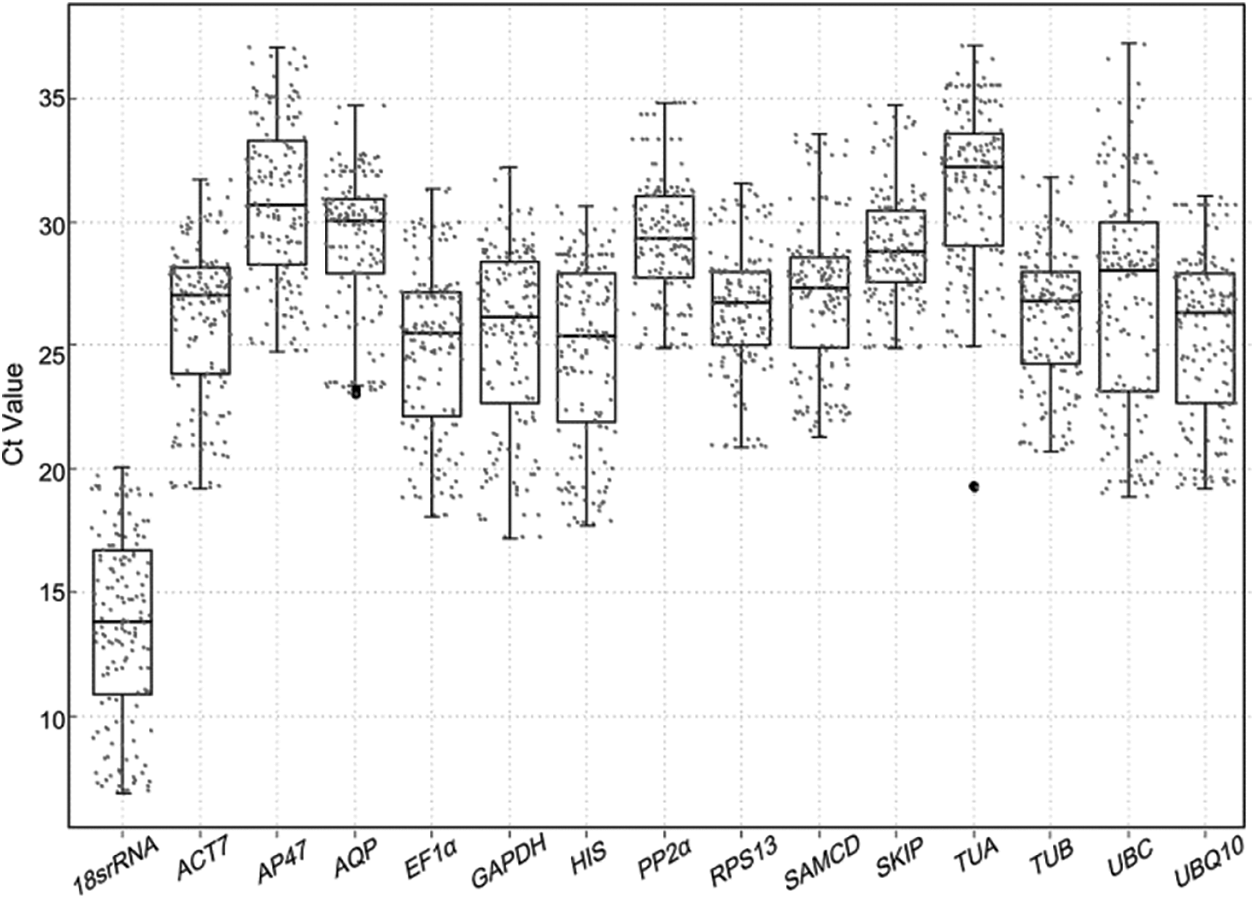
Figure 1: Box plots of the Ct values of 15 candidate genes in all 192 T. miquelina samples. Bold line across the box indicates the median; box indicates the 25th and 75th percentiles; whisker caps represent the maximum and minimum values; small dots represent all values in the test; and big dots represent outliers
According to the threshold of the M value recommended by the GeNorm program, a candidate gene could be used as a reference gene only when its M value is less than 1.5. As shown in Fig. 2 and Appendix F, a subset of genes showed expression instability with M values exceeding 1.5 (UBQ10, APQ, RPS13, AP47, TUA, SKIP, and TUB in tissue sets; UBC in leaves under drying stress; UBQ10, UBC, AP47, 18sRNA and AQP in all samples). The two most stable genes were HIS and PP2α (M = 0.87 in nine tissues [Tissue]), SAMCD and TUA (M = 0.20 under heat stress [HT]), EF1α and SAMCD (M = 0.20 under cold stress [CT]), PP2α and SKIP (M = 0.22 in leaves under waterlogged stress [WL]), ACT7 and EF1α (M = 0.35 in roots under waterlogged stress [WR]), ACT7 and EF1α (M = 0.38 in leaves under drying stress [DL]), EF1α and HIS (M = 0.18 in roots under drying stress [DR]), ACT7, and SAMCD (M = 0.08 in leaves under salt stress [SL] ), ACT7 and EF1α (M = 0.17 in roots under salt stress [SR]), and ACT7and EF1α (M = 0.74 in all samples [All]).
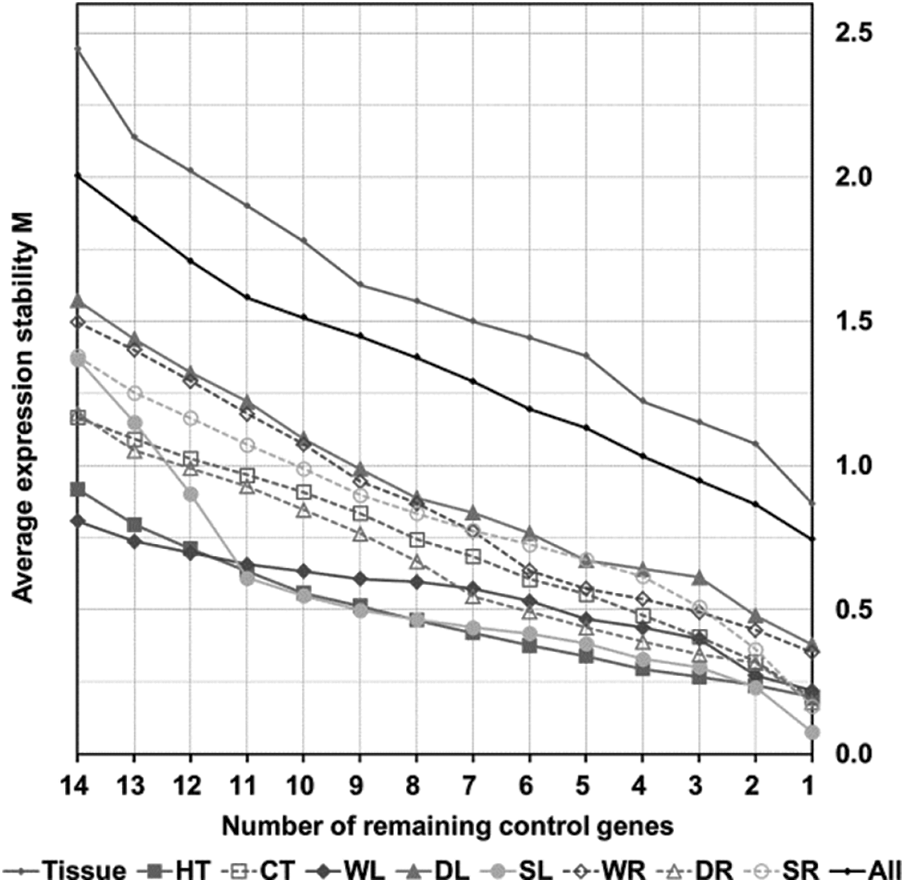
Figure 2: Average expression stability (M) of 15 candidate genes during stepwise exclusion of the least stable control gene in the different sample groups (grey small dots, Tissue; solid square, HT; hollow square, CT; solid diamond, WL; hollow diamond, WR; solid triangle, DL; hollow triangle, DR; solid circle, SL; hollow circle, SR; black small dots, All) using GeNorm analysis. The expression stability is increasing from No. 14 to No. 1. See Supplemental Table 2 for the ranking of genes according to their expression stability
To obtain the optimal number of reference genes in different sets, pairwise variation (Vn/Vn+1) was calculated using the GeNorm program (Fig. 3). Moreover, 0.15 was used as the threshold value to determine the optimal number of reference genes (n). Nevertheless, the threshold value of 0.15 should not be regarded as a rigorous standard, and higher cut-off values of Vn/Vn+1 were found in several reports [30–32]. In tissue sets, all pairwise variations exceeded 0.15, and the minor variation was V9/V10 (0.152), which demonstrated that the top nine genes were required to normalize gene expression data. For stress samples (HT, CT, WL, WR, DR, and SL), pairwise variation values of V2/V3 were lower than 0.15, which suggested that the combined use of the top two genes would be effective for normalizing target gene expression analysis. The V4/V5 values (0.120 and 0.141) were lower than 0.15 in DL and SR, which indicated that the top four genes were required for normalization. When all samples were considered together, the V9/10 value (0.147) was lower than 0.15, thereby illustrating the need for the top nine genes.
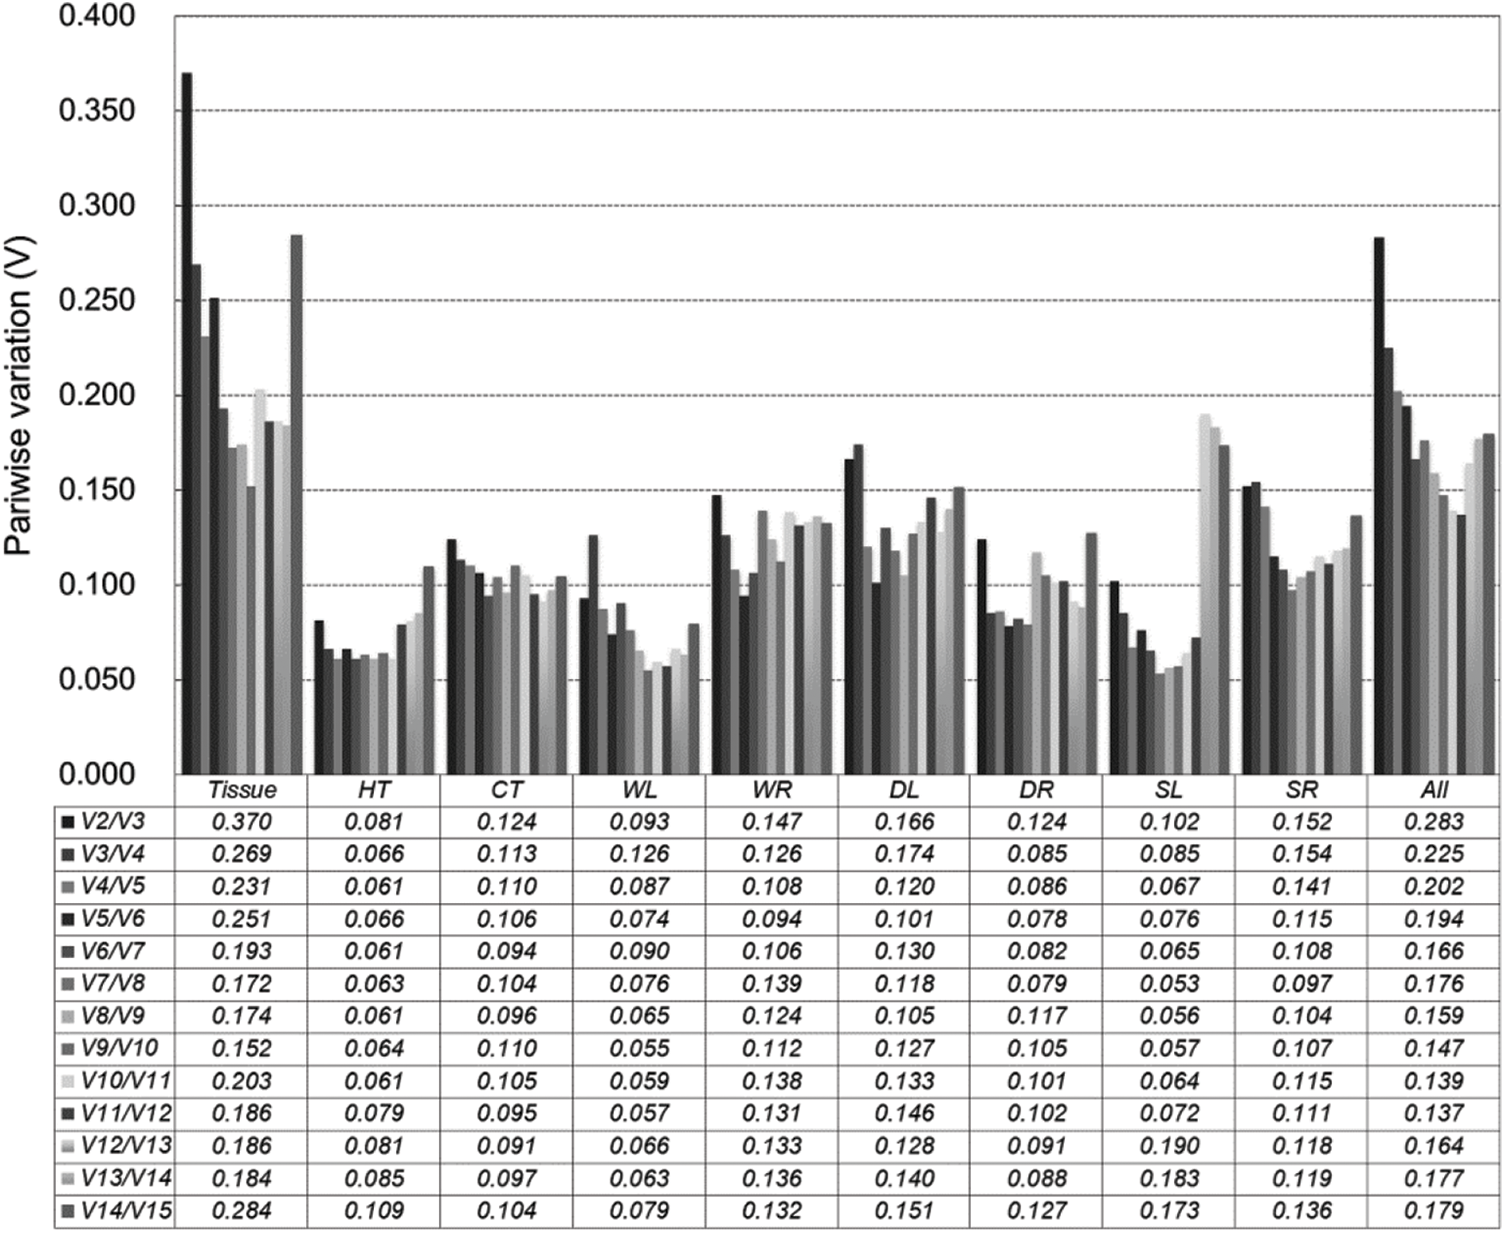
Figure 3: Optimal number of reference genes for accurate normalization calculated by GeNorm during different tissue treatments. Pairwise variation (Vn/Vn+1) analysis of 15 candidate reference genes analyzed in 10 sample sunsets (Tissue, HT, CT, WL, WR, DL, DR, SL, SR, and All)
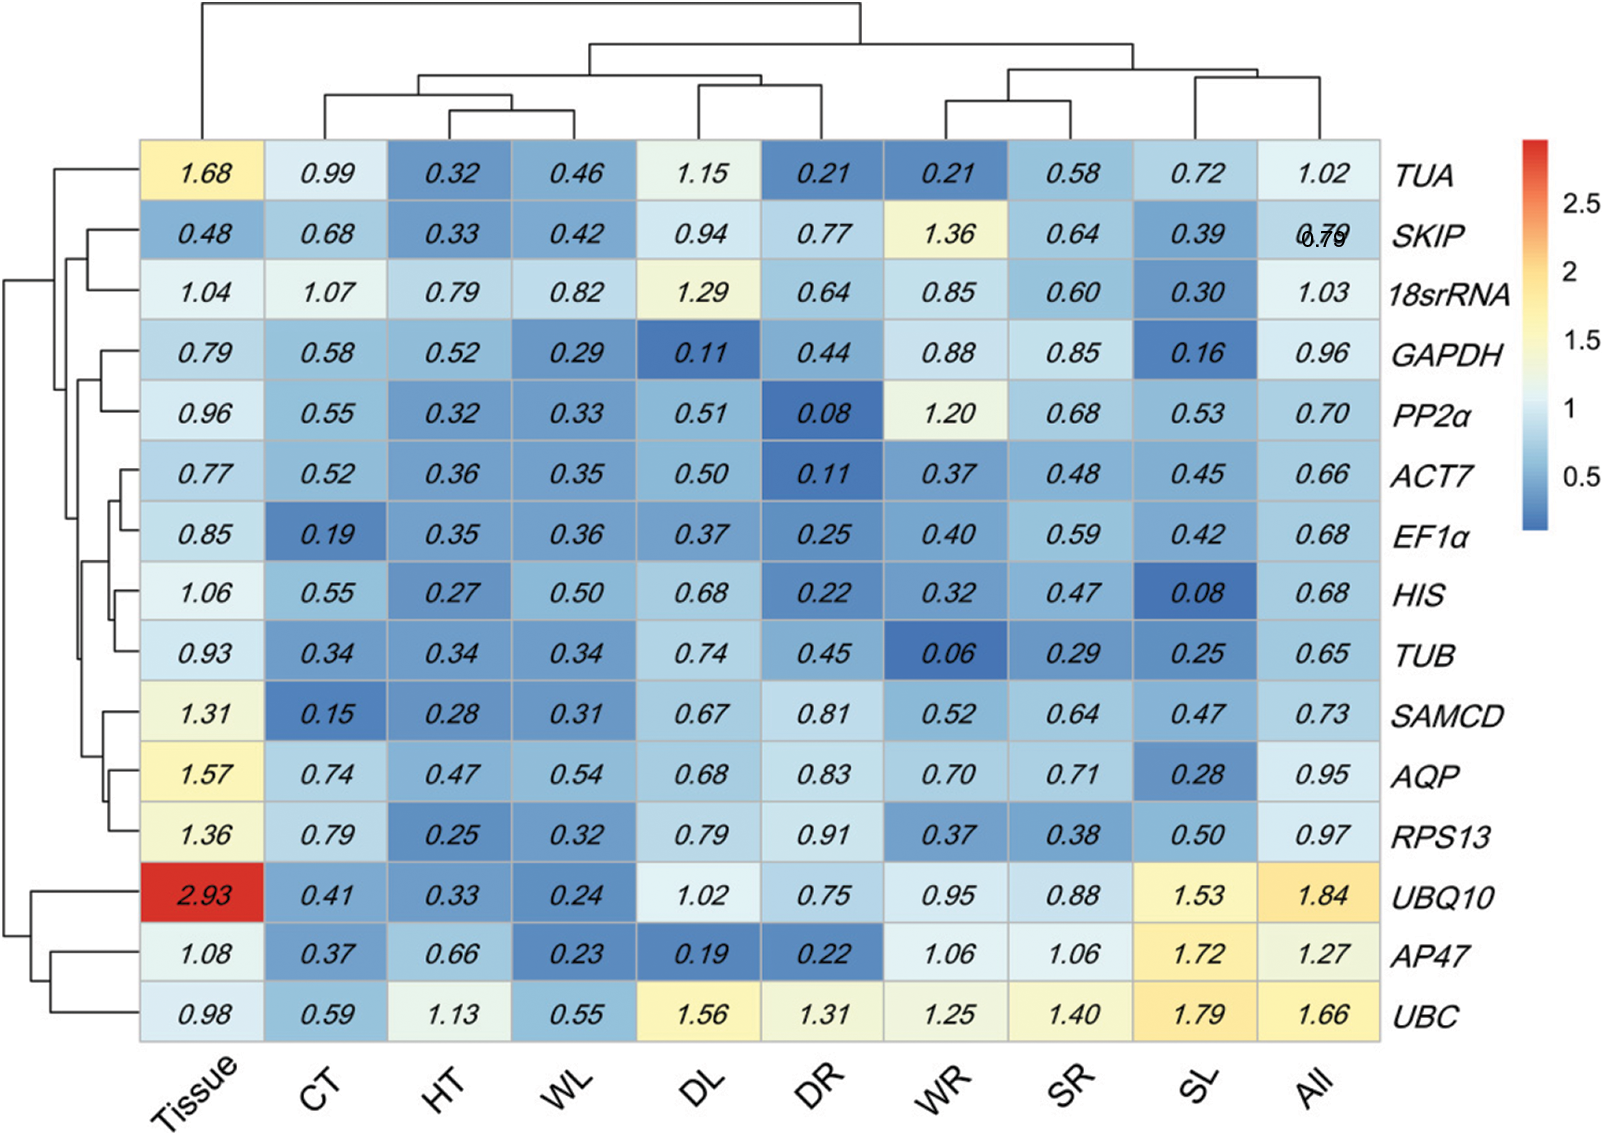
Normfinder calculated reference gene stability according to intra-and inter-group variations among all candidate genes (Appendix G). The more stable genes had the lower expression stability values. Accordingly, SKIP (0.48 Tissue), SAMCD (0.15 HT and 0.15 CT), AP47 (0.27 WL), TUB (0.06 WR and 0.25 SR), GAPDH (0.11 DL), PP2α (0.08 DR), HIS (0.08 SL), and ACT7 (0.06 All) had the highest expression stability, which showed large differences with the best genes assessed by GeNorm (Table 1).
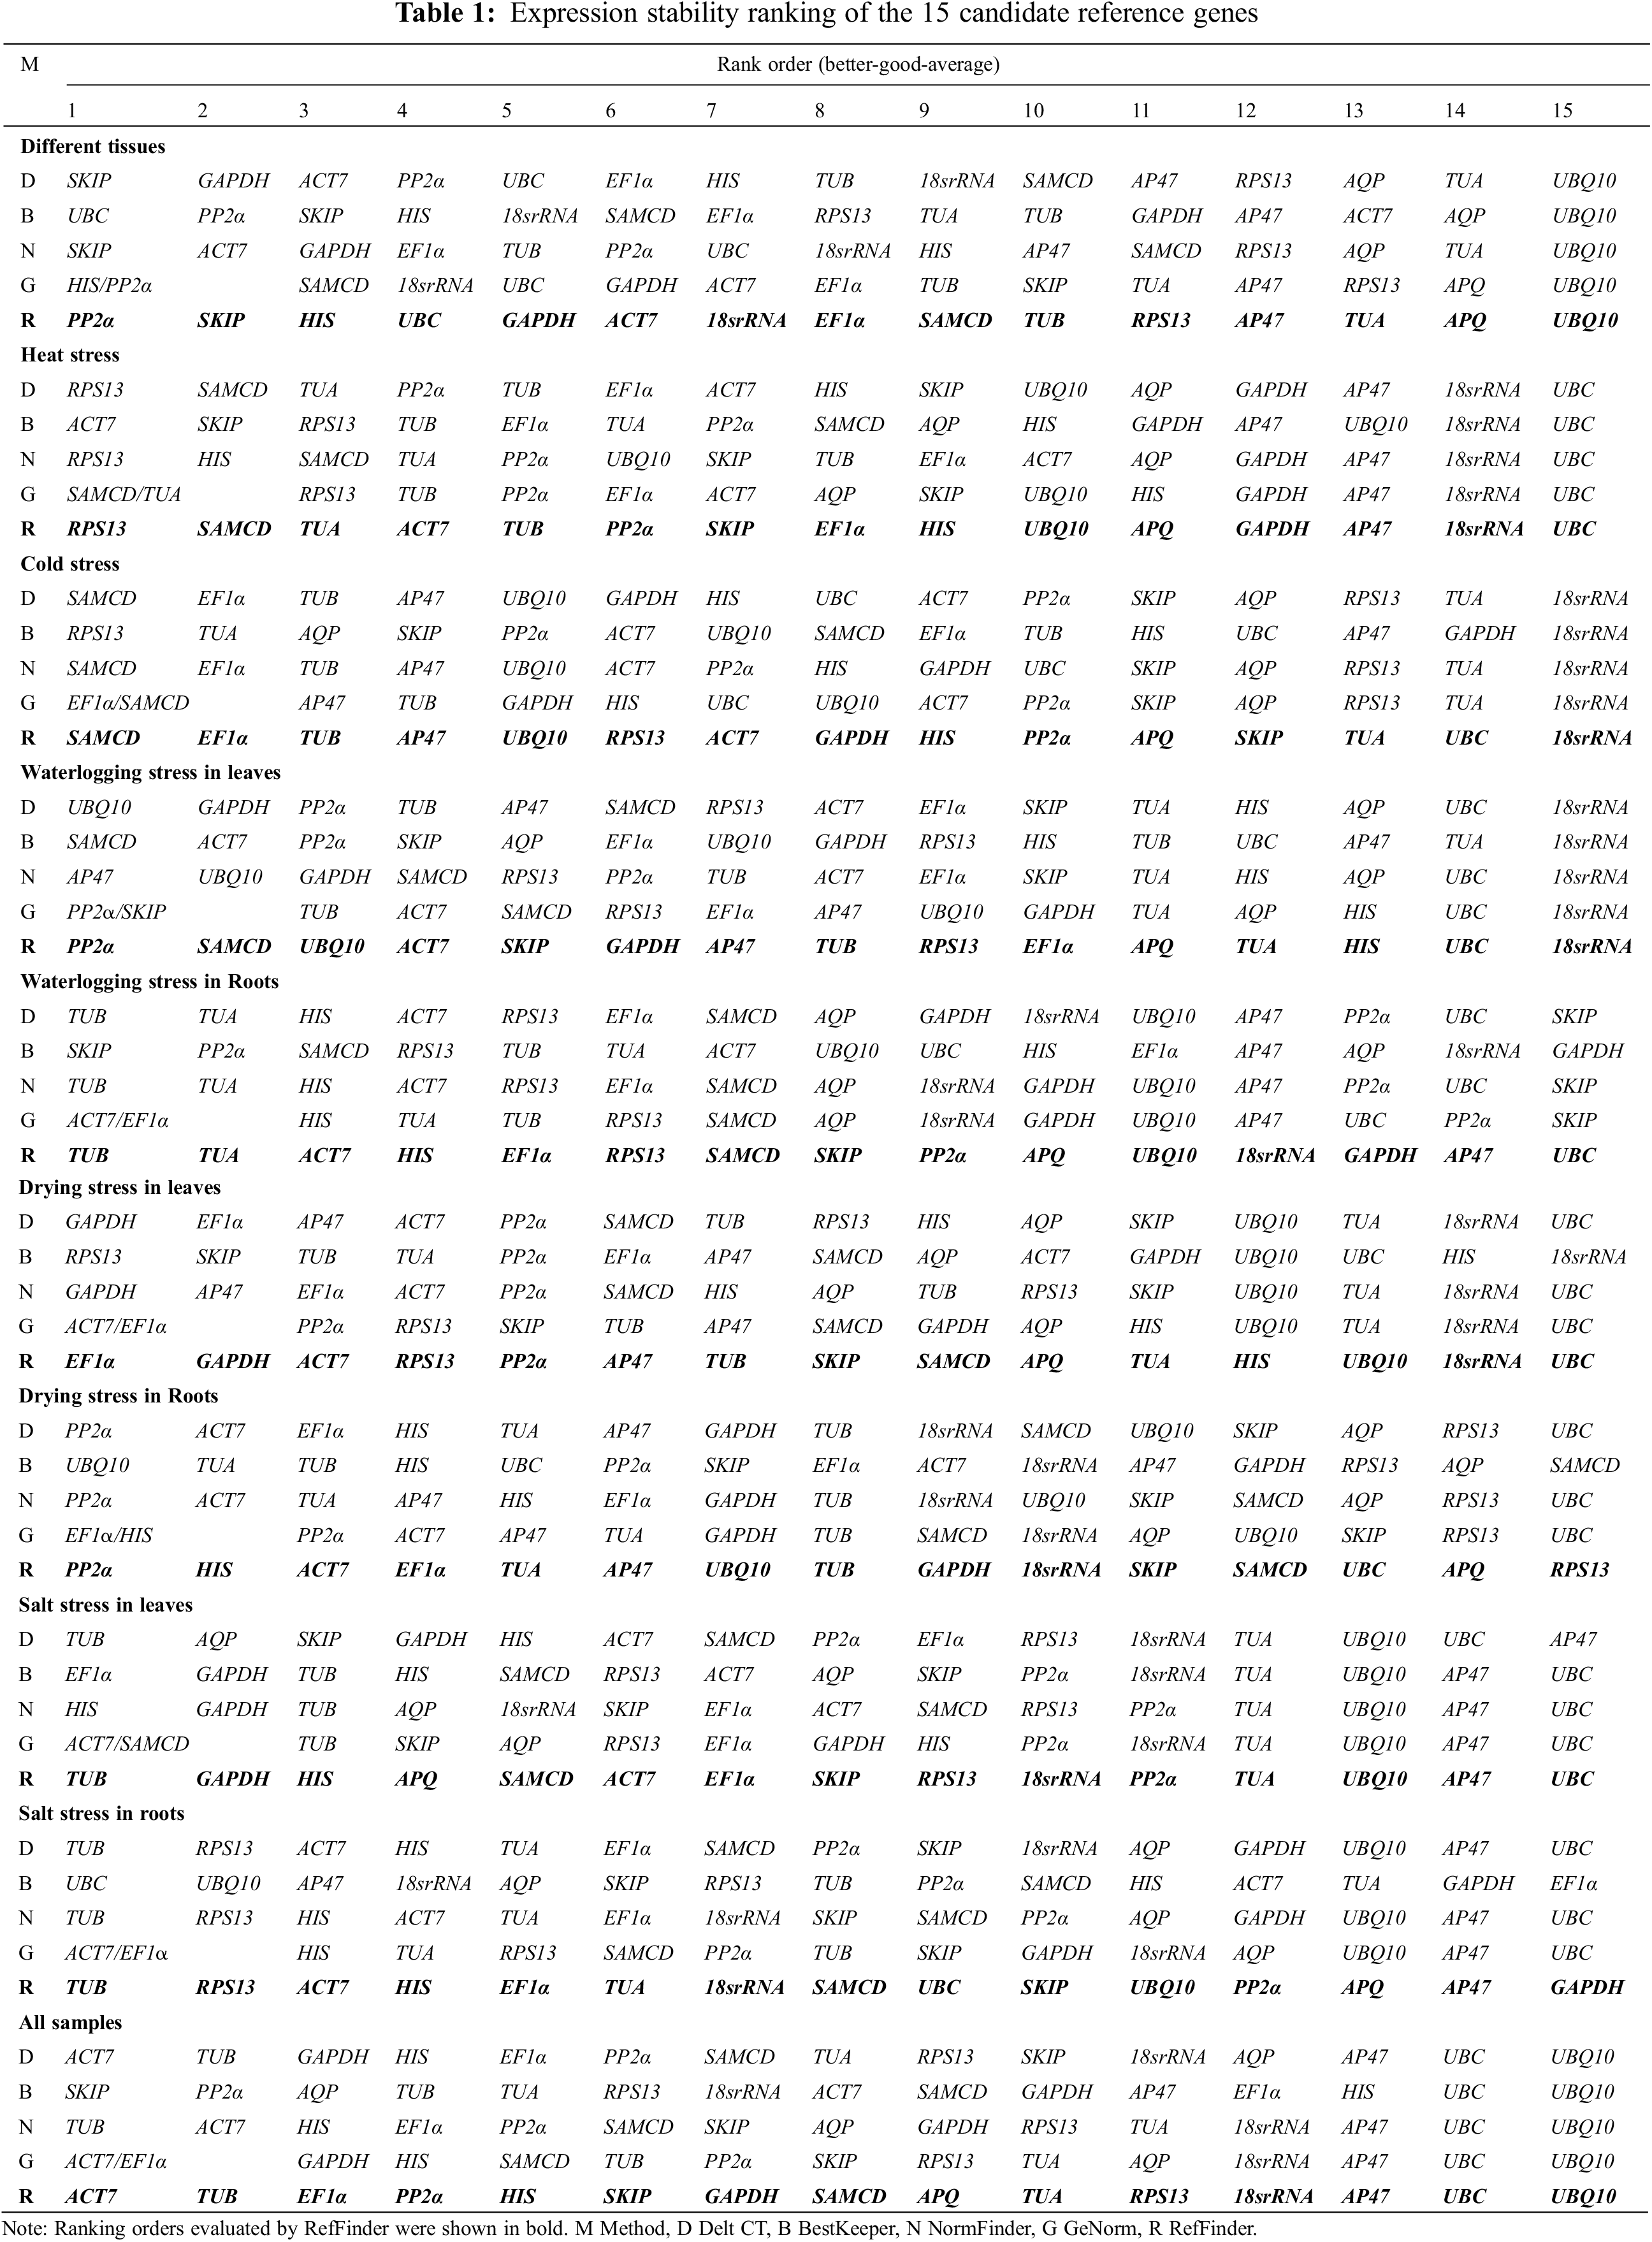
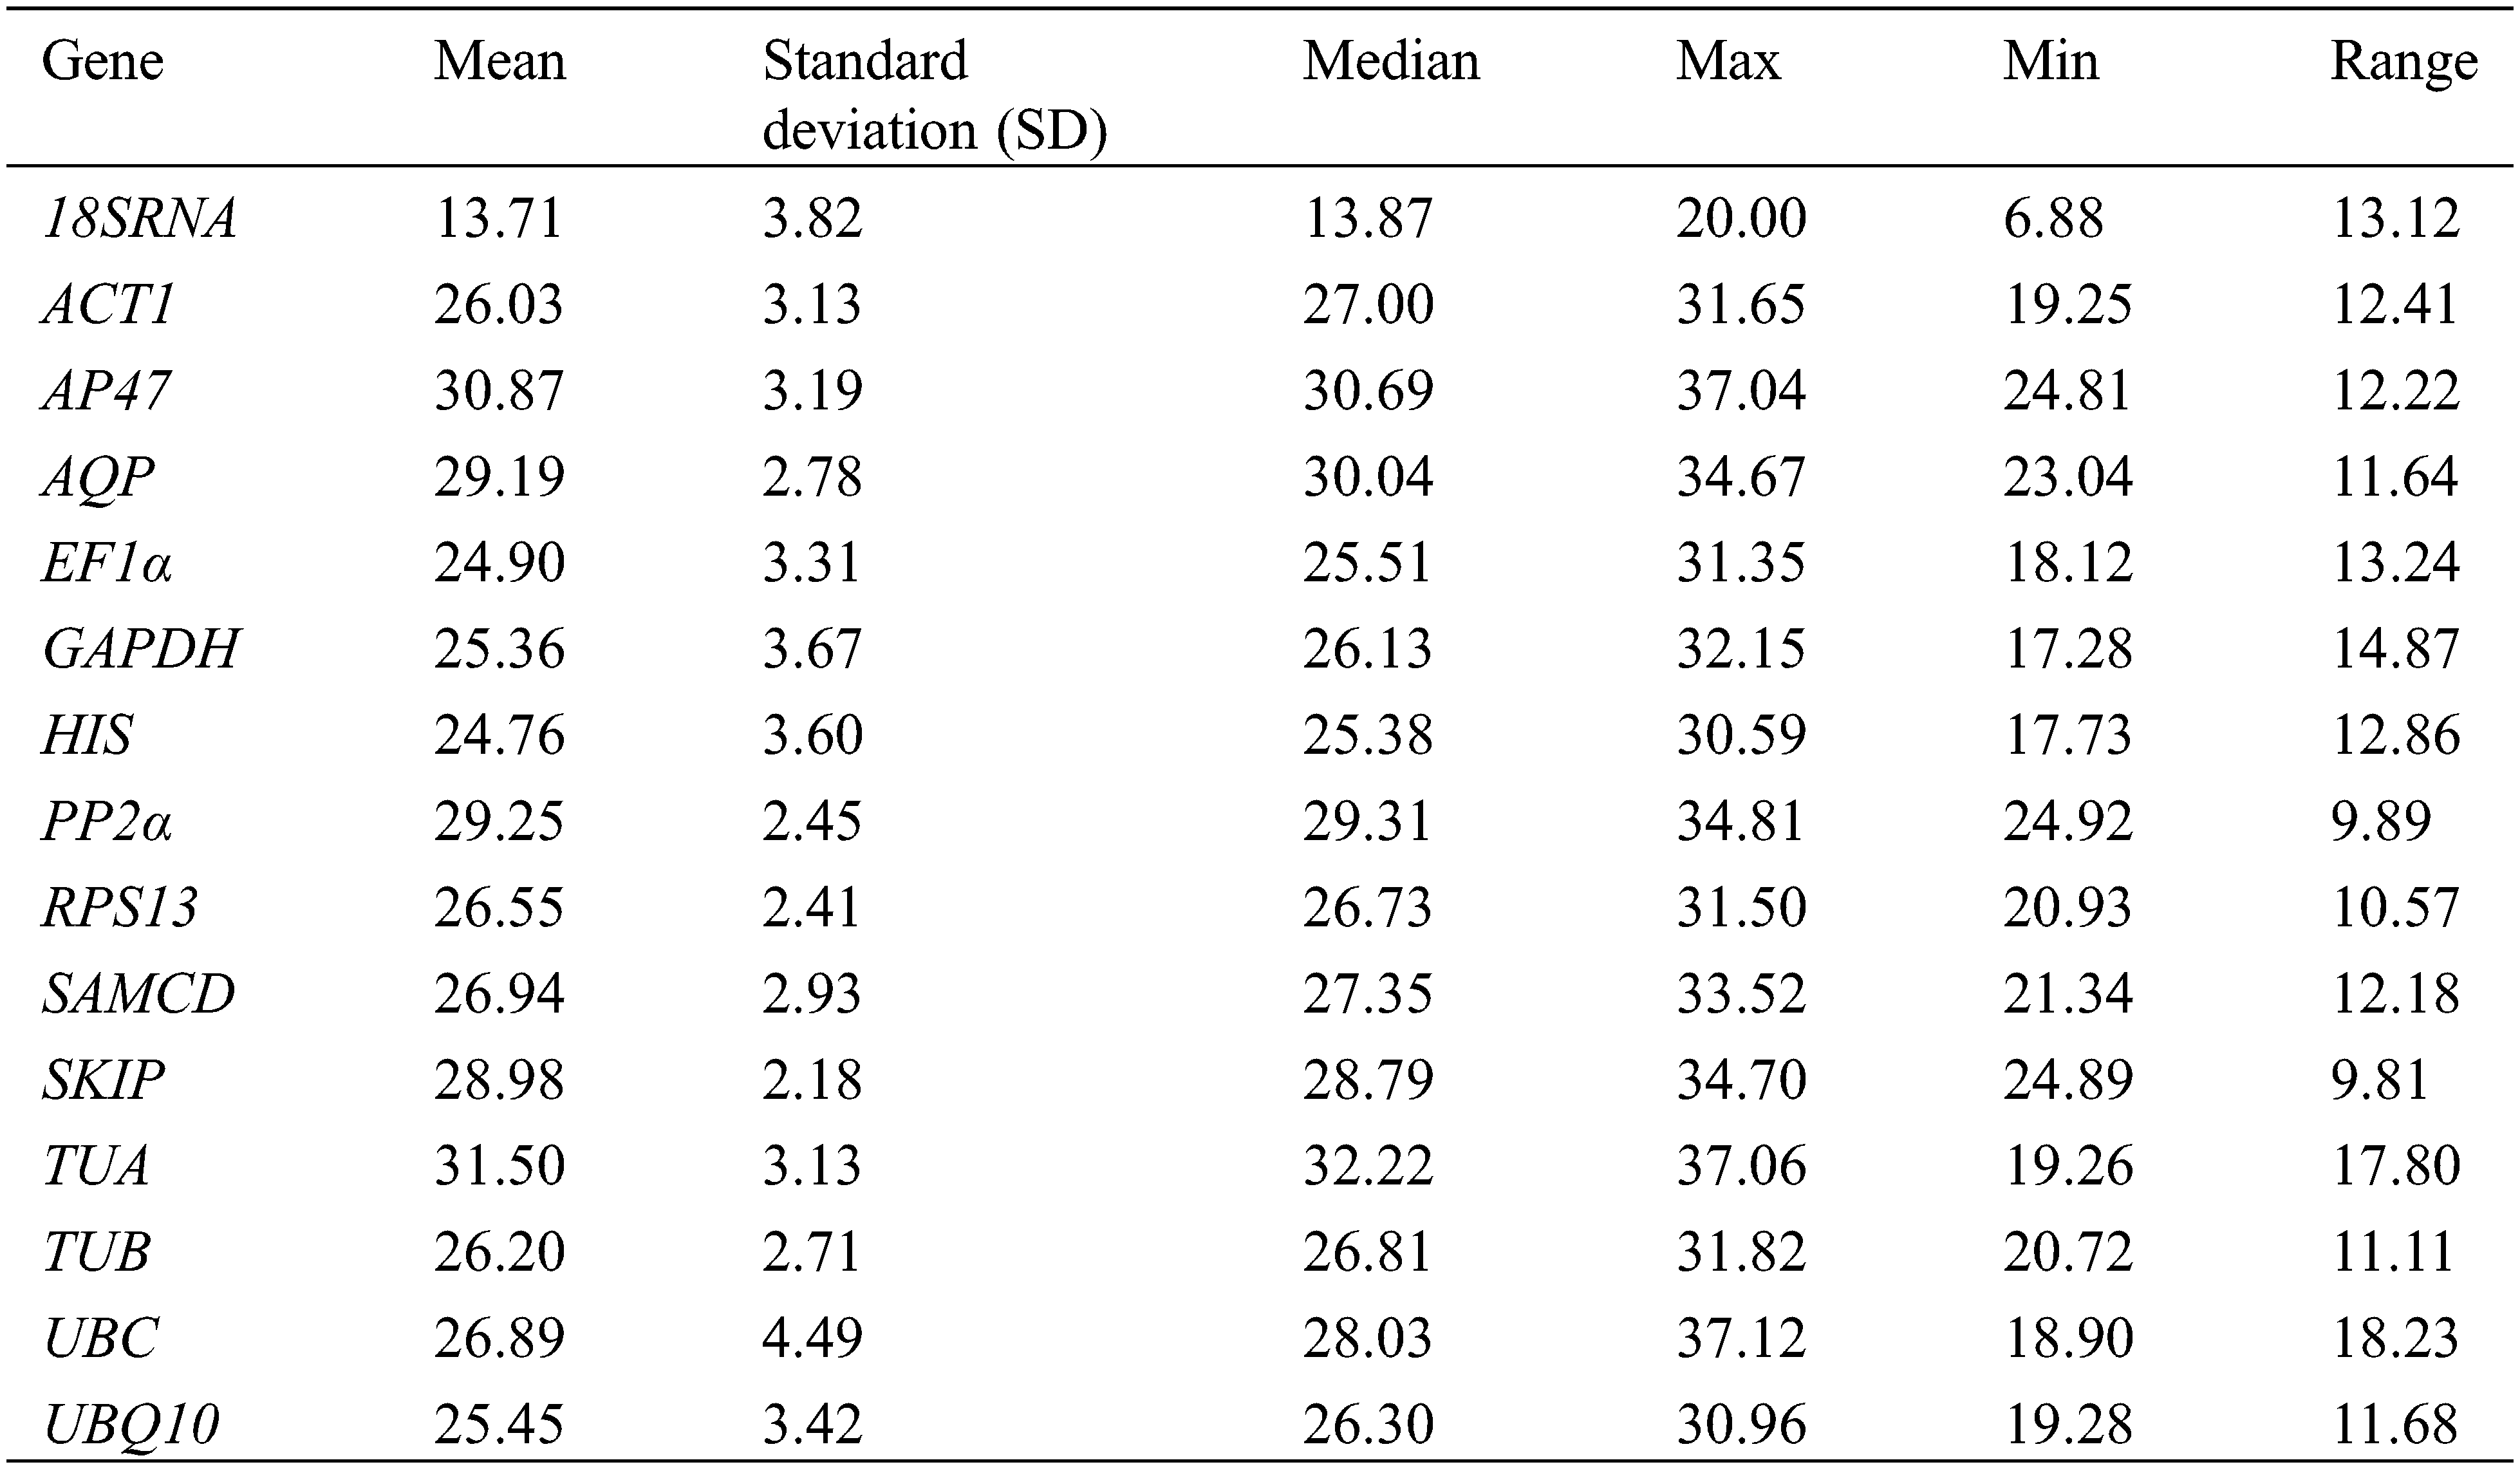
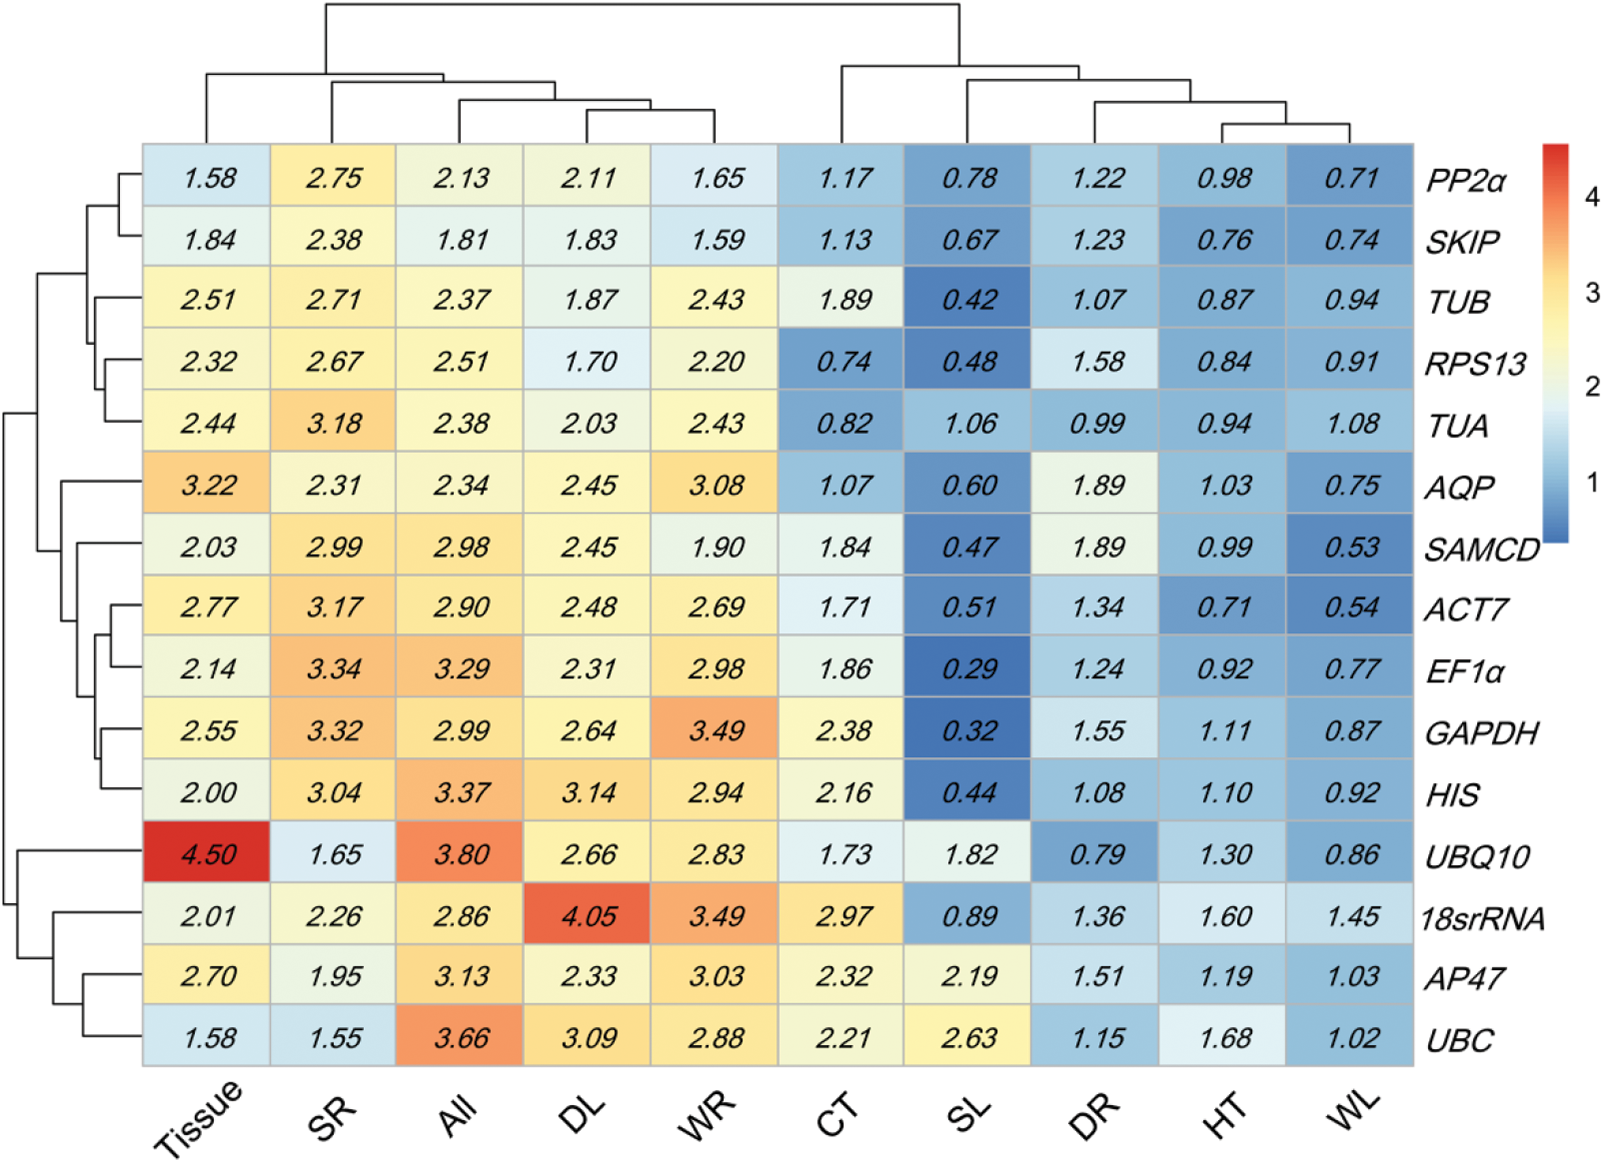
BestKeeper analyzed reference gene stability using the values of standard deviation (SD), the coefficient of variation (CV), and correlation coefficient (r). The lower SD value of genes showed higher expression stability (Appendix H). Hence, UBC (1.58 Tissue and 1.55 SR), ACT7 (0.71 HT), RPS13 (0.74 CT and 1.70 DL), SAMCD (0.53 WL), SKIP (1.59 WR), UBQ10 (0.79 DR) and EF1α (0.29 SL) exhibited the optimal expression stability, which was completely different from that of the first stable genes according to GeNorm and NormFinder results (Table 1). When the SD threshold was set at 1 [24], suitable reference genes could not be obtained in Tissue, SR, DL and WR.
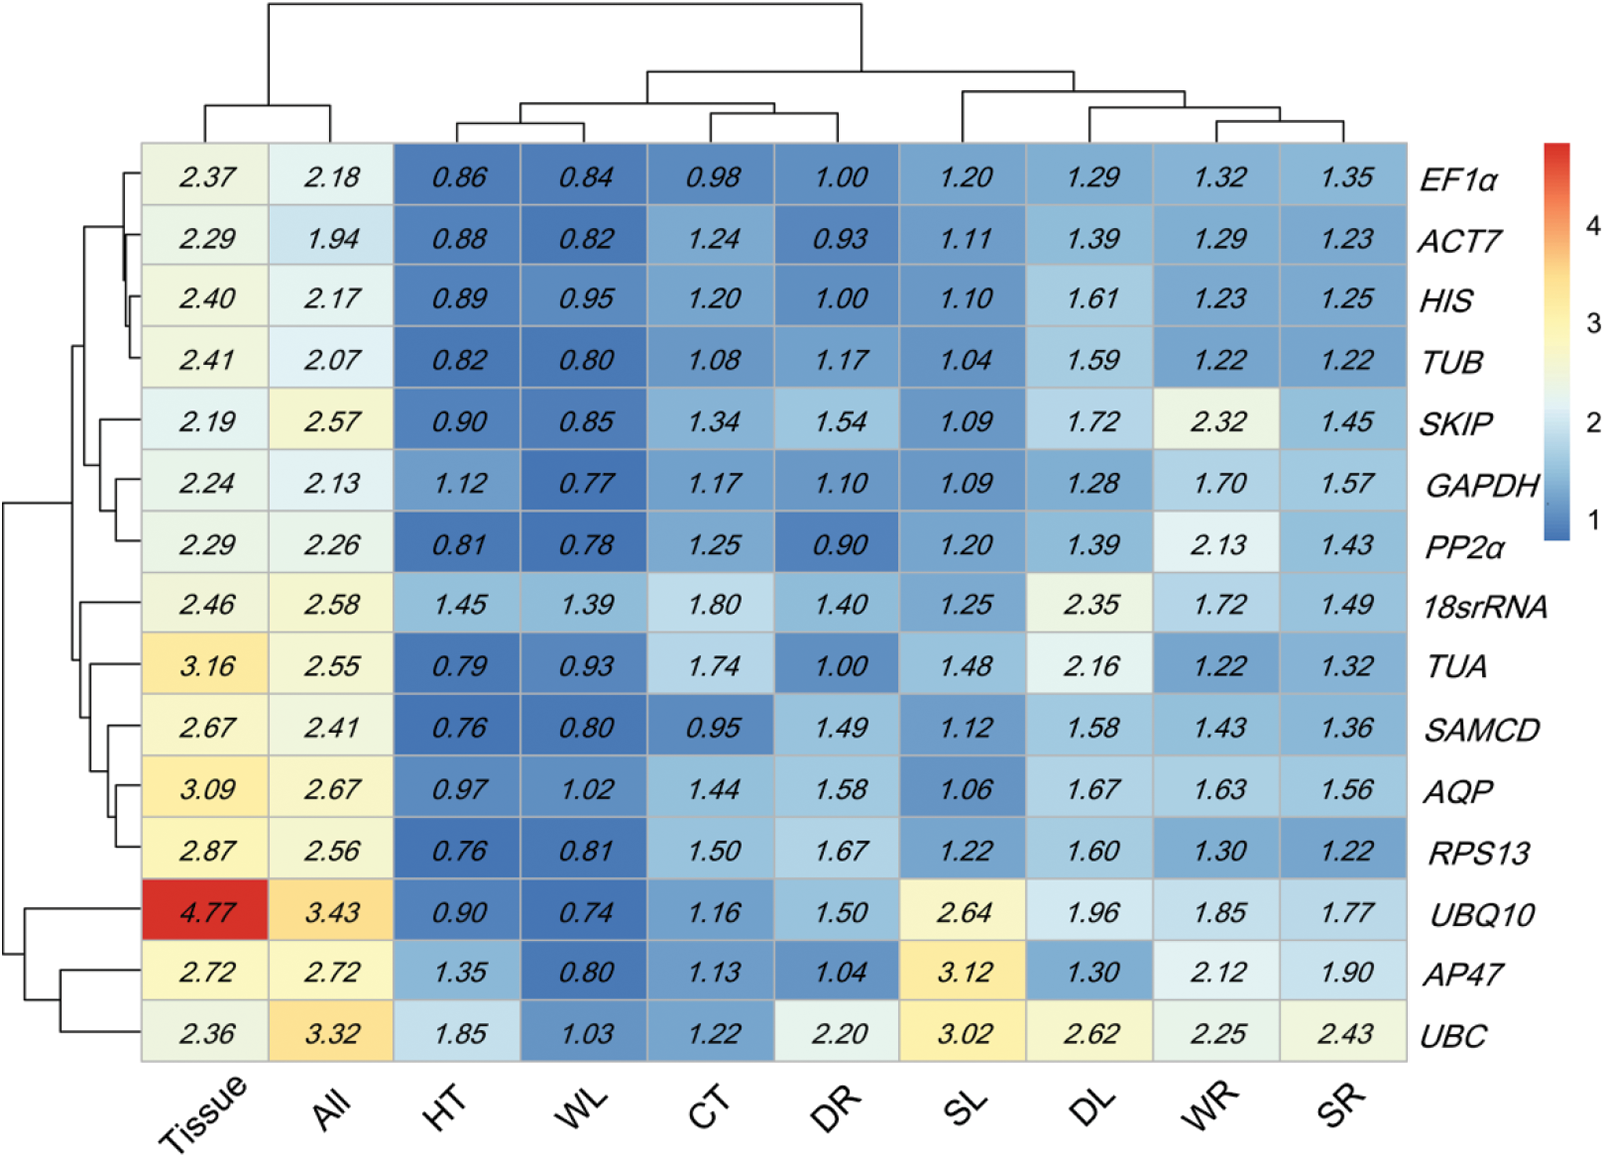
The values of standard deviation (SD) were used to evaluate the expression stability of candidate genes by Delta Ct. The gene with the lowest SD value indicated the highest stable reference gene (Appendix I). Accordingly, SKIP (2.19 Tissue), RPS13 (0.76 HT), SAMCD (0.95 CT), UBQ10 (0.74 WL), TUB (1.22 WR, 1.04 SL, and 1.22 SR), GAPDH (1.28 DL), PP2α (0.90 DR), and ACT7 (1.94 All) showed the highest expression stability, which was similar to that of the top stable genes calculated using NornFinder (Table 1).
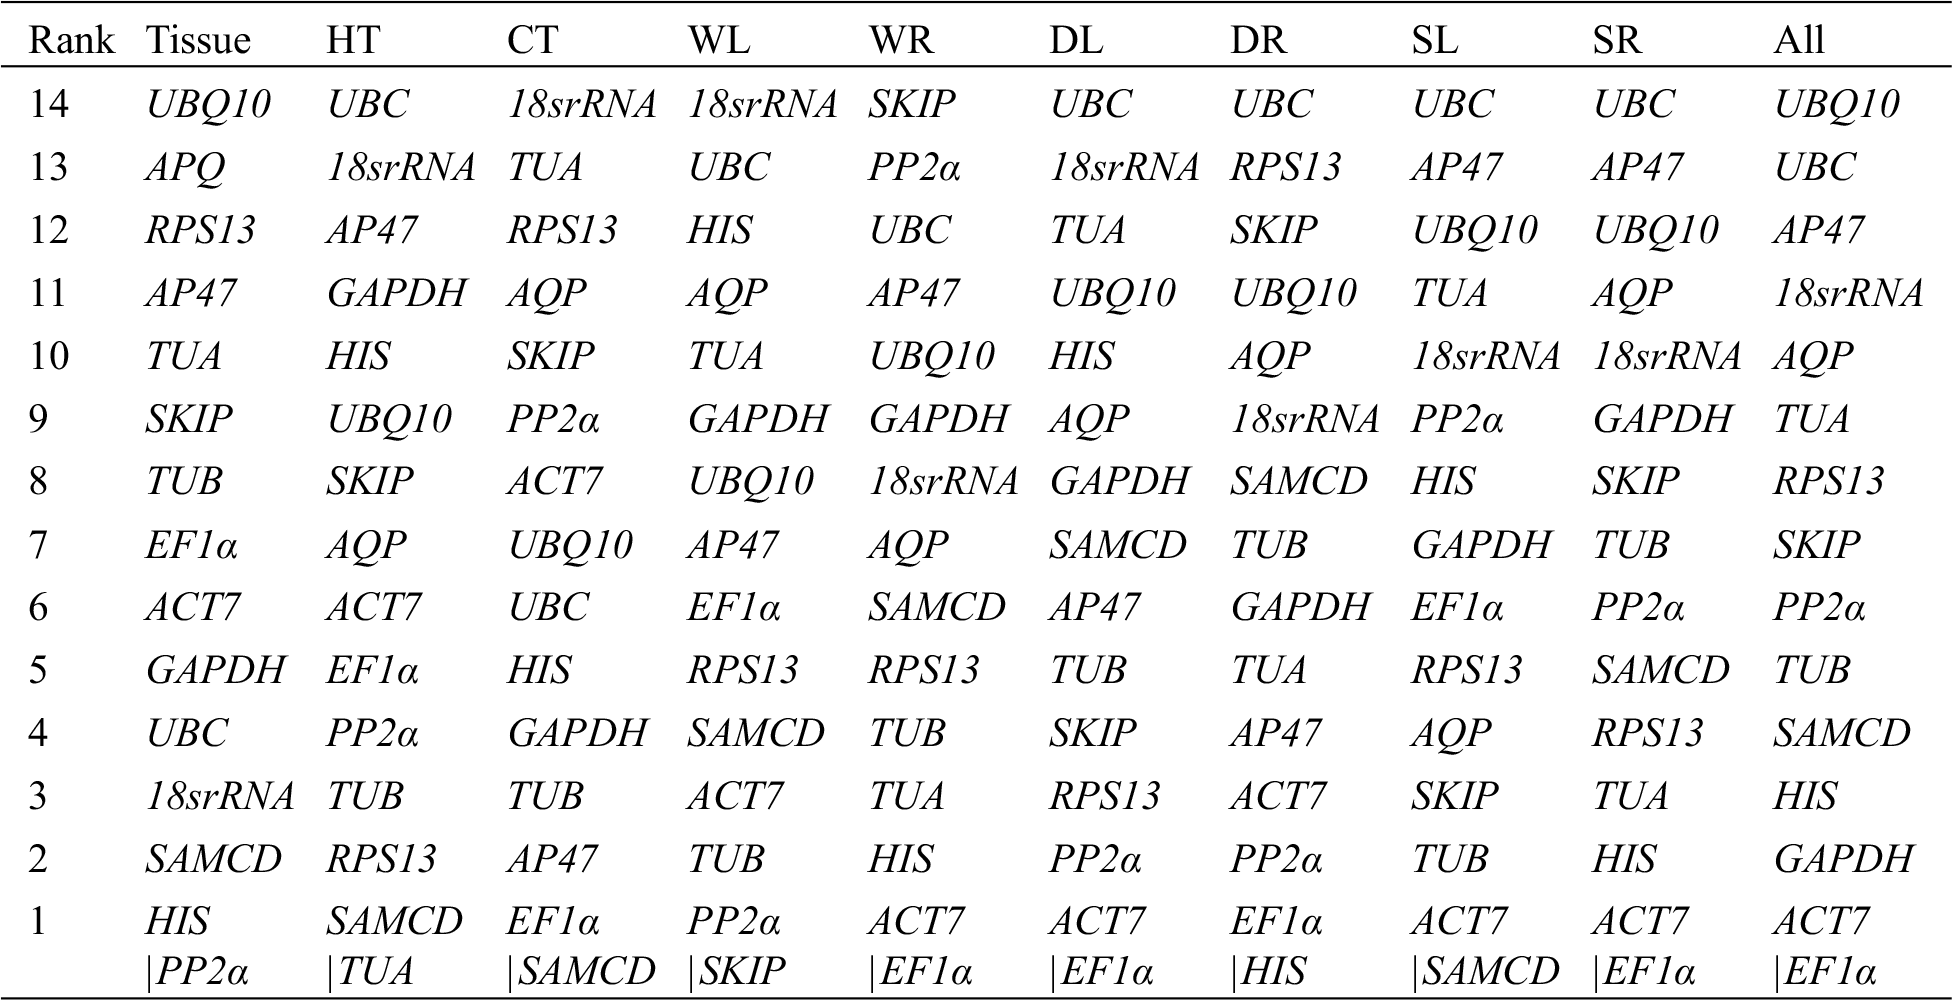
As shown in Table 1, the most stable reference genes according to the four aforementioned algorithms were different in all experimental sets. RefFinder, a comprehensive analysis tool for expression stability of reference genes, was used to calculate the synthetic ranking of 15 potential reference genes. The top two most stable genes were identified under different experimental conditions, including tissue (PP2α and SKIP), HT (RPS13 and SAMCD), CT (SAMCD and EF1α), WL (PP2α and SAMCD), WR (TUB and TUA), DL (EF1α and GAPDH), DR (PP2α and HIS), SL (TUB and GAPDH), SR (TUB and RPS13), and All (ACT7 and TUB). The least stable genes in various samples calculated using the four aforementioned algorithms were basically the same, except for the WR, DL, DR, SL, and SR samples, where two of the least stable genes were obtained.
3.8 Validation of the Stability of Reference Genes
To detect the expression stability of the reference genes, we selected the two most stable reference genes and one unstable gene to analyze the expression patterns of the MYB transcription factor gene (TmMYB) under different tissues and experimental conditions (Fig. 4).
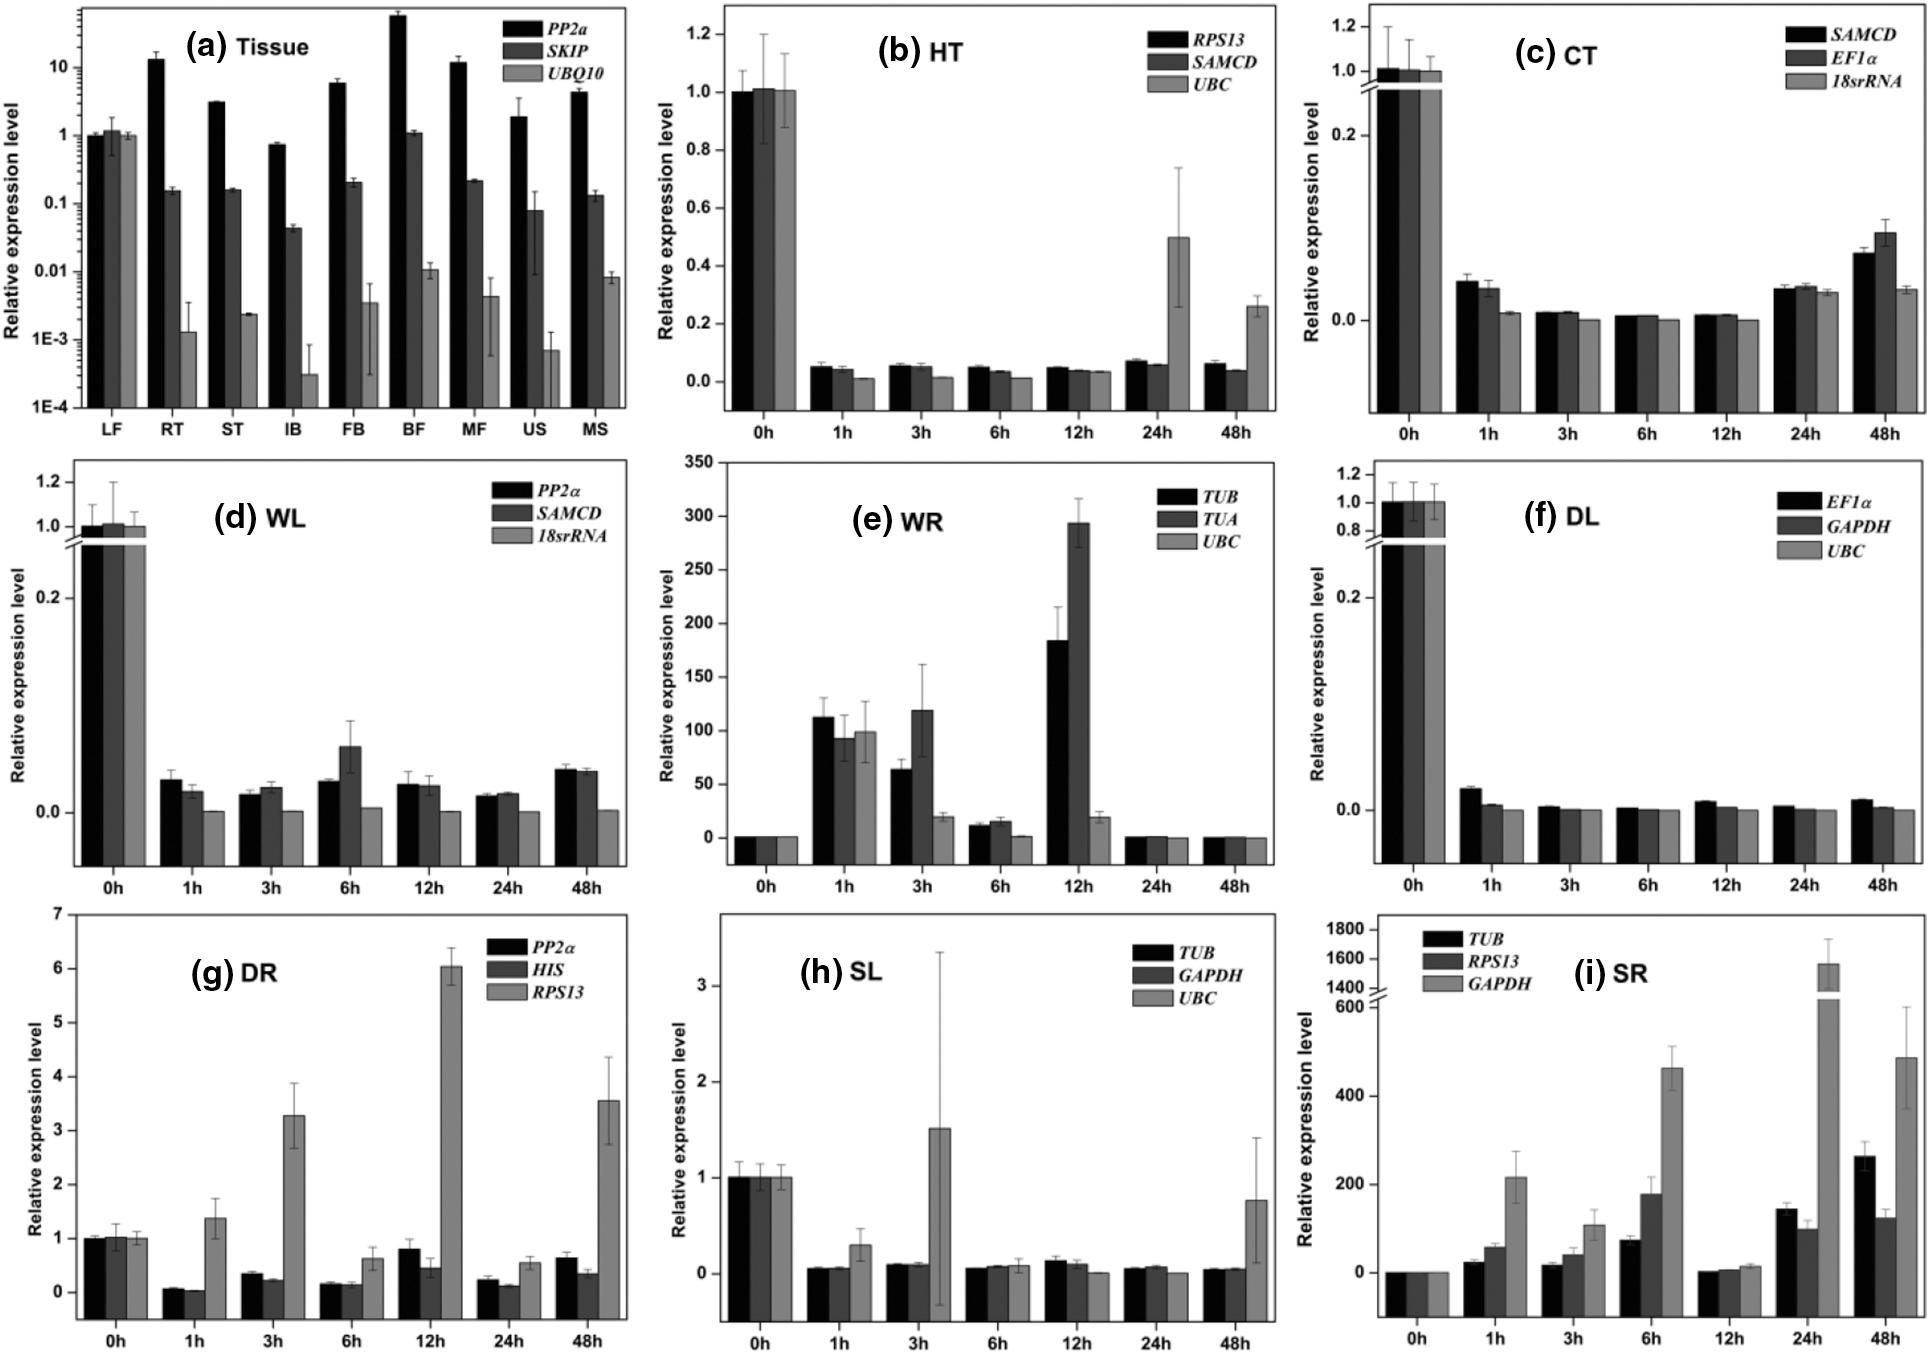
Figure 4: Relative expression levels of TmMYB in different experimental sets. In (a) Tissue set, nine tissues including LF, RT, ST, IB, FB, BF, MF, US, and MS. (b) HT, (c) CT, (d) WT, (e) WR, (f) DL, (g) DR, (h) SL, and (i) SR
In tissue, TmMYB showed different expression profiles as calculated by the three references. The relative expression values of TmMYB normalized with PP2α were higher than those normalized with SKIP and UBQ. Compared with the leaf tissue, TmMYB was upregulated in all samples except in inflorescence bract tissue, with high values of 58, 13, and 11 in BF, RT, and MF normalized with PP2α. However, TmMYB expression levels normalized with SKIP in BF were consistent in LT, whereas values were downregulated in other tissues, with the lowest value (0.043) in IB. The relative expression patterns of TmMYB normalized with UBQ10 in all samples were significantly lower than those in LT, and the lowest value was exhibited in the US (0.001).
As for stress samples, the relative expression values of TmMYB were reduced to extremely low levels in HT, CT, WL, DL, and SL. In general, compared with the reduction ranges of TmMYB calculated by two stable reference genes, the decline ranges normalized with the unstable genes were overvalued, and abnormally upregulated expressions were found in HT at 24 and 48 h and in SL at 3 and 48 h. Generally, the expression pattern values of TmMYB in WR increased in the first 12 h and then decreased in the subsequent time period. The expression trend of TmMYB peaked at 1 h or 3 h and at 12 h normalized by stable reference genes (TUB and TUA), whereas the levels of TmMYB were severely underestimated when analyzed using the unstable reference genes (UBC). Meanwhile, the expression patterns of TmMYB in DR generated by two stable reference genes (PP2α and HIS) were downregulated, but the expression level of TmMYB showed abnormal trends, which was upregulated when an unstable reference gene (RPS13) was selected for normalization. In general, the expression levels of TmMYB in SR were increased and revealed two peak values within 48 h. Nevertheless, the expression level of TmMYB calculated by the two optimal genes (TUB and RPS13) peaked at 6 and 48 h, whereas the maximum expression adjusted by the worst genes (GAPDH) occurred at 6 and 24 h with abnormally high values.
Numerous studies have suggested that none of the reference genes maintain consistent expression stability under various experimental conditions. Hence, it is important to screen suitable reference genes to accurately quantify the expression levels of target genes using qRT-PCR. There have been no relevant studies on the reference gene selection for T. miqueliana. Therefore, the expression stabilities of 15 candidate reference genes for T. miqueliana were evaluated in different tissues and in response to abiotic stresses. In the tissue sets, the PP2α gene was ranked first, but ranked sixth and tenth in leaf tissue under heat and cold stress, respectively. The same candidate genes have been observed to have different stabilities under different conditions [6–16]. Even under the same conditions, the most stable genes varied in diverse tissues. Under waterlogging stress, for instance, PP2α was ranked first in leaf tissue, whereas TUB was the most stable gene in root tissue. Similar results were observed for the drying and salt stresses. The results verified the need to select suitable reference genes according to the specific test conditions.
In this study, four algorithms were used to evaluate the stability of 15 candidate reference genes. In GeNorm and BestKeeper, threshold values of M (1.5) and SD (1.0) were set to evaluate the stability of reference gene. If the value is higher than the threshold, the reference gene was considered to be unstable. For the BestKeeper analysis, all candidate genes in Tissue, SR, DL and WR were inconstant according to the above-mentioned index. Nevertheless, the ranking order was still acceptable, because the expression stability is a relatively concept. Meanwhile, the threshold is not immutable, and it represents the stringency for selection of reference gene [33,34]. At the same time, discrepancies were generally observed in gene stability ranking and validation generated by the four algorithms: GeNorm, Normfinder, Bestkeeper, and Delta Ct. For instance, in all samples, ACT7 was the most stable gene ranked by GeNorm and Delta Ct, while it was ranked fourth and eighth by Bestkeeper and NormFinder, respectively. SKIP was the most stable gene by Bestkeeper and was ranked in the middle or bottom position by GeNorm, NormFinder, and DeltaCt. NormFinder results showed that TUB was the most stable gene, while TUB was ranked in the middle or top position by the other three algorithms. Therefore, we recommend an evaluation of reference gene stability using more than two algorithms. However, UBQ was the least stable gene in all samples evaluated using the four aforementioned algorithms. Notably, in the same sample sets, three to five stable genes were obtained using the four aforementioned algorithms; however, only one or two of the most unstable genes were screened. The top stable gene was more heterogeneous than the bottom stable gene, which is attributed to differences in the calculation methods of the four algorithms [21–25]. Fortunately, integrated evaluation results can be obtained using Refinder, which is extensively acknowledged as the optimal algorithm for obtaining the final reference genes [26,35–39]. In this study, we adopted ranking results derived from the Refinder method to evaluate the stability of 15 candidate reference genes.
The MYB gene belongs to a large transcription factor family, which may contribute to a series of gene expressions related to plant growth, metabolism, and response to biotic and abiotic stresses [40,41]. To validate the expression stability of the reference genes, the expression patterns of the target TmMYB gene were detected under different conditions. Several previous reports suggested that two or more suitable reference genes would generate more reliable results [42]. Hence, we selected two stable reference genes and the least stable reference gene for normalization. In different tissues, the order of expression levels of TmMYB based on the three reference genes (PP2α, SKIP, and UBQ10) was inconsistent, hence two or more stable reference genes should be combined to calculate the relative expression levels to obtain more reliable results. Meanwhile, under stress conditions, the expression patterns of TmMYB showed similar trends to when the two stable reference genes were used for normalization. Hence, the use of one reference may yield reliable results, whereas two or more stable reference genes can minimize possible errors.
In this study, we systematically evaluated candidate reference genes for the normalization of gene expression data using qRT-PCR in T. miqueliana. In summary, the most stable reference genes were diverse in different tissues and under abiotic stress conditions. In tissue sets, PP2α was the most stable reference gene. Under abiotic stress, the most stable reference genes were revealed as follows: RPS13 under heat stress, SAMCD under cold stress, PP2α and TUB under waterlogging stress in leaf and root tissues, EF1α and PP2α under drying stress in leaf and root tissues, and TUB and ACT7 under salt stress in leaf and root tissues, respectively.
Acknowledgement: We would like to thank Editage (https://www.editage.cn) for English language editing. We are very grateful to Jiangsu Provincial Germplasm Repository of Indigenous Landscape Tree for providing plant materials during the experiments.
Author Contributions: Huanli Wang and Shijie Tang contributed to the study conception and design. Material preparation, data collection and analysis were performed by Lingjun Yan, Xi Huang, Zhongwei Wang and Yuanhao Yue. Huanli Wang and Lingjun Yan prepared the first draft of the manuscript. Huanli Wang and Shijie Tang revised the manuscript. All authors read and approved the final manuscript.
Availability of Data and Materials: All data generated or analyzed during this study are included in this paper.
Funding Statement: This work was supported by the Natural Science Foundation of Jiangsu Province under Grant No. BK20170619, National Natural Science Foundation of China under Grant No. 31700477 and Innovation and Extension of Forestry Science and Technology of Jiangsu Province under Grant No. LYKJ [2019] 06.
Conflicts of Interest: The authors declare that they have no conflicts of interest to report regarding the present study.
1. Derveaux, S., Vandesompele, J., Hellemans, J. (2010). How to do successful gene expression analysis using real-time PCR. Methods, 50(4), 227–230. DOI 10.1016/j.ymeth.2009.11.001. [Google Scholar] [CrossRef]
2. Dheda, K., Huggett, J. F., Chang, J. S., Kim, L. U., Bustin, S. A. et al. (2005). The implications of using an inappropriate reference gene for real-time reverse transcription PCR data normalization. Analytical Biochemistry, 344(1), 141–143. DOI 10.1016/j.ab.2005.05.022. [Google Scholar] [CrossRef]
3. Kozera, B., Rapacz, M. (2013). Reference genes in real-time PCR. Journal of Applied Genetics, 54(4), 391–406. DOI 10.1007/s13353-013-0173-x. [Google Scholar] [CrossRef]
4. Xiao, X., Ma, J., Wang, J., Wu, X., Li, P. et al. (2014). Validation of suitable reference genes for gene expression analysis in the halophyte Salicornia europaea by real-time quantitative PCR. Frontiers in Plant Science, 5, 788. DOI 10.3389/fpls.2014.00788. [Google Scholar] [CrossRef]
5. Radonic, A., Thulke, S., Mackay, I. M., Landt, O., Siegert, W. et al. (2004). Guideline to reference gene selection for quantitative real-time PCR. Biochemical and Biophysical Research Communication, 313(4), 856–862. DOI 10.1016/j.bbrc.2003.11.177. [Google Scholar] [CrossRef]
6. Han, B., Yang, Z., Samma, M. K., Wang, R., Shen, W. (2013). Systematic validation of candidate reference genes for qRT-PCR normalization under iron deficiency in Arabidopsis. Biometals, 26(3), 403–413. DOI 10.1007/s10534-013-9623-5. [Google Scholar] [CrossRef]
7. Deguchi, M., Potlakayala, S., Spuhler, Z., George, H., Sheri, V. et al. (2021). Selection and validation of reference genes for normalization of qRT-PCR data to study secondary metabolite related genes in industrial hemp. DOI 10.21203/rs.3.rs-394417/v1. [Google Scholar] [CrossRef]
8. Artico, S., Nardeli, S. M., Brilhante, O., Grossi-de-Sa, M. F., Alves-Ferreira, M. (2010). Identification and evaluation of new reference genes in Gossypium hirsutum for accurate normalization of real-time quantitative RT-PCR data. BMC Plant Biology, 10, 49. DOI 10.1186/1471-2229-10-49. [Google Scholar] [CrossRef]
9. Paolacci, A. R., Tanzarella, O. A., Porceddu, E., Ciaffi, M. (2009). Identification and validation of reference genes for quantitative RT-PCR normalization in wheat. BMC Plant Biology, 10(1), 11. DOI 10.1186/1471-2199-10-11. [Google Scholar] [CrossRef]
10. Migocka, M., Papierniak, A. (2010). Identification of suitable reference genes for studying gene expression in cucumber plants subjected to abiotic stress and growth regulators. Molecular Breeding, 28(3), 343–357. DOI 10.1007/s11032-010-9487-0. [Google Scholar] [CrossRef]
11. Wan, H., Yuan, W., Ruan, M., Ye, Q., Wang, R. et al. (2011). Identification of reference genes for reverse transcription quantitative real-time PCR normalization in pepper (Capsicum annuum L.). Biochemical and Biophysical Research Communications, 416(1–2), 24–30. DOI 10.1016/j.bbrc.2011.10.105. [Google Scholar] [CrossRef]
12. Hao, X., Horvath, D. P., Chao, W. S., Yang, Y., Wang, X. et al. (2014). Identification and evaluation of reliable reference genes for quantitative real-time PCR analysis in tea plant (Camellia sinensis (L.) O. Kuntze). International Journal of Molecular Sciences, 15(12), 22155–221172. DOI 10.3390/ijms151222155. [Google Scholar] [CrossRef]
13. Kong, Q., Yuan, J., Gao, L., Zhao, S., Jiang, W. et al. (2014). Identification of suitable reference genes for gene expression normalization in qRT-PCR analysis in watermelon. PLoS One, 9(2), e90612. DOI 10.1371/journal.pone.0090612. [Google Scholar] [CrossRef]
14. Tang, F., Chu, L., Shu, W., He, X., Wang, L. et al. (2019). Selection and validation of reference genes for quantitative expression analysis of miRNAs and mRNAs in poplar. Plant Method, 15, 35. DOI 10.1186/s13007-019-0420-1. [Google Scholar] [CrossRef]
15. Wang, Y., Zhang, Y., Liu, Q., Liu, L., Huang, S. et al. (2021). Reference gene selection for qRT-PCR normalization in Iris germanica L. Phyton-International Journal of Experimental Botany, 90(1), 277–290. DOI 10.32604/phyton.2020.011545. [Google Scholar] [CrossRef]
16. Wang, Z., Gu, C., Xuan, L., Hua, J., Shi, Q. et al. (2017). Identification of suitable reference genes in Taxodium ‘Zhongshanshan’ under abiotic stresses. Trees, 31, 1519–1530. DOI 10.1007/s00468-017-1566-y. [Google Scholar] [CrossRef]
17. Pigott, C. D. (2012). Lime-trees and basswoods: A biological monograph of the genus Tilia. Cambridge: Cambridge University Press. [Google Scholar]
18. Yao, W., Shen, Y., Shi, F. (2015). Germination of Tilia miqueliana seeds following cold stratification and pretreatment with GA3 and magnetically-treated water. Seed Science and Technology, 43(3), 554–558. DOI 10.15258/sst.2015.43.3.21. [Google Scholar] [CrossRef]
19. Yao, W., Shen, Y. (2018). Effects of gibberellic acid and magnetically treated water on physiological characteristics of Tilia miqueliana seeds. Canadian Journal of Forest Research, 48, 5. DOI 10.1139/cjfr-2017-0289. [Google Scholar] [CrossRef]
20. Wu, Y., Shen, Y. (2021). The structural and chemical characteristics of the pericarp are important in Tilia miqueliana seed dormancy. New Forest, 52, 875–888. DOI 10.1007/s11056-020-09820-3. [Google Scholar] [CrossRef]
21. Wu, Y., Shen, Y. (2020). Seed coat structural and permeability properties of Tilia miqueliana seeds. Journal of Plant Growth Regulation, 40, 1198–1209. DOI 10.1007/s00344-020-10179-0. [Google Scholar] [CrossRef]
22. Vandesompele, J., DePreter, K., Pattyn, F., Poppe, B., Roy, N. V. et al. (2002). Accurate normalization of realtime quantitative RT-PCR data by geometric averaging of multiple internal control genes. Genome Biology, 3(7), 341. DOI 10.1186/gb-2002-3-7-research0034. [Google Scholar] [CrossRef]
23. Andersen, C. L., Jensen, J. L., Ørntoft, T. F. (2004). Normalization of real-time quantitative reverse transcription-PCR data: A model-based variance estimation approach to identify genes suited for normalization, applied to bladder and colon cancer data sets. Cancer Research, 64(15), 5245–5250. DOI 10.1158/0008-5472.CAN-04-0496. [Google Scholar] [CrossRef]
24. Pfaffl, M. W., Tichopad, A., Prgomet, C., Neuvians, T. P. (2004). Determination of stable housekeeping genes, differentially regulated target genes and sample integrity: BestKeeper-excel-based tool using pair-wise correlations. Biotechnology Letters, 26(6), 509–515. DOI 10.1023/B:BILE.0000019559.84305.47. [Google Scholar] [CrossRef]
25. Silver, N., Best, S., Jiang, J., Thein, S. L. (2006). Selection of housekeeping genes for gene expression studies in human reticulocytes using real-time PCR. BMC Molecular Biology, 7, 33. DOI 10.1186/1471-2199-7-33. [Google Scholar] [CrossRef]
26. Xie, F., Xiao, P., Chen, D., Xu, L., Zhang, B. (2012). miRDeepFinder: A miRNA analysis tool for deep sequencing of plant small RNAs. Plant Molecular Biology, 80(1), 75–84. DOI 10.1007/s11103-012-9885-2. [Google Scholar] [CrossRef]
27. Zhu, Y., Bao, Y. (2021). Genome-wide mining of MYB transcription factors in the anthocyanin biosynthesis pathway of Gossypium hirsutum. Biochemical Genetics, 59(3), 678–696. DOI 10.1007/s10528-021-10027-0. [Google Scholar] [CrossRef]
28. Ramakers, C., Ruijter, J., Deprez, R., Moorman, A. (2003). Assumption-free analysis of quantitative real-time ploymerse chain reaction (PCR) data. Neuroscience Letters, 339(1), 62–66. DOI 10.1016/S0304-3940(02)01423-4. [Google Scholar] [CrossRef]
29. Livak, K. J., Schmittgen, T. D. (2001). Analysis of relative gene expression data using real-time quantitative PCR and the 2(-Delta delta C(T)) method. Methods, 25(4), 402–408. DOI 10.1006/meth.2001.1262. [Google Scholar] [CrossRef]
30. Niu, K., Shi, Y., Ma, H. (2017). Selection of candidate reference genes for gene expression analysis in kentucky bluegrass (Poa pratensis L.) under abiotic stress. Frontiers in Plant Science, 8, 193. DOI 10.3389/fpls.2017.00193. [Google Scholar] [CrossRef]
31. Chen, Y., Tan, Z., Hu, B., Yang, Z., Xu, B. et al. (2015). Selection and validation of reference genes for target gene analysis with quantitative RT-PCR in leaves and roots of bermudagrass under four different abiotic stresses. Physiologia Plantarum, 155(2), 138–148. DOI 10.1111/ppl.12302. [Google Scholar] [CrossRef]
32. Silveira, E. D., Alves-Ferreira, M., Guimarães, L. A., da Silva, F. R., Carneiro, V. T. (2009). Selection of reference genes for quantitative real-time PCR expression studies in the apomictic and sexual grass Brachiaria brizantha. BMC Plant Biology, 9, 84. DOI 10.1186/1471-2229-9-84. [Google Scholar] [CrossRef]
33. Galeano, E., Vasconcelos, T. S., Ramiro, D. A., de Mattin, V. F. (2014). Identification and validation of quantitative real-time reverse transcription PCR reference genes for gene expression analysis in teak (Tectona grandis L.f.). BMC Research Notes, 7, 464. DOI 10.1186/1756-0500-7-464. [Google Scholar] [CrossRef]
34. Liu, D., Huang, X., Lin, Y., Wang, X., Yan, Z. et al. (2019). Identification of reference genes for transcript normalization in various tissue types and seedlings subjected to different abiotic stresses of woodland strawberry Fragaria vesca. Scientia Horticulturae, 261, 1–8. DOI 10.1016/j.scienta.2019.108840. [Google Scholar] [CrossRef]
35. Zhang, J., Xie, W., Yu, X., Zhang, Z., Zhao, Y. et al. (2019). Selection of suitable reference genes for RT-qPCR gene expression analysis in siberian wild rye (Elymus sibiricus) under different experimental conditions. Genes, 10(6), 451. DOI 10.3390/genes10060451. [Google Scholar] [CrossRef]
36. Sheshadri, S. A., Nishanth, M. J., Yamine, V., Simon, B. (2018). Effect of melatonin on the stability and expression of reference genes in Catharanthus roseus. Scientific Reports, 8(1), 2222. DOI 10.1038/s41598-018-20474-2. [Google Scholar] [CrossRef]
37. Gao, M., Liu, Y., Ma, X., Shuai, Q., Gai, J. et al. (2017). Evaluation of reference genes for normalization of gene expression using quantitative RT-PCR under aluminum, cadmium, and heat stresses in soybean. PLoS One, 12(1), e0168965. DOI 10.1371/journal.pone.0168965. [Google Scholar] [CrossRef]
38. Duan, M., Wang, J., Zhang, X., Yang, H., Wang, H. et al. (2017). Identification of optimal reference genes for expression analysis in radish (Raphanus sativus L.) and its relatives based on expression stability. Frontiers in Plant Science, 8, 1605. DOI 10.3389/fpls.2017.01605. [Google Scholar] [CrossRef]
39. Huang, L., Yan, H., Jiang, X., Zhang, X., Zhang, Y. et al. (2014). Evaluation of candidate reference genes for normalization of quantitative RT-PCR in switchgrass under various abiotic stress conditions. BioEnergy Research, 7, 1201–1211. DOI 10.1007/s12155-014-9457-1. [Google Scholar] [CrossRef]
40. Chen, Y., Yang, X., He, K., Liu, M., Li, J. et al. (2006). The MYB transcription factor superfamily of Arabidopsis: Expression analysis and phylogenetic comparison with the rice MYB family. Plant Moleculer Biology, 60(1), 107–124. DOI 10.1007/s11103-005-2910-y. [Google Scholar] [CrossRef]
41. Valliyodan, B., Nguyen, H. T. (2006). Understanding regulatory networks and engineering for enhanced drought toleranee in plants. Current Opinion in Plant Biology, 9(2), 189–195. DOI 10.1016/j.pbi.2006.01.019. [Google Scholar] [CrossRef]
42. Chen, M., Wang, Q., Li, Y., Gao, L., Lv, F. et al. (2021). Candidate reference genes for quantitative gene expression analysis in Lagerstroemia indica. Molecular Biology Reports, 48(2), 1667–1685. DOI 10.1007/s11033-021-06209-z. [Google Scholar] [CrossRef]
Phenotype of six tissues of Tilia miqueliana in the tissue set
Candidate reference genes, a target gene, Arabidopsis ortholog locus, primers and different parameters derived from quantitative real-time PCR analysis in T. miqueliana
Polymerase chain reaction amplification specificity of the fifteen candidate reference genes and TmMYB, M = marker DL2000
Melting curves of the fifteen candidate reference genes and TmMYB
The statistic of qRT-PCR Ct values for all fifteen candidate reference genes in all T. miqueliana samples
Candidate reference genes ranked in order of their expression stability calculated by GeNorm under different experimental sets. The expression stability is increasing from No. 14 to No. 1. The two most stable control genes in each treatment, for example HIS/PP2α in tissue, cannot be ranked in order because of the required use of gene ratios for gene stability measurements. Red characters represent the average expression stability values (M) are more than 1.5. HT heat stress, CT cold Stress, WL waterlogging stress in leaves, WR waterlogging stress in roots, DL drying stress in leaves, DR drying stress in roots, SL salt stress, SR salt stress in roots
Expression stability for 15 candidate genes calculated via NormFinder. HT heat stress, CT cold stress, WL waterlogging stress in leaves, WR waterlogging stress in roots, DL drying stress in leaves, DR drying stress in root, SL salt stress in leaves, SR salt stress in roots, All all samples. Low to high expression stability is represented over a spectrum from red to blue, respectively
Expression stability for 15 candidate genes calculated via BestKeeper. HT heat stress, CT cold stress, WL waterlogging stress in leaves, WR waterlogging stress in roots, DL drying stress in leaves, DR drying stress in root, SL salt stress in leaves, SR salt stress in roots, All all samples. Low to high expression stability is represented over a spectrum from red to blue, respectively
Expression stability for 15candidate genes calculated via DeltaCt. HT heat stress, CT cold stress, WL waterlogging stress in leaves, WR waterlogging stress in roots, DL drying stress in leaves, DR drying stress in root, SL salt stress in leaves, SR salt stress in roots, All all samples. Low to high expression stability is represented over a spectrum from red to blue, respectively
 | This work is licensed under a Creative Commons Attribution 4.0 International License, which permits unrestricted use, distribution, and reproduction in any medium, provided the original work is properly cited. |