| Phyton-International Journal of Experimental Botany |
DOI: 10.32604/phyton.2022.022607
ARTICLE
Tea Plantation Frost Damage Early Warning Using a Two-Fold Method for Temperature Prediction
1College of Artificial Intelligence, Hangzhou Dianzi University, Hangzhou, 310018, China
2School of Information Engineering and Art and Design, Zhejiang University of Water Resources and Electric Power, Hangzhou, 310018, China
*Corresponding Authors: Xianfeng Zhou. Email: zhouxianfeng@hdu.edu.cn; Dongmei Chen. Email: chendongmei@hdu.edu.cn
Received: 18 March 2022; Accepted: 11 April 2022
Abstract: As the source and main producing area of tea in the world, China has formed unique tea culture, and achieved remarkable economic benefits. However, frequent meteorological disasters, particularly low temperature frost damage in late spring has seriously threatened the growth status of tea trees and caused quality and yield reduction of tea industry. Thus, timely and accurate early warning of frost damage occurrence in specific tea garden is very important for tea plantation management and economic values. Aiming at the problems existing in current meteorological disaster forecasting methods, such as difficulty in obtaining massive meteorological data, large amount of calculation for predicted models and incomplete information on frost damage occurrence, this paper proposed a two-fold algorithm for short-term and real-time prediction of temperature using field environmental data, and temperature trend results from a nearest local weather station for accurate frost damage occurrence level determination, so as to achieve a specific tea garden frost damage occurrence prediction in a microclimate. Time-series meteorological data collected from a small weather station was used for testing and parameterization of a two-fold method, and another dataset acquired from Tea Experimental Base of Zhejiang University was further used to validate the capability of a two-fold model for frost damage forecasting. Results showed that compared with the results of autoregressive integrated moving average (ARIMA) and multiple linear regression (MLR), the proposed two-fold method using a second order Furrier fitting model and a K-Nearest Neighbor model (K = 3) with three days historical temperature data exhibited excellent accuracy for frost damage occurrence prediction on consideration of both model accuracy and computation (98.46% forecasted duration of frost damage, and 95.38% for forecasted temperature at the onset time). For field test in a tea garden, the proposed method accurately predicted three times frost damage occurrences, including onset time, duration and occurrence level. These results suggested the newly-proposed two-fold method was suitable for tea plantation frost damage occurrence forecasting.
Keywords: Short-term temperature prediction; Fourier fitting; K-Nearest Neighbor; frost damage; tea plantation
China is the first country to discover and use tea, and thus form unique tea culture [1]. Currently, tea plantation area in China exceeds 2.9 million hectares, accounting for about 61% of the global tea garden area, and as the largest tea producer in the world, approximately 45% of global tea yield are contributed by China [2]. Thus, tea industry in China has developed rapidly, and it has become an important driving force for agricultural economy advance in mountainous and mid-mountain areas. However, frequent occurrences of frost damage meteorological disasters in spring challenged growth status of tea trees, mild frost could result in quality and yield reduction of spring tea, and tea trees could wither and die when suffered from severe frost, which seriously affecting the sustainable development of tea industry [3]. In Zhejiang Province, cold spell in later spring, i.e., late frost damage, severely affected production and economic benefits of high-quality tea [4]. For instance, the late frost damage occurrence on March 8th–10th, 2010, threatened more than half of tea garden area in Zhejiang Province. Early tea tree varieties, such as Wuniuzao and Pingyang, almost had no harvest. Longjing 43 and Yinshuang tea species suffered from heavy damage as well. This directly caused economic loss of tea yield in the whole province up to 1.7 billion yuan [5]. Therefore, timely and accurate early warning of frost damage has a great significance for tea plantation area management and for its economic values.
Early warning and prediction of frost damage had been conducted in China as early as the agrarian age. However, most of these warnings were at relatively large scale and not practical. With the advancement of agricultural modernization, more and more attention has been paid to prediction of frost damage in microclimate environment. Wu et al. [6] established a daily forecast model on low temperature disasters waring for early season rice with Fisher discriminant analysis, factor expansion and correlation methods by taking average atmospheric pressure, daily average temperature, maximum temperature, daily precipitation and other meteorological factors as predictive variables, thereby predicting the low temperature disaster level of double cropping rice in China Southern area. Xia et al. [7] combined cloud cover, wind speed, humidity with other meteorological factors to forecast short-term minimum temperature, and then to predict low temperature frost damage of orchards in winter period using stepwise regression analysis. A method for predicting high and low temperatures in maize crop was proposed by Zhu et al. [8] through investigating the relationship between minimum, maximum temperatures and various elements of observation stations with correlation and multiple linear regression methods. These mentioned researches have generally made use of historical temperature data and forecasting models for predicting temperature and disaster levels. However, limited attention has focused on forecasting start and end time of frost damage and tendency of disaster occurrence level.
Since predicted temperature is a key indicator for frost damage warning, abundant attentions had been focused on accurate temperature forecasting in varied application scenarios. Jin et al. [9] constructed a model to predict temperature in waxberry greenhouses based on back-propagation neural network (BPNN) by using historical observed meteorological data inside and outside greenhouses. Errors of daily minimum and maximum temperatures, and hourly temperature estimated by the model were rather lower than that predicted by using stepwise regression method. Based on gated recurrent unit neural network (GRUNN) and hourly meteorological data, including temperature, air pressure, dew point temperature, relative humidity and water vapor pressure, Luo et al. [10] built a forecast model to predict hourly temperature for next 24 h. Their results showed that the accuracy was about 63% for hourly temperature prediction, which was better than the results of autoregressive integrated moving average (ARIMA) model. Chen et al. [11] proposed a method through combining continuous time cluster analysis and BPNN model to forecast temperature inside solar greenhouses. The method classified continuous time periods of a whole year into several categories, and established correlation models between outside temperature, relative humidity, solar radiation, wind speed and inside temperature of greenhouse for different categories of time periods. Results suggested that accuracy of the model was convincing. Hippert et al. [12] combined linear model with multi-layer NN to predict hourly temperatures through using historical temperature data, forecasted maximum and minimum temperature provided by meteorological department, so as to obtain accurate prediction information. Ferreira et al. [13] proposed a model for temperature prediction inside a hydroponic greenhouse with air temperature, solar radiation and relative humidity as the main factors by using radial basis function NN. Then the model utilized temperature trend forecasted by weather stations to predict and modify temperature inside the greenhouse. An auto-regression model with exogenous variables was put forward by Lopez-Cruz et al. [14] to predict temperature inside a greenhouse by selecting outdoor air temperature, solar radiation, wind speed and relative humidity as model input variables. Their results indicated that second-order and higher-order autoregressive models of exogenous variables could effectively predict greenhouse temperature. These studies indeed enriched temperature forecast with complex model structures, such as NN, which require a large amount of long-time historical data for training. Nevertheless, for regions that historical datasets were difficult to acquire, for instance, tea plantation in mountainous and mid-mountain areas, application of these complicated models could be limited to some extent.
Fourier fitting is one of the important algorithms for signal processing and data analysis. Owning to its high efficiency, fast speed, and suitable for small sample modeling, it had been extensively used in various researches. Gao et al. [15] established an empirical model for characterizing the temperature properties of proton exchange membrane fuel cell by Fourier fitting method. Simulation and experimental results suggested that model outputs were in good agreement with measured data. Zi et al. [16] combined Fourier series with fuzzy Markov chain methods, to solve time series prediction problems with nonlinear and non-stationary small samples. Their results indicated that model accuracy was higher than that of traditional time series prediction method. Research conducted by Castaneda-Miranda et al. [17] demonstrated that it was feasible to use Fourier analysis method in meteorological temperature and humidity prediction based on hourly measured data.
At present, tea plantation frost damage early warning mostly relied on information released by meteorological department. These warnings were generally about tendency of temperature variations or predicted damage levels at a large regional level. While temperature in mountainous areas is affected by terrain fluctuation, vegetation coverage and other factors, thus predicted temperature or damage levels in regional scale could not fully represent the real situation of tea garden in mountainous and hilly areas. With the advancement of internet of things (IOT) techniques, some tea gardens are equipped with sensors for temperature monitoring. However, these sensors were unable to predict temperature and forecast frost damage, thus could not provide timely warnings. The effective combination of real-time temperature acquired by IOT sensors with forecasted temperature provided by meteorological department to analyze the mechanism of frost damage early warning in mountain tea garden region is of great significance for providing crucial information on guiding forewarning measures. Hence, aiming at problems mentioned in current meteorological disaster forecasting methods, such as difficulty in obtaining massive meteorological data, large amount of calculation for predicted models and incomplete information on frost damage occurrence, this paper tried to propose a two-fold algorithm for short-term and real-time prediction of temperature using field environmental data, and temperature tendency results from a nearest local weather station for accurate frost damage occurrence information determination, including occurrence time, duration and occurrence level, so as to achieve a specific tea garden frost damage occurrence prediction in a microclimate.
2.1 Frost Damage Index and Data Acquisition
The criteria (Table 1) for determining tea plantation frost damage were released by China Meteorological Industry Standard QX/T 410-2017 ‘tea plant frost damage level’ [18]. According to the standard, frost damage is mainly affected by temperature and humidity, especially the lowest temperature and its duration in tea gardens. Thus, accurate prediction of temperature and its tendency are crucial for calculation and forecasting of tea frost damage levels. Here, data, including temperature, humidity, air pressure, precipitation, wind direction and wind speed, from a small IOT weather station (DAVIS 6162) located in Beijing Changping District Xiaotangshan Experimental Base (40°10.6′ N, 116°26.3′ E) were used on consideration of its long-time span from 2018 to 2020, and sufficient low temperature values. Among which, 151 lists (that is 151 × 24) of data respectively acquired from 1st November 2018 to 31st March 2019, and from 1st November 2019 to 30th March 2020, were used to train and validate the feasibility of building a model for predicting frost damage according to information listed in Table 1. The accuracy of temperature acquired by DAVIS 6162 was 0.01°C and it was recorded hourly, so 1 list contained 24 records. The other datasets were collected from Tea Experimental Base of Zhejiang University (30°23.7′ N, 119°52.9′ E) in Hangzhou Yuhang District with a IOT sensor equipped with temperature and humidity modules (DHT22). Its accuracy for temperature monitoring was 0.01°C and it recorded every half an hour. 120 lists (i.e., 60 × 24 × 2) of data were then obtained from 1st March to 29th April 2021. During this period, cold spell in later spring happened frequently. These data were further used to validate model’s capability of for frost damage forecasting.

2.2 A Two-Fold Method for Frost Damage Predicting
Generally, results of forecasted frost damage contain four parts: start time, onset temperature, duration and occurrence level, among which, onset temperature and duration are important meteorological indicators for assessment of frost damage occurrence level. Based on damage levels information (Table 1), threshold value of temperature at the occurrence of tea plantation frost damage was set to 4°C. According to daily variation of temperature, a two-fold method for frost damage predicting was then proposed: firstly, a model for 24 h temperature trend forecasting was established based on measured temperature to predict the lowest temperature within 24 h. If minimum temperature forecasted by model was lower than the threshold, The trend of temperature variations in a short-term was then used to accurately predict actual temperature and analyze the possibility of frost damage occurrence. If frost damage was predicted to occur, duration of frost damage could be further analyzed based on temperature forecast trend from the nearest weather station, so as to determine predicted occurrence level. Details on model proposal were presented as follows.
2.2.1 Frost Damage Onset Time Forecasting
The first step of a two-fold method was to use a fitting curve to predict the lowest temperature within a 24-h period. Considering the real-time performance of calculation of temperature prediction, it is necessary to reduce the amount of calculated data as much as possible and improve computation speed of forecasting while ensuring the accuracy of prediction. Thus, a Fourier fitting model with relatively few data orders was selected to build a first step model, i.e., Eq. (1).
where values of a0, aj, bj, ω, n are determined by Fourier fitting model, x is series number of time, i.e., x = 1, 2, …, 24. For calculation of these parameters, a 24-h temperature model is established by using average temperature of every moment from random three days, so as to ensure that the model could accurately represent variation trend of temperature.
Predicted temperatures obtained from a 24-h temperature fitting model were then compared with actual temperatures acquired from observations at the same time, and the minimum temperature from a fitting model was modified to achieve the lowest temperature prediction in 24 h (Fig. 1). In Fig. 1, thick solid lines represent data calculated from a model, thin solid lines denote data acquired from observations, vertical dashed lines refer to a certain time, and horizontal dashed line indicates a predicted minimum temperature with modification. At a certain time, temperature predicted from a model was compared with that obtained from observations to calculate modification value. Then original predicted minimum temperature was corrected by adding or subtracting the value to get a modified lowest prediction. If the modified lowest prediction was lower than threshold temperature, then frost damage could occur. The modification process was calculated from Eq. (2).
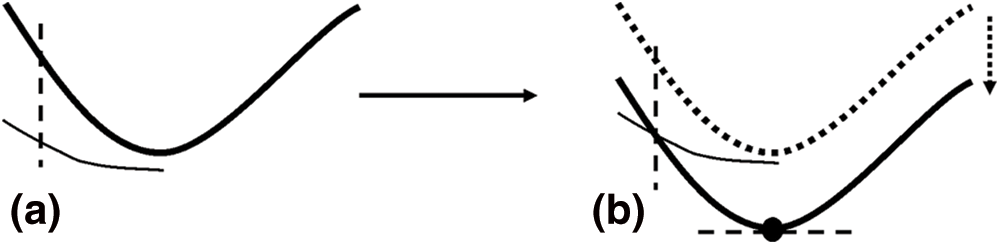
Figure 1: Schematic diagram of lowest temperature correction (a) and (b) are temperature trend curves before and after modification, respectively
where T1 is a modified lowest prediction of temperature, T0 is a predicted lowest temperature by a 24-h temperature fitting model. Tmi is a set model temperature at each hourly time, while Tri is the corresponding observed temperature before T0 and T1. i is series number of time, i.e., i = 1, 2, …, 24.
Although modified lowest prediction of temperature could be achieved through a process of the first step of a two-fold method. Information on specific onset time, duration, and accurate disaster occurrence level of frost damage could not be accurately provided. Here, the second step of a two-fold method (Fig. 2) was taken into account after confirmation of frost damage risk using a modified lowest prediction of temperature. Considering that variations of environment temperature are not completely linear and it is not suitable to monotonously predict temperature for a long time. We assume that temperature changes in a monotonous trend in a very short time, thus, a slop method was proposed to predict temperature in order to reduce forecast error caused by the hysteresis of temperature prediction. Firstly, a monotone change rate of temperature was calculated by using actual environment temperature at the present moment and previous moment, then, environmental temperature after a period of time was forecasted by combining with Eq. (3) to obtain a more accurate temperature prediction value. After testing of experimental datasets, a slope method still had good accuracy, when the length of forecast time was 2 h.
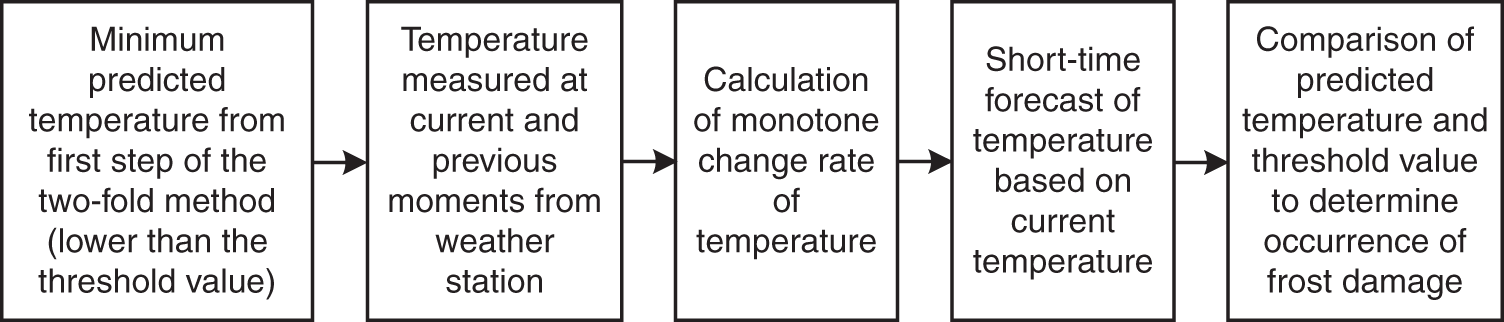
Figure 2: Flow chart of second step of a two-fold method
where T2 is a predicted temperature for 2 h later by using the slop method, Tt is an actual temperature measured at the current time node, Tt−1 is an actual temperature measured at the previous time node, n is the number of time node intervals for prediction (Eq. (4)).
where, interval refers to temperature measurement gap by weather stations or sensors.
After the process of two-fold method, environmental predicted temperature at a certain time could be accurately derived. Nevertheless, confirmation of frost damage occurrence level includes two aspects: environmental predicted temperature and duration of low temperature. Firstly, it is necessary to determine the onset time of frost damage. Here, a K-Nearest Neighbor method was chosen to predict onset time of frost damage. The method referred to collect three values of predicted temperature continuously in the form of a queue. If the second value of predicted temperature was lower than the threshold, frost damage was deemed to occur only at the time.
2.2.2 Frost Damage Occurrence Level Predicting
Apart from forecasting of frost damage onset time, it is still necessary to predict specific duration of low temperature to comprehensively determine frost damage occurrence level. Here, real-time weather forecast of temperature trends over next 24 h from a nearest local weather station were used to predict duration of low temperature, and thus to predict frost damage level. The prediction process was shown in Fig. 3. Curve line in the figure represents 24 h temperature trend forecasted by our method in a tea plantation area. Solid dot on the left side of horizontal axis refers to a moment that frost damage was predicted to happen. Horizontal axis with arrow pointing to the right stands for weather station forecasting temperature at the time when frost damage was predicted. Hollow dot on the right side of horizontal axis refers to a moment that forecasting temperature was higher than threshold value for the first time, after the time that frost damage was predicted. Then, possible duration of frost damage could be derived from interval time between two time points, and information on occurrence level could be obtained as well. It is worth noting that frost damage occurrence level was determined by both environmental low temperature and its duration, while forecasting temperature reported by weather station would change constantly with time. Therefore, confirmation of occurrence levels should be carried out in real time after frost damage was predicted to happen, so as to ensure prediction accuracy of occurrence level.
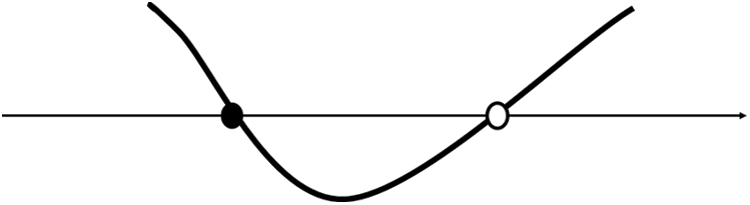
Figure 3: Schematic diagram of frost damage duration prediction
To investigate and compare the capability and potentiality of a proposed two-fold method for frost damage predicting, two reference methods that widely used in previous studies were selected, i.e., autoregressive integrated moving average (ARIMA) and multiple linear regression (MLR).
(1) ARIMA is a commonly used forecasting model for time series data. Which needs to transform non-stationary time series into stationary time series firstly. Combination of temperature variations and time exhibits a relatively obvious periodicity; thus, the model has been extensively used in applications of temperature prediction. Implementation of the model is mainly based on a batch of existing data to predict the next N unknown data. The larger N value is, the worse the prediction result is. this might suggest that the model is suitable for short-term prediction rather than long-time temperature forecasting.
(2) MLR is also frequently considered in temperature prediction researches. The premise of the method for tea plantation frost damage predicting is that environmental temperature in tea plantation area is influenced by many factors, such as air humidity, atmospheric pressure, precipitation, wind direction, wind speed and other meteorological factors. Through analyzing correlation between meteorological factors apart from temperature at a certain time and forecasted temperature at another moment, in order to predict frost damage. The formula was listed as follows:
where Ti is temperature at current time, a0, a1, …, an are coefficients calculated from historical data, x1i, x2i, …, xni represent different meteorological factors corresponded to these coefficients.
In order to verify prediction accuracy under the effect of different factors, predicted and measured data and frost damage information were compared and analyzed. Differences between predicted temperature at the onset time of frost damage and actual temperature at the time (∆T), differences between predicted onset time of frost damage and the actual occurrence time (∆t), and differences between predicted frost damage duration time and duration of the actual damage occurrence (∆D), were selected as indicators to evaluate the capability of the mentioned methods:
where Ta(tp) represents actual temperature at a predicted time of frost damage, Tf(tp) stands for forecasted temperature at a predicted time of frost damage. ta and tp refer to actual time and predicted time when frost damage occurred, respectively. Da and Dp denote number of days of actual frost damage, and number of days of predicted frost damage, respectively. If the error of predicted onset temperature is within ±1°C, the prediction of the onset temperature of frost damage could be considered accurate. If the error of predicted onset time is within ±2 h, the onset time prediction of frost damage could be acceptable. Specific number of days of frost damage occurrence depends on actual situation of environmental temperature.
3.1 Parameters Determination for a Two-Fold Method
Since detailed process of a two-fold method for tea plantation frost damage prediction were presented in Section 2.2, it was still needed to parameterize the approach. Here, dataset collected from Xiaotangshan weather station (151 lists of data), among which actual number of days that temperature was suitable for frost damage occurrence was 65 days. These data were mainly used for investigating the effects of optimal order of Fourier fitting method, suitable data size for modelling, and different K-values for K-Nearest Neighbor approach on the accuracy of predicted results (Fig. 4).
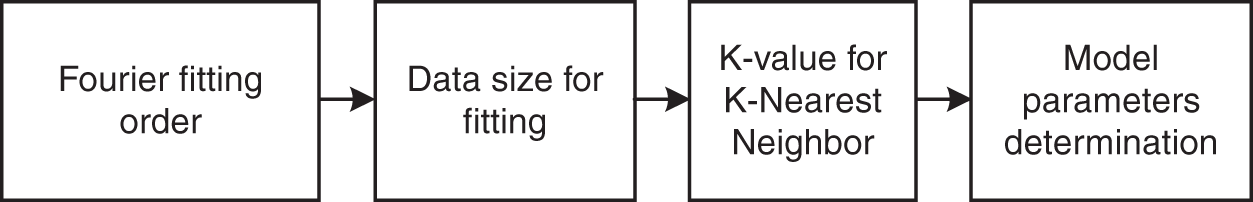
Figure 4: Flow chart of a two-fold method parameterization process
The proposed two-fold method needed to conduct temperature prediction firstly through modelling, so as to reduce the influence of temperature fluctuation on the process of temperature prediction, and eliminate the influence of temperature rapid variations on forecasted temperature when actual minimum temperature did not reach the threshold value of temperature. Therefore, whether the first step of a two-fold method was accord with actual temperature variation trend could great affect the overall temperature prediction. Here, effects of different values of Fourier fitting order on prediction accuracy were investigated. Furthermore, polynomial fitting method was tested and compared using the same data size and same criteria. Owning to its characteristic that higher fitting order could result in better precision, high-order polynomial fitting modelling was tested. With regard to Fourier fitting, increase of fitting order did not significantly improve fitting accuracy according to our analysis, thus low-order Fourier fitting was used. Partial results of both two methods are presented in Table 2.

Results show that prediction accuracy of forecasted temperature at the onset time are higher than 80% for different orders of both Fourier and polynomial fitting methods. Nevertheless, values of polynomial fitting order are much higher than that of Fourier fitting. Furthermore, it is obvious that the prediction accuracy of forecasted duration of frost damage by Fourier fitting exceed the results obtained by polynomial fitting. Results of forecasted number of days of frost damage also show similar tendency, which suggesting that Furrier fitting is much more accurate than polynomial fitting in temperature prediction, even though complicated and high-order polynomial fitting methods are adopted. As for Furrier fitting, results of varied values of Furrier fitting order do not show significant differences in prediction accuracy. Considering that high-order Furrier fitting needs much computation, a second-order Fourier fitting model was selected for calculation and prediction in subsequent experiments.
3.1.2 Data Size for Fitting Model
Since a two-fold method required a certain amount of temperature data to establish a tendency model which reflected actual temperature variation for short-term temperature forecasting, data size that used in the model could directly affect prediction accuracy. Here, the influence of different data size on model prediction was analyzed. Datasets consisted of 3, 7, 15 and 30 days historical temperature data were compared and analyzed for modeling analysis. A second-order Fourier fitting model was employed, K-value of K-Nearest Neighbor was initially set as 3, and threshold temperature value was set as 4°C. Detailed results are shown in Table 3. Overall, results for forecasted frost damage indexes exhibit rather good prediction accuracy, particularly forecasted temperature at the onset time and forecasted duration of frost damage, using these four datasets. Moreover, no obvious differences in prediction accuracy are found when varied data size are used for model fitting. This suggests that effect of variation of data size on prediction accuracy is within acceptable limits. In consideration of both low-computation and high-accuracy of fitting model when used for practical applications in the field, the proposed two-fold method selected 3 days historical temperature data as data input for modeling.

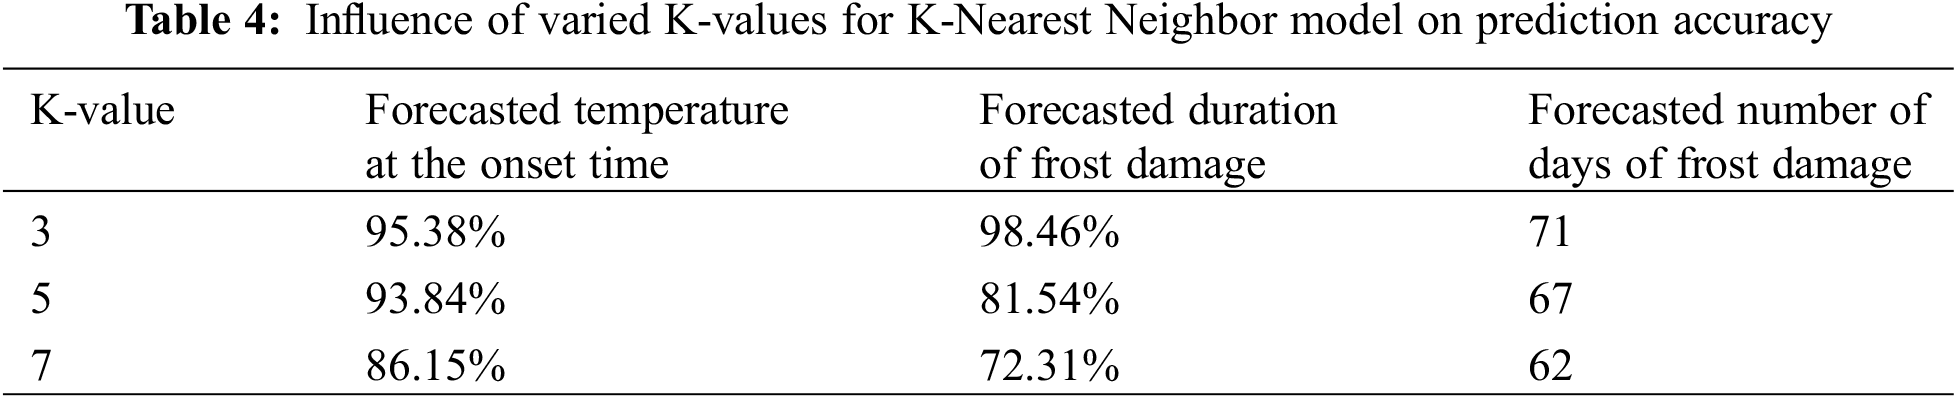
3.1.3 K-Value for K-Nearest Neighbor
For a two-fold method, K-Nearest Neighbor method was a crucial process to determine occurrence and specific time of frost damage. Nevertheless, different K-values affected the performance of K-Nearest Neighbor method. Here, influence of varied K-values (i.e., K = 3, 5, and 7) for K-Nearest Neighbor model on prediction accuracy was investigated, and results are shown in Table 4. On the whole, change of K-values has a significantly influence on prediction accuracy. For low K-value (i.e., K = 3), prediction accuracy of forecasted temperature at the onset time, and forecasted duration of frost damage are satisfactory, nevertheless, differences between forecasted number of days of frost damage and actual situation (65 days) are obvious. When K-values increase (i.e., K = 5, 7), prediction accuracy of forecasted temperature at the onset time, and forecasted duration of frost damage show significant decrease, especially accuracy of forecasted duration of frost damage are rather poor. On the contrary, accuracy of forecasted number of days of frost damage are much better than that when K-value equals to 3. Since the two-fold method was intended for short-term prediction of frost damage, forecasted temperature at the onset time and forecasted duration of frost damage weighed more compared with forecasted number of days of frost damage. In other words, these two indexes should be predicted as accurate as possible. Thus, here, K-value for K-Nearest Neighbor method was determined as 3.
3.2 Comparison with Different Methods
In order to test the capability of the above proposed method for tea plantation frost damage prediction, performance of ARIMA and MLA methods for temperature forecasting and frost damage prediction were investigated and compared based on measured data acquired from Xiaotangshan Meteorological Station. For temperature prediction, a time series dataset containing continuous 120 h of temperature data, collected from 1st November 2019 to 30th March 2020, was used for these two methods. The first 100 h data were used for forecasting models building, and then the established models were used to predict temperature and frost damage occurrence of next 20 h. Predicted temperature results with ARIMA model was presented in Fig. 5. It is obvious that values of forecasted temperature are quite consistent with that of actual values for next 2 h, nevertheless, the predicted temperature curve for next 18 h is quite different from that of the actual temperature curve. Although the trend of predicted temperature is roughly consistent with the actual situation, there is a significant difference between specific forecasted temperature values and actual temperature. Moreover, predicted minimum temperature is 4.54°C for next 20 h, which is higher than actual minimum temperature. In terms of time, predicted lowest temperature is 10 h earlier than actual lowest temperature.
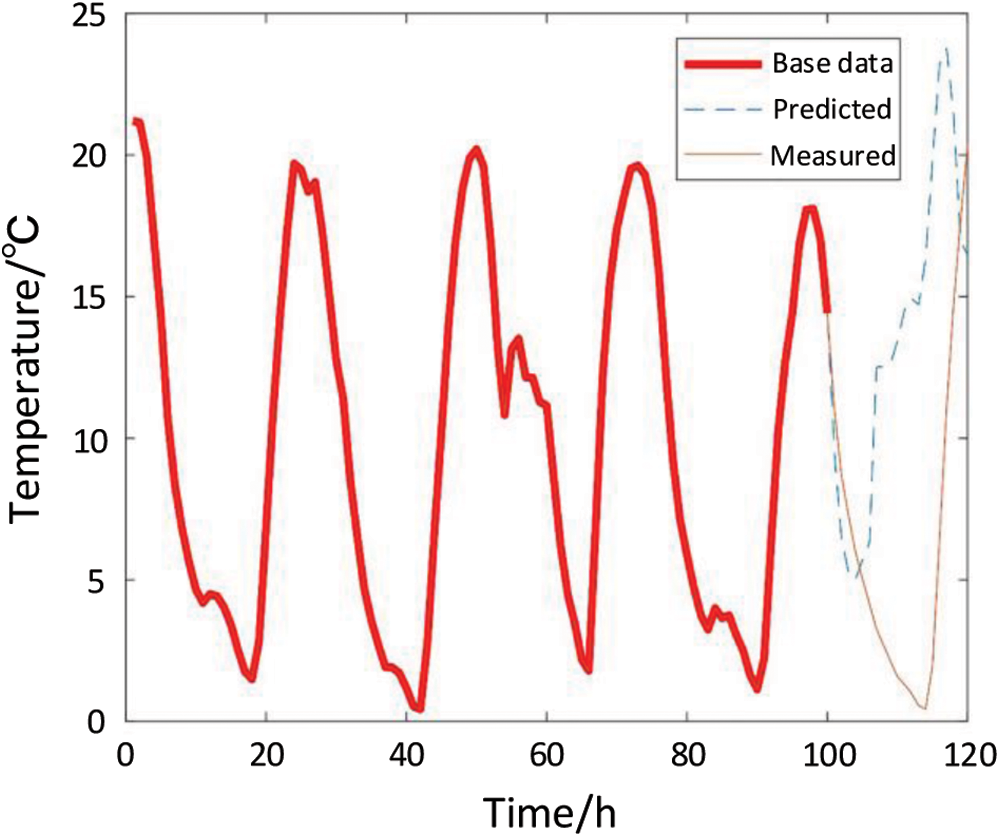
Figure 5: Comparison of measured and predicted temperature by ARIMA model
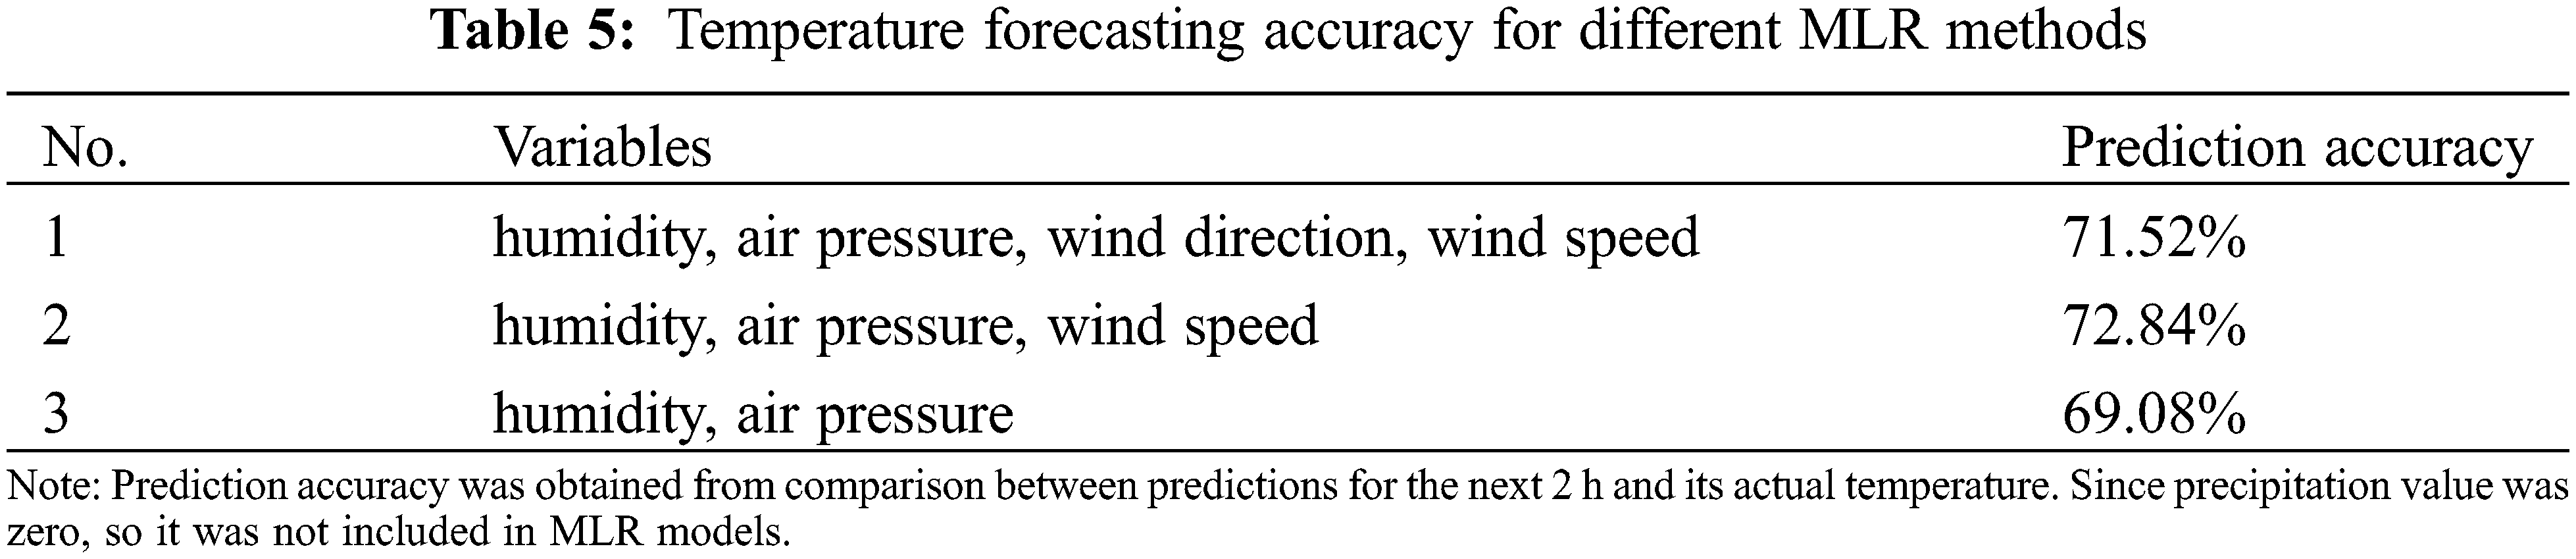
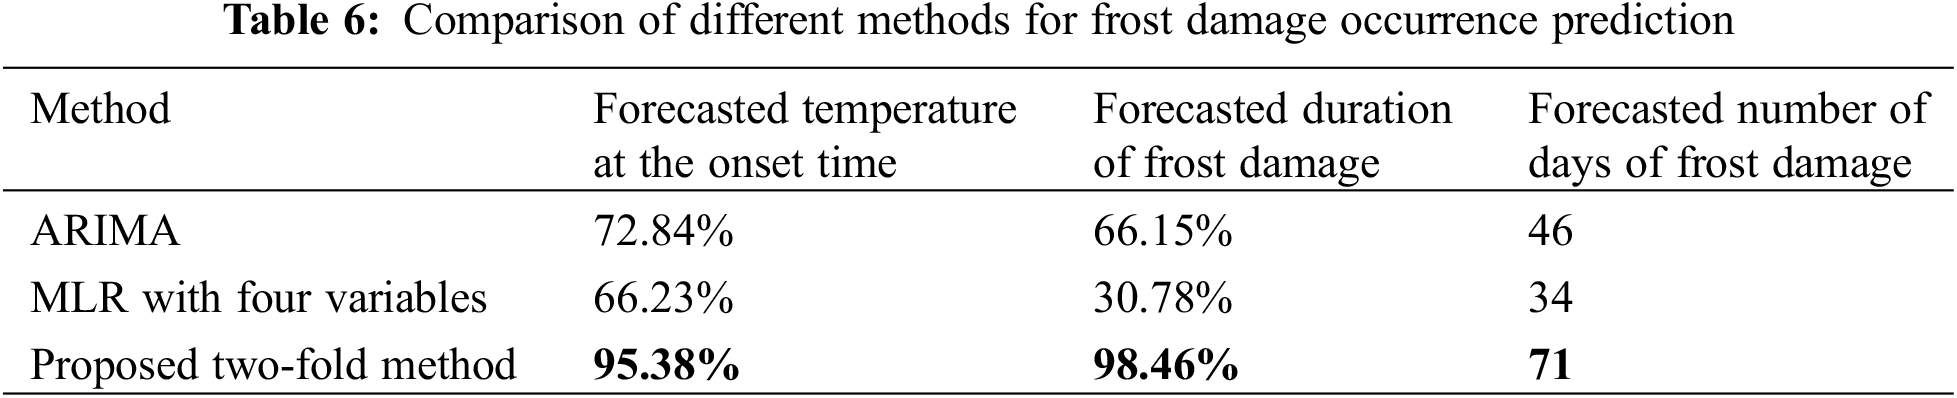
Regarding to MLR methods, temperature forecasting results for next 20 h were rather poor, so results for the next 2 h were investigated. For MLR models, different meteorological factors were randomly combined for predicting temperature. top rank three combinations for MLR models that showed the highest predicted accuracy are presented in Table 5. Overall, temperature prediction accuracy for MLR models with different variables are not very good, since values of prediction accuracy are around 70% on the premise that temperature error is considered to be within ±2°C. For frost damage occurrence prediction, all the data collected from Xiaotangshan meteorological station were used. Parameterization of a two-fold method were determined in Section 3.1, while MLR with four variables was used. frost damage occurrence prediction results with different methods are shown in Table 6. MLR model exhibits the worst forecasting results. Large errors occur in the prediction of duration and number of days. ARIMA also shows rather poor results for frost damage prediction since accuracy values for forecasted temperature at the onset time and duration are just around 70%, which cannot meet the requirements for frost damage forecasting. In comparison, the proposed two-fold method shows the most accurate prediction results among all these three methods, even though there is a slight difference between its forecasted number of days and actual number of days (65 days). These results suggest that compared with ARIMA and MLR methods, the proposed two-fold model has a great potential for frost damage occurrence prediction.
3.3 Frost Damage Prediction with a Two-Fold Method
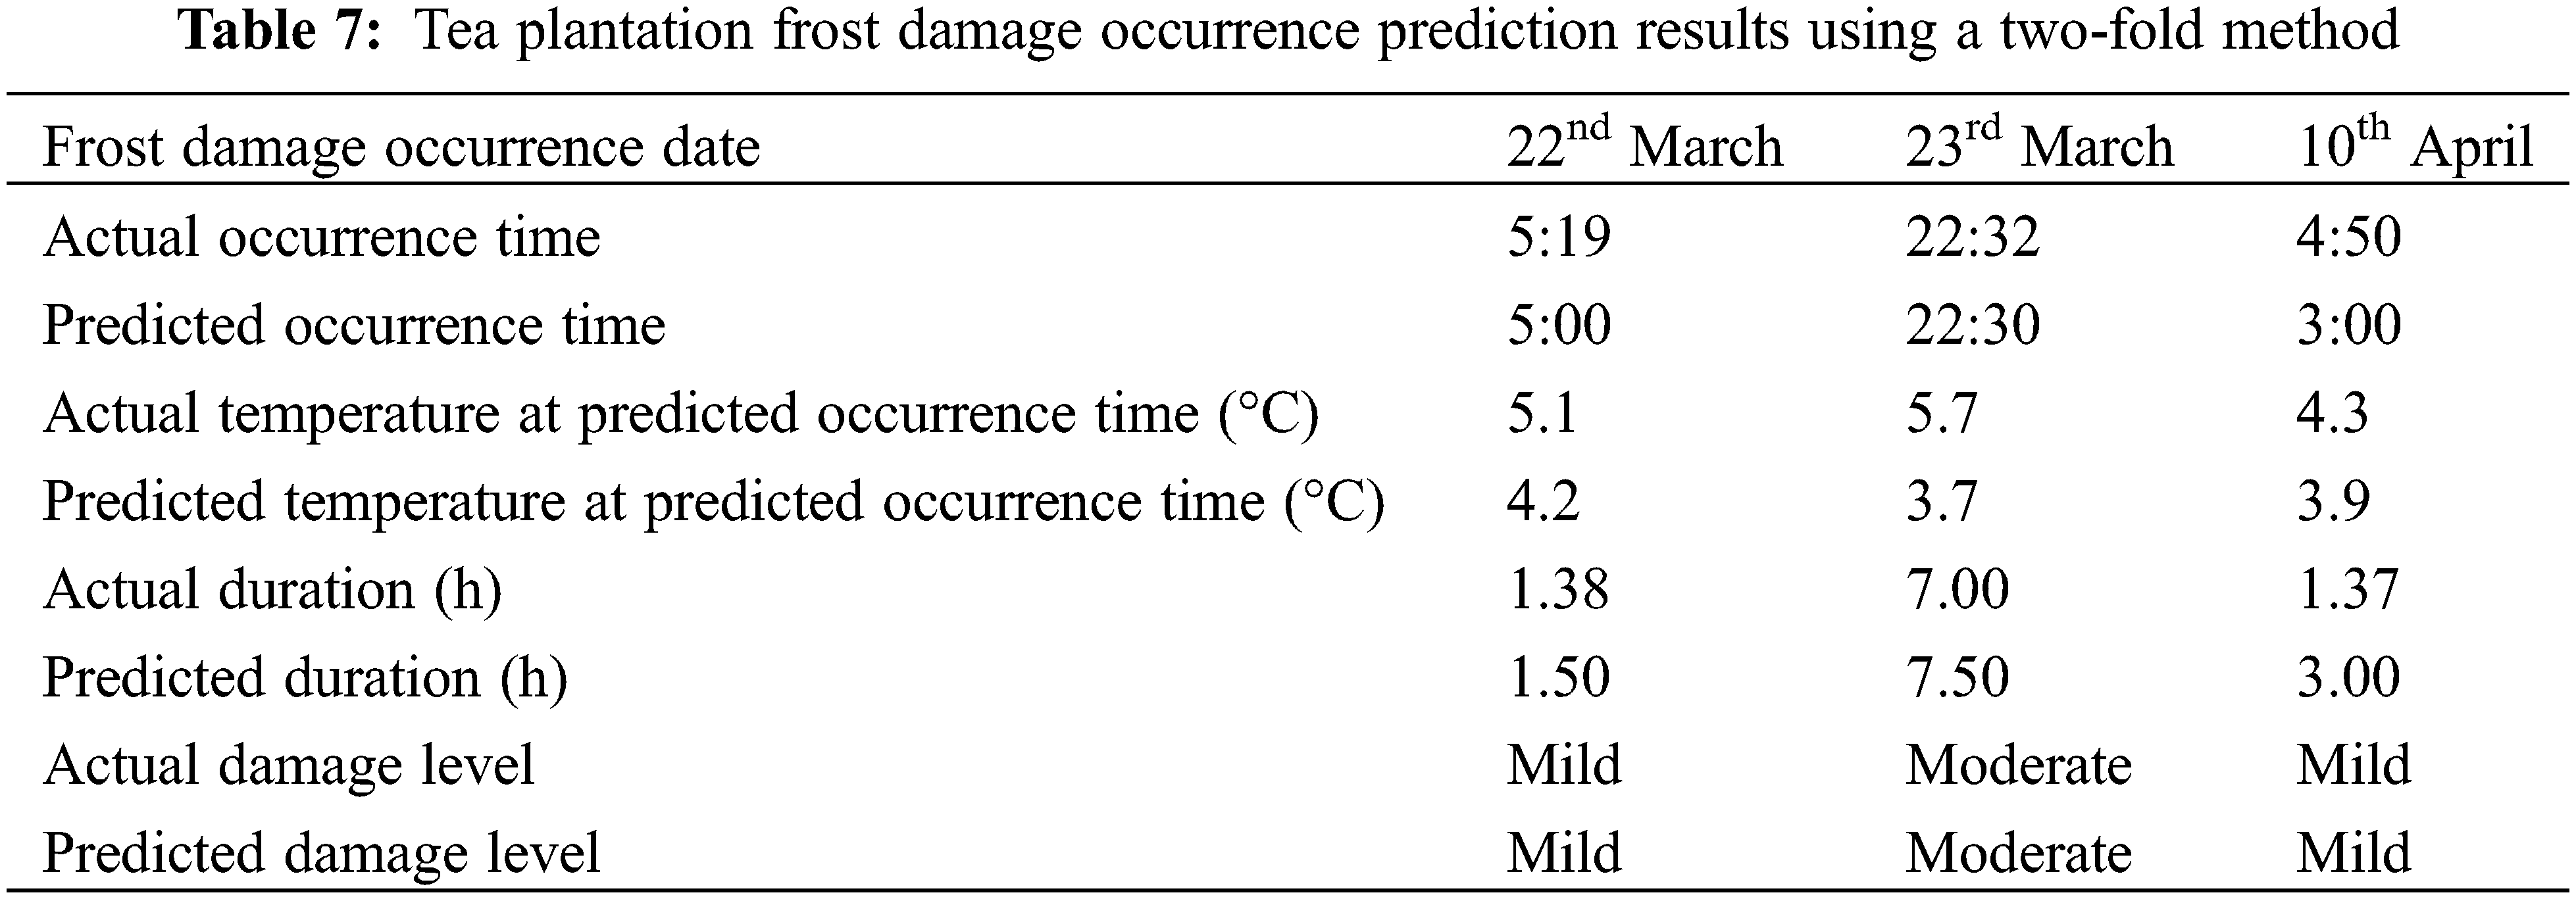
According to the above-mentioned parameterization of a two-fold method, a second-order Fourier Fitting model was established based on 3 days temperature datasets. Threshold temperature for determining frost damage was set at 4°C, and K-value for K-Nearest Neighbor was set at 3. The method was then used for frost damage prediction in Tea Experimental Base of Zhejiang University. During the field test, Actual frost damage occurred on 22nd and 23rd March 2021, which were mainly due to the influence of cold air moving southward. Also, a frost damage occurred on 11th April due to the affection of precipitation. As for forecasting of these three frost damage occurrences with the parameterized two-fold method, results are presented in Table 7. These data show that all these three predicted occurrence times are slight earlier than actual occurrence times, and predicted temperature at predicted occurrence times are within the acceptable range, and are lower than actual temperature at predicted occurrence times. Moreover, results on predicted duration are longer than that of actual duration. Overall, three frost damage occurrences are accurately and timely forecasted. Which suggesting that the method has a good applicability in practical application for frost damage occurrence prediction. Predicted results for 22nd and 23rd March are accorded with the actual situations. While, forecasted results for 10th April regarding to predicted occurrence time and duration show an obvious difference with actual scenario. According to our analysis, we found that there could be an error in the judgment of frost damage in second step of a two-fold method when actual temperature was very close to the threshold temperature at the time when frost damage occurrence was predicted. This might be largely explained for the difference in occurrence time and duration of frost damage on 10th April. Since the method could provide slight early predictions compared with actual situations, which indicating its fast and good response in advance, and it could be very effective for early frost prevention. Thus, we suggest that the proposed two-fold method is suitable for accurate prediction of tea plantation frost damage occurrence.
In this paper, a two-fold method was proposed and tested to establish a scheme for short-term and real-time tea plant frost damage prediction. First, a Fourier fitting method was selected for predicting of temperature and its change trend, then combining with weather forecast temperature variation trend of next 24 h from a nearest local weather station, a K-Nearest Neighbor method was used to predict frost damage occurrence level, so as to achieve tea plantation frost damage early warning. Comparison with the performance of ARIMA and MLA models, a parameterized two-fold method showed good accuracy for prediction of duration and temperature at the onset time of frost damage (>95%), with a historical temperature dataset acquired from a meteorological station. For field test in Tea Experimental Base of Zhejiang University, the proposed method accurately predicted three times frost damage occurrences, including occurrence time, duration and occurrence level. These results suggested the capability and potentiality of newly proposed two-fold method for frost damage occurrence forecasting.
For modelling process, the method used a small amount of temperature data, which reduced the dependence of prediction scheme on the amount of historical data. Moreover, the approach adopted next 24 h temperature forecasting information from a nearest local weather station for frost damage level determination, which further improved the adaptability of prediction scheme. Nevertheless, the method also has its drawbacks, since an error could occur in the judgment of frost damage in second step of a two-fold method when actual temperature was very close to the threshold temperature at the time when frost damage occurrence was predicted. In addition, the model was just tested on a specific tea plantation area, the applicability of the method to other tea area locations and prediction accuracy of frost damage in these areas need to be further verified. Thus, more work is still needed in the future to optimize the two-fold model and improve its capability for accurate and robust forecasting of frost damage occurrence.
Author Contributions: The authors confirm contribution to the paper as follows: Conceptualization: X. F. Zhou. Methodology: D. M. Chen. Software: K. Q. Li. Formal analysis: L. Yuan. Validation: J. C. Zhang. Writing—original draft preparation: Z. Y. Wu. Writing—review and editing: X. F. Zhou and D. M. Chen. Supervision: K. H. Wei. All authors reviewed the results and approved the final version of the manuscript.
Acknowledgement: The authors are grateful to Jiaju Li, Panpan Zhao and Qiaowei Li for their assistance in experimental design and data collection.
Funding Statement: This work was supported by Zhejiang Public Welfare Program of Applied Research (LGN19D010001), the National Key R&D Program of China (2019YFE0125300), Zhejiang Provincial Natural Science Foundation of China under Grant No. LGN19F030001, and Zhejiang Agricultural Cooperative and Extensive Project of Key Technology (2020XTTGCY04-02).
Conflicts of Interest: The authors declare that they have no conflicts of interest to report regarding the present study.
1. Gong, Y. X., Huang, Q. L., Zhang, Y. W. (2015). Historical review and reflection on the development of Chinese tea culture. Agricultural Archaeology, 2, 12–16. DOI 10.3969/j.issn.1006-2335.2015.02. [Google Scholar] [CrossRef]
2. Jiang, M., Zhang, C. Z. (2020). China Tea Industry Insight Report 2019: New situation and trends. Journal of Guangxi Vocational and Technical College, 13(2), 32–38. DOI 10.3969/j.issn.1674.3083.2020.02. [Google Scholar] [CrossRef]
3. Han, W. Y., Li, X. (2015). Integrated control technology of tea tree late frost and freezing injury. China Tea, 2, 16–17. DOI 10.3969/j.issn.1000-3150.2015.02.007. [Google Scholar] [CrossRef]
4. Li, S., Wang, R., H., Z., Jin, Z., Qiu, F. et al. (2017). Refined early-warning of tea frost disaster: A case study in Songyang County of Zhejiang. Chinese Journal of Ecology, 36(10), 2979–2987. DOI 10.13292/j.1000-4890.201710.038. [Google Scholar] [CrossRef]
5. Li, X. Y. (2004). Causes and prevention measures of early spring tea freezing injury in Hangzhou. China Tea, 5, 27–28. DOI 10.3969/j.issn.1000-3150.2004.05.017. [Google Scholar] [CrossRef]
6. Wu, L., Huo, Z. G., Yang, J. Y., Xiao, J. J., Zhang, L. et al. (2016). Early-warning of low-temperature disaster levels on double-cropping rice in Southern China based on Fisher’s discriminant. Journal of Applied Meteorological Science, 27(4), 396–406. DOI 10.11898/1001-7313.20160402. [Google Scholar] [CrossRef]
7. Xia, L. H., Zhang, L. D., Lin, H. F., Leng, D. S., Cai, W. H. (2007). Prediction and early warning of fruit tree freezing damage in winter due to low temperature in Fujian Province. Chinese Journal of Agrometeorology, 28(2), 221–225. DOI 10.3969/j.issn.1000-6362.2007.02.026. [Google Scholar] [CrossRef]
8. Zhu, B. M., Zhou, Q., Lu, G. W., Yang, Y. J., Si, H. et al. (2017). Characteristic of temperature change in summer maize field and establishment of minimum and maximum temperature forecasting model. Journal of Arid Meteorology, 35(4), 674–681. DOI 10.11755/j.issn.1006-7639(2017)-04-0674. [Google Scholar] [CrossRef]
9. Jin, Z. F., Fu, G. H., Huang, H. J., Pan, Y. D., Yang, Z. Q. et al. (2011). Simulation and forecast of air temperature inside the greenhouse planted myica rubra based on BP neural network. Chinese Journal of Agrometeorology, 32(3), 362–367. DOI 10.3969/j.issn.1000-6362.2011.03.008. [Google Scholar] [CrossRef]
10. Luo, Y., Luo, L. Y., Fan, J. Z., Duan, S. R., Gao, W. J. (2021). An hourly prediction model of air temperature based on deep GRU neural network. Hubei Agricultural Sciences, 60(6), 119–122,126. DOI 10.14088/j.issn.0439-8114.2021.06.025. [Google Scholar] [CrossRef]
11. Chen, X., Tang, X. L., Li, X., Liu, T. Q., Jia, L. et al. (2017). Two-steps prediction method of temperature in solar greenhouse based on twice cluster analysis and neural network. Transactions of the Chinese Society for Agricultural Machinery, 353–358. DOI 10.6041/j.issn.1000-1298.2017.S0.054. [Google Scholar] [CrossRef]
12. Hippert, H. S., Pedreira, C. E., Souza, R. C. (2000). Combining neural networks and ARIMA models for hourly temperature forecast. IEEE-INNS-ENNS International Joint Conference on Neural Networks, pp. 414–419. Como, Italy. DOI 10.1109/IJCNN.2000.860807. [Google Scholar] [CrossRef]
13. Ferreira, P. M., Faria, E. A., Ruano, A. E. (2002). Neural network models in greenhouse air temperature prediction. Neurocomputing, 43(1–4), 51–75. DOI 10.1016/S0925-2312(01)00620-8. [Google Scholar] [CrossRef]
14. Lopez-Cruz, I. L., Rojano-Aguilar, A., Ojeda-Bustamante, W., Salazar, M. R. (2007). ARX models for predicting greenhouse air temperature: A methodology. Agrociencia, 41(2), 181–192. [Google Scholar]
15. Gao, Y. F., Chen, T. L., Wu, Z. S., Ling, C. Y., Han, M. (2018). Temperature modeling and simulation of a proton exchange membrane fuel cell based on Fourier fitting. Acta Energiae Solaris Sinica, 39(3), 679–685. DOI 10.3969/j.issn.0254.0096.2018.03. [Google Scholar] [CrossRef]
16. Zi, S. Y., Lin, M. C., Xie, L. (2015). Small sample time series modeling method based on Fourier series and fuzzy Markov chain. Statistics and Decision, 6, 24–27. DOI 10.3969/j.issn.1002.6487.2015.06. [Google Scholar] [CrossRef]
17. Castaeda-Miranda, A., Icaza-Herrera, M. D., Castao, V. M. (2019). Meteorological temperature and humidity prediction from Fourier-statistical analysis of hourly data. Advances in Meteorology, 2019, 1–13. DOI 10.1155/2019/4164097. [Google Scholar] [CrossRef]
18. Grade of Frost Damage to Tea Plant (2017). Meteorological industry standards of the People’s Republic of China. http://www.cma.gov.cn/root7/auto13139/201801/t20180109_459751.html. [Google Scholar]
 | This work is licensed under a Creative Commons Attribution 4.0 International License, which permits unrestricted use, distribution, and reproduction in any medium, provided the original work is properly cited. |