| Phyton-International Journal of Experimental Botany |
DOI: 10.32604/phyton.2022.020117
ARTICLE
Extracting Lotus Fields Using the Spectral Characteristics of GF-1 Satellite Data
1The Key Laboratory of Po-Yang Lake Watershed Agricultural Resources and Ecology of Jiangxi Province, Jiangxi Agricultural University, Nanchang, 330045, China
2Jiangxi Tourism and Commerce Vocational College, Nanchang, 330100, China
*Corresponding Author: Haisheng Cai. Email: chs@jxau.edu.cn
Received: 05 November 2021; Accepted: 20 January 2022
Abstract: The lotus (Nelumbo nucifera Gaertn.) is an aquatic plant that grows in shallow water and has long been cultivated in South China. It can improve the incomes of farmers and plays an important role in alleviating poverty in rural China. However, a modern method is required to accurately estimate the area of lotus fields. Lotus has spectral characteristics similar to those of rice, grassland, and shrubs. The features surrounding areas where it is grown are complex, small, and fragmented. Few studies have examined the remote sensing extraction of lotus fields, and automatic extraction and mapping are still challenging methods. Here, we compared the spectral characteristics of lotus fields and other ground objects and devised a remote sensing method for the rapid extraction of lotus fields. Using this method, the extraction accuracy of lotus was 96.3%. The Kappa coefficient was 0.926, which is higher than those of the unsupervised K-means classification, Mahalanobis distance, and support vector machine supervised classification, and demonstrates the potential of this method for extracting and mapping lotus fields by remote sensing.
Keywords: Lotus filed; classification; remote sensing; GF-1
Lotus (Nelumbo nucifera Gaertn.) is valuable for its ornamental, edible, medicinal, and other uses. It is a valued plant that is planted worldwide and is rich in a variety of resources [1,2]. White lotus has been cultivated in China for more than 1000 years [3]. In 2020, the price of white lotus was about 90 RMB yuan per kilogram. The economic benefit of planting one mu (a Chinese unit of land measurement that is commonly 666.667 m2) of lotus is about 6,000 RMB yuan, and the rate of return is 5–7 times the rate of planting rice. China currently attaches great importance to the development of agriculture for rural revitalization [4]. Areas such as Guangchang and Shicheng Counties in Jiangxi Province and Jianning County in Fujian Province have introduced measures to adjust the agricultural planting structure; consequently, the area of lotus cultivation is expanding rapidly. The annual lotus planting area in Jiangxiang Town, Nanchang County, where the study area is located, is about 300 mu. Lotus agriculture can increase the income of local farmers, promote the rural economy, and help eliminate rural poverty.
There are increasing requirements to monitor different crops in modern agriculture [5,6], and it is important to develop a quick, accurate method to acquire information on the area planted, distribution, and yield of lotus. Conventional survey methods are time consuming, slow, inaccurate, and difficult in terms of obtaining data, and they do not meet the management needs of modern agriculture [7,8] For example, China’s Third National Land Resource Survey began in 2017 and ended in 2021, taking 5 years to complete; China’s Second National Census on Sources of Pollution started at the end of 2017 and ended at the end of 2019, requiring 2 years. In addition, China’s grain statistics are reported in a step-by-step manner by village-level statisticians, township statistical institutions, county-level statistical institutions, municipal statistical institutions, and provincial statistical institutions and then delivered to the National Bureau of Statistics, which takes a long time, and the statistician’s professional skill , sample selection, and other aspects of each link may cause data distortion [9,10]. Feature extraction and mapping using remote sensing have focused on major crops, such as rice [11–13], wheat [14,15], corn [16,17], and soybean [17], but have ignored cash crops with small acreages, such as lotus, peanuts, and sunflowers. The accuracy of extracting and mapping small-acreage crops using remote sensing is low [18]. Consequently, it is difficult to meet the growing needs of agricultural production management because of the broken plots, scattered distributions, complex surrounding conditions, and large spectral variation [19]. Therefore, a method to optimize crop field extraction based on the unique spatial and spectral characteristics of small-acreage crops is an urgent requirement for monitoring crops by remote sensing.
Plastic film mulching and plastic greenhouses share similarities when monitoring and extracting small land classes. Many studies have suggested ways to use remote sensing to extract small features. For example, Agüera et al. [20] extracted plastic greenhouses using the spectral characteristics of QuickBird images with 96.89% accuracy. Shi et al. [21] separated plastic greenhouses from other ground objects using GF-2 image data and a distribution program and obtained a plastic greenhouse distribution map with 97.34% extraction accuracy.
When choosing data sources, we tend to choose high-spatial-resolution images, although medium-resolution data, such as Landsat, Sentinel, and China’s WFV (16 m) data, are rich and free [22,23]. However, the accuracy of medium-resolution image extraction can fail to meet application requirements due to the scattered distribution and fragmentation of small land classes [24]. To extract and map crops, researchers often use multi-temporal data combined with crop growth phenology for comparative analysis to improve the extraction accuracy [25,26]. However, most lotus plants are grown in cloudy, rainy areas at middle or low latitudes, and it is difficult to obtain multi-period high-quality optical image data during the growing season. Therefore, it is necessary to devise a method using single images for extraction and mapping. Naturally, very high spatial resolution (VHR) satellite images contain few multispectral bands, usually four, namely, blue, green, red, and near-infrared [21,27]. Due to the relative limitation of spectral resolution, metameric substances with the same spectrum present a challenge when classifying land use/cover using these VHR images [28]. Therefore, object-based mapping approaches utilizing spectral and textural information are being considered and developed, and have achieved good accuracy [29]. However, the setting of segmentation parameters based on more or less systematic trial-and-error approaches remains challenging, and accuracies measured by visual interpretation are unstable [30]. The purposes of this study were to reduce the cost of image acquisition for ground feature extraction, and to extract small target ground features in lotus field automatically and quickly in the case of limited multi-temporal data.
We propose a three-step method for extracting lotus fields from VHR images. First, a vegetation separation model is constructed according to spectral reflectance to enhance vegetation information and distinguish vegetation from non-vegetation. Second, a model is constructed to enhance spectral features and eliminate high-density vegetation, such as woodland. Third, the commonly utilized normalized difference vegetation index (NDVI) is used to distinguish lotus field.
The next section of this paper provides an overview of the research area. The third section introduces the data acquisition and data processing methods, as well as the model construction and concepts. The fourth section, presents the model calculation results and accuracy verification, and the fifth section provides the extraction results and discusses the applicability of the method. The sixth and final section lists the major conclusions of the work.
The study area was Jiangxiang, Nanchang, China, on the lower reaches of the Ganjiang River (115°65’E, 28°32’N, Fig. 1). This area is surrounded by water, bordering Lake Poyang in the east and the suburbs of Nanchang in the west. Jiangxiang has a total area of 241 km2, measuring 46 km from east to west and 8 km from north to south. It has a warm, humid, subtropical monsoon climate with abundant rainfall during spring and summer. Jiangxiang Town, with its basic pattern of organic rice, aquaculture, vegetable cultivation, economic crop (lotus), and ecotourism as pillar industries, has an annual grain output of 100 million kilograms. In 2020, the population of Jiangxiang Town was 94,573, the GDP was 11.5 billion RMB yuan, and the per capita disposable income was 23,112 RMB yuan [31].
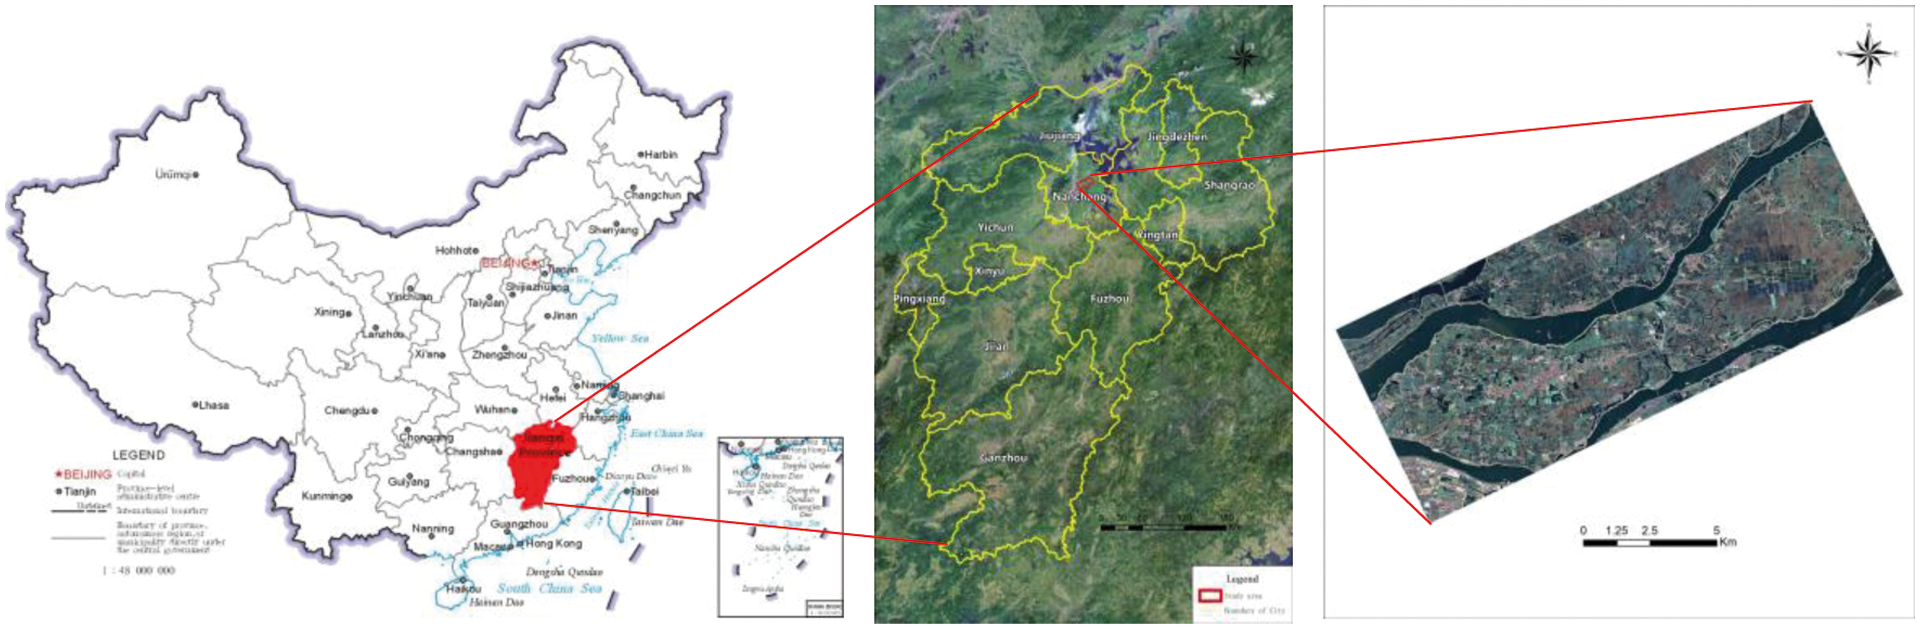
Figure 1: Location of the study area
GF-1 is China’s high-resolution remote sensing satellite, and it collects data in blue, green, red, and near-infrared bands. It has been widely used for extracting land-use information [32,33]. Lotus is usually planted in April, grows vigorously in June, July and August, when huge lotus leaves cover the whole water surface, and gradually withers from September until all stems are withered in November. Therefore, remote sensing images from June to August are considered suitable for remote sensing identification and monitoring of lotus fields.
We downloaded orthophoto data from July 31, 2020, from the China Centre for Resources Satellite Data and Application (http://www.cresda.com). The resolution was 8 m for the multispectral data and 2 m for the panchromatic data (Table 1). At that time, some of the early season rice had been harvested, the late season rice had been replanted, and the lotus was in a period of luxuriant growth. As a result, the types of land surface around the lotus field were very complex, including lotus field, water, early season rice, late season rice, forest, and artificial surfaces. This complex spatial and spectral pattern is the main challenge of lotus field remote sensing extraction.
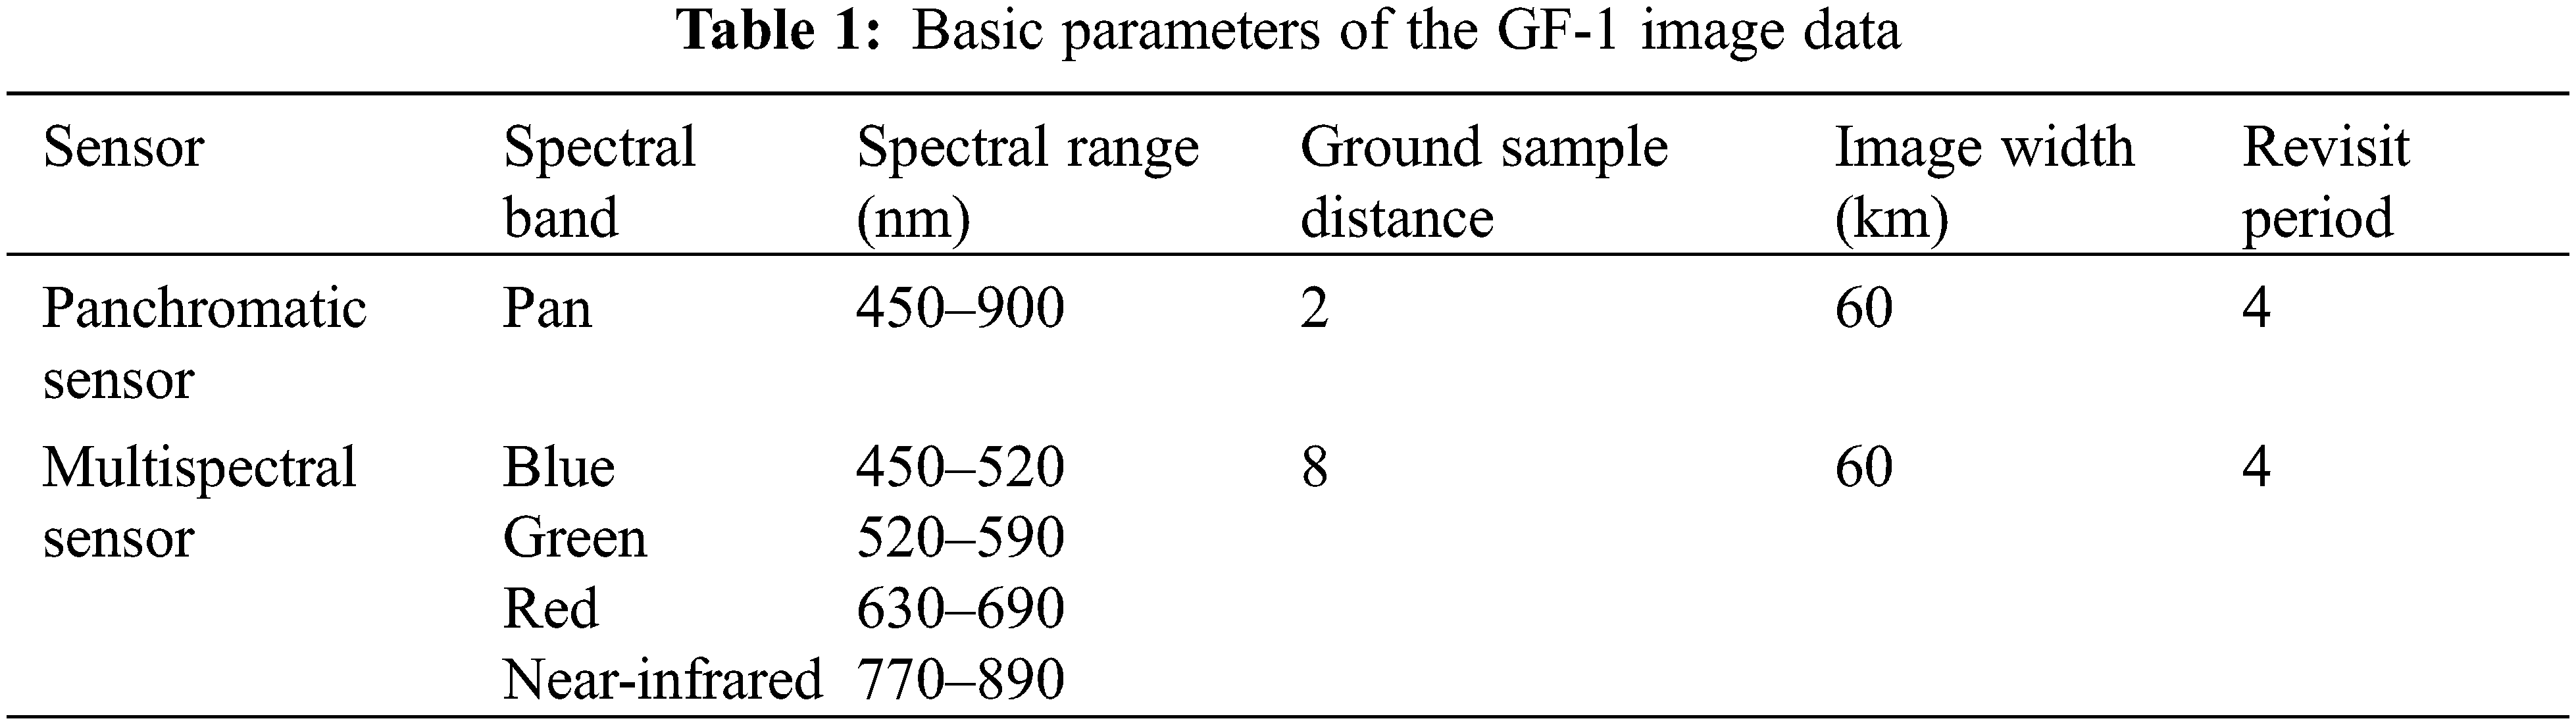
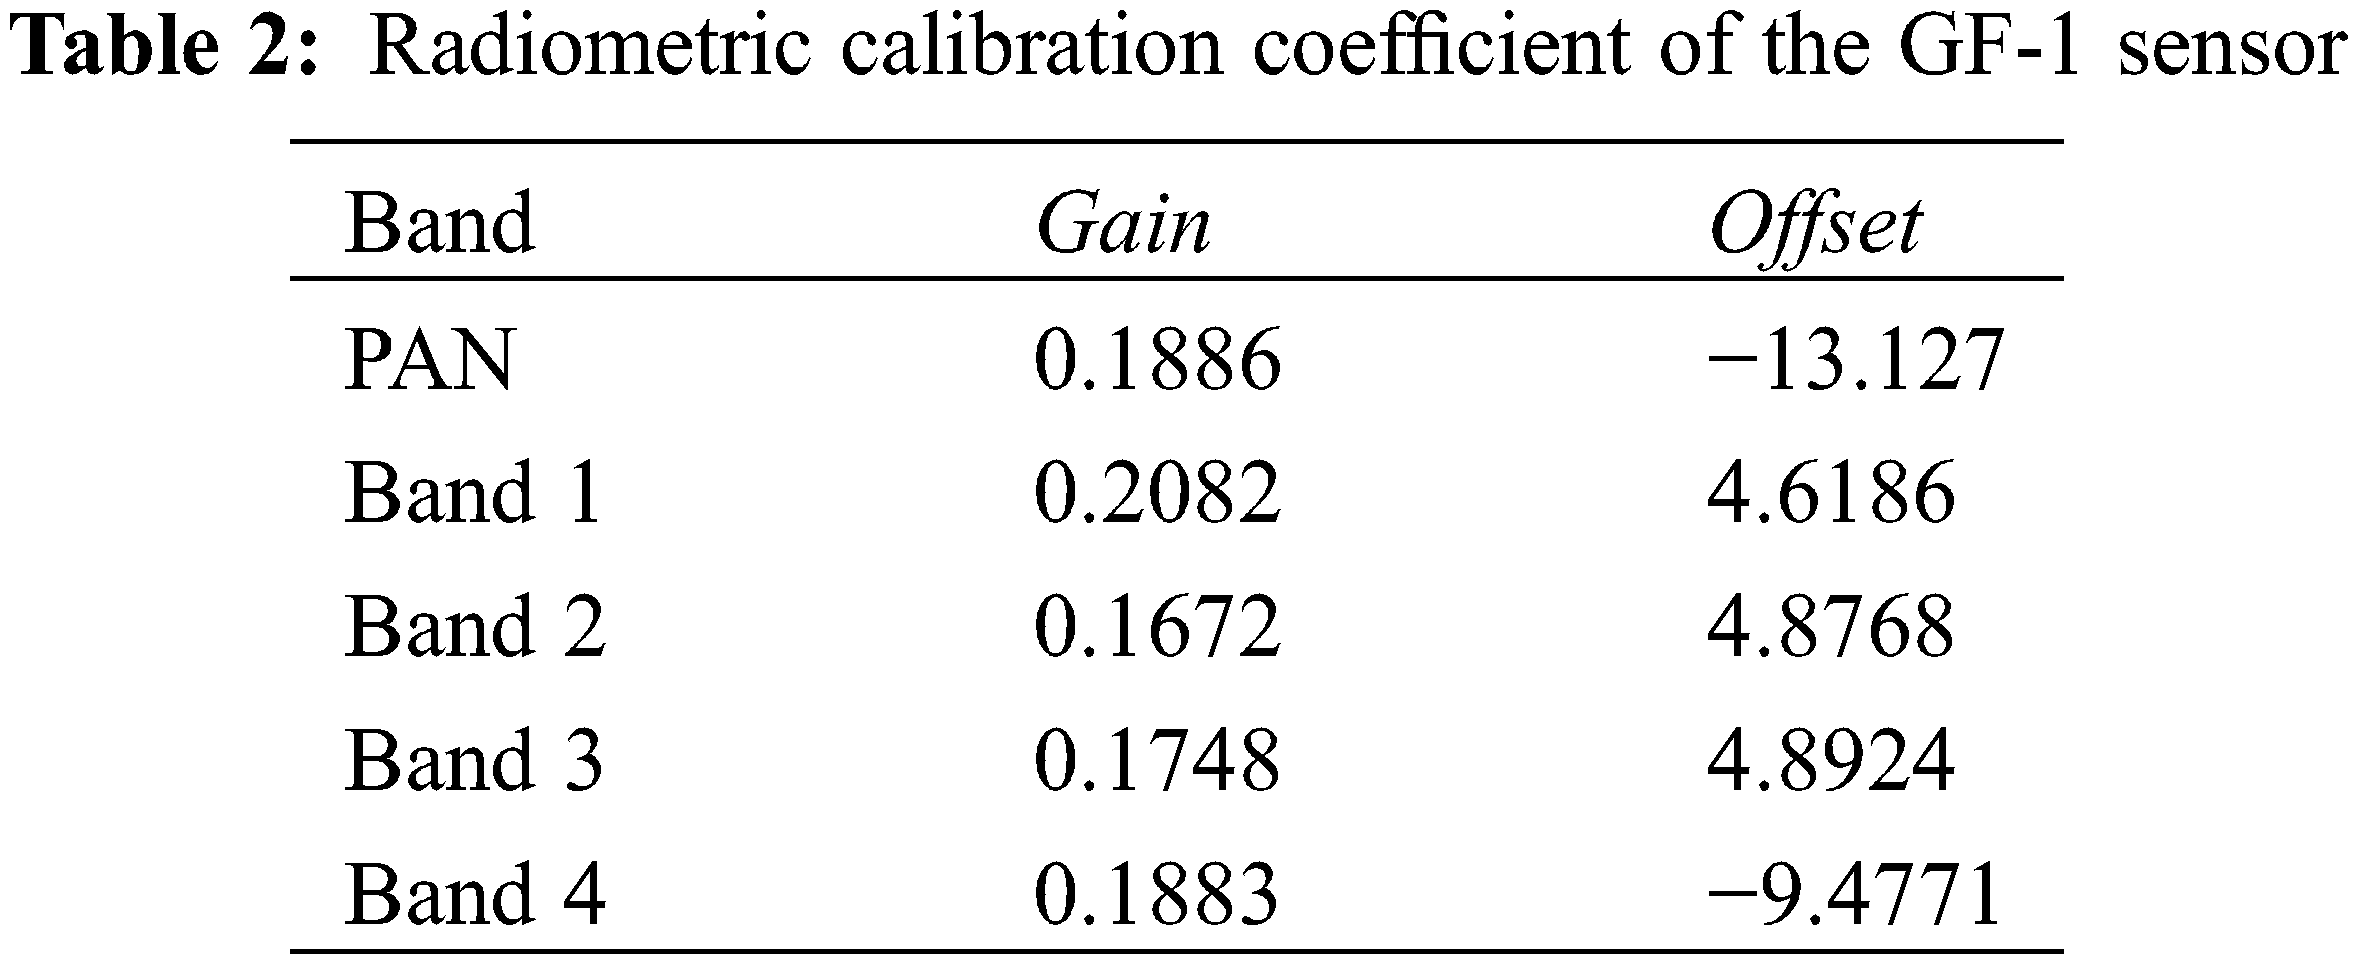
We used ENVI software (L3Harris, USA) for remote sensing image preprocessing, including image radiometric calibration, atmospheric correction, geometric correction, image clipping, and other steps. Image radiometric calibration uses the absolute calibration coefficient and band offset linear operation to obtain the gray value of the image Le(λe). The phase calibration is obtained as follows:
In the formula, Laurel Le(λe) is the radiance after conversion, with units of W/(m2⋅sr⋅μm), DN is the observed value of satellite load, Gain is the slope of the calibration, and Offset is the calibration intercept, also with units of W/(m2⋅sr⋅μm). The calibration slope and intercept of GF-1 are shown in Table 2.
In ENVI software, the FLASSH correction module was used to correct the atmosphere of the image. The spectral response functions were downloaded from the China Centre. For Resources Satellite Data and Application. We used the RPC model to orthorectify the remote sensing image data and selected control points on Tianditu (http://www.tianditu.com) for geometric correction. The ground control points were uniformly distributed in the study area, and the root mean square after correction was less than 1 pixel. The panchromatic and multispectral images were fused using the Gram–Schmidt Spectral Sharpening model to give multispectral image data with a 2-m resolution.
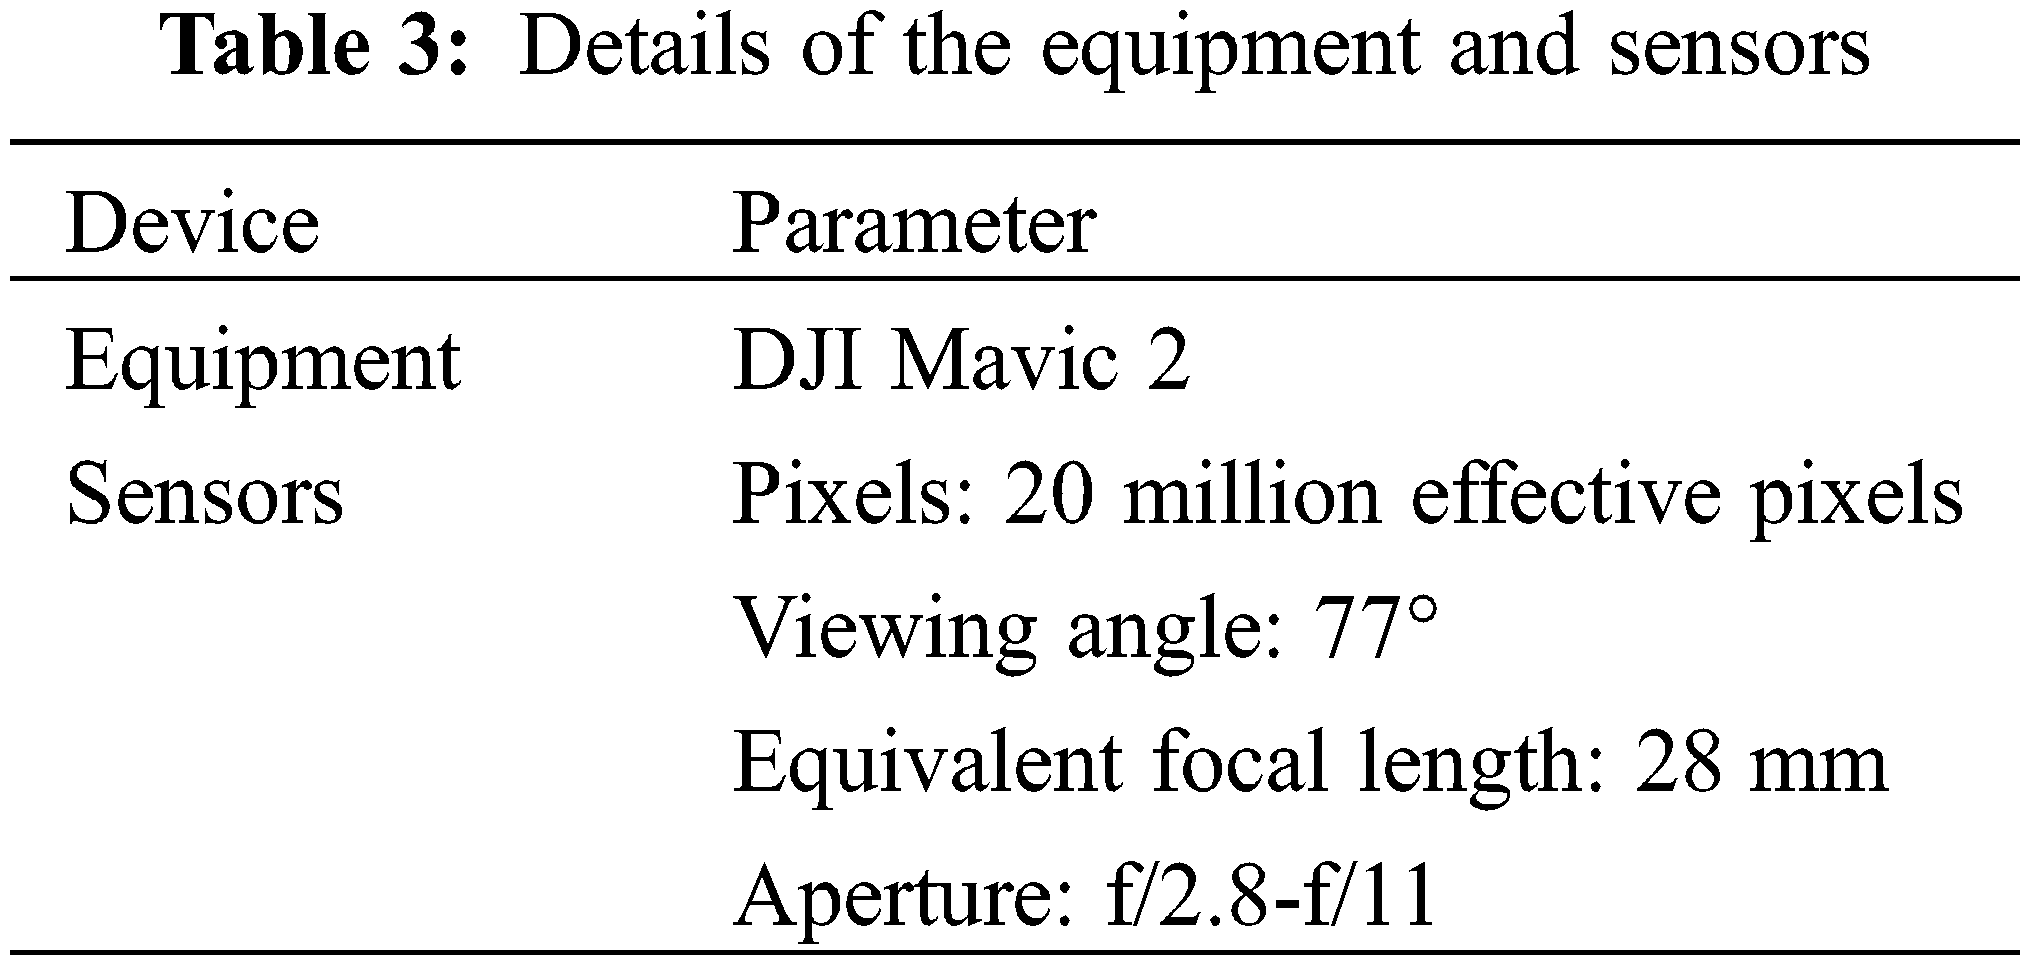
3.1.2 Acquiring and Processing Unmanned Aerial Vehicle Data
To obtain the interpretation samples of the study area and verify the results, on July 17, 2020, we flew a multi-rotor unmanned aerial vehicle (UAV; Mavic 2, DJI, Shenzhen, China) (Table 3) over the study area 14 days after the satellite transit. Using the video taken by the UAV, ground feature samples were sketched on remote sensing images, including early and late season rice, forest, water, lotus fields, and artificial surfaces.
3.2 Spectral Analysis of Ground Features
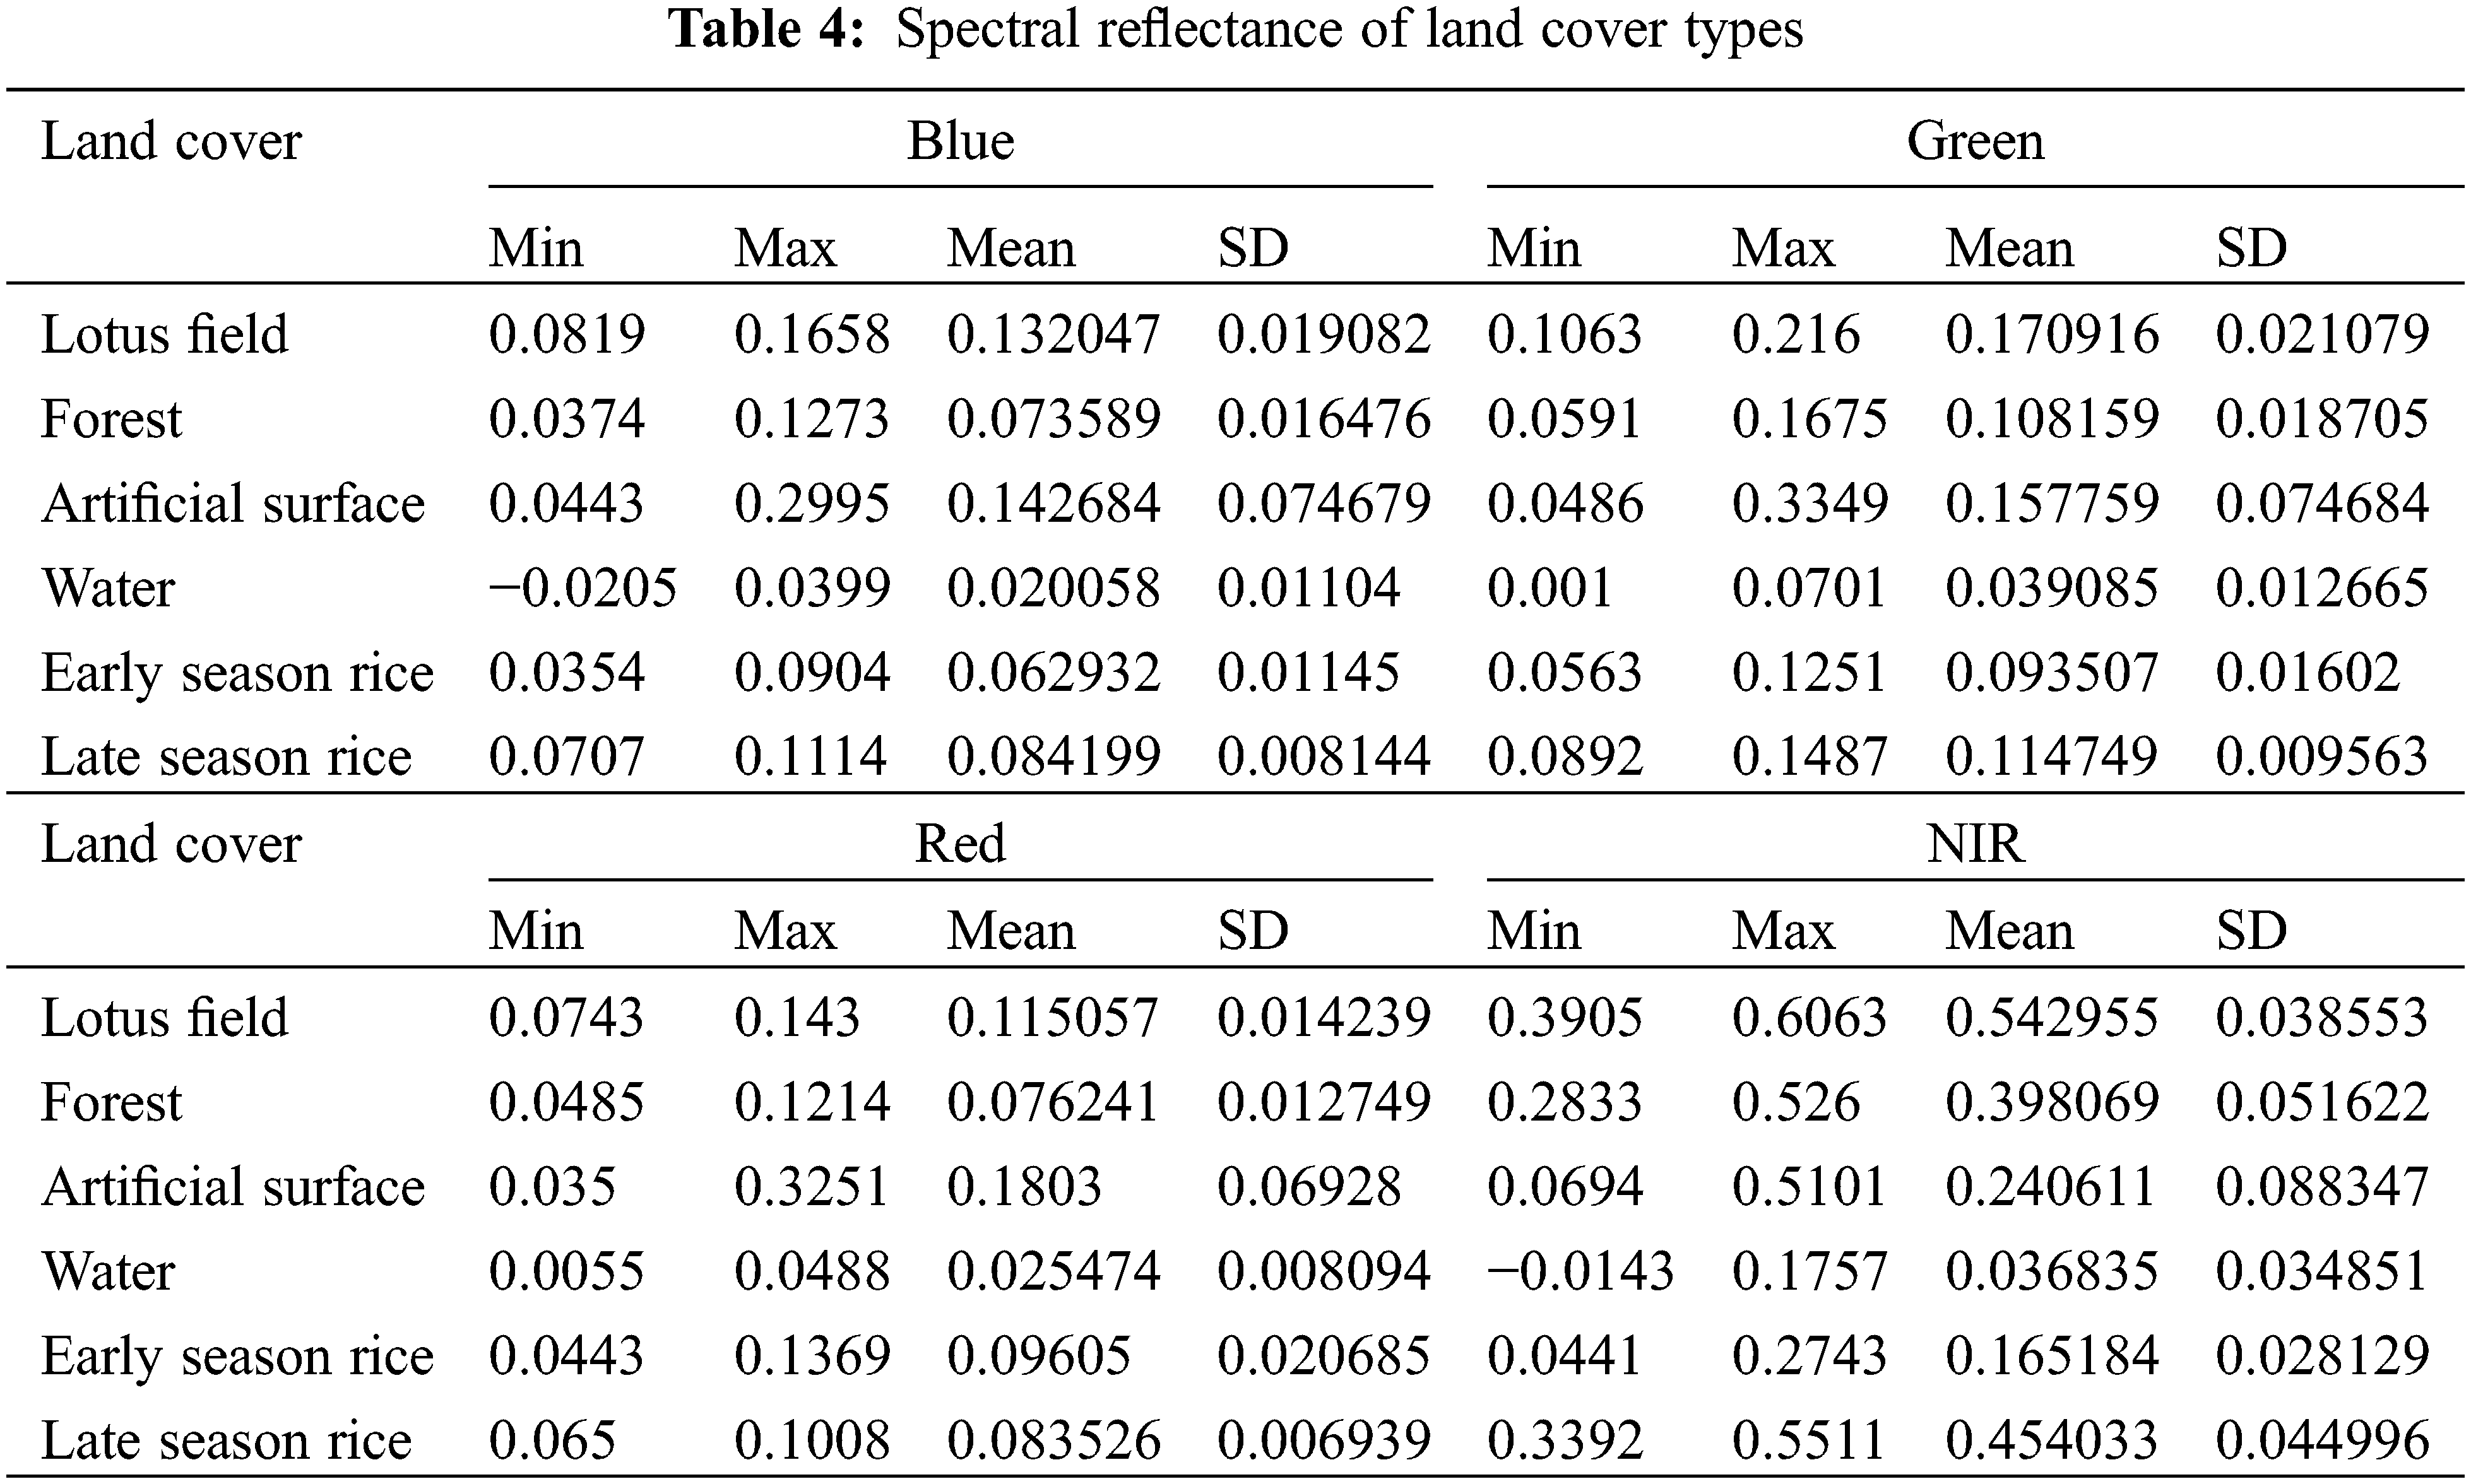
The GF-1 image has only RGB + NIR bands and a panchromatic one used for pan-sharpening. The spectral features have the phenomenon of “same spectrum foreign body, same body different spectrum”. For this reason, we selected only six representative land types for the study. First, through interpretation of the UAV remote sensing image, typical land samples were selected on the GF-1 image. Then, 200 samples were manually selected in each sample area. The reason for manually selecting sample points was to ensure that the selected samples were pure pixels; thus, the spectral reflectivity curve of each sample was drawn according to the average reflectivity of 200 pure pixels. The spectral reflectance curves of the sample points are shown in Fig. 2.
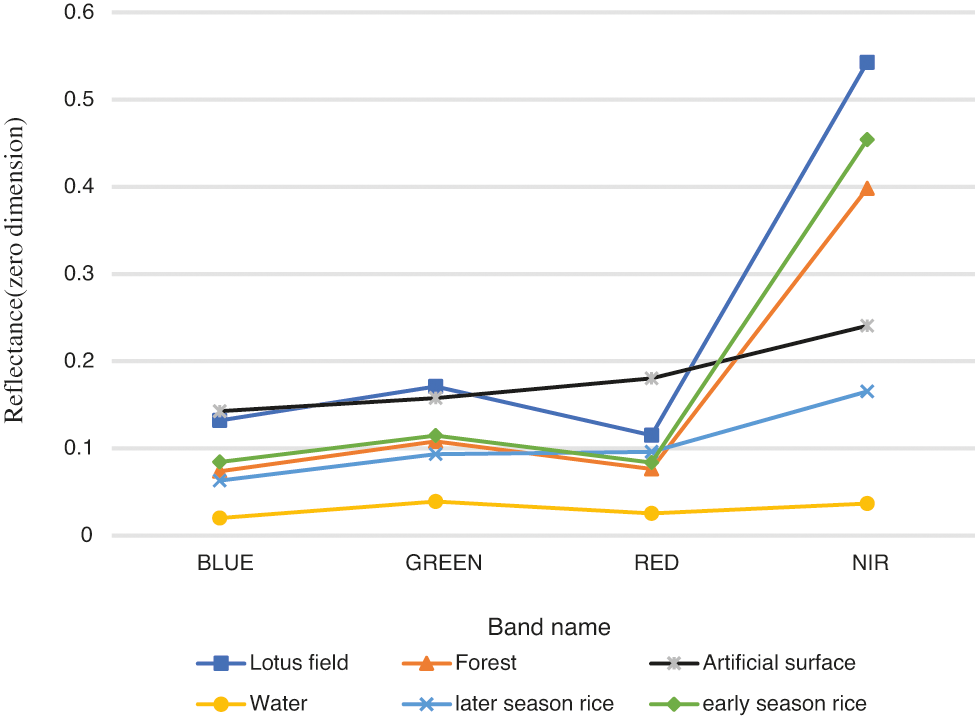
Figure 2: Spectral characteristics of the land cover
The following can be discerned from Fig. 2 and Table 4:
(1) The difference of spectral reflectance of all land types is the largest in the near infrared band.
(2) The spectral characteristics of lotus fields, forest, and early season rice are similar and nearly parallel, but the reflectance of lotus fields is higher than the reflectance of the other two. Reflection peaks occur in the green and near-infrared bands, and reflection valleys occur in the blue and red bands.
(3) The artificial surface and late season rice show an upward trend from band 1 to band 4 (blue, green, red, near infrared, respectively), there are no obvious reflection valleys, and the reflectivity of artificial surface is significantly higher than the reflectivity of late season rice.
(4) Water has the lowest reflectivity among all land types, which is an almost horizontal line. Among all land types, only the average reflectivity of water is lower in the near infrared band than in the green band.
3.3 Mathematical Model Construction
3.3.1 Separation of Non-Vegetation Information
Using the spectral reflectance characteristics of the features, a mathematical model for separation of non-vegetation information was constructed:
In formula (2),
3.3.2 Enhancement of the Difference between Lotus Fields and Other Land Types
The second step is to calculate F2 to enhance the differences between lotus fields and other vegetation types, such as forest or early season rice.
In the formula (3),
In the reflectance spectra, as for vegetation, Bgreen and Bnir are reflection peaks, and Bred is a reflection valley. As the values of Bnir and Bnir − Bred are significantly higher for lotus fields than for forest and early season rice, Bnir × (Bnir − Bred) can enhance the difference between lotus fields and forest or early season rice. Bred has the smallest standard deviation (SD) and best convergence for all land types. In addition to stabilizing the calculation results, the value of 1 − Bred is smaller for lotus fields than for forest or early season rice; therefore, the denominator of the formula increases the gap between lotus and other land types.
3.3.3 Further Separation Using NDVI Values
Different types of features and features with different vegetation coverage often show different NDVI values, so the NDVI is often used for extracting vegetation.
In formula (4), Bred and Bnir are the spectral reflectance of red and near infrared bands of the GF-1 remote sensing image. In formula (5),
The purpose of the calculation above is to extract lotus fields, by suppressing the features of spectral reflectance that are quite different from the features of lotus field and by calculating the transformation to increase the difference for the features similar to those of lotus field. According to the calculation results of F1, a grayscale image in which the target value is 1 and the background value is −1 is obtained. From the results of the second step and the third step, F2 and F3, respectively, a grayscale image with continuous value can be obtained. We can determine the range of the target result by defining the appropriate threshold value of the grayscale plot. According to the method proposed by Prewitt in 1996, if there are obvious or relatively close bimodal peaks on a grayscale histogram, the gray level threshold corresponding to the bottom of the valley between the two peaks is selected; one peak is the target class, and the other is the background value [34,35]. If there is no obvious valley in the histogram, the Otsu algorithm proposed by Nobuyuki in 1979 can be used to determine the threshold quickly and effectively [36,37]. The threshold is determined by calculating the variance between the target feature and background, and the value with the greatest difference between classes is the optimal threshold [38,39].
We used the preprocessed GF-1 remote sensing image to calculate the result of F1 using ENVI software and obtained a grayscale image, shown in Fig. 3. The grayscale image contains two values, 1 and −1, where 1 is the target value, and the area of −1, which is mainly non-vegetation information, is the background that needs to be suppressed. We converted −1 to 0, and derived a binarized result layer containing only the values of 0 and 1.
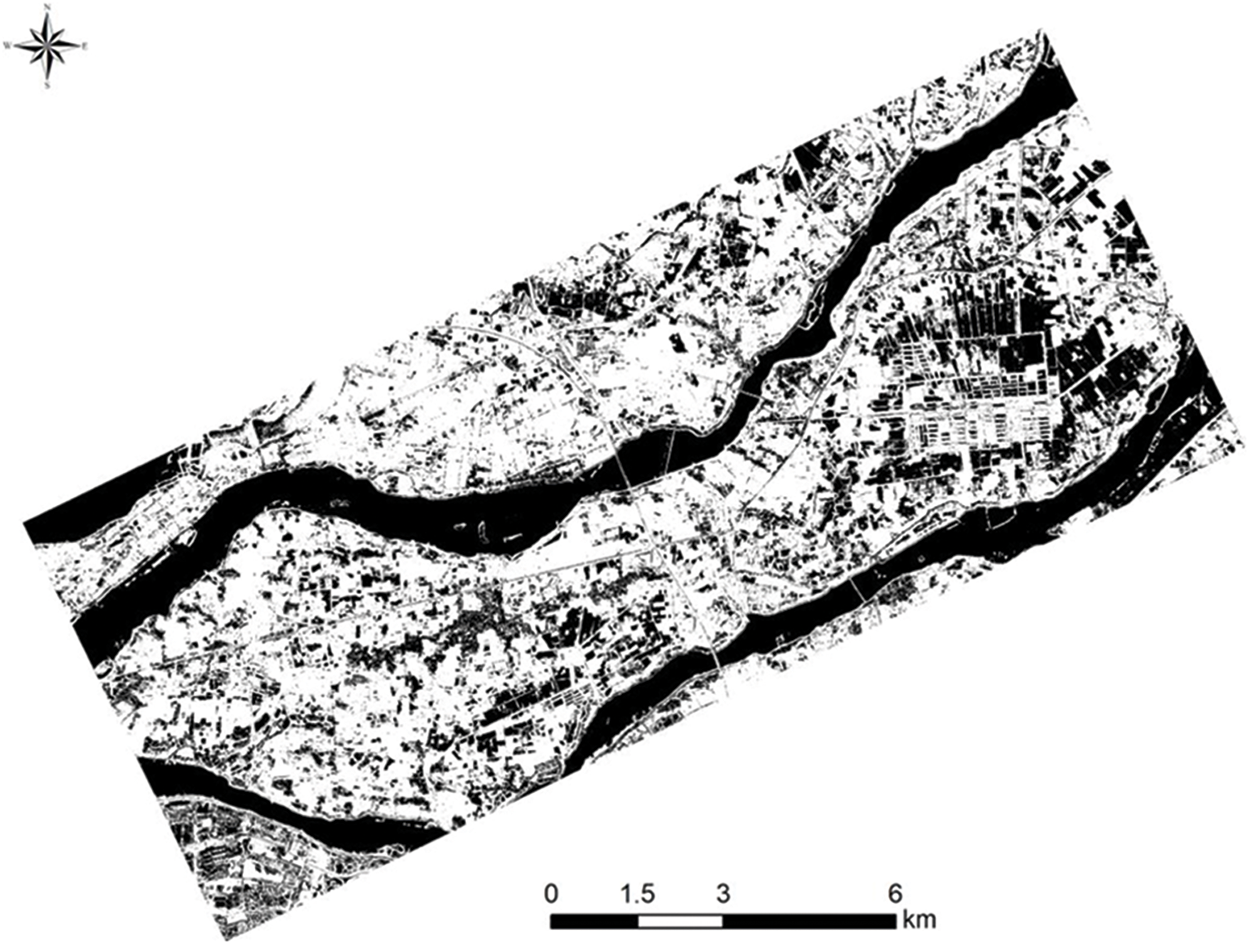
Figure 3: The binarized result of F1
Next, we calculated F2 and obtained a grayscale image, ranging from-0.05 to 0.2. If we count the histogram of the pixels, the lotus field information is obscured by other land types; therefore, we used sample points for statistics and analysis. The gray-level histogram image of the result, as shown in Fig. 4, has 3 peaks. We set the separation threshold at each valley, and then established four regions: I (−0.050 to −0.008), II (−0.008 to 0.020), III (0.020 to 0.068), and IV (0.068 to 0.20). Then we classified and analyzed the results of the four regions. The results showed that region I is mainly uncovered surface, region II is mainly water, artificial surface, and a portion of later season rice, region III is mainly early rice and forest, and region IV is mainly lotus field , a portion of grassland and a portion of early season rice with spectra similar to the spectrum of lotus field. Therefore, region IV is the target that contains lotus field. The calculation result of F2 was processed as a binary result for later subsequent calculation, in which region IV is turned to 1 and the others are turned to 0, as shown in Fig. 5.
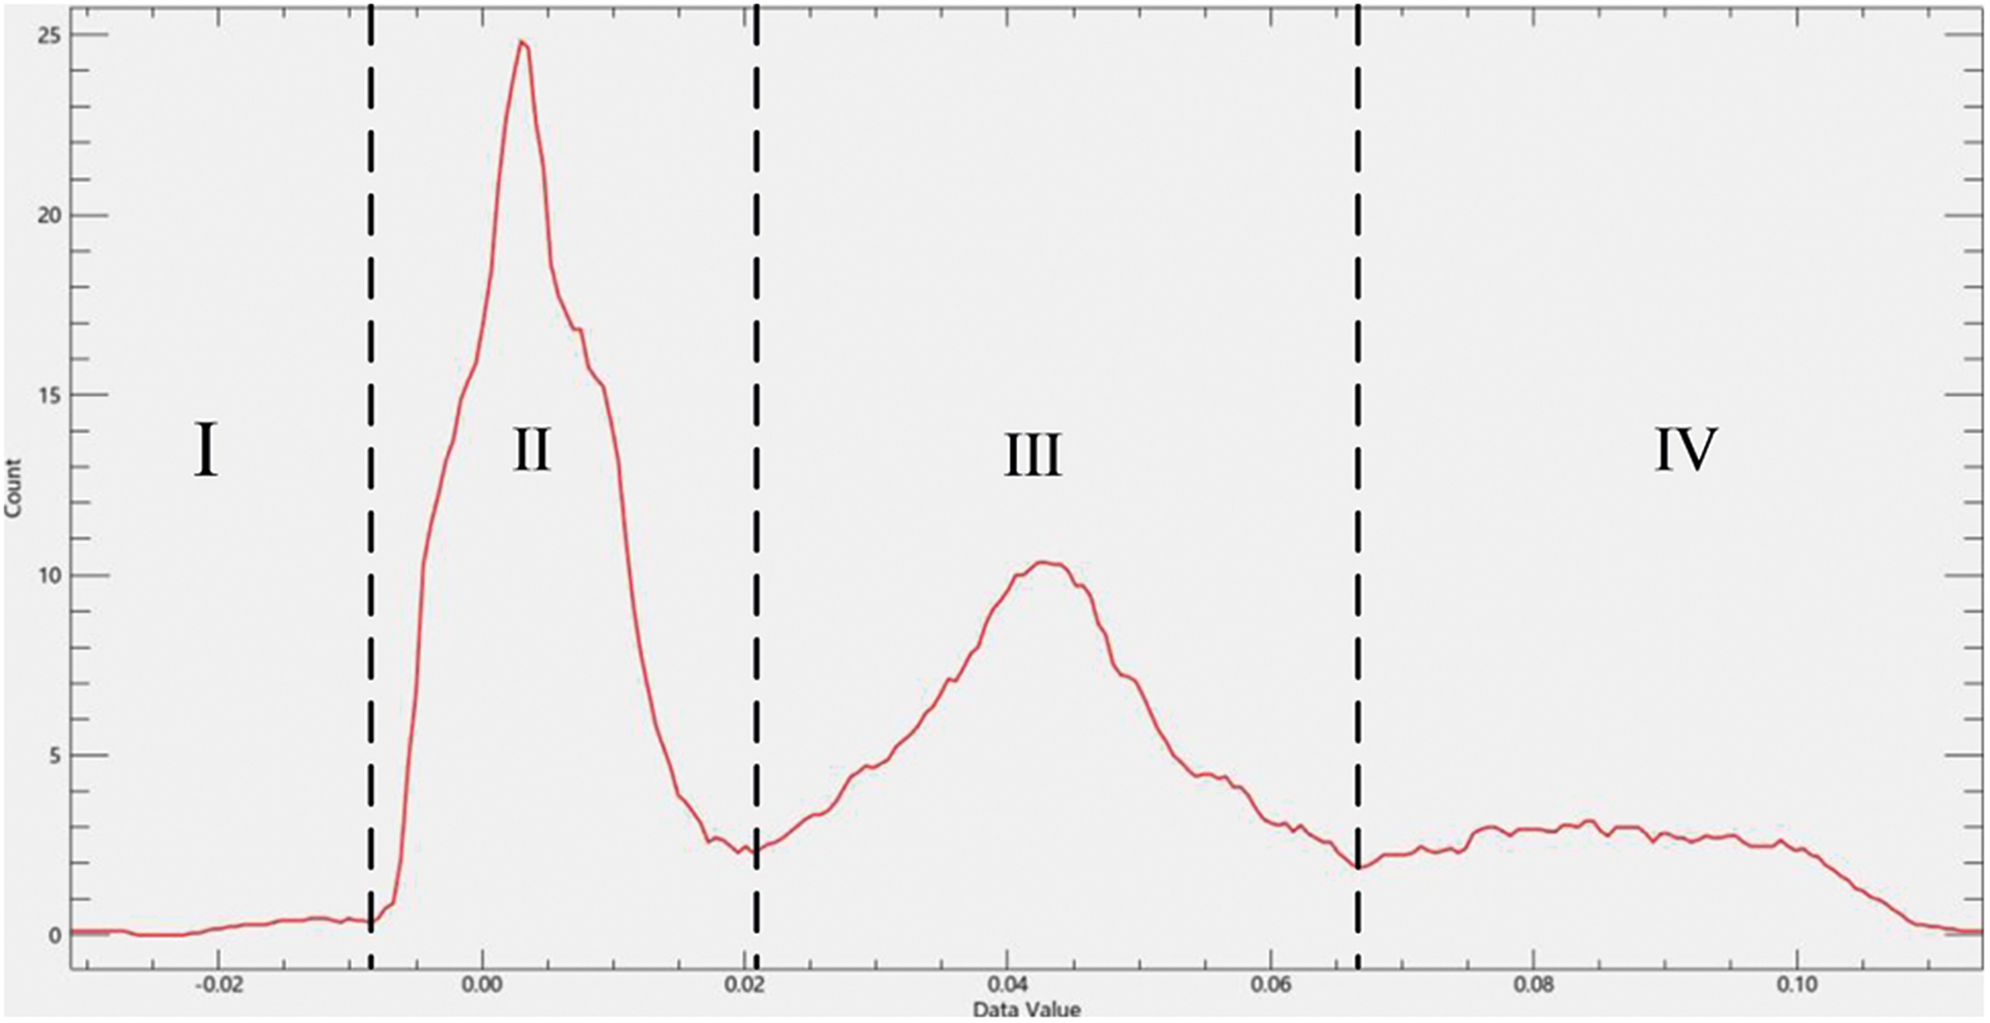
Figure 4: Gray-level histogram image of the result of F2
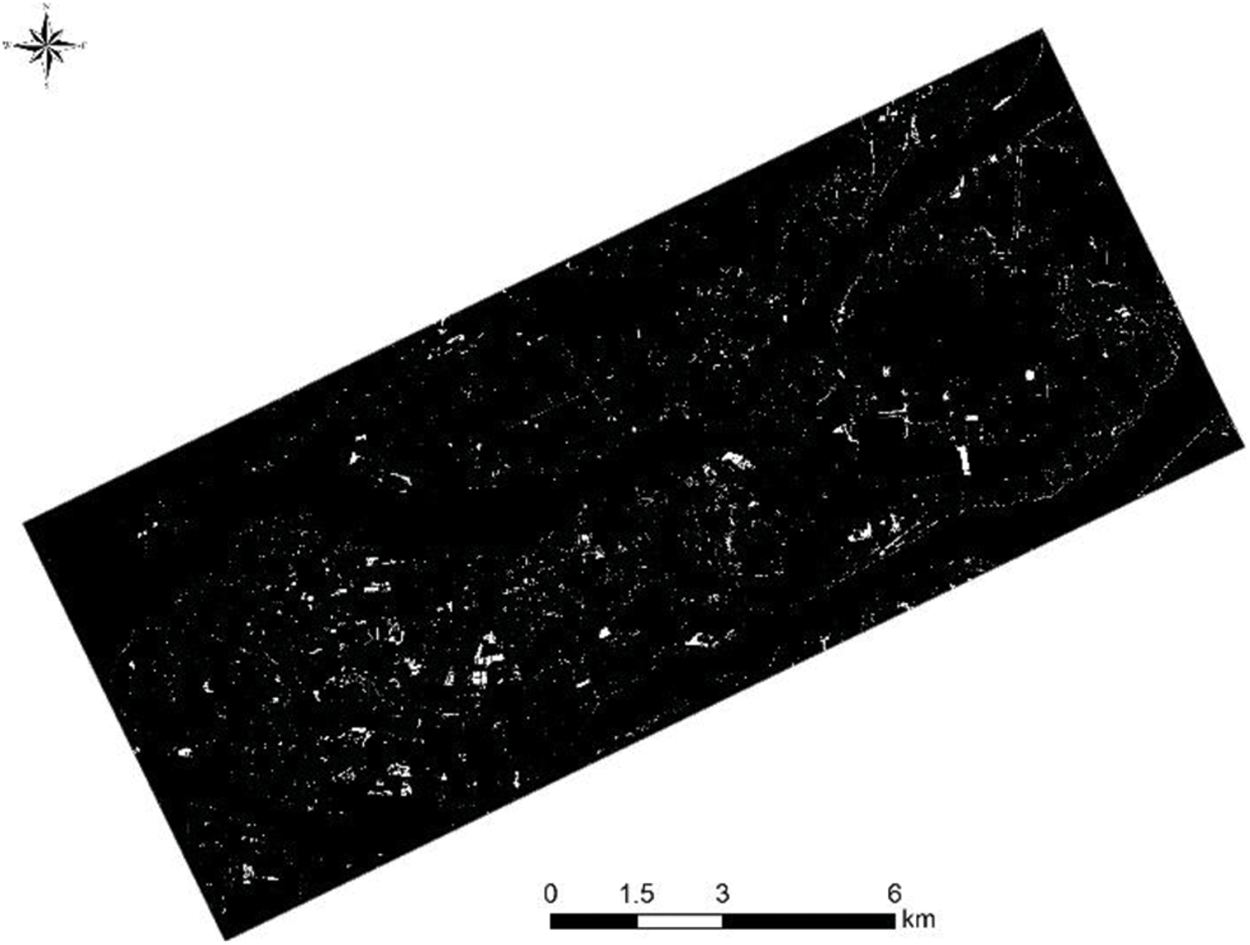
Figure 5: The binarized result of F2
We used the NDVI to separate lotus field from grassland and early season rice. We used ENVI software to calculate the results,
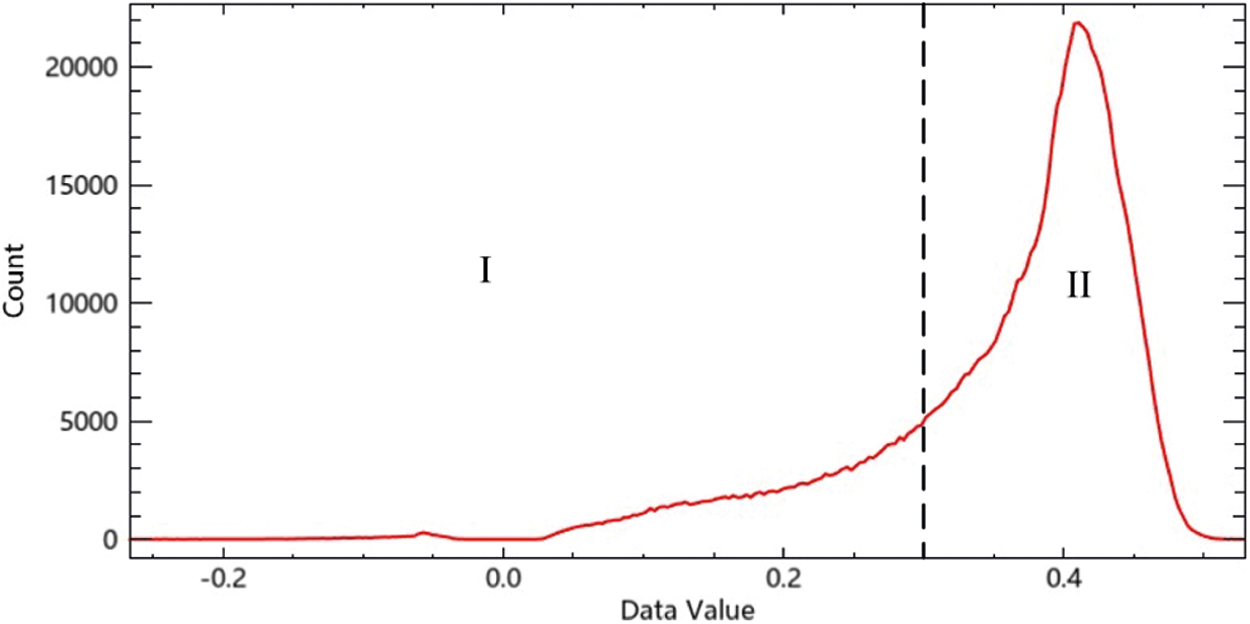
Figure 6: Gray-level histogram image of the result of F3
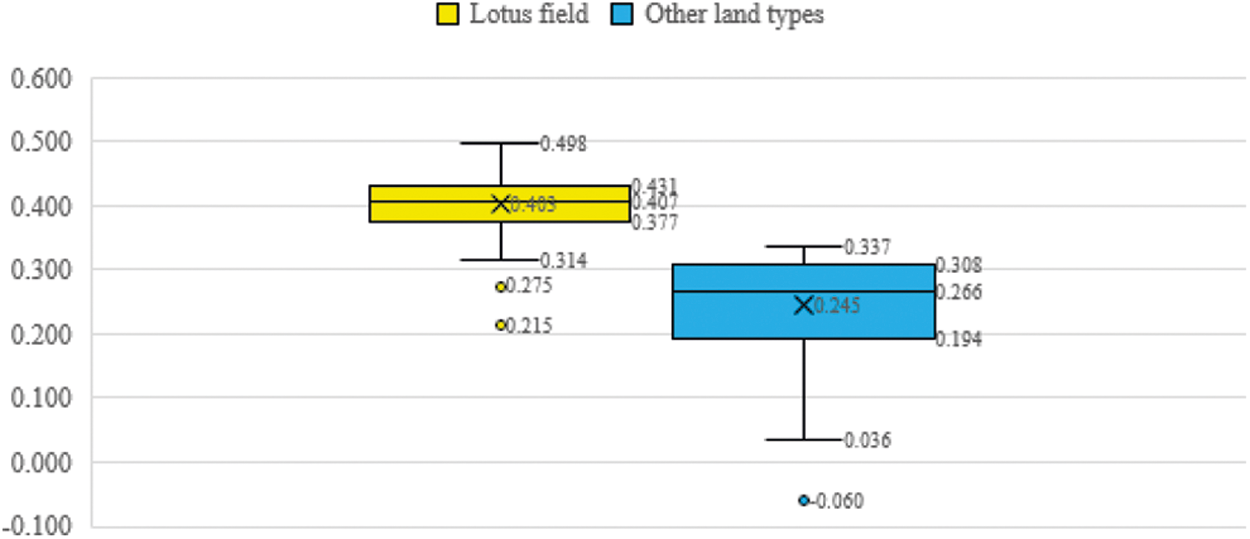
Figure 7: Sample statistical box-plot diagram of F3 calculation results
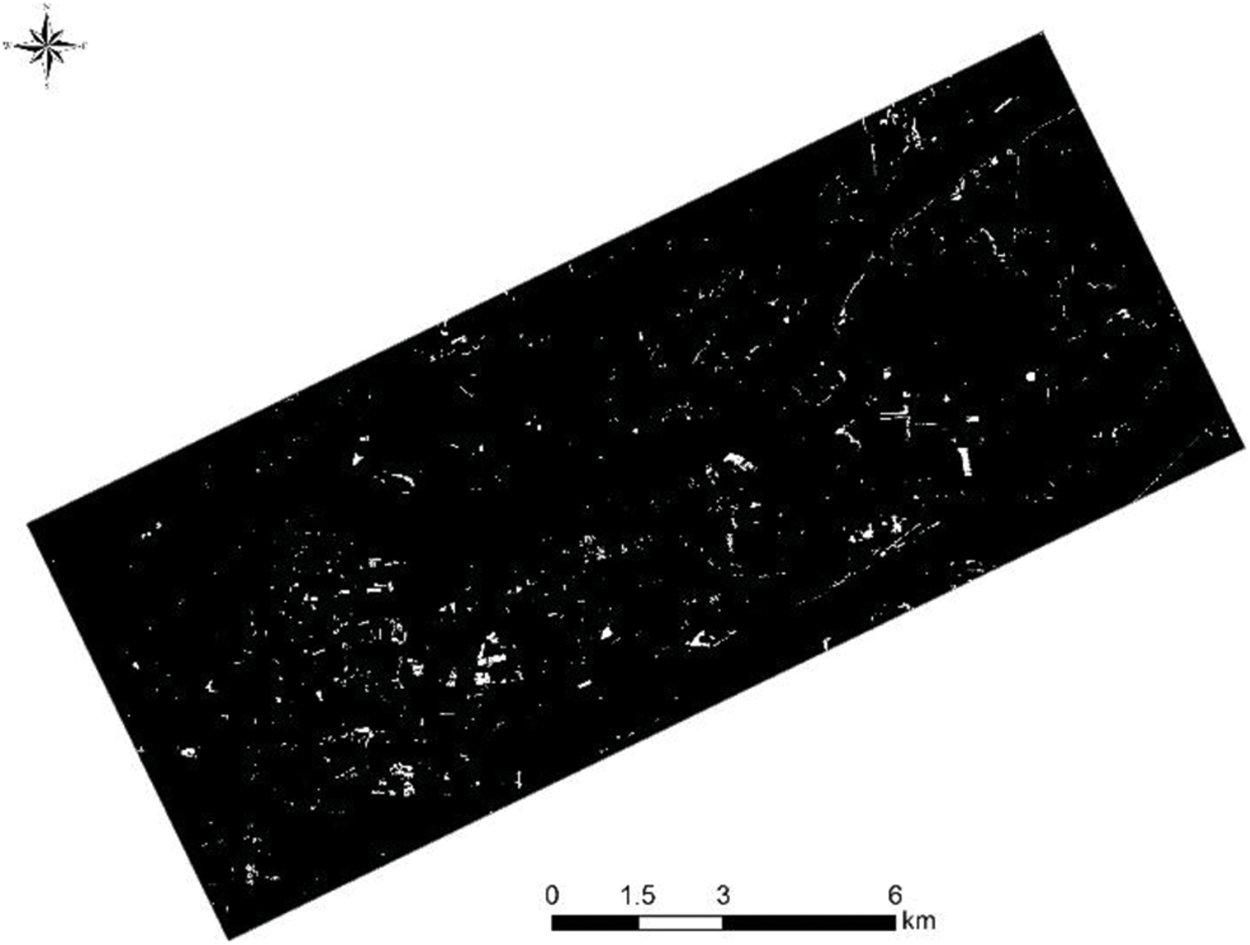
Figure 8: The binarized result of F3
Using the value of F3, we constructed a decision tree in the ENVI modeler to extract lotus fields and subjected the results to majority and clump cluster sieve analysis. The extraction results for lotus fields are shown in Fig. 9.
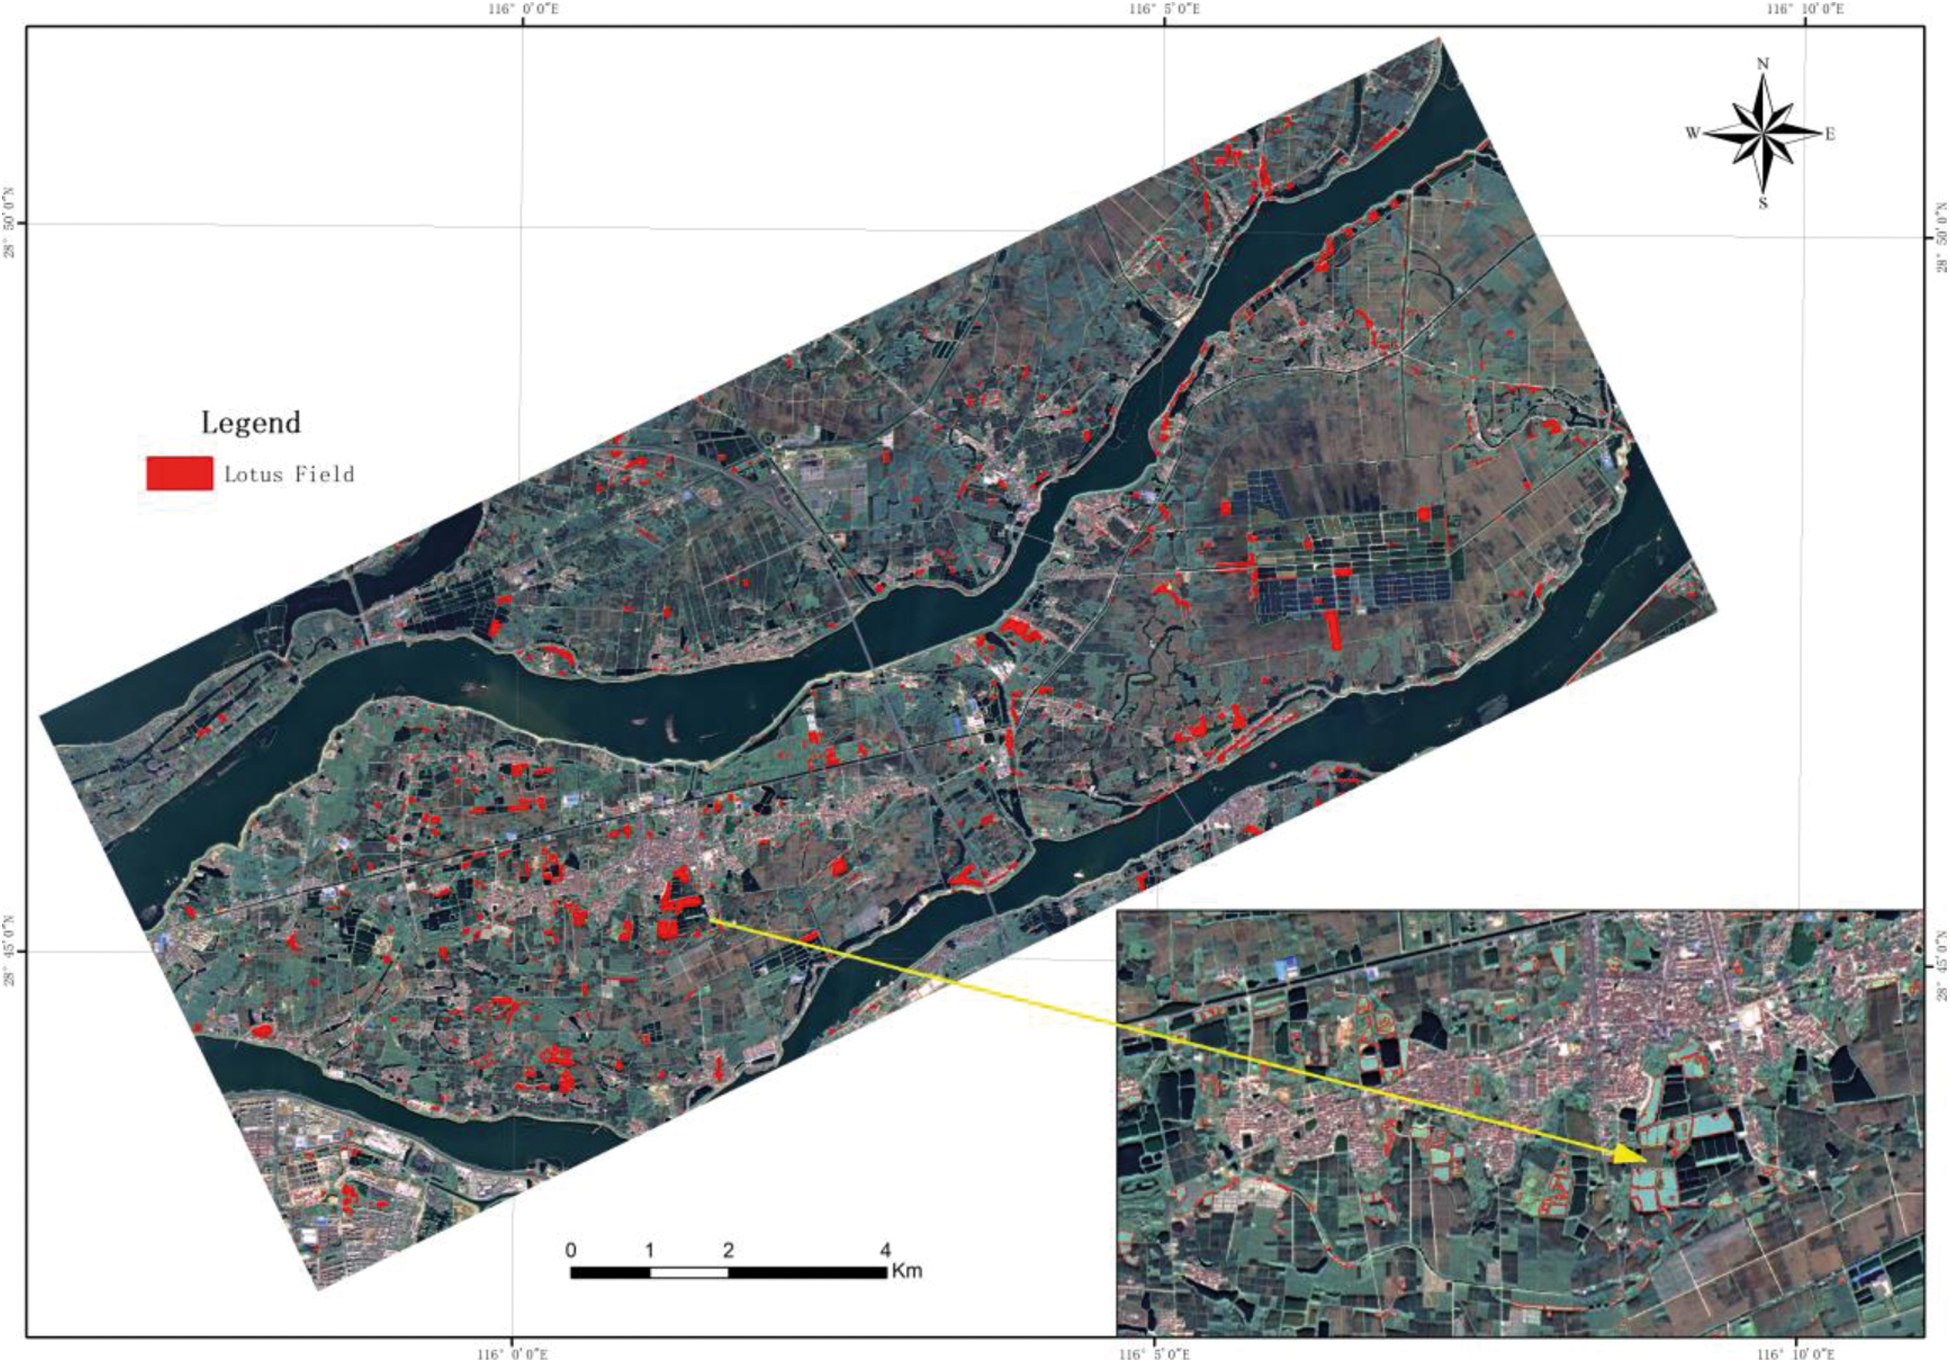
Figure 9: The extraction results for lotus fields
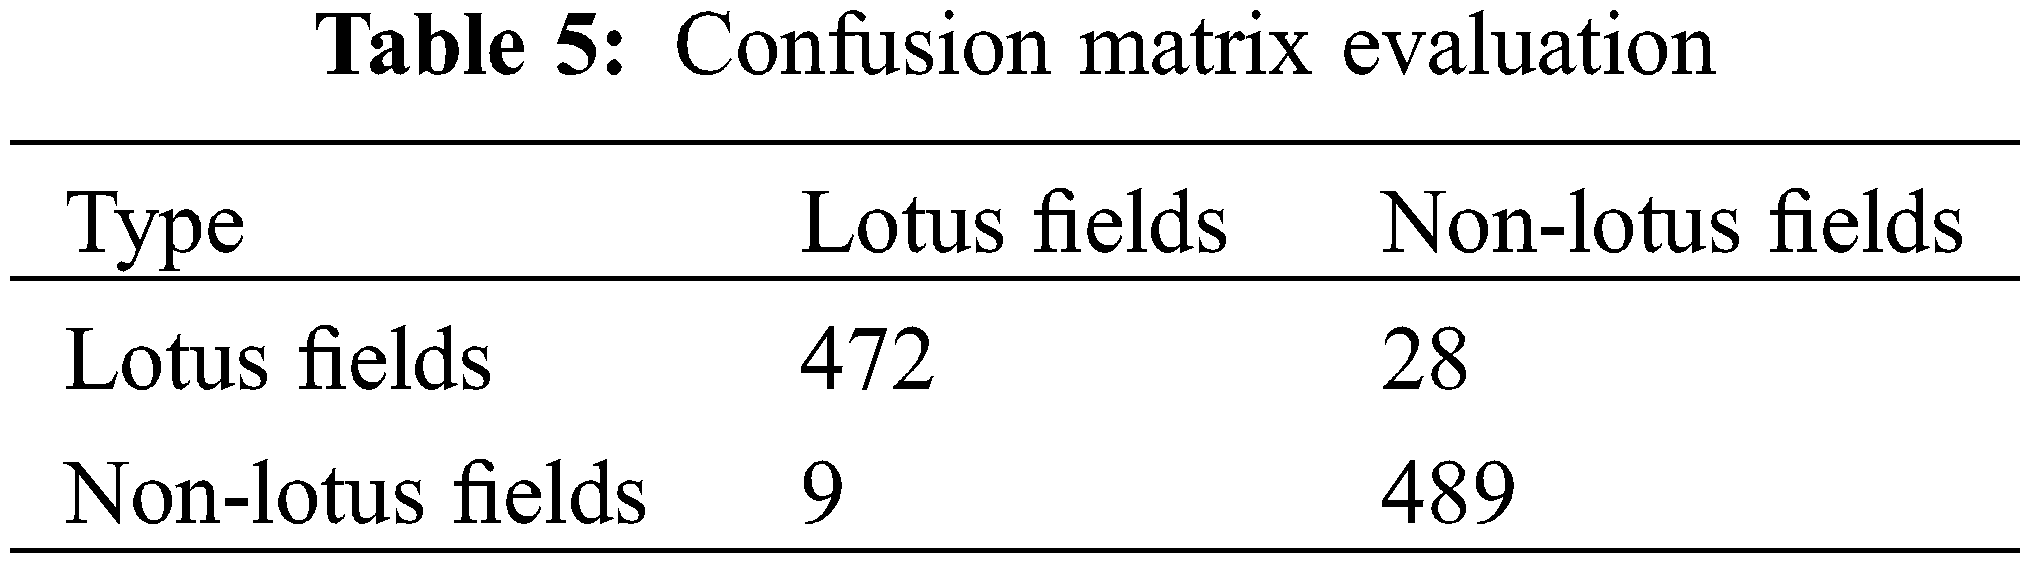
To evaluate the accuracy of the lotus field extraction, we used a UAV to photograph the study area, drew the vector range of the lotus fields, used the create random points function in ArcGIS to create 500 sample points randomly in both lotus and non-lotus fields to verify the extraction results, and replaced the duplicate sample points with training sample points. We then used a confusion matrix (Table 5) to evaluate the accuracy of the results. The overall accuracy of the classification was 96.3%, with a kappa coefficient of 0.926.
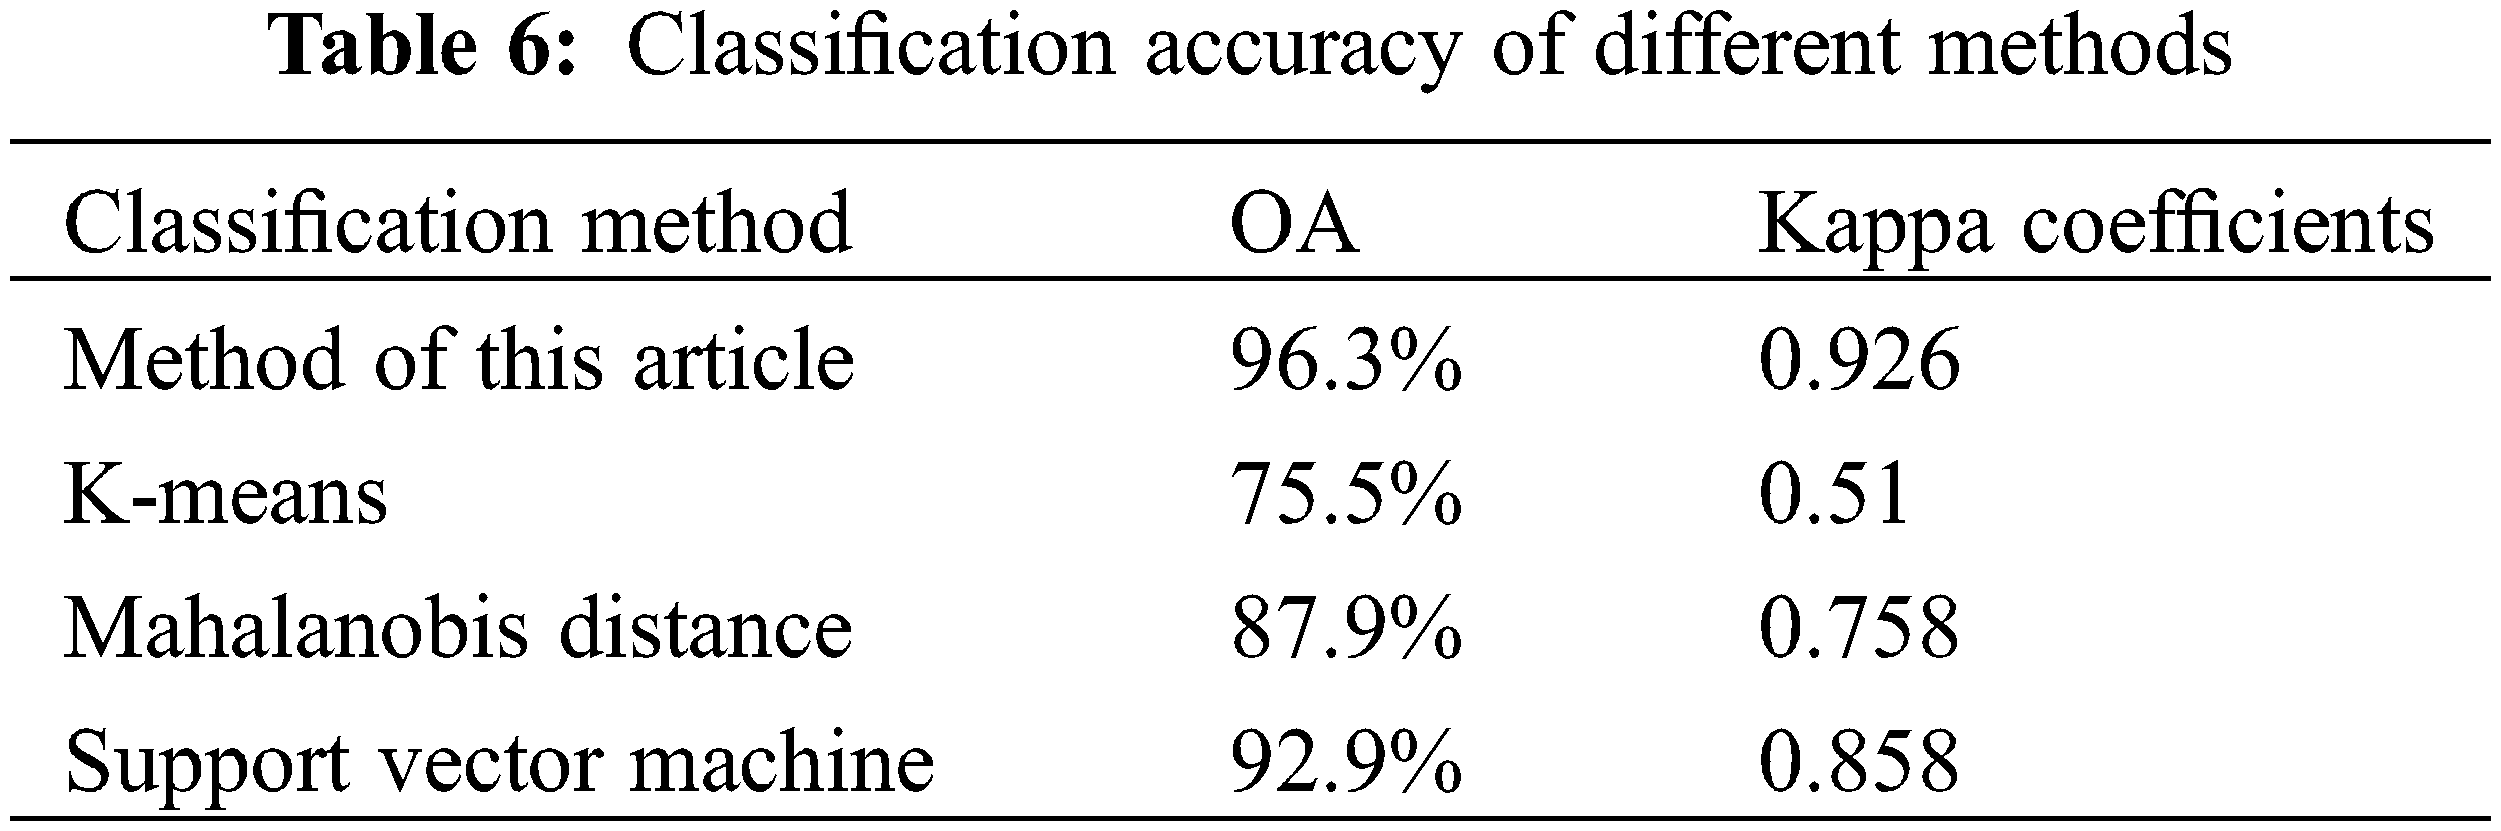
We compared the extraction results for lotus fields with the results of K-means classification, Mahalanobis distance, and support vector machine algorithm analyses. The extraction accuracies of these methods (Table 6) were 75.5%, 87.8%, and 92.9%, respectively, and the kappa coefficients were 0.51, 0.758, and 0.858, respectively. Therefore, our model had the greatest accuracy.
Remote sensing has played an increasingly important role in ground feature extraction and monitoring since the launch of various satellites. Specific crops can be monitored for the development of precision agriculture. This can be conducted using two standard methods: constructing a model after extracting ground features from hyperspectral images based on the relationship between remote sensing images and specific ground features, as well as by extracting features based on the seasonal differences in the ground features of different crops from remote sensing images. These two types of method are highly accurate for feature extraction, but they have some limitations. The resolution of hyperspectral data is usually low, and the extraction accuracy is not sufficiently high for small sporadically distributed features, such as lotus fields in precision agriculture. Moreover, it is difficult to obtain multi-period, high-precision, high-quality optical remote sensing image data in cloudy areas, and the combination of multi-temporal remote sensing images and vegetation growth phenology is also not necessarily applicable. Therefore, it is important to make full use of single-season images to extract specific features in specific areas with higher accuracy. The method used to construct our model can serve as a reference for other minor crops.
Although the experiment demonstrated high classification accuracy, some misclassifications could not be resolved. We extracted and analyzed the image data that were incorrectly classified as lotus field. The incorrect classification areas were some portions of grass growing in water and aquatic plant wetlands, which have the same spectral and textural information as lotus field. Although the proportions of these categories in the image was not high, they can greatly affect the accuracy of the image classification, especially for large areas of wetlands. Therefore, the applicability of our method could be affected.
To test the accuracy and robustness of the lotus field extraction method further, we transferred it to the GF-1 remote sensing image of April 28, 2020. During this period, lotus leaves had emerged, but their growth was worse than in July, and the early season rice was still in its seedling stage. We tested in two areas. As shown in Fig. 10, area I contained a large area of wetlands (green represents wetland vegetation in the true color remote sensing image), but area II did not. We used the three-step lotus field extraction method for the test. The results showed that the correct extraction accuracy of lotus field in area I was only 62%, with a kappa coefficient of 0.086, whereas the extraction accuracy of lotus field in area II was as high as 95.5%, with a kappa coefficient of 0.91. Therefore, the method used in this research to extract lotus field has high extraction accuracy in non-wetland, areas but that there are limitations in areas containing large wetland areas with vegetation. To explore the lotus field extraction in large wetland areas, we incorporated texture features into an auxiliary analysis. We used the occurrence measures tool in ENVI software to calculate four texture feature types, i.e., data range, mean, variance, and entropy. The value of the variation greatly improved the classification accuracy. The correct extraction accuracy of lotus field increased from 62% to 83.3%, and the kappa coefficient increased from 0.086 to 0.666.
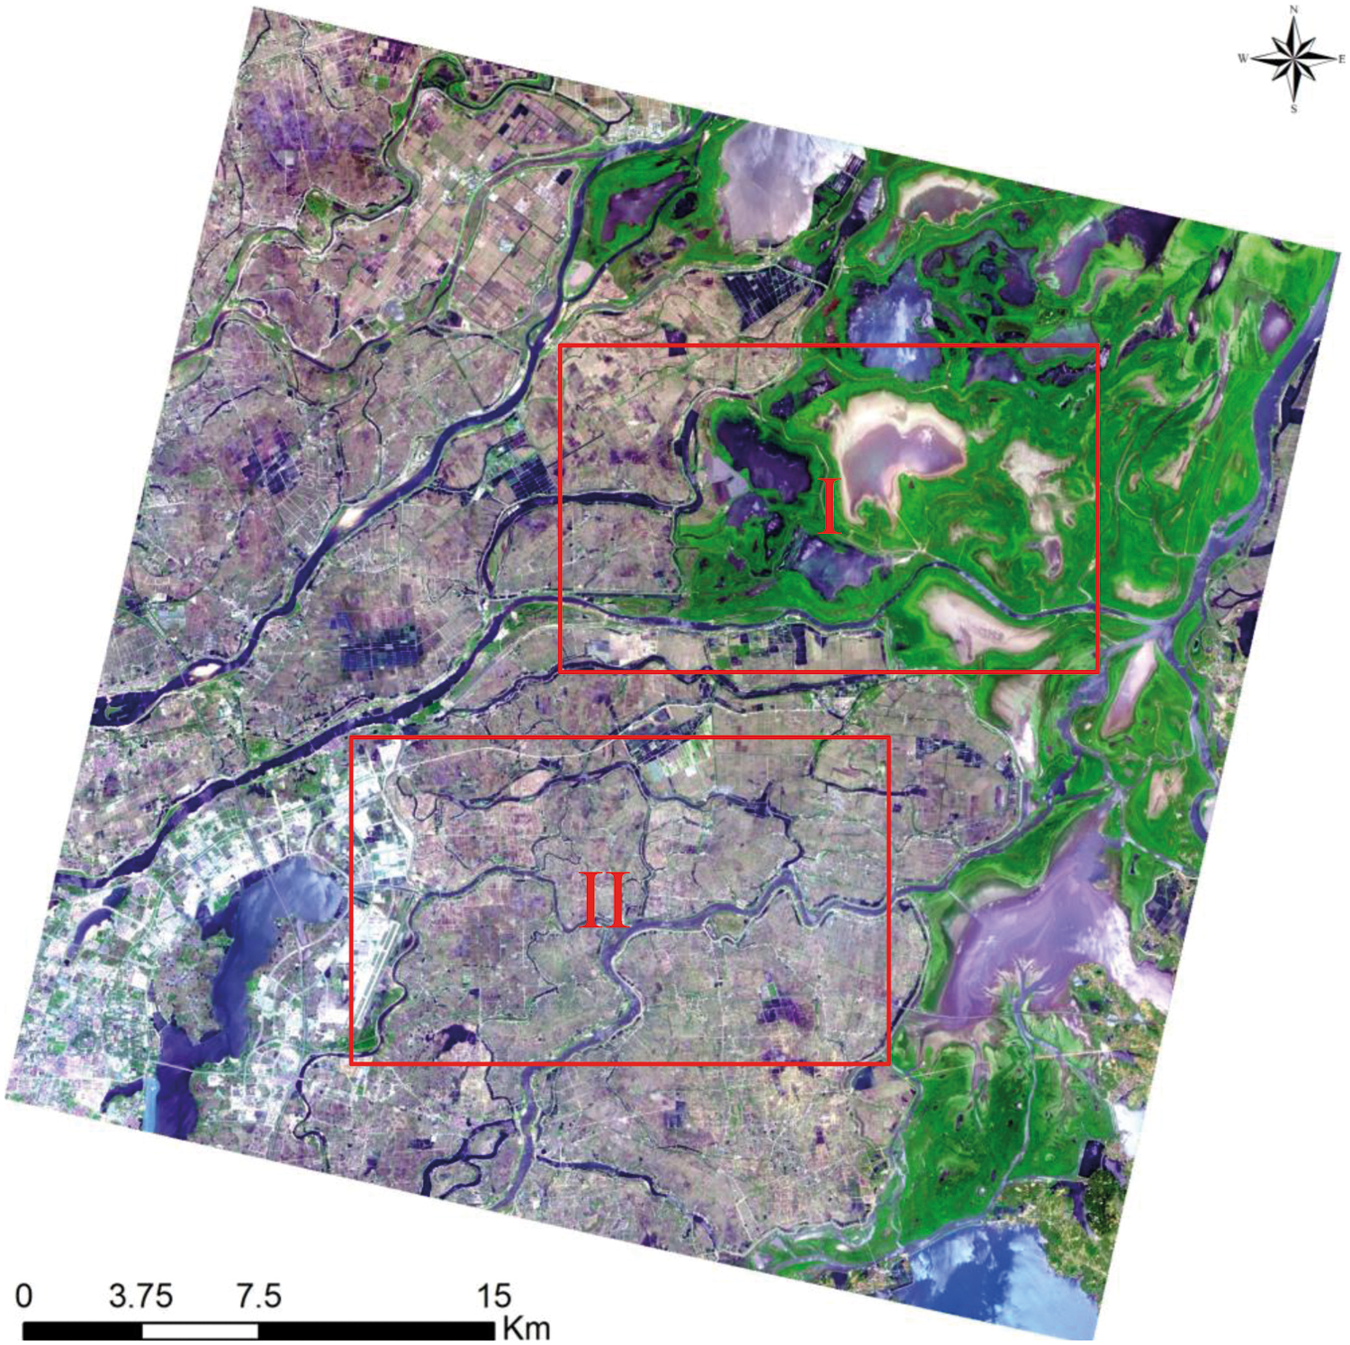
Figure 10: The testing area of the GF-1 remote sensing image
This study proposes a new method for extracting lotus fields from GF-1 satellite remote sensing data, by analyzing the spectral characteristics of different land types, suppressing background information, increasing the difference between target and non-target features, and setting a threshold to extract target information. The extraction of lotus fields had an accuracy of 96.3% and kappa coefficient of 0.926, which were better than those of the traditional unsupervised K-means classification, a supervised classification maximum likelihood method, and the Mahalanobis distance method. This method enables the extraction of fragmented land types under the requirements of precision agriculture when it is not convenient to use multi-temporal remote sensing images in cloudy and rainy areas. However, the method is not applicable in areas containing large wetland area with vegetation. Nonetheless, despite the limitations of the method in these areas, the accuracy can be improved by adding texture information. Solving this problem of wetland vegetation will be a focus of our subsequent research. The mature research method will be highly applicable to the monitoring of lotus field. Monitoring results obtained through many years can facilitate analysis of the changing trends of lotus field planting area.
Funding Statement: This work was supported in part by the National Natural Science Foundation of China under Grants 31660140 and 31560150, in part by the Jiangxi Province 13th Five-Year Social Science Planning Project under Grant 17YJ11, and in part by the Humanities and Social Sciences Planning Project of Colleges and Universities in Jiangxi Province under Grant GL17113.
Conflicts of Interest: The authors declare that they have no conflicts of interest to report regarding the present study.
1. Oh, S., Yu, J., Kim, H., Oh, K., Eun, J. (2011). Effects of white lotus extracts on sleeping, chloride influx, and oxidation. Food Science and Biotechnology, 20(4), 949–954. DOI 10.1007/s10068-011-0131-5. [Google Scholar] [CrossRef]
2. Park, Y., Towantakavanit, K., Kowalska, T., Jung, S., Ham, K. et al. (2009). Bioactive compounds and antioxidant and antiproliferative activities of Korean white lotus cultivars. Journal of Medicinal Food, 12(5), 1057–1064. DOI 10.1089/jmf.2009.0018. [Google Scholar] [CrossRef]
3. Guo, H. B. (2009). Cultivation of lotus (Nelumbo nucifera Gaertn. ssp. nucifera) and its utilization in China. Genetic Resources and Crop Evolution, 56(3), 323–330. DOI 10.1007/s10722-008-9366-2. [Google Scholar] [CrossRef]
4. Huang, J., Shi, P. (2021). Regional rural and structural transformations and farmer’s income in the past four decades in China. China Agricultural Economic Review, 13(2), 278–301. DOI 10.1108/CAER-11-2020-0262. [Google Scholar] [CrossRef]
5. Weiss, M., Jacob, F., Duveiller, G. (2020). Remote sensing for agricultural applications: A meta-review. Remote Sensing of Environment, 236(5), 111402. DOI 10.1016/j.rse.2019.111402. [Google Scholar] [CrossRef]
6. Wagner, M. P., Oppelt, N. (2020). Extracting agricultural fields from remote sensing imagery using graph-based growing contours. Remote Sensing, 12(7), 1205. DOI 10.3390/rs12071205. [Google Scholar] [CrossRef]
7. Rafael Jiménez-Lao, F. J. A., Nemmaoui, A., Aguilar, M. A. (2020). Remote sensing of agricultural greenhouses and plastic-mulched farmland: An analysis of worldwide research. Remote Sensing, 12(16), 2649. DOI 10.3390/rs12162649. [Google Scholar] [CrossRef]
8. Lanya, I., Subadiyasa, N. N., Sardiana, K., Adi, G. P. R., Gunasih, M. T. (2019). Remote sensing and GIS applications for sustainable food agricultural land mapping and supporting the preparation of regional spatial plans (case study of badung regency). IOP Conference Series: Earth and Environmental Science, 284(1), 12001. DOI 10.1088/1755-1315/284/1/012001. [Google Scholar] [CrossRef]
9. Li, J. (2020). Research on the government’s improvement of agricultural statistics investigation under the background of big data (Master Thesis). Guangxi Normal University, Guilin, China. [Google Scholar]
10. Huang, Y., Chen, Z., Yu, T., Huang, X., Gu, X. (2018). Agricultural remote sensing big data: Management and applications. Journal of Integrative Agriculture, 17(9), 1915–1931. DOI 10.1016/S2095-3119(17)61859-8. [Google Scholar] [CrossRef]
11. Jo, H. W., Lee, S., Park, E., Lim, C. H., Lee, W. K. (2020). Deep learning applications on multitemporal SAR (Sentinel-1) image classification using confined labeled data: The case of detecting rice paddy in South Korea. IEEE Transactions on Geoscience and Remote Sensing, 58(11), 7589–7601. DOI 10.1109/TGRS.36. [Google Scholar] [CrossRef]
12. Shea, K. O., LaRoe, J., Vorster, A., Young, N., Evangelista, P. et al. (2020). Improved remote sensing methods to detect northern wild rice (Zizania palustris L.). Remote Sensing, 12(18), 3023. DOI 10.3390/rs12183023. [Google Scholar] [CrossRef]
13. Csorba, A., Szegi, T., Fodor, H., Bukombe, B., Uwiragiye, Y. et al. (2019). Characterization of rice agriculture in the southern province of Rwanda by means of microwave remote sensing. Physics and Chemistry of the Earth, 112, 58–65. DOI 10.1016/j.pce.2019.02.002. [Google Scholar] [CrossRef]
14. Li, F., Zhang, C. M., Zhang, W. W., Xu, Z., Wang, S. et al. (2020). Improved winter wheat spatial distribution extraction from high-resolution remote sensing imagery using semantic features and statistical analysis. Remote Sensing, 12(3), 538. DOI 10.3390/rs12030538. [Google Scholar] [CrossRef]
15. Franch, B., Vermote, E. F., Skakun, S., Roger, J. C., Becker-Reshef, I. et al. (2019). Remote sensing based yield monitoring: Application to winter wheat in United States and Ukraine. International Journal of Applied Earth Observation Geoinformation, 76(1), 112–127. DOI 10.1016/j.jag.2018.11.012. [Google Scholar] [CrossRef]
16. Zhang, M., Zhu, D., Su, W., Huang, J., Zhang, X. et al. (2019). Harmonizing multi-source remote sensing images for summer corn growth monitoring. Remote Sensing, 11(11), 1266. DOI 10.3390/rs11111266. [Google Scholar] [CrossRef]
17. Diao, C. (2020). Remote sensing phenological monitoring framework to characterize corn and soybean physiological growing stages. Remote Sensing of Environment, 248, 111960. DOI 10.1016/j.rse.2020.111960. [Google Scholar] [CrossRef]
18. Peng, C. L., Chu, X. W., Wang, Y. M., Gao, X. (2021). Small target detection algorithm in remote sensing image based on improved yolo. Advanced Manufacturing and Automation X, Germany: Springer. [Google Scholar]
19. NithyaRajan, N. S. P. A. (2014). Aerial remote sensing of peanut ground cover. Agronomy Journal, 106(4), 1358–1364. DOI 10.2134/agronj13.0532. [Google Scholar] [CrossRef]
20. Agüera, F., Aguilar, M. A., Aguilar, F. J. (2006). Detecting greenhouse changes from quick bird imagery on the mediterranean coast. International Journal of Remote Sensing, 27(21), 4751–4767. DOI 10.1080/01431160600702681. [Google Scholar] [CrossRef]
21. Shi, L. F., Huang, X. J., Zhong, T. Y., Taubenböck, H. (2020). Mapping plastic greenhouses using spectral metrics derived from GaoFen-2 satellite data. IEEE Journal of Selected Topics in Applied Earth Observations and Remote Sensing, 13, 49–59. DOI 10.1109/JSTARS.4609443. [Google Scholar] [CrossRef]
22. Wulder, M. A., Masek, J. G., Cohen, W. B., Loveland, T. R., Woodcock, C. E. (2012). Opening the archive: How free data has enabled the science and monitoring promise of landsat. Remote Sensing of Environment, 122, 2–10. DOI 10.1016/j.rse.2012.01.010. [Google Scholar] [CrossRef]
23. Chen, Z., Wang, L., Wu, W., Jiang, Z., Li, H. (2016). Monitoring plastic-mulched farmland by Landsat-8 OLI imagery using spectral and textural features. Remote Sensing, 8(4), 353. DOI 10.3390/rs8040353. [Google Scholar] [CrossRef]
24. Sánchez-Espinosa, A., Der, C. S. (2019). Land use and land cover mapping in wetlands one step closer to the ground: Sentinel-2 versus landsat 8. Journal of Environmental Management, 247, 484–498. DOI 10.1016/j.jenvman.2019.06.084. [Google Scholar] [CrossRef]
25. Sun, C., Bian, Y., Zhou, T., Pan, J. (2019). Using of multi-source and multi-temporal remote sensing data improves crop-type mapping in the subtropical agriculture region. Sensors, 19(10), 2401. DOI 10.3390/s19102401. [Google Scholar] [CrossRef]
26. Youssef, A. M., Abdullah, M. M. A., Pradhan, B., Gaber, A. F. D. (2019). Agriculture sprawl assessment using multi-temporal remote sensing images and its environmental impact; Al-Jouf, KSA. Sustainability, 11(15), 4177. DOI 10.3390/su11154177. [Google Scholar] [CrossRef]
27. Pala, E., Taşdemir, K., Koc-San, D. (2014). Unsupervised extraction of greenhouses using approximate spectral clustering ensemble. 2015 IEEE International Geoscience and Remote Sensing Symposium (IGARSS), pp. 4668–4671. Quebec, Canada. [Google Scholar]
28. Huang, X., Lu, Q., Zhang, L. (2014). A multi-index learning approach for classification of high-resolution remotely sensed images over urban areas. ISPRS Journal of Photogrammetry and Remote Sensing, 90, 36–48. DOI 10.1016/j.isprsjprs.2014.01.008. [Google Scholar] [CrossRef]
29. Aguilar, M. A., Bianconi, F., Aguilar, F. J., Fernández, I. (2014). Object-based greenhouse classification from GeoEye-1 and WorldView-2 stereo imagery. Remote Sensing, 6(5), 3554–3582. DOI 10.3390/rs6053554. [Google Scholar] [CrossRef]
30. Belgiu, M., Drǎguţ, L. (2014). Comparing supervised and unsupervised multiresolution segmentation approaches for extracting buildings from very high resolution imagery. ISPRS Journal of Photogrammetry and Remote Sensing, 96, 67–75. DOI 10.1016/j.isprsjprs.2014.07.002. [Google Scholar] [CrossRef]
31. Jiao, J. P., Li, G. (2021). Beautiful land: A study on the design of the whole-area landscape of lakeside water township–Taking nanchang county as an example. 2021 China Urban Planning Annual Conference and 2021 China Urban Planning Academic Season, pp. 1199–1209. Chengdu, China. [Google Scholar]
32. Wang, Q., Li, J., Jin, T., Chang, X., Zhu, Y. et al. (2020). Comparative analysis of Landsat-8, Sentinel-2, and GF-1 data for retrieving soil moisture over wheat farmlands. Remote Sensing, 12(17), 2708. DOI 10.3390/rs12172708. [Google Scholar] [CrossRef]
33. Du, Y., Zhang, X. Y., Mao, Z. H., Chen, J. Y., (2019). Performances of conventional fusion methods evaluated for inland water body observation using GF-1 image. Acta Oceanologica Sinica, 38(1), 172–179. DOI 10.1007/s13131-019-1382-x. [Google Scholar] [CrossRef]
34. Tobias, O. J., Seara, R. (2003). Image segmentation by histogram thresholding using fuzzy sets. IEEE Transactions on Image Processing, 11(12), 1457–1465. DOI 10.1109/TIP.2002.806231. [Google Scholar] [CrossRef]
35. Aja-Fernandez, S., Hernan Curiale, A., Vegas-Sanchez-Ferrero, G. (2015). A local fuzzy thresholding methodology for multiregion image segmentation. Knowledge Based Systems, 83(C), 1–12. DOI 10.1016/j.knosys.2015.02.029. [Google Scholar] [CrossRef]
36. Otsu, N. (2007). A threshold selection method from gray-level histograms. IEEE Transactions on Systems Man & Cybernetics, 9(1), 62–66. DOI 10.1109/TSMC.1979.4310076. [Google Scholar] [CrossRef]
37. Yue, X., Zhang, H. (2020). A multi-level image thresholding approach using otsu based on the improved invasive weed optimization algorithm. Signal, Image and Video Processing, 14(3), 575–582. DOI 10.1007/s11760-019-01585-3. [Google Scholar] [CrossRef]
38. Xiong, L., Zhang, D., Li, K., Zhang, L. (2020). The extraction algorithm of color disease spot image based on Otsu and watershed. Soft Computing, 24(10), 7253–7263. DOI 10.1007/s00500-019-04339-y. [Google Scholar] [CrossRef]
39. Ta, Y. G., Yazid, H., Safar, M., Saad, F. (2018). Performance analysis of image thresholding: Otsu technique. Measurement, 114, 298–307. DOI 10.1016/j.measurement.2017.09.052. [Google Scholar] [CrossRef]
 | This work is licensed under a Creative Commons Attribution 4.0 International License, which permits unrestricted use, distribution, and reproduction in any medium, provided the original work is properly cited. |