| Phyton-International Journal of Experimental Botany |
DOI: 10.32604/phyton.2022.020100
ARTICLE
Identification of QTLs for Yield and Associated Traits in F2 Population of Rice
1ICAR-Directorate of Onion and Garlic, Rajgurunagar, Pune, Maharashtra, 410505, India
2School of Biotechnology, Sher-e-Kashmir University of Agricultural Sciences and Technology of Jammu, Chatha, 180009, India
3ICAR-National Bureau of Plant Genetic Resources, Pusa Campus, New Delhi, 110012, India
4Department of Bio-Resources, University of Kashmir, Jammu and Kashmir, 190006, India
5Division of Plant Pathology, Sher-e-Kashmir University of Agricultural Sciences and Technology of Jammu, Chatha, 180009, India
6Department of Plant Production, College of Food and Agriculture, King Saud University, Riyadh, 11451, Saudi Arabia
7Department of Genetics and Plant Breeding, Bangladesh Agricultural University, Mymensingh, 2202, Bangladesh
8Graduate School of Integrated Sciences for Life, Hiroshima University, Higashi-Hiroshima, 739-8528, Japan
9Department of Agronomy, Faculty of Agriculture, Kafrelsheikh University, Kafrelsheikh, 33516, Egypt
*Corresponding Authors: Rohini Bhat. Email: rohinibhatbt@gmail.com; Mohammad Anwar Hossain. Email: anwargpb@bau.edu.bd
Received: 04 November 2021; Accepted: 23 February 2022
Abstract: Identification of quantitative trait loci (QTLs) controlling yield and yield-related traits in rice was performed in the F2 mapping population derived from parental rice genotypes DHMAS and K343. A total of 30 QTLs governing nine different traits were identified using the composite interval mapping (CIM) method. Four QTLs were mapped for number of tillers per plant on chromosomes 1 (2 QTLs), 2 and 3; three QTLs for panicle number per plant on chromosomes 1 (2 QTLs) and 3; four QTLs for plant height on chromosomes 2, 4, 5 and 6; one QTL for spikelet density on chromosome 5; four QTLs for spikelet fertility percentage (SFP) on chromosomes 2, 3 and 5 (2 QTLs); two QTLs for grain length on chromosomes 1 and 8; three QTLs for grain width on chromosomes1, 3 and 8; three QTLs for 1000-grain weight (TGW) on chromosomes 1, 4 and 8 and six QTLs for yield per plant (YPP) on chromosomes 2 (3 QTLs), 4, 6 and 8. Most of the QTLs were detected on chromosome 2, so further studies on chromosome 2 could help unlock some new chapters of QTL for this cross of rice variety. Identified QTLs elucidating high phenotypic variance can be used for marker-assisted selection (MAS) breeding. Further, the exploitation of information regarding molecular markers tightly linked to QTLs governing these traits will facilitate future crop improvement strategies in rice.
Keywords: Rice; QTL mapping; linkage map; SSR markers; composite interval mapping; marker-assisted selection
Rice (Oryza sativa L.) belonging to the family Poaceae [1] is an edible starchy cereal grain. Around half of the world’s population, comprising most of East and Southeast Asia, is wholly reliant on rice as a staple food crop, where 95 percent of the rice crop throughout the globe is consumed by humans. Most of the population residing in the developing countries in Asia predominantly depends on rice for the daily requirement of calories. To fulfill the demand by the vigorously growing population in Asia, significant efforts towards the development of high-yielding varieties are required. Conventional methods of crop improvement will fall short to meet the needs of the growing population, therefore advanced approaches like marker-assisted breeding (MAB) look promising to fulfill the gaps. For the efficient utilization of genetic resources through MAB, information about the genomic loci governing the trait is important. The mapping of Mendelian traits is relatively simpler than the complex quantitative traits like yield and yield-related traits. In this regard, mapping approaches like QTL mapping have proven to be efficient in identifying genomic intervals associated with the trait. Enormous genomic information is available for the rice crop allowing researchers to find genes and quantitative trait loci (QTLs) linked to a variety of agronomic, physiological, and morphological aspects. The QTL mapping approaches have been explored in rice to enhance the overall yield stability and potential of rice cultivars in diverse environments [2]. Efficient molecular marker genotyping and precise phenotyping are the two most important factors deciding the effectiveness of the QTL mapping. The advent and convenience of simple sequence repeats (SSRs) have made it possible for rice breeders to perform genotyping with over hundreds of markers covering the entire genome [3].
Yield is a highly complex trait having a high level of environmental effect and is also governed by many small-effect genes [4]. As compared to the yield, yield-related variable traits such as grain size, grains per panicle, thousand-grain weight, and panicle number per plant are relatively easy to study. Understanding of yield components also helps to better design high yielding rice varieties with ideal architecture [5]. Several QTL mappings studies have been performed to identify loci governing yield component traits. However, the genomic location of the identified QTLs depends on the allelic variation that existed in the parental lines. Grain yield, which is a major breeding objective, is controlled by a variety of variables. Seed-setting rate and grain weight are usually the main elements affecting rice grain production, whereas plant height and heading date have an indirect effect. Hundreds of yield-related QTLs have been found in rice so far, however, the assessment and use of yield-positive alleles are still limited [6]. Furthermore, more research into elite genetic resources from a wider spectrum is required. Considering this fact numerous studies have been performed for the same trait but using mapping populations developed using different parental lines.
The F2 population has been utilized in several studies to uncover QTLs with additive and dominant effects across the whole rice genome, as well as to examine the genetic component of rice yield and its components. EP3, APO1, DEP2/EP2, DEP3, SRS3, and GIF1 are a few of the genes that have been successfully recognized and isolated by exploiting F2 populations. In addition, several genes regulating important traits have been cloned through the QTL mapping. Recent reports signify that 20 QTLs that significantly influence paddy grain yield and its other elements, have been successfully replicated with NIL-F2 generation, and 14 additional grain yield QTLs have been confirmed in NILs [7].
Considering the global significance of rice yield, the current research was conducted to identify QTLs for yield and yield-related traits. Total rice yield is majorly determined by various traits such as plant height (PH), number of tillers per plant (TPP), panicle number per plant (PPP), spikelet fertility percentage (SFP), spikelet density (SD), grain width (GW), grain length (GL), yield per plant (YPP) and 1000-grain weight (TGW). In the F2 population derived from the two parental lines, K343 and DHMAS, 30 QTLs were discovered. Furthermore, SSR markers were also used to create a linkage map for all yield-related traits. The molecular markers linked with definitive QTL which are identified for different traits in the present study can be useful for MAS. Chromosomal regions carrying important QTLs identified during the current investigation can be enriched with more markers for high-resolution mapping and reducing genetic background noise. Information about molecular markers tightly linked to the QTLs that control yield traits should greatly accelerate future rice breeding through the rapid generation of improved lines with desired trait improvement in any elite background.
Over a two-year period (2015–16 and 2016–17), the current study was conducted at the Research Farm and the Molecular Laboratory of Rice, School of Biotechnology, SKUAST-Jammu, India.
2.1 Plant Material and Cultivation
An F2 population was created by crossing several rice lines K343 and DHMAS. K343 (a major non-basmati rice cultivar having medium height plant with medium/short & bold grains) is a popular rice cultivar and a high yielding variety of hill region of J&K. It usually takes 100 to 130 days to mature, with an average yield of 5.5–6.0 t/ha. The second parent was DHMAS, a long-grain variety developed at IRRI and CSK HPKV Palampur (HP) using doubled haploid marker-assisted selection (MAS). DHMAS usually takes 120 to 140 days to reach full maturity, because DHMAS is tall, it lodges in heavy soils, resulting in a poor yield. Hence, the cross of these contrasting traits was focused upon and used as a potent technique for detecting novel QTLs for this diverse cultivar combination. At Experimental Farm, parental lines and F2 progenies were sown and transplanted in an augmented design-I (un-replicated design) during Kharif 2016. Rice seedlings were transplanted in five-meter-long rows with a planting density of 20 × 20 cm. For crop production, the recommended package and techniques were implemented. A total of 233 plants were saved and employed in genotypic and phenotypic assessment tests.
All the observations were taken from a single plant in each row of the plot, which was tagged assigning a specific number to them. The variation of the yield and its component characters were evaluated using a one-way ANOVA, which revealed significance at the 5% level of significance. Pearson’s correlation analysis with SPSS was used to obtain the Pearson’s correlation coefficient (PCC) between the attributes (version 20). The parents and F2 mapping population were examined, and data for phonological, morphological, yield and its component traits were recorded for various variables as shown in Table 1 using the DUS guidelines of DRR, Hyderabad [8].

To establish the heritable potency of the relevant genes as well as the influence of the environment on them, genetic variability components such as heritability in the broad sense (H2), phenotypic and genotypic coefficients of variation (PCV and GCV), and genetic advance (GA) were calculated.
To evaluate the genotype of the F2 population, the modified Doyle and Doyle, method [9,10] was used to carry out genomic DNA isolation. Using agarose gel electrophoresis and the Nanodrop device (spectrophotometer Nanodrop 2000), the quality and amount of genomic DNA were determined. DNA concentration was calculated by correlating the intensity of genomic DNA bands with that of known recognized standards and optical density (OD) of samples that were measured at 260 and 280 nm utilizing Peq-Lab Nanodrop. To dilute samples of DNA to a final concentration of 50 ng/L, Milli Q water was employed.
2.4 SSR Genotyping and PCR Profile
A set of 450 SSRs covering the entire rice genome were selected. Double distilled, autoclaved and deionized water was used to dilute primers at a concentration of 10 pmol. To study polymorphism among F2 population genotypes generated from K343 and DHMAS combination, 96 well thermal-cycler was used to carry out PCR amplification subjected to the thermal profile. The thermo-cycler was configured with a 5-min. denaturation stage, followed by 35 cycles of denaturation (at 94°C for 30 s), annealing (at 55°C for 30 s), and extension (at 72°C for 30 s). The last extension was done for 7 min at 72°C, after that, the PCR products were kept at 4°C. However, the identical reaction mixture lacking genomic DNA was used for each reaction, as a negative control. The SSR markers which showed parental polymorphism were used for genotyping. Based on polymorphism, out of 450 SSR markers, 53 markers were utilized for the PCR amplification of the genomic DNA of the 233 F2 mapping population (Table 2). The fragment size (bp) matching the 100 bp molecular weight marker was used to score observable and reproducible alleles amplified for each SSR. PCR products produced in the anticipated size range of SSRs were used to score alleles for each SSR locus. When a PCR result failed to amplify, the data for the relevant genotype was considered null allele.

2.5 Genetic Linkage Map Construction
MAPMAKER/Exp v. 3.0-based program was used to compute the genetic linkage order and genetic distances of the 53 marker loci [11]. The electrophoresis findings were converted into scoreable data, and computer-based running software was used in accord with the instructions. GROUP command and LOD 3.0 were used to do linkage analysis and grouping and the rate of recombination was set to 50 cM. However, when the number of connected markers was lower than 8, COMPARE command was used to optimize them. The error detection rate was set at 1%, with triple error detection enabled. The “Kosambi” map program was used to translate the recombination rate into a genetic map (distance, cM). To select the relevant linkage groups, the found SSR markers [12] were used as anchor tags (Fig. 1).

Figure 1: Genetic linkage map showing the position of polymorphic markers in rice chromosomes using MAPMAKER/EXP 3.0 program
QTLs associated to yield and its component traits were detected and identified using Statistical software viz., QTLCARTOGRAPHER version 2.5 [13]. The number of genotypes, phenotypic values, completely constructed linkage map, and the yield & yield-related trait QTLs were evaluated using composite interval mapping (CIM). In multiple studies for each variable trait, minimum LOD values of 2.5/3.0 were employed to identify putative QTL. The threshold LOD scores for QTL identification were computed for each experiment using 1000 permutations at P ≤ 0.05 [14]. When the significance level was set at 0.05, and the walk speed was set at 2 cM, the results were displayed in the appropriate genetic linkage map. LOD scores below the threshold for QTL LOD were only treated as informative QTL, whereas those with LOD values over a certain limit were regarded as definitive QTL. The putative sites of the QTL were obtained from the LR peak points in the linkage map. For each trait, the additive effect and the percentage of phenotypic variation (PVE%) were calculated. The detected QTLs were given names according to McCouch’s naming system [15].
Both K343 and DMAS have been genotyped using SSR molecular markers. The alleles present at two different positions in both the parental genotypes were scored as polymorphic. Table 2 lists the polymorphic 53 SSRs out of 450 primers that exhibited 11.77 percent polymorphism [1]. Based on polymorphic microsatellite markers, MAPMAKER/EXP 3.0 software resulted in forming seven linkage groups whereas five markers were designated as unlinked. The seven linkage groups were mapped for 11 chromosomes (chromosomes 1–12), but there were no connected markers on chromosome 7. Chromosomes 1, 2, 3, and 4 had 6, 7, 9, and 2 markers with map distances of 421.2, 582.1, 607.6 and 97.5 cM, respectively. Four markers were found on chromosomes 5 and 6, covering a map length of 255.9 and 192.6 cM, correspondingly. With 3 and 2 markers, chromosomes 8 and 9 had a map distance of 567.9 and 18.7 cM, respectively, however, with a single marker, chromosome 10 had a map length of 78.8 cM. There were 2 and 3 markers on chromosomes 11 and 12, respectively, with map distances of 19.4 and 231.9 cM, for a total of 3971.1 cM (Fig. 1) [1].
3.2 Detection of QTLs for Various Traits
In the present study, Composite interval mapping (CIM) using genotypic data, phenotypic and genetic linkage map recognized total of 30 QTLs for nine yield and yield contributing traits. There were 30 QTLs for yield and yield-related traits identified, with chromosomal number, marker-interval of peak LOD, additive effect, peak LOD value and the phenotypic variation explained (R2) (Table 3). Pictorial representation of major QTLs for various traits found in this study are given in Fig. 2.


Figure 2: Rice chromosomes showing the location of major QTLs for yield and yield contributing traits
3.3 Number of Tillers Per Plant (TPP)
There were a total of four QTLs discovered for the number of tillers per plant, out of which 2 QTLs were detected at chromosome 1, with a flanking marker RM13838 on linkage map with 30.5 cM position named as qTPP1.1 and at 36.3 cM named as qTPP1.2, respectively, one QTL, qTPP2 was detected at chromosome 2 with 123 cM position between the peak marker interval RM5699-RM240 and one QTL was located at chromosome 3, at flanking marker RM6832 on linkage map with 10.0 cM position named as qTPP3. LOD value and phenotypic deviation described for QTL qTPP1.1 was 2.67 and 12 percent, for QTL qTPP1.2 was 3 and 14 percent, for QTL qTPP2 was 2.5 and 57.2 percent, whereas, for QTL qTPP3 was 3.5 and 11 percent, respectively. The peak is shown in Fig. 3.

Figure 3: QTL likelihood plots indicating LOD scores for tiller per plant (TPP) using CIM using QTL cartographer version 2.5
3.4 Panicle Number Per Plant (PPP)
Three QTLs were identified for panicle number per plant out of which 2 QTLs were located at chromosome 1, at a flanking marker RM13838 on linkage map with 30.5 cM position named qPPP1.1 with a LOD value 2.6 and 11.8 phenotypic variation explained percent and at 36.3 cM position with flanking marker RM13838, named qPPP1.2 with LOD value 3.0 and phenotypic variation explained was 14 percent. Another QTL was located at chromosome 3, at flanking marker RM6832 with 10.0 cM position named qPPP3, the LOD value was 3.38 and 11.3 percent was the phenotypic variation explained. The peak is shown in Fig. 4.

Figure 4: QTL likelihood plots indicating LOD scores for panicle number per plant (PPP) using CIM using QTL cartographer version 2.5
Four QTLs were detected for plant height. One QTL named qPH2 at 125.0 cM on chromosome 2 between the peak marker intervals RM5699-RM240 was found with LOD value 3.5 and 55.3 percent phenotypic variation explained. Another QTL named as named as qPH4 was detected with a LOD value 7.9 and 65.2 percent phenotypic variation explained on chromosome 4 between the peak marker intervals RM471-RM3524 at 44.0 cM position. One QTL, qPH5 was detected at chromosome 5 at 28.1 cM position with RM413 flanking marker, LOD value 2.5 and 7.0 percent phenotypic variation explained was observed. Another QTL, qPH6 was detected with LOD value 3.1 and 36.7 phenotypic variation explained percent on chromosome 6 with 22.0 cM position between the marker-interval of RM204-RM225. The peak is shown in Fig. 5.

Figure 5: QTL likelihood plots indicating LOD scores for plant height (PH) using CIM using QTL cartographer version 2.5
On chromosome 5, a substantial QTL qSD5 was discovered at 12.1 cM with a flanking marker RM413, and LOD value for this QTL was 2.5 and explained the phenotypic variability by 4.4%. The peak is shown in Fig. 6.

Figure 6: QTL likelihood plots indicating LOD scores for spikelet density (SD) using CIM using QTL cartographer version 2.5
3.7 Spikelet Fertility Percentage (SFP)
Four QTLs namely qSFP2, qSFP3, qSFP5.1 and qSFP5.2 were located at 129.0, 2.0, 10.6 and 20.1 cM position at chromosome number 2, 3 and 5, respectively. QTL, qSFP2 was found between the marker-interval RM5699-RM240 with 3.8 LOD value and 45.8 percent phenotypic variability explained. QTL, qSFP3 was found with a flanking marker RM6832 with 2.8 LOD value and 5 percent phenotypic variability explained. Two QTLs were found on chromosome 5, qSFP5.1 was found with a flanking marker RM413, with 3.7 LOD value and 15.2% phenotypic variability explained, another QTL, qSFP5.2 was found with a RM413 as flanking marker, and LOD value for this QTL was 4.5 and described the phenotypic by 16% (Peak is shown in Fig. 7).

Figure 7: QTL likelihood plots indicating LOD scores for spikelet fertility (SFP) using CIM using QTL cartographer version 2.5
Two QTLs were identified for grain length at 40.3 and 6.0 cM distance at chromosomes 1 and 8, respectively. QTLs, qGL1 and qGL8 were found with the flaking marker RM13838 and RM447, with the LOD value 25.2 and 3, respectively. The phenotypic variability explained was 47.7 percent and 5.9 percent for qGL1 and qGL8, respectively. The peak is shown in Fig. 8.
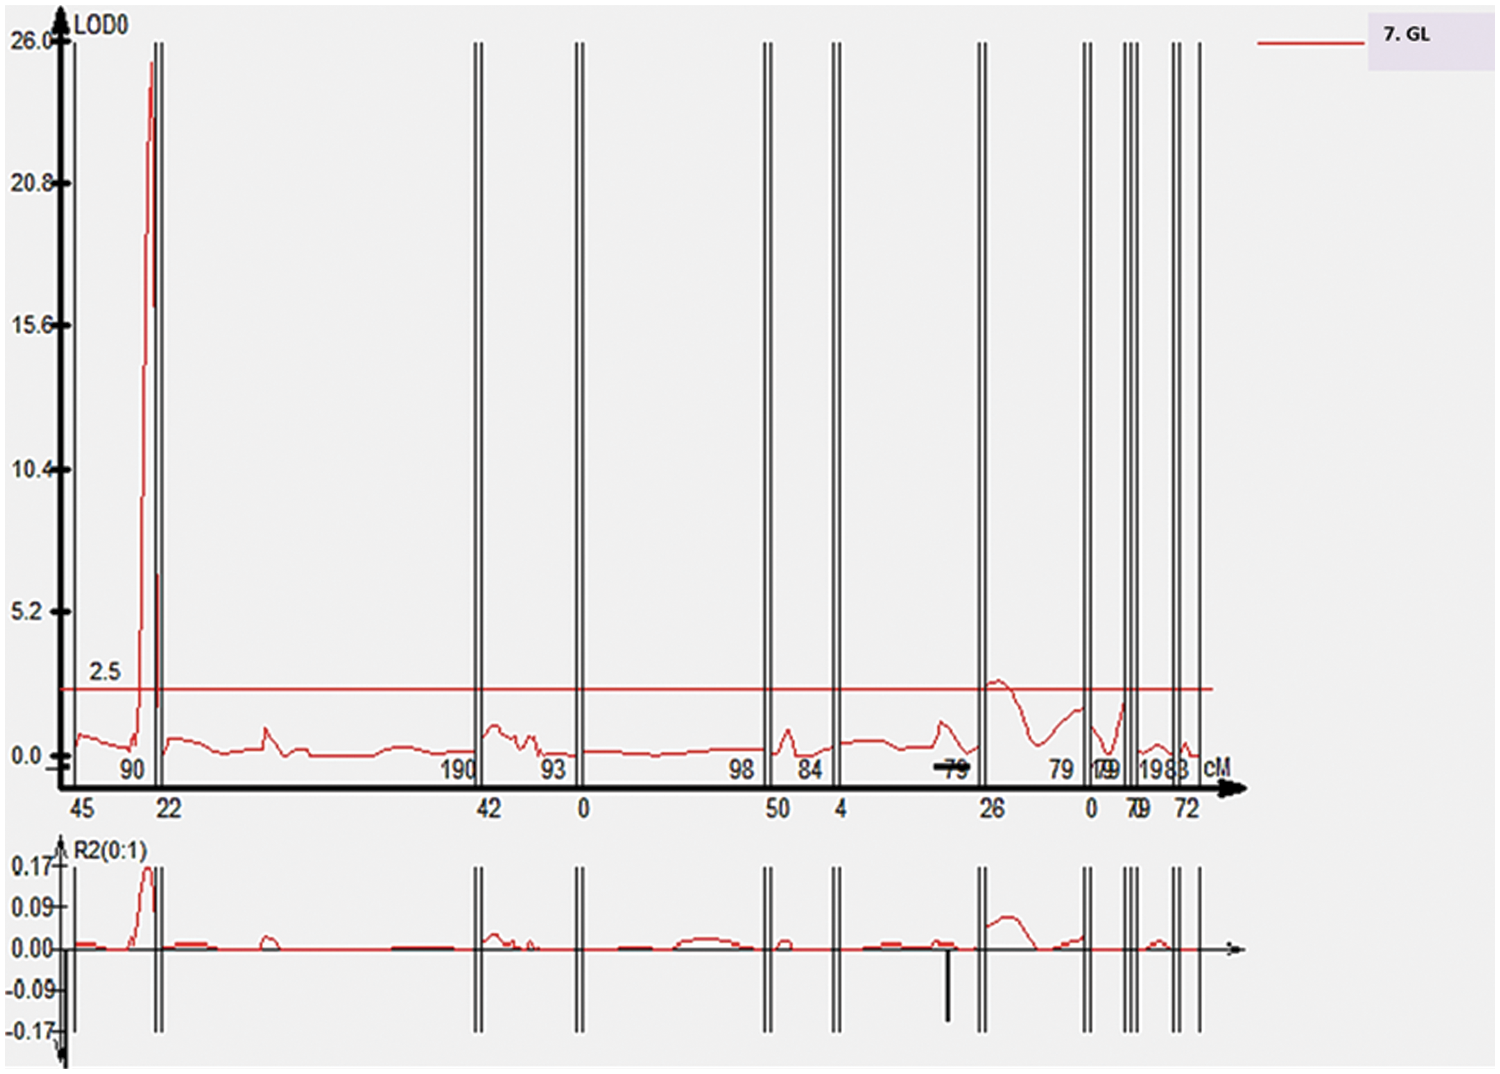
Figure 8: QTL likelihood plots indicating LOD scores for grain length (GL) using CIM using QTL cartographer version 2.5
In the case of grain width, three QTLs were discovered. QTL namely qGW1 was located on chromosome 1 at flanking marker RM13838 on linkage map with 41.9 cM distance, QTL namely qGW3 was located on chromosome number 3 at flanking marker RM6832 with 26.9 cM distance and QTL namely qGW8 was located on chromosome 8 between the peak marker intervals RM447-RM80 with 26.0 cM distance. All 3 QTLs, qGW1, qGW3 and qGW8 had a LOD value 2.6, 4 and 5.2 also phenotypic variability explained was 3, 5.8 and 21 percent, respectively. The peak is shown in Fig. 9.

Figure 9: QTL likelihood plots indicating LOD scores for grain width (GW) using CIM using QTL cartographer version 2.5
Three QTLs namely qTGW1, qTGW4 and qTGW8were identified for 1000-grain weight on chromosome numbers 1, 4 and 8 at 41.9, 28.0, 26.0 cM distance, respectively. qTGW1 was located with the flaking marker RM13838, qTGW4 was located between the peak marker interval RM471-RM3524 and was located between the peak marker interval RM447-RM80. The LOD value and the phenotypic variability explained for the 3 QTLs, qTGW1, qTGW4 and qTGW8 was 10.2, 5.8 and 3.5 and 16.8, 37 and 11.0 percent. The peak is shown in Fig. 10.

Figure 10: QTL likelihood plots indicating LOD scores for 1000-grain weight (TGW) using CIM using QTL cartographer version 2.5
A total of six QTLs namely qYPP2.1, qYPP2.2, qYPP2.3, qYPP4, qYPP6 and qYPP8 were identified for yield per plant on chromosome number 2, 4, 6 and 8 at 74.5, 123.0, 139.0, 52.0, 26.0 and 26.0 cM distance, respectively. Three QTLs were detected on chromosome number 2, qYPP2.1 was located between the peak marker-interval RM262-RM3874; the LOD with this QTL was 2.5 and described the phenotypic dissimilarity by 4.5%, qYPP2.2 was located between the peak marker-interval RM5699-RM240; the LOD with this QTL was 4.9 and elucidated the phenotypic difference by 69.0%, and qYPP2.3 was located between the peak marker-interval RM5699-RM240; the LOD value for this QTL was 3.8 and explained the phenotypic variation by 65.0 percent. Another QTL qYPP4 was located between the peak marker-interval RM471-RM3524; the LOD value for this QTL was 7.2 and explained the phenotypic variation by 67.0 percent. QTL qYPP6 was located between the peak marker-interval RM204-RM225; the LOD value for this QTL was 3.0 and explained the phenotypic variation by 43 percent, whereas, QTL qYPP8 was located between the peak marker interval RM447-RM80; the LOD with this QTL was 3.0% and 55.0% was the phenotypic variability explained. The peak is shown in Fig. 11.

Figure 11: QTL likelihood plots indicating LOD scores for yield per plant (YPP) using CIM using QTL cartographer version 2.5
QTL analysis is based on the idea of identifying a relationship between phenotype, marker genotype, and population type, suggesting that the marker locus employed to partition the mapping population is connected to a QTL regulating the trait [16]. Both environmental and pleiotropic effects of genes for non-target traits influence the phenotypic expression of yield and its component traits. The total phenotypic variation is contributed by the number of QTLs but each QTL explains the part of the overall phenotypic deviation which is used to differentiate it as a minor or major QTL. A minor QTL explains less than 10% of total phenotypic variance, whereas a major QTL explains more than 10% of total phenotypic variation. The same standard has been used in many QTL studies in rice and other crops [17–19]. Furthermore, small and environment-specific QTLs are neglected during QTL analysis, although there are only a few “stable” QTLs that have been identified [20]. The findings were reviewed based on the above-mentioned studies, and the discovered QTLs were named using McCouch’s nomenclature criteria [21].
Out of the 30 QTLs found in this study, four significant QTLs for the number of tillers per plant were identified as phenotypic variation explained (PVE%) for all QTLs, i.e., qTPP1.1, qTPP1.2, qTPP2, qTPP3 was above 10%, i.e., 12%, 14%, 57.2%, 11% respectively and LOD value ranged from 2.5–3.5 for all the QTLs, which are quite a significant QTLs and 3 major QTLs were found for panicle no per plant, PVE% observed was above 10%, i.e., 11.8, 14.0, 11.3 percent and LOD value was ranging from 2.6–3.38 for all the QTLs, similar LOD score was observed in F2 population [22], but as per the reports of [23], heritability for both traits is low (0.65), similar results were shown by a study [24]. Among the 130 QTLs detected for grain yield and its attributing components using composite interval mapping, 36 were major effects QTLs and 8 QTLs were determined to be stable over chromosomal locations [25]. Chief response QTLs for flag leaf length (qfll3.1) with 46 percent phenotypic difference were identified 6 recognized QTLs (qph3.1, qnt3.1, qnt3.2, qTGW-4, qTGW4–1, qPPP4–2) were also confirmed and co-localized in 3 and 4 chromosomes along with QTLs genomic regions recognized in this study. There are 15 major and 23 minor effects QTLs in these genomic locations, covering over 300 genes. This research might help break down yield genetic obstacles for long-term food security. Three major and one minor QTLs namely qPH2, qPH4, qPH5, qPH6 were detected for plant height as Phenotypic variation explained (PVE%) was 55.3, 65.2, 7.0, 36.7, respectively. The lowest LOD value observed was 2.5 for qPH5, followed by 3.1 for qPH6 and 3.5 for qPH2, however, a very high LOD value of 7.9 was observed for qPH4. Similar results for chromosome 6 have been reported for plant height with the LOD value 3.5 and flaking marker RM204. Spikelet density showed a minor QTL qSD5 located at 12.1 cM distance [26]. For this QTL, the LOD value utilized in the study was 2.5 [27], and the LOD value of 2.2 was used in another study and explained the phenotypic variability by 4.4 percent similar to PVE% (2013).
Although heritability for spikelet density was observed to be 0.68, still detection of minor QTLs may be due to the set of markers employed or the phenotypic appearance of such traits may be affected by both environmental effects and pleiotropic effects of genes for non-target traits. Spikelet fertility is another important trait. In the present investigation, three major & one minor QTLs namely qSFP2, qSFP5.1, qSFP5.2, and qSFP3 respectively were identified for spikelet fertility percentage. The highest LOD value of 4.5 was observed in qSFP5.2 same LOD value [28], followed by qSFP2 and qSFP5.1 with LOD values of 3.8 and 3.7; the same LOD value for spikelet fertility was reported in another study [29], lowest LOD value 2.8 was observed in qSFP3. Grain size can be specified by grain length, width and thickness is largely regulated by cell proliferation, expansion of maternal integument, and zygotic tissues [30].
Grain length and grain width are the important constituents of plant yield and are controlled by quantitative trait loci (QTLs) [31]. In the present study, one major QTL, qGL1 for grain length was detected with a very high LOD value of 25.2 and significant PVE of 47.7%, and one minor QTL with a LOD value of 3.0% and 5.9% PVE was detected on chromosome 8 with 6.0 cM position. Similarly, for grain width, one major QTL, qGW8 with a high LOD value of 5.2 was detected, this QTL showed 21% PVE at chromosome 8. Two minor QTLs, qGW1 and qGW3 were detected with LOD value 2.6 and 4.0, respectively. The same LOD value of 4.0 and PVE 24.5% for grain width in the F2 population was reported in another study [22].
Three major QTLs namely qTGW1, qTGW4, and qTGW8 were identified for 1000-grain weight. qTGW1 showed the highest LOD value 10.2 with 16.8 PVE% followed by QTL qTGW4 with 5.8 LOD value with PVE 37% and the lowest LOD value was observed in qTGW8 3.5 with PVE 11.0%. The LOD value and the phenotypic variability explained for the 3 major QTLs were seen as significant. A similar study has reported the LOD value of 3.2 and 10.0, also 18% PVE for 1000-grain weight in their studies which is quite close to the results mentioned above [28], hence exploring these QTLs further to the next generation can help identification of closely linked genes. Also, they reported that a major QTL, qTGW8.1 s was located on chromosome 8 with a flaking marker RM80 which is related to the findings in the current research. A 37% PVE for 1000-grain weight was reported by another study [32].
Maximum numbers of QTLs were detected for the trait yield per plant; similar reports for yield were shown in a similar study [33]. A total of 6 QTLs were detected for YPP, out of which only minor QTL qYPP2.1 was found rest four QTLs qYPP2.2, qYPP2.3, qYPP4, qYPP6, qYPP8 were found to be the major QTLs. The lowest LOD value and PVE%, i.e., 2.5 and 4.5, respectively, were observed for qYPP2.1. The highest LOD value 7.2 and highest PVE% 69 were observed in qYPP4 and qYPP2.2, at chromosome 4 and chromosome 2, respectively. Maximum numbers of QTLs for YPP were located at chromosome 2; a similar study also reported a QTL at chromosome 2 with 3.6 LOD values, which shows a similarity to the present study [34].
The variation explained by individual QTLs ranged from a low of 3.0% to a high of 69.0%, with the majority of them explaining the range of 10%–20% of the variation. One QTL of plant height shows a close linkage with one QTL of yield per plant & one QTL of 1000-grain weight as they were detected on the same chromosome number 4 and with 44, 28 and, 52 cM distance, respectively, and all these three QTLs were detected between the same marker-interval RM471-RM3524. Most of the QTLs were detected on chromosome 2, so further studies on chromosome 2 could help unlock some new chapters of QTL for this set of parents. The molecular markers linked with definitive QTL identified for different traits in the current research can be beneficial for MAS. The chromosomal regions carrying important QTL identified during the present study can be enriched with more markers by high-resolution mapping. Evidence about molecular markers tightly linked to QTL that govern these traits may accelerate crop improvement strategies in rice.
Any scientific advancement that focuses on increasing rice yields will have a significant impact on global food and nutrition security. Given the rapid growth of the global population, the global population is anticipated to reach nine billion by the middle of this century. Rice grain yield should be increased by 70%–100%, relative to the current levels, to feed the increasing global population [35,36]. The present investigation revealed that most of the studied traits were controlled by one or more major QTLs, elucidating a high percentage of phenotypic variance and several minor QTLs. The major QTLs identified can be used in rice improvement programs. The effect of the identified alleles on of the yield parameters of the rice population can be further studied for a multiple-environment experiments which may demonstrate that both genotypic and environmental variations play a substantial role in the observed variable in yield per plant [2]. Various genomic regions governed more than one trait, indicating linkage and/or pleiotropic effects. The significant correlations between studied traits can be explained by these genomic regions containing pleiotropic or tightly linked QTLs. The present study also revealed that all the major QTLs of a given trait are found in the same range of markers on a specific chromosome, which gives useful information that focusing and exploring those particular chromosome regions and the ignoring rest of the markers can lead to saving time and accelerate useful findings in the field of rice research. Thus, the information generated in this study will be useful in fine genetic mapping and identifying the genes behind significant robust QTLs, as well as transferring all favorable QTLs to a single genetic background to break down genetic barriers to yield for long-term food security.
Author’s Contribution: Methodology, Conceptualization, R.B., A.K.S., M.M.; Formal analysis, Writing original draft, Investigation, R.B., M.M., R.K.S., M.S., U.B.; Reviewing, Editing, M.M., B.A.B., U.B., M.A.H.; Supervision, M.M., U.B., I.A., A.U., A.E.S.; Project administration, R.B., M.M. All authors have read and approved the final version of the manuscript.
Acknowledgement: The authors gratefully acknowledge King Saud University in Riyadh, Saudi Arabia, for sponsoring their Researchers Supporting Project (RSP-2021/298). The authors are grateful to SKUAST-Jammu, School of Biotechnology for allowing them to conduct the study.
Funding Statement: This study was supported by the Researchers Supporting Project (RSP-2021/298), King Saud University in Riyadh, Saudi Arabia.
Conflicts of Interest: The authors declare that they have no conflicts of interest to report regarding the present study.
1. Bhat, R., Singh, A. K., Salgotra, R. K., Sharma, M., Mushtaq, M. et al. (2019). Detection of QTL for panicle architecture in F2 population of rice. Journal of Genetics, 98(2), 1–10. DOI 10.1007/s12041-019-1088-z. [Google Scholar] [CrossRef]
2. Kulkarni, S. R., Balachandran, S. M., Ulaganathan, K., Balakrishnan, D., Praveen, M. et al. (2020). Molecular mapping of QTLs for yield related traits in recombinant inbred line (RIL) population derived from the popular rice hybrid KRH-2 and their validation through SNP genotyping. Scientific Reports, 10(1), 1–21. DOI 10.1038/s41598-020-70637-3. [Google Scholar] [CrossRef]
3. Park, Y. J., Lee, J. K., Kim, N. S. (2009). Simple sequence repeat polymorphisms (SSRPs) for evaluation of molecular diversity and germplasm classification of minor crops. Molecules, 14(11), 4546–4569. DOI 10.3390/molecules14114546. [Google Scholar] [CrossRef]
4. Takai, T., Nakano, H., Yoshinaga, S., Kondo, M. (2018). Identification of a novel QTL for the number of spikelets per panicle using a cross between indica and japonica type high-yielding rice cultivars in Japan. Plant Breeding, 137(2), 109–117. DOI 10.1111/pbr.12575. [Google Scholar] [CrossRef]
5. McCouch, S., Baute, G. J., Bradeen, J., Bramel, P., Bretting, P. K. et al. (2013). Feeding the future. Nature, 499(7456), 23–24. DOI 10.1038/499023a. [Google Scholar] [CrossRef]
6. Kim, S. R., Ramos, J. M., Hizon, R. J. M., Ashikari, M., Virk, P. S. et al. (2018). Introgression of a functional epigenetic OsSPL14WFP allele into elite indica rice genomes greatly improved panicle traits and grain yield. Scientific Reports, 8(1), 1–12. DOI 10.1038/s41598-018-21355-4. [Google Scholar] [CrossRef]
7. Bai, X., Wu, B., Xing, Y. (2012). Yield-related QTLs and their applications in rice genetic improvement. Journal of Integrative Plant Biology, 54(5), 300–311. DOI 10.1111/j.1744-7909.2012.01117.x. [Google Scholar] [CrossRef]
8. McCouch, S. R., Teytelman, L., Xu, Y., Lobos, K. B., Clare, K. et al. (2002). Development and mapping of 2240 new SSR markers for rice (Oryza sativa L.). DNA Research, 9(6), 199–207. DOI 10.1093/dnares/9.6.199. [Google Scholar] [CrossRef]
9. Clarke, J. D. (2009). Cetyltrimethyl ammonium bromide (CTAB) DNA miniprep for plant DNA isolation. Cold Spring Harbor Protocols, 2009(3), 5177. DOI 10.1101/pdb.prot5177. [Google Scholar] [CrossRef]
10. Doyle, J. J. (1990). Isolation of plant DNA from fresh tissue. Focus, 12, 13–15. [Google Scholar]
11. Lincoln, S. E., Daly, M. J., Lander, E. S. (1993). Constructing genetic linkage maps with MAPMAKER/EXP version 3.0: A tutorial and reference manual. A Whitehead Institute for Biomedical Research Technical Report, pp. 3. [Google Scholar]
12. Temnykh, S., DeClerck, G., Lukashova, A., Lipovich, L., Cartinhour, S. et al. (2001). Computational and experimental analysis of microsatellites in rice (Oryza sativa L.Frequency, length variation, transposon associations, and genetic marker potential. Genome Research, 11(8), 1441–1452. DOI 10.1101/gr.184001. [Google Scholar] [CrossRef]
13. Wang, S., Basten, C. J., Zeng, Z. B. (2012). Windows QTL cartographer 2.5. Raleigh, NC: Department of Statistics, North Carolina State University. http://statgen.ncsu.edu/qtlcart/WQTLCart.htm. [Google Scholar]
14. Churchill, G. A., Doerge, R. W. (1994). Empirical threshold values for quantitative trait mapping. Genetics, 138(3), 963–971. DOI 10.1093/genetics/138.3.963. [Google Scholar] [CrossRef]
15. McCouch, S., Temnykh, S., Lukashova, A., Coburn, J., Declerck, G. et al. (2001). Microsatellite markers in rice: Abundance, diversity, and applications. Rice Genetics IV, 117–135. DOI 10.1142/9789812814296_0008. [Google Scholar] [CrossRef]
16. Collard, B. C., Jahufer, M., Brouwer, J., Pang, E. (2005). An introduction to markers, quantitative trait loci (QTL) mapping and marker-assisted selection for crop improvement: The basic concepts. Euphytica, 142(1), 169–196. DOI 10.1007/s10681-005-1681-5. [Google Scholar] [CrossRef]
17. Hartman, Y., Hooftman, D. A., Schranz, M. E., van Tienderen, P. H. (2013). QTL analysis reveals the genetic architecture of domestication traits in crisphead lettuce. Genetic Resources and Crop Evolution, 60(4), 1487–1500. DOI 10.1007/s10722-012-9937-0. [Google Scholar] [CrossRef]
18. Gao, F., Wen, W., Liu, J., Rasheed, A., Yin, G. et al. (2015). Genome-wide linkage mapping of QTL for yield components, plant height and yield-related physiological traits in the Chinese wheat cross Zhou 8425b/Chinese spring. Frontiers in Plant Science, 6, 1099. DOI 10.3389/fpls.2015.01099. [Google Scholar] [CrossRef]
19. Davey, M. W., Kenis, K., Keulemans, J. (2006). Genetic control of fruit vitamin C contents. Plant Physiology, 142(1), 343–351. DOI 10.1104/pp.106.083279. [Google Scholar] [CrossRef]
20. Kumar, J., Gupta, D. S., Gupta, S., Dubey, S., Gupta, P. et al. (2017). Quantitative trait loci from identification to exploitation for crop improvement. Plant Cell Reports, 36(8), 1187–1213. DOI 10.1007/s00299-017-2127-y. [Google Scholar] [CrossRef]
21. McCouch, S. (1997). Report on QTL nomenclature. Rice Genetics Newsletter, 14, 11–13. [Google Scholar]
22. Rahman, L., Khanam, M. S., Koh, H. J. (2008). QTL analysis for yield related traits using populations derived from an indica-japonica hybrid in rice (Oryza sativa L.). Czech Journal of Genetics and Plant Breeding, 44(3), 93–104. DOI 10.17221/16/2008-CJGPB. [Google Scholar] [CrossRef]
23. Zhu, J., Zhou, Y., Liu, Y., Wang, Z., Tang, Z. et al. (2011). Finemapping of a major QTL controlling panicle number in rice. Molecular Breeding, 27(2), 171–180. DOI 10.1007/s11032-010-9420-6. [Google Scholar] [CrossRef]
24. Verma, R. K., Chetia, S., Dey, P., Sharma, V., Baruah, A. et al. (2017). Development of advanced breeding lines for high grain yield under drought stress in elite rice genetic background. Research on Crops, 18(4), 705–710. DOI 10.5958/2348-7542.2017.00116.4. [Google Scholar] [CrossRef]
25. Sahu, V. K., Sunil, K. N., Vishwakarma, A. K., Verulkar, S., Chandel, G. (2017). QTL hotspots detected for yield contributing traits in rice (Oryza sativa L.) using composite interval mapping analysis. Biosciences Biotechnology Research Asia, 14(1), 329–341. DOI 10.13005/bbra/2450. [Google Scholar] [CrossRef]
26. Suji, K., Biji, K., Poornima, R., Prince, K. S. J., Amudha, K. et al. (2012). Mapping QTLs for plant phenology and production traits using Indica rice (Oryza sativa L.) lines adapted to rainfed environment. Molecular Biotechnology, 52(2), 151–160. DOI 10.1007/s12033-011-9482-7. [Google Scholar] [CrossRef]
27. Ahamadi, J., Fotokian, M., Fabriki-Orang, S. (2008). Detection of QTLs influencing panicle length, panicle grain number and panicle grain sterility in rice (Oryza sativa L.). Journal of Crop Science and Biotechnology, 11(3), 163–170. [Google Scholar]
28. Mohammadi, R., Mendioro, M. S., Diaz, G. Q., Gregorio, G. B., Singh, R. K. (2013). Mapping quantitative trait loci associated with yield and yield components under reproductive stage salinity stress in rice (Oryza sativa L.). Journal of Genetics, 92(3), 433–443. DOI 10.1007/s12041-013-0285-4. [Google Scholar] [CrossRef]
29. Liu, T., Li, L., Zhang, Y., Xu, C., Li, X. et al. (2011). Comparison of quantitative trait loci for rice yield, panicle length and spikelet density across three connected populations. Journal of Genetics, 90(2), 377–382. DOI 10.1007/s12041-011-0083-9. [Google Scholar] [CrossRef]
30. Li, N., Li, Y. (2016). Signaling pathways of seed size control in plants. Current Opinion in Plant Biology, 33, 23–32. DOI 10.1016/j.pbi.2016.05.008. [Google Scholar] [CrossRef]
31. Qin, Y. B., Cheng, P., Cheng, Y. C., Feng, Y., Huang, D. R. (2018). QTL-Seq identified a major QTL for grain length and weight in rice using near isogenic F2 population. Rice Science, 25(3), 121–131. DOI 10.1016/j.rsci.2018.04.001. [Google Scholar] [CrossRef]
32. Luo, X., Ji, S. D., Yuan, P. R., Lee, H. S., Kim, D. M. et al. (2013). QTL mapping reveals a tight linkage between QTLs for grain weight and panicle spikelet number in rice. Rice, 6(1), 1–10. DOI 10.1186/1939-8433-6-33. [Google Scholar] [CrossRef]
33. Li, Z., Pinson, S. R., Park, W. D., Paterson, A. H., Stansel, J. W. (1997). Epistasis for three grain yield components in rice (Oryza sativa L.). Genetics, 145(2), 453–465. DOI 10.1093/genetics/145.2.453. [Google Scholar] [CrossRef]
34. Jia, B., Zhao, X., Qin, Y., Irfan, M., Kim, T. H. et al. (2019). Quantitative trait loci mapping of panicle traits in rice. Molecular Biology Research Communications, 8(1), 9–15. DOI 10.22099/mbrc.2019.31550.1366. [Google Scholar] [CrossRef]
35. Zeng, D., Tian, Z., Rao, Y., Dong, G., Yang, Y. et al. (2017). Rational design of high-yield and superior-quality rice. Nature Plants, 3(4), 17031. DOI 10.1038/nplants.2017.31. [Google Scholar] [CrossRef]
36. Lee, J. H., Seo, J., Lar, S. M., Jang, S. G., Zhang, H. et al. (2021). QTL analysis of rice grain size using segregating populations derived from the large grain line. Agriculture, 11(6), 565. DOI 10.3390/agriculture11060565. [Google Scholar] [CrossRef]
 | This work is licensed under a Creative Commons Attribution 4.0 International License, which permits unrestricted use, distribution, and reproduction in any medium, provided the original work is properly cited. |