| Phyton-International Journal of Experimental Botany |
DOI: 10.32604/phyton.2022.021354
ARTICLE
Friction Coefficient Calibration of Sunflower Seeds for Discrete Element Modeling Simulation
College of Mechanical and Electrical Engineering, Inner Mongolia Agricultural University, Hohhot, 010018, China
*Corresponding Author: Zhihong Yu. Email: yzhyqyzhyq@126.com
Received: 10 January 2022; Accepted: 16 May 2022
Abstract: Sunflower (Helianthus annuus L.) is one of the four major oil crops in the world and has high economic value. However, the lack of discrete element method (DEM) models and parameters for sunflower seeds hinders the application of DEM for computer simulation in the key working processes of sunflower seed sowing and harvesting. The present study was conducted on two varieties of sunflower, and the DEM model of sunflower seeds was established by using 3D scanning technology based on the distribution of triaxial dimensions and volumes of the geometric model of sunflower seeds. Similarly, the physical characteristics parameters of sunflower seeds were determined by physical tests and the simulation parameters were screened for significance based on the Plackett-Burman test. Our results show that the coefficient of static friction between sunflower seeds and the coefficient of rolling friction have significant effects on the repose angle of the simulation test. Furthermore, the optimal range of the significance parameters was further determined by the steepest climb test, and the second-order regression model of the significance parameters and the repose angle was obtained according to the Box-Behnken design test and Response Surface Methodology (RSM), with the repose angle measured by the physical test as the optimized target value to obtain the optimal parameter combination. Finally, a two-sample t-test for the repose angle of the physical test and the repose angle of the simulation test yielded P > 0.05. Our results confirms that the repose angle obtained from simulation is not significantly different from the physical test value, and the relative errors between the repose angle of the simulation test and the physical test are 1.43% and 0.40%, respectively, for the optimal combination of parameters. Based on these results it can be concluded that the optimal parameters obtained from the calibration can be used for DEM simulation experiments related to the sunflower seed sowing and harvesting process.
Keywords: Sunflower seeds; repose angle; response surface methodology; simulation model; DEM parameter calibration
Nomenclature
| DEM | Discrete Element Method |
| RSM | Response Surface Methodology |
| GEMM | Generic EDEM Material Model Database |
| JKR | Johnson-Kendall-Roberts |
| epp | Inter-particle coefficient of restitution |
| epm | Particle-material coefficient of restitution |
| μs-pp | Inter-particle coefficient of static friction |
| μs-pm | Particle-material coefficient of static friction |
| μr-pp | Inter-particle coefficient of rolling friction |
| μr-pm | Particle-material coefficient of rolling friction |
| L | Length of sunflower seeds |
| W | Width of sunflower seeds |
| T | Thickness of sunflower seeds |
| V | 3D volume of sunflower seeds |
| Fn | Normal contact force, N |
| Ft | Tangential contact force |
| Fnd | Normal damping force |
| Ftd | Tangential damping force |
| δn | Normal overlap amount |
| δt | Tangential overlap amount |
| St | Tangential stiffness |
| E* | Equivalent elastic modulus, MPa |
| R* | Equivalent radius of curvature, m |
| G* | Equivalent shear modulus, MPa |
| ν | Poisson’s ratio |
| E | Young’s modulus, MPa |
| R | Radius of sphere, m |
| G | Shear modulus, MPa |
| β | Damping ratio |
| m* | Equivalent mass, kg |
| Sn | Represent normal stiffness, N/m |
| vnrel | Normal relative speed, m/s |
| St | Tangential stiffness, N/m |
| vtrel | Tangential relative speed, m/s |
| m | Mass of particle, kg |
| Ti | Torque of particle, N·m |
| ωi | Angular velocity, rad/s |
| F | Load at the limit of sunflower seeds cracking, N |
| e | Collision recovery coefficient |
| d | Deformation variable, mm |
| KU | Constant determined by the radius of curvature |
| RZ | Minimum radius of curvature of the sample at the point of contact, mm |
| RZ′ | maximum radius of curvature of the sample at the point of contact, mm |
| h′ | Maximum height of rebound after collision, mm |
| h | Drop height before collision, mm |
| ρ | Angle of repose for sunflower seeds |
| A | Coefficient of static friction between seeds |
| B | Coefficient of rolling friction between seeds |
| C | Coefficient of static friction between seed and Q235 |
| D | Coefficient of rolling friction between seed and Q235 |
| Y | Angle of repose |
| R2 | Coefficient of determination |
| P | Significance level |
Sunflower (Helianthus annuus L.) is a large annual herb of the genus Helianthus in the family Asteraceae, and is an important agricultural cash crop and oil crop in the world. In recent years, the planting area of sunflower has grown. In 2019, the planting area of sunflower in China was about 6.45 million acres, and the total output exceeded 1.5 million tons, which has good development prospects [1]. At present, the harvesting of sunflowers is basically done manually, and there are disadvantages such as low efficiency, high labor costs, and long harvesting cycles, which seriously hinder the sustainable development of the sunflower industry.
In recent years, the EDEM software based on the discrete element method (DEM) has been widely used in the study of the movement process of bulk materials and the optimization analysis of agricultural machinery and equipment. And numerical simulation is a good alternative to study the bulk materials with the merits of repetition and low costs [2]. The interaction between its key components and the grain is studied through DEM, which is an exploration for the study of the dynamic behavior of agricultural materials. It provides new ideas and references for the design and optimization of agricultural machinery and equipment, which is necessary for the design and continuous improvement of machinery in this field [3], and at the same time can increase the efficiency and reduce the cost of research and development. When using DEM to model agricultural materials and analyze related applications, it is necessary to determine more accurate simulation parameters: basic physical parameters (density, Poisson’s ratio, Young’s modulus, shear modulus) and contact mechanical parameters (collision recovery coefficient, static friction coefficient, rolling friction coefficient) in order to ensure the accuracy of the prediction of DEM simulation results [4–6]. Most of the current studies on the calibration of DEM simulation parameters are calibrated for cereals, soils, biomass, feeds, fertilizers, fruits and vegetables (as shown in Table 1).
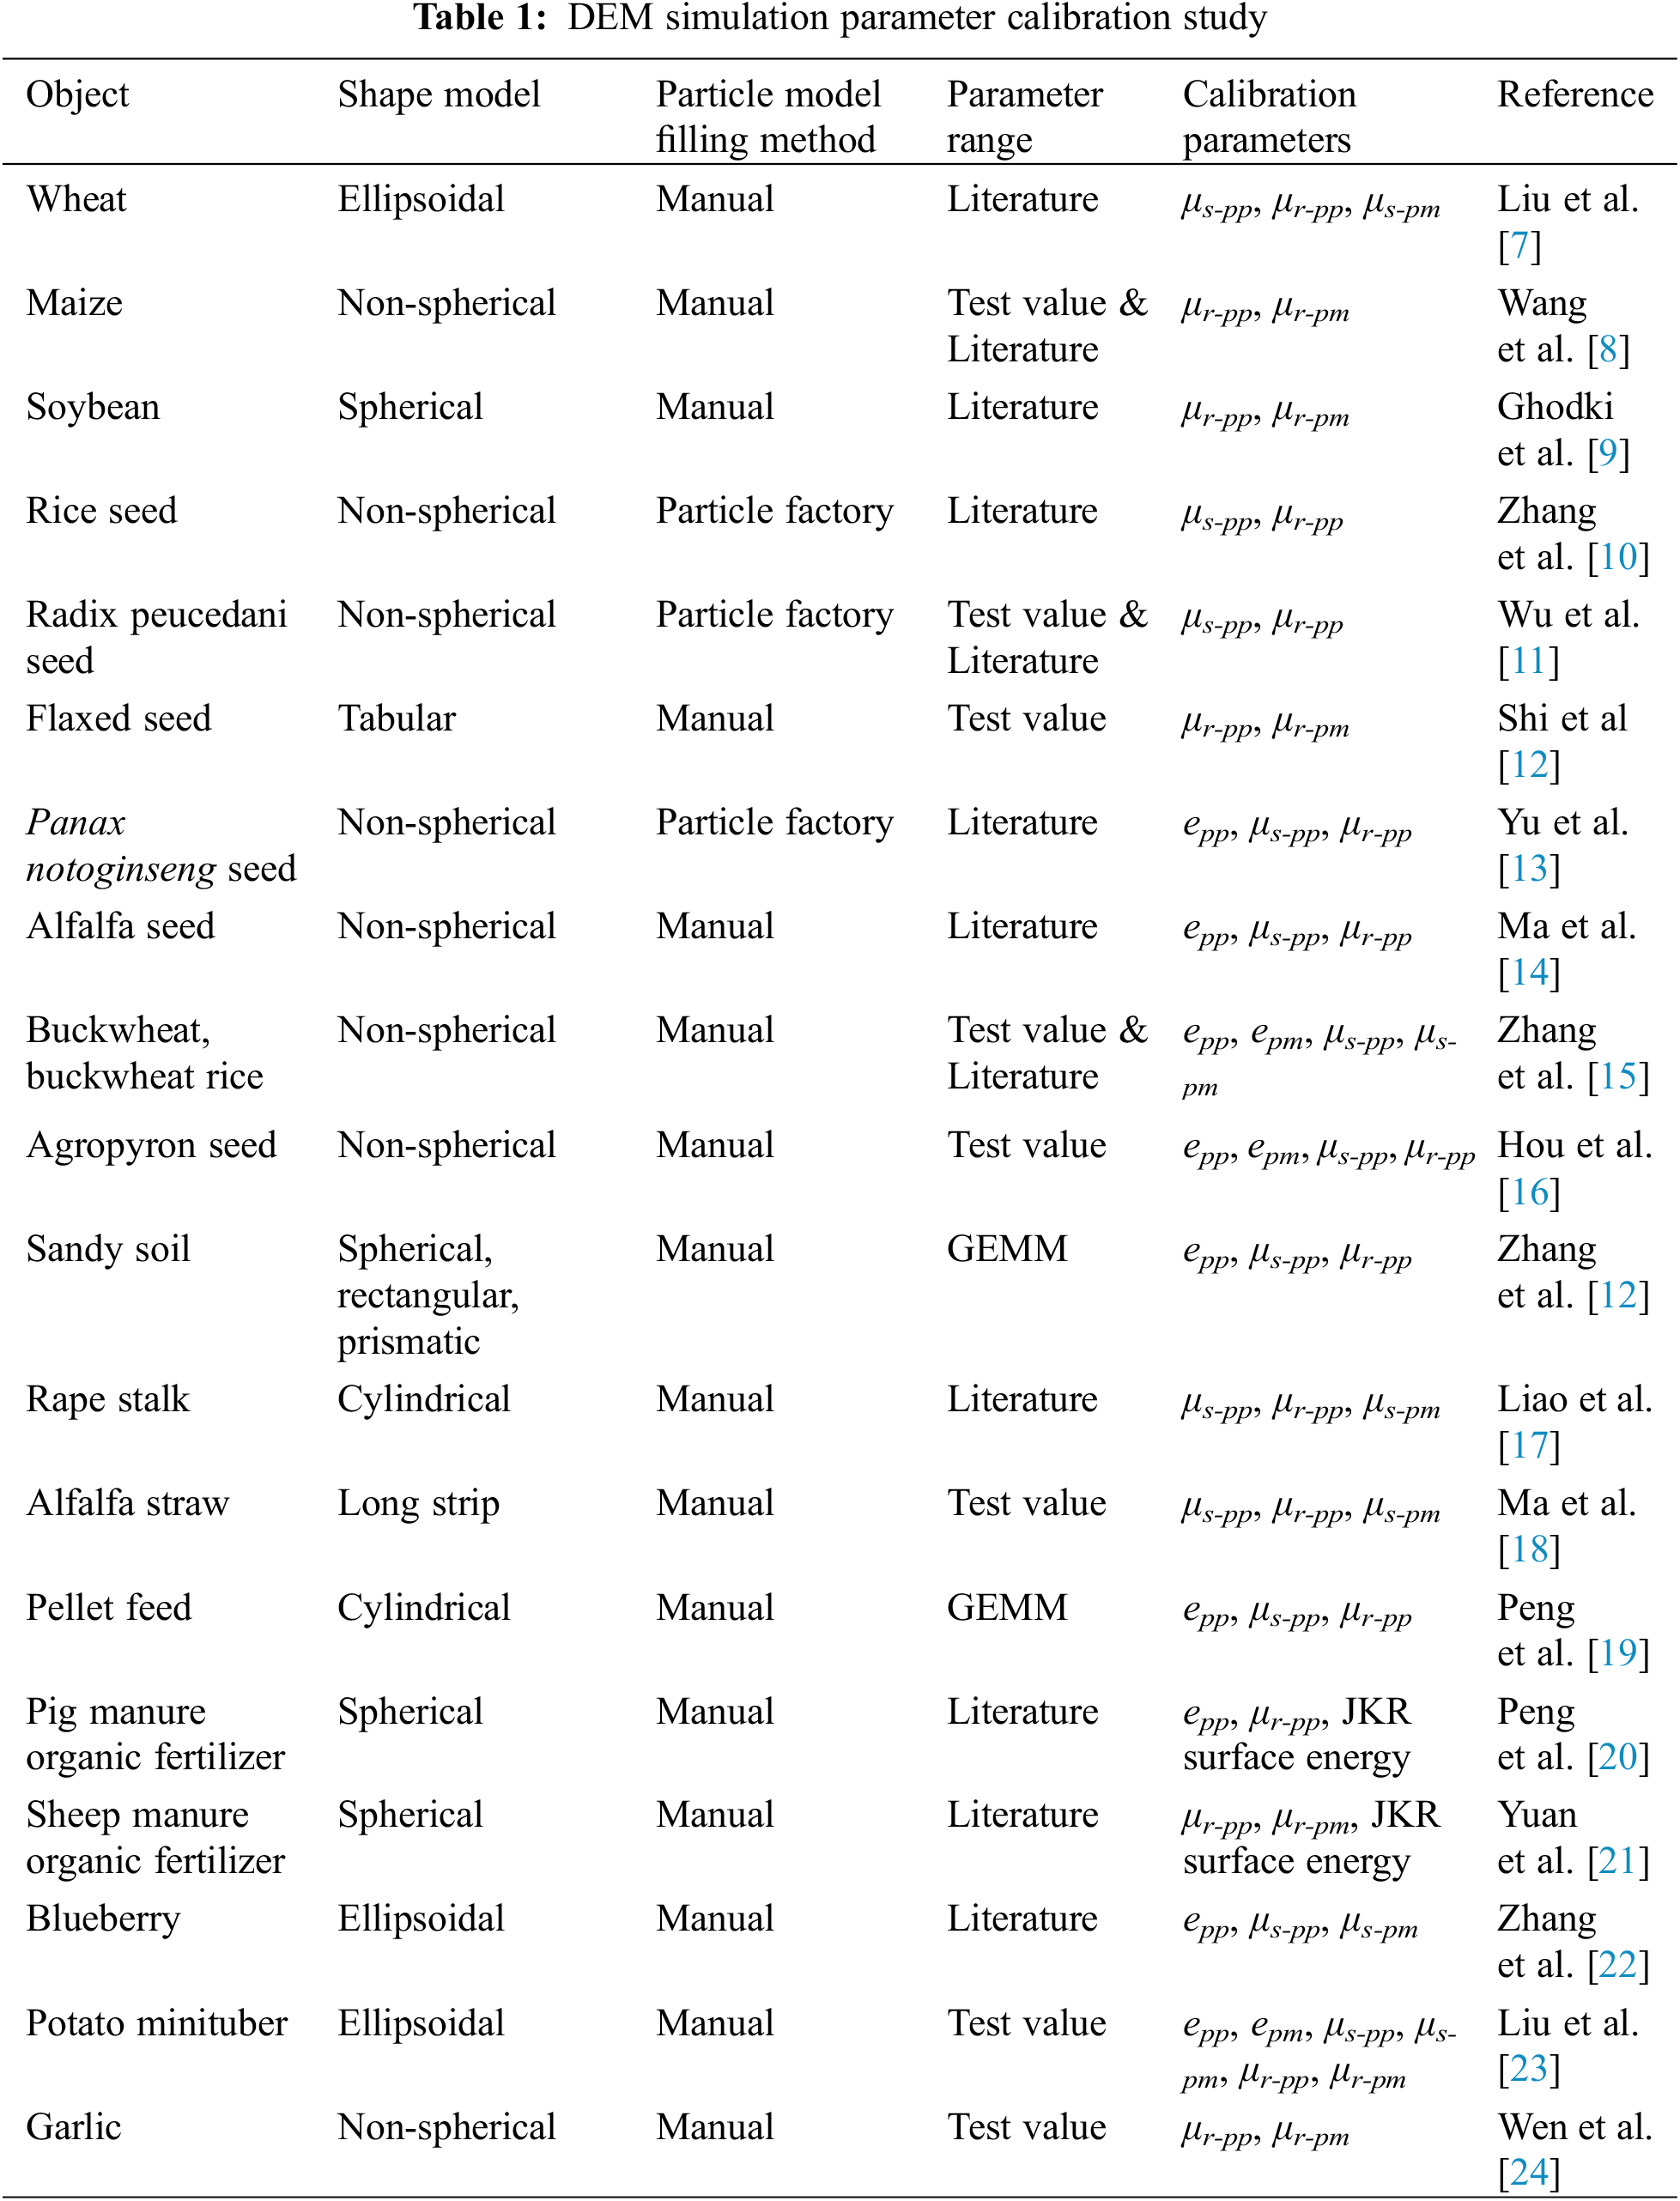
To summarize the research in Table 1, it is found that the non-spherical particles are mostly filled manually when the DEM parameters are calibrated, and it is sufficient to establish a multi-spherical particle model that is basically close to the real material shape. This way of particle filling restricts the parameters obtained from calibration to the DEM model of the multi-sphere particles to a certain extent, which reduces the applicability of the parameters calibrated by the DEM model. At the same time, it is worth noting that many domestic and foreign scholars mostly refer to the parameter intervals given by the Generic EDEM Material Model Database (GEMM), or the literature usually does not measure the microscopic parameters of the particles nor mention how the parameter values are obtained, resulting in unsupported assumptions about these values. Moreover, edible sunflower seeds are non-spherical particles, which are characterized by irregular shape and large volume compared to the above-mentioned spherical or ellipsoidal materials. Currently, there is no effective method for the rolling friction coefficient of edible sunflower seed grains, and the determination and calibration of DEM simulation parameters for edible sunflower seeds. So the modeling of edible sunflower seeds and the calibration of contact parameters become a difficult problem in the DEM process.
Based on this, a DEM parameter calibration method for edible sunflower seeds is proposed in this paper. The EDEM software auto-fill function is applied to create a sunflower seed calibration model, and the Response Surface Methodology (RSM) are applied to calibrate the friction coefficient of the DEM model for edible sunflower seeds, which provides a new method for calibrating the DEM parameters of bulk non-spherical materials.
2.1 Geometric Model of Sunflower Seeds
As the area with the most extensive sunflower planting area, Inner Mongolia’s sun-flower output accounts for 59.16% of the national output. From a representative point of view, this study selects two kinds of sunflowers mainly planted in Inner Mongolia Autonomous Region, namely SH361 and SH363 (Inner Mongolia Sanrui Agricultural Technology Co., Ltd., China). To determine the physical geometry model of the sunflower seeds, 100 seeds of each variety are randomly selected. According to the shape characteristics of the sunflower seeds, two mutually perpendicular axial dimensions are defined as the characteristic dimensions, which are length (L) and width (W) and thickness (T), as shown in Fig. 1. Using a digital vernier caliper with an accuracy of 0.01 mm to measure its characteristic dimensions, the average values of the three-axis dimensions (L × W × T) of SH361 and SH363 were 22.34 mm × 9.30 mm × 4.64 mm and 24.13 mm × 9.32 mm × 4.53 mm, respectively, and the three-axis dimensions are normally distributed.
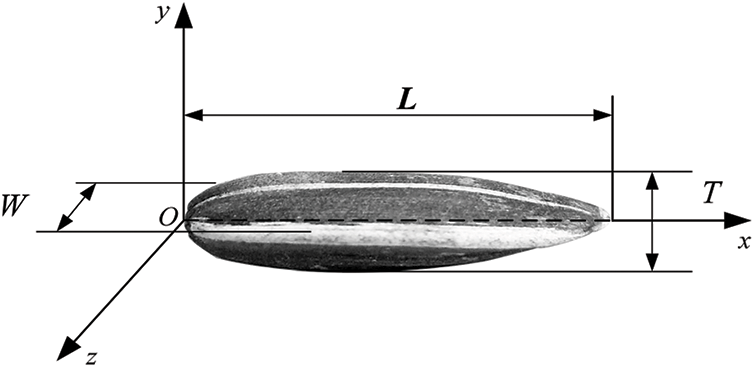
Figure 1: Characteristic size of sunflower seeds
When carrying out the DEM simulation analysis experiment, it is necessary to set the distribution attributes of the sunflower simulation model. In this study, the parameter setting is based on the volume distribution of the sunflower. Calculate the volume of sunflower seeds (V) according to formula (1) [25], and use IBM SPSS Statistics 24 software to perform KS test. The significance levels (P) of SH361and SH363 are 0.200. P > 0.05, showing that the 3D volume of sunflower is normally distributed (Fig. 2). The average value and standard deviation of the two varieties of volume are 299.55 ± 64.94 mm3, and 302.37 ± 65.09 mm3.
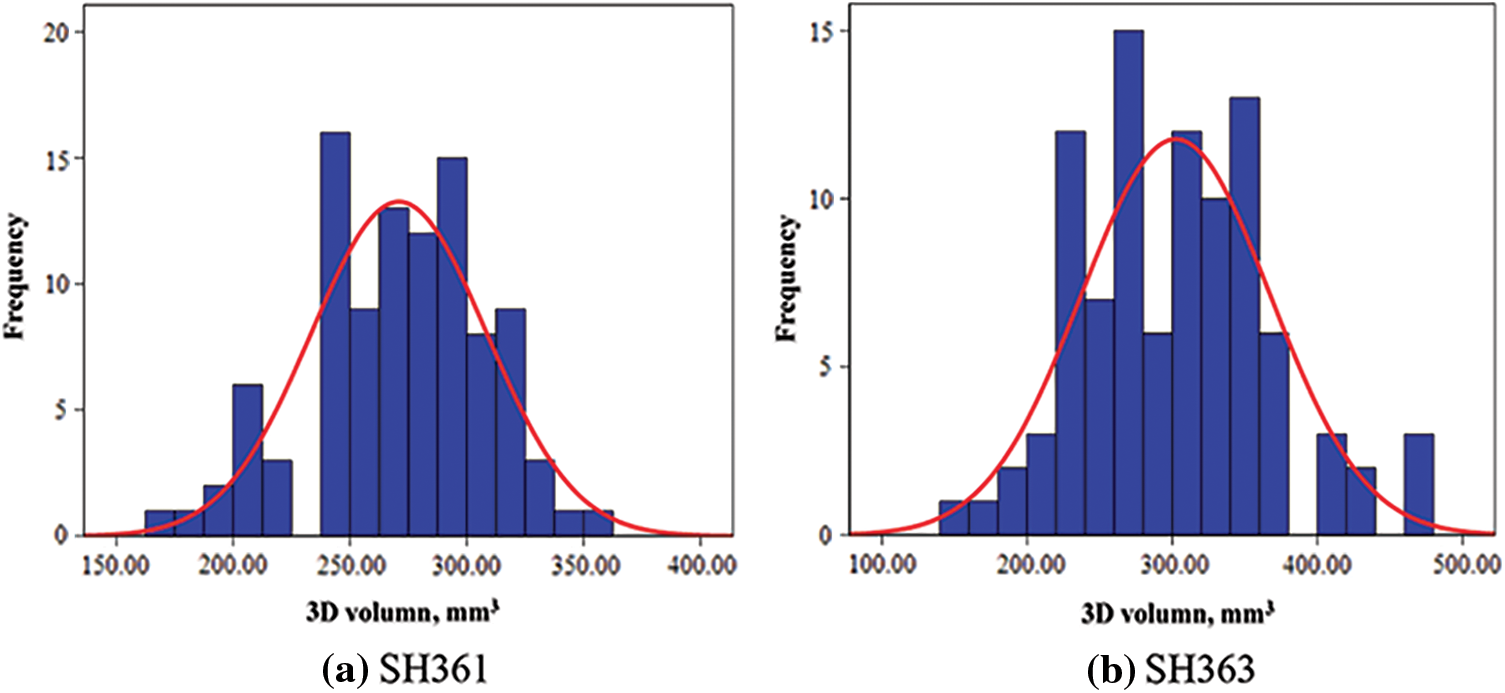
Figure 2: Volume distribution of sunflower seeds
2.2 Discrete Element Method Model of Sunflower Seeds
Real particles are usually irregular in shape, and shape of particles plays a key role in DEM [26,27]. Sunflower seeds are flat, quadrangular, long cone-shaped, and high in the middle abdomen, fluted and sutured to both sides. To establish a more accurate DEM particle model of sunflower seeds and improve the authenticity of simulation experiments, this paper used a 3D scanning profile of sunflower seeds and applied EDEM software for automatic particle filling. For each of the two varieties, take a sunflower seed with a three-axis size close to the average (Figs. 3a and 4a), apply three-dimensional scanning technology, and use the COMET L3D scanner to get the surface contour of the sunflower seed. Based on the shape, adjust the three-axis size to the average value (Figs. 3b and 4b); in order to facilitate the filling of the three-dimensional DEM model of sunflower seeds, the contour file is imported into the Geomagic Wrap software to smooth the surface of the fine bumps (Figs. 3c and 4c). Finally, the processed contour was imported into EDEM 2020 software as a model of sunflower seed particles, and the grid division X, Y and Z of SH361 was set to 50 and SH363 was set to 40, 50 and 40 using the automatic particle filling function. The smoothness uses the default value 5, the minimum particle radius selects the default value 0 mm, and the hard sphere boundary is checked by default, the filling effect is closer to the real contour. There are 245 (Fig. 3d), and 227 (Fig. 4d) filled spheres of each variety.
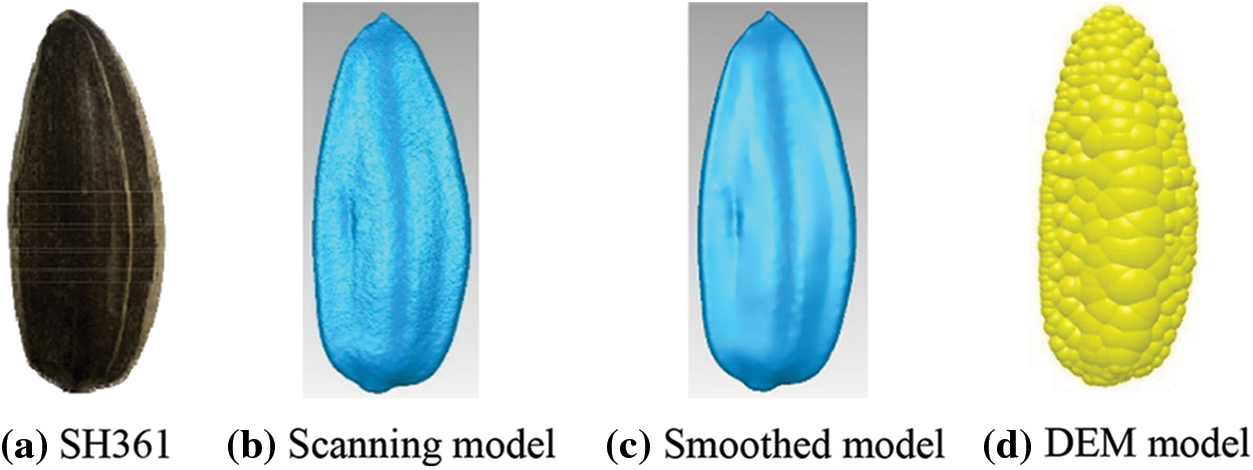
Figure 3: Model of SH361
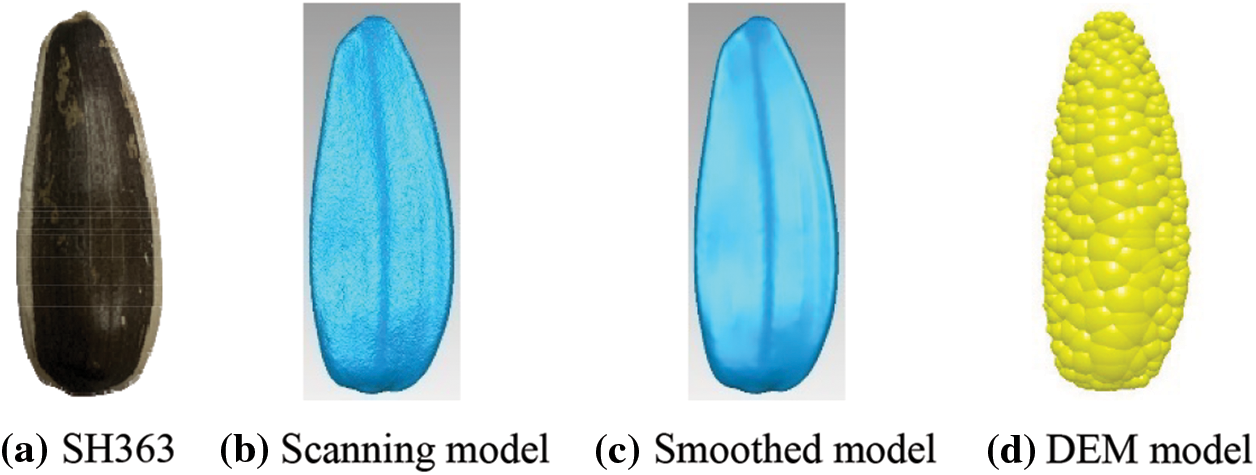
Figure 4: Model of SH363
2.3 Selection of Sunflower Seed Contact Model
In developing the DEM simulation of the sunflower, there is the contact between the seed and the force between the seed and other contact materials. The test contact material in this paper is made of Q235, with a Poisson’s ratio of 0.28, a density of 7850 kg/m3, and a shear modulus of 8.20 × 10¹⁰ Pa [28]. According to the characteristics of the sunflower material, the surface adhesion force is small, and it is assumed that the changes in the displacement, force, speed and other parameters of the particles during the movement are determined by the difference in the amount of small overlap between the particles or between the particles and the contact material. According to Newton’s second law, each sunflower kernel model moves and rotates under the action of force and torque. Based on the above assumptions, the related movement process of sunflower seeds adopts the Hertz-Mindlin non-sliding contact mechanics model [29–31]. In the Hertz-Mindlin non-sliding contact model, the forces between the sunflower seeds or between the seeds and the contact material mainly include normal contact force (Fn), tangential contact force (Ft), normal damping force (Fnd), and tangential damping force (Ftd). The force and moment of any sunflower seed in the system is the sum of the above forces and corresponding moments, which are used to calculate the translational acceleration and rotational acceleration of the seeds, respectively.
Fn is a function of the normal overlap amount (δn), and Ft depends on the tangential overlap amount (δt) and the tangential stiffness (St). Therefore, Fn and Ft satisfy the functional relationship
and
where E*, R*, G* are equivalent Young’s modulus, equivalent radius of curvature and equivalent shear modulus, respectively. And
where νi, Ei, Ri, Gi and νj, Ej, Rj, Gj are the Poisson’s ratio, Young’s modulus, radius of sphere and shear modulus of contact particles i and j, respectively.
Fnd and Ftd on sunflower seeds satisfy the functional relationship
where β, m* are damping ratio and equivalent mass, respectively; Sn, vnrel, St, vtrel represent normal stiffness, normal relative speed and tangential stiffness, tangential relative speed, respectively. And
In the formula, mi and mj are the equivalent masses of contact particles i and j, respectively.
At the same time, Ft is limited by the Coulomb friction force μsFn, where μs is the static friction coefficient. The rolling friction force of the sunflower seeds in the simulated motion is realized by applying a torque (Ti) on the contact surface. Among them, Ti has a relationship with μr, Fn and Ri from the contact point to the center of mass, and the angular velocity (ωi) of the seed at the contact point
Therefore, the simulation parameters that need to be got by using the Hertz-Mindlin non-sliding contact mechanical model are particle density, particle size, Poisson’s ratio, Young’s modulus, shear modulus, collision recovery coefficient, static friction coefficient and rolling friction coefficient.
3 Determination of Discrete Element Method Simulation Parameters for Sunflower Seeds
In this paper, the density of sunflower seeds is measured by the immersion method, repeat 5 times for each variety. Using IBM SPSS Statistics 24 software to perform SW normal distribution test on the density measurement results, and using box plots to test outliers and eliminate them, the density of SH361 is 461.52 ± 5.56 kg/m3, and SH363 is 387.92 ± 1.29 kg/m3.
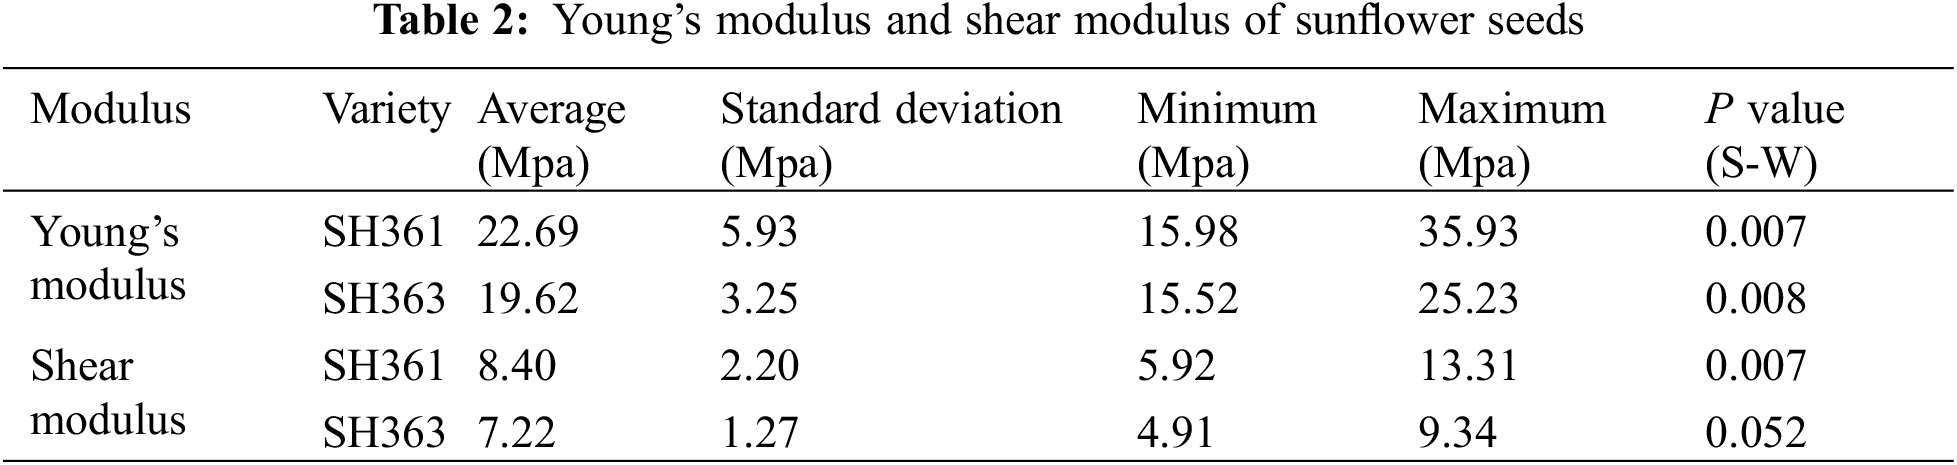
3.2 Young’s Modulus and Shear Modulus
In this paper, the Hertz contact stress method is adopted. According to the ASAE S368.4 DEC 2000 (R2017) standard on the compression test of convex agricultural materials [32], the TMS-Pro physical property analyzer is selected (sensor range: 0∼2.5 kN), The uniaxial compression test is carried out on the thickness direction (Z-axis direction) of sunflower seeds, as shown in Fig. 5.
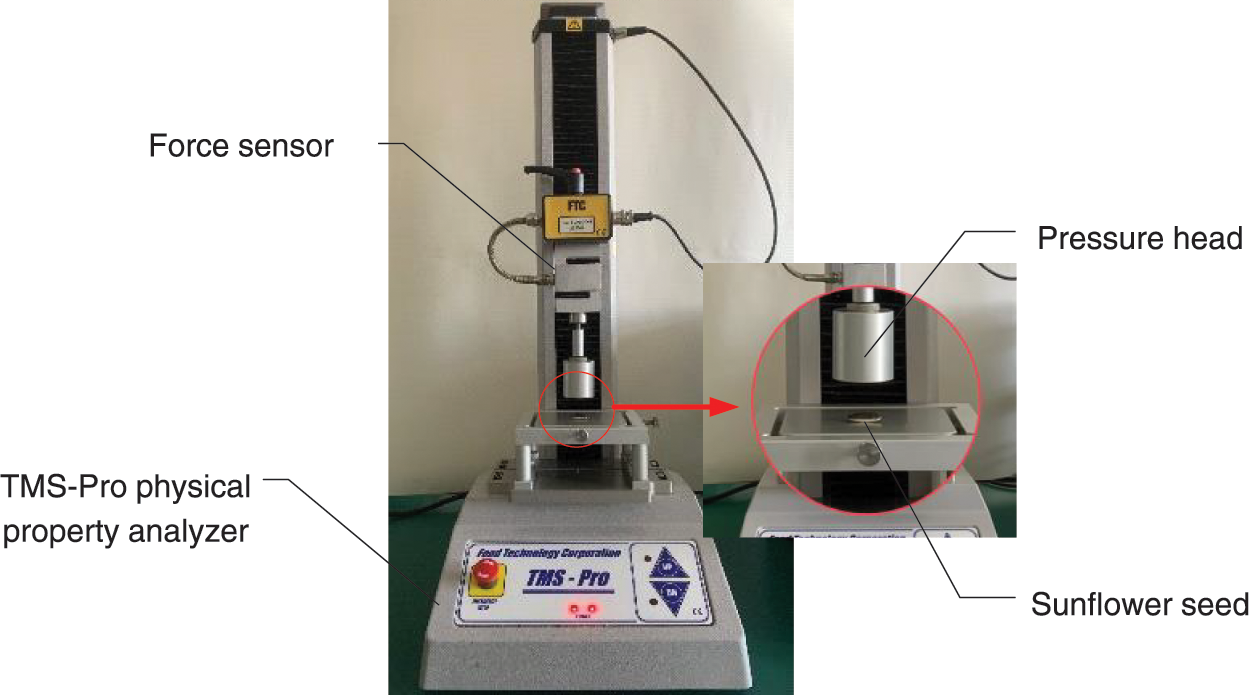
Figure 5: Determination for the Young’s modulus of sunflower seeds
Since the radius of curvature of the two contact surfaces of the sunflower seed and the compression plate are almost the same, the apparent elastic modulus of the sunflower seed is calculated by simplifying the Hertz equation to formula (12) based on the Hertz elastic contact theory.
In the formula, E is the elastic modulus, MPa; F is the load at the limit of sunflower seeds cracking, N; v is the Poisson’s ratio of sunflower seeds, which is taken as 0.35 [33]; d is the deformation variable, mm; KU is determined by the constant determined by the radius of curvature (checked from Tables 2–5 by the value of cosθ using interpolation [34]); RZ, RZ’ are divided into the minimum and maximum radius of curvature of the convex surface at the contact point between the sunflower seeds and the plate, mm. Among them, cosθ, RZ and RZ’ are calculated by formula (13) [35].
The shear modulus G (unit: MPa) of sunflower seeds is calculated by formula (14).
Using the same data processing method for the measurement results, the statistical analysis results of elastic modulus and shear modulus are shown in Table 2.
3.3 Coefficient of Restitution
The coefficient of restitution of sunflower seeds was determined by a free fall test [12], in which a bonded plate of sunflower seeds and a Q235 plate were used as the contact base plate. In this paper, a POC. dimax S high-speed camera was used, the setting was 1000 frames per second, the shooting background was coordinate grid paper, and the bounce height of sunflower seeds was shot from the vertical angle of its falling direction, and the TEMA3.4-500 software was used to view and mark the bounce height of the seeds. Determining the coefficient of restitution of sunflower seeds is shown in Fig. 6. The collision process between sunflower seeds and Q235 is shown in Fig. 7.
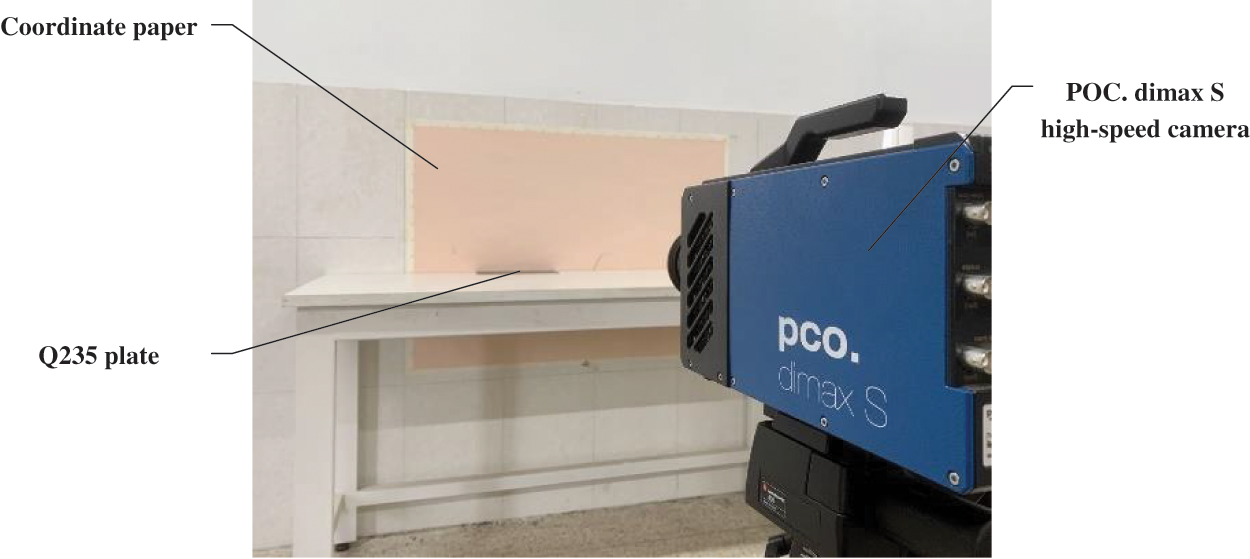
Figure 6: Determination for the coefficient of restitution of sunflower seeds
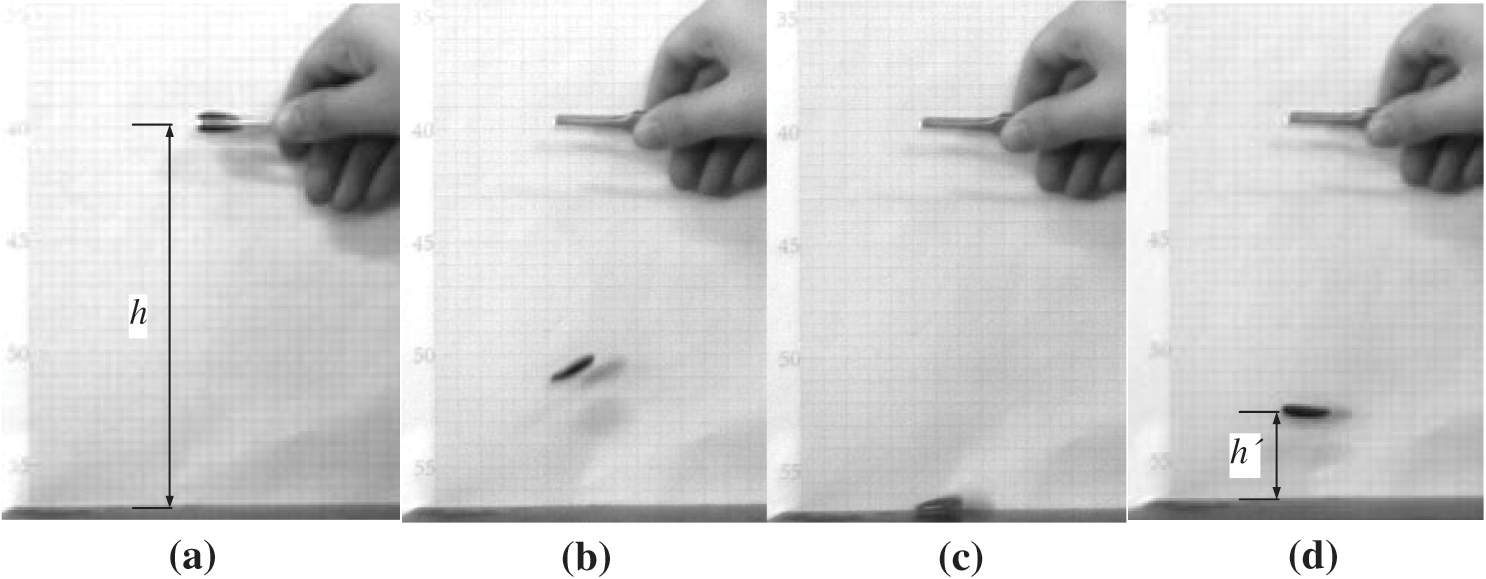
Figure 7: The collision process of sunflower seeds with Q235
The collision recovery coefficient of sunflower seeds was calculated by formula (15).
where, e is the collision recovery coefficient; h’ is the maximum height of rebound after collision, mm; and h is the drop height before collision, 170 mm (set with reference to the height between the seed catching base plate and the seed collecting winch of 4ZXRKS-4 sunflower combine harvester).
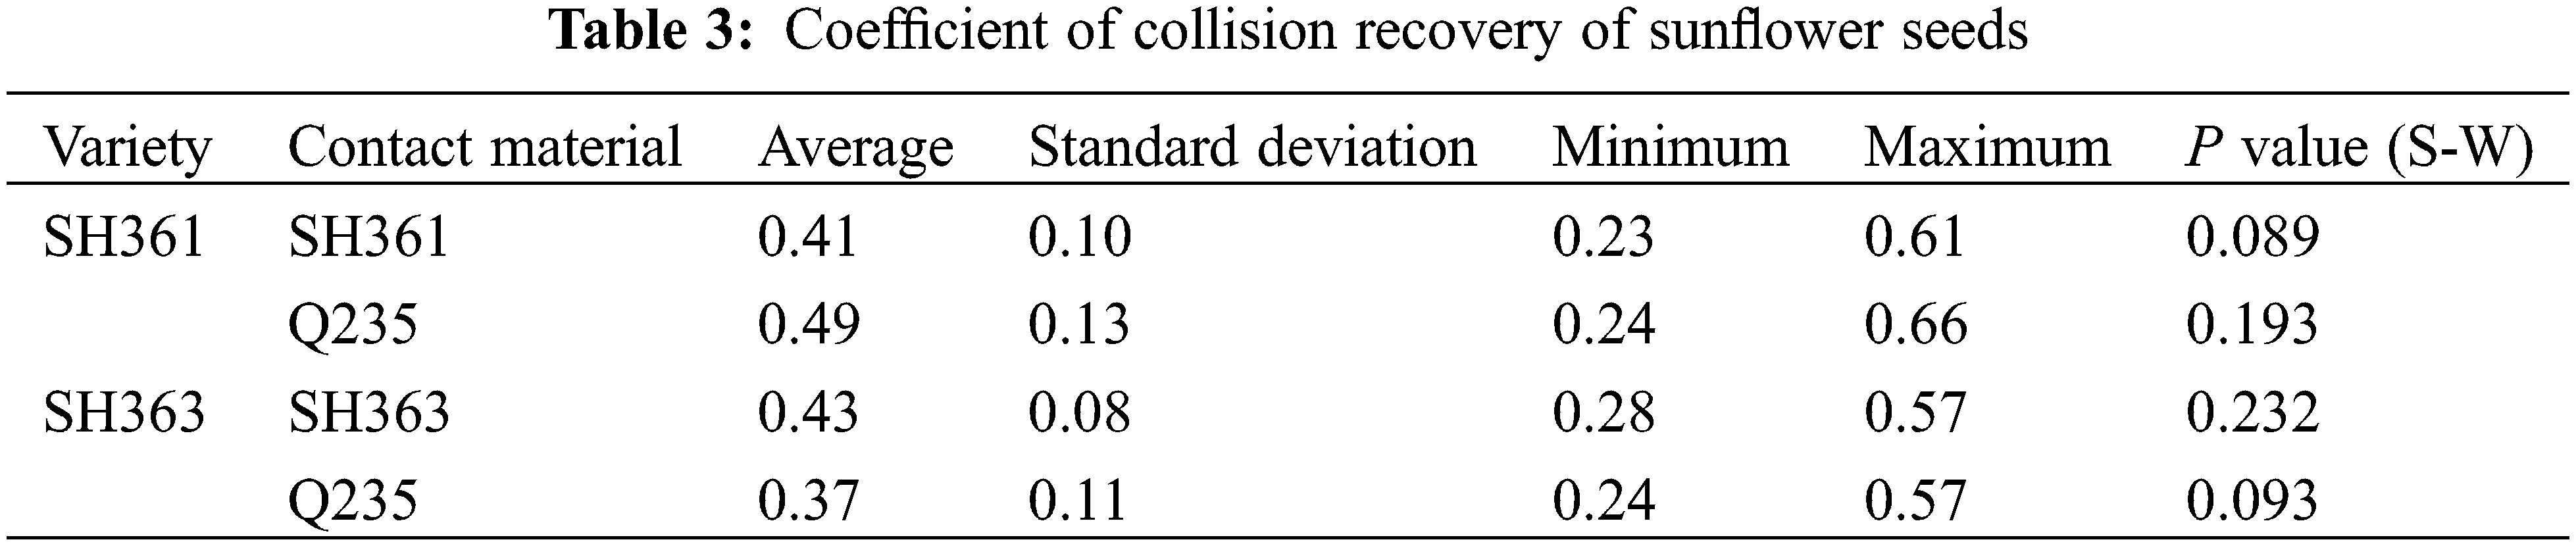
To reduce the measurement error and the influence of individual differences between sunflower seeds on the test results, 30 sunflower seeds of each variety were randomly selected, and the effective fall test results were retained; the results of the statistical analysis of the collision recovery coefficients between sunflower seeds and each contact material are shown in Table 3.
3.4 Coefficient of Static Friction
In this paper, the static friction coefficients between sunflower seed and between sunflower seed and Q235 were determined by the inclinometer method. The test was carried out with a CNY-1 inclinometer, a digital display inclinometer (measuring range 4 × 90°, measuring accuracy ±0.2°, resolution 0.05°), a bonding plate of sunflower seeds and a Q235 test plate (250 mm × 100 mm × 2 mm). The static friction coefficient between sunflower seeds and Q235 was measured as shown in Fig. 8.
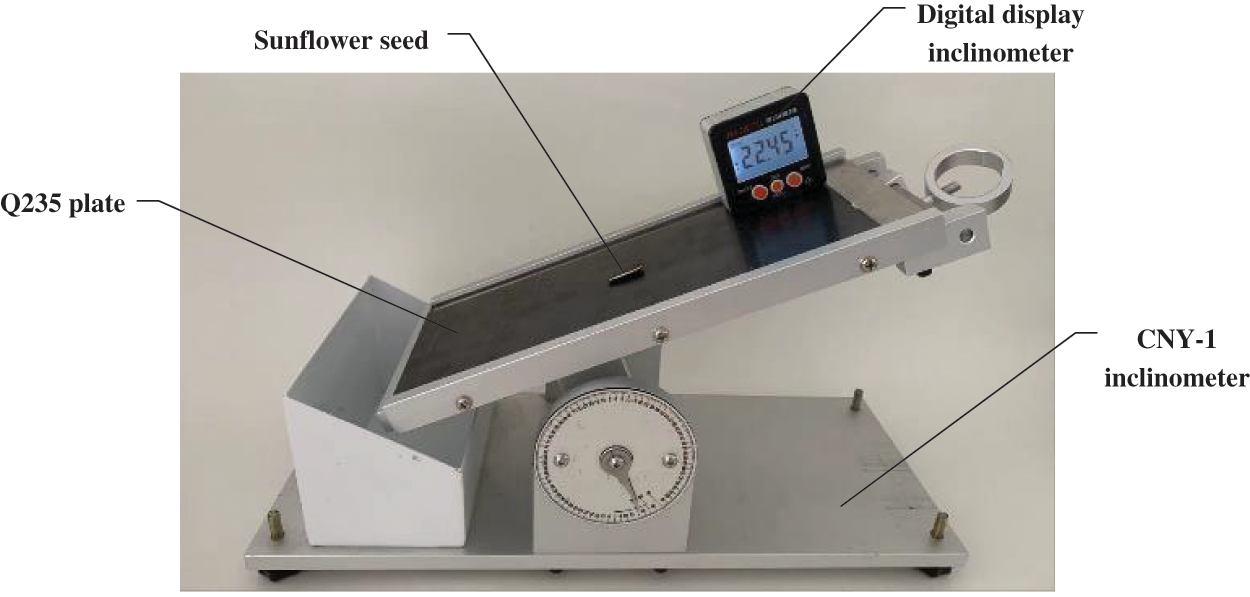
Figure 8: Determination for static friction coefficient of sunflower seeds
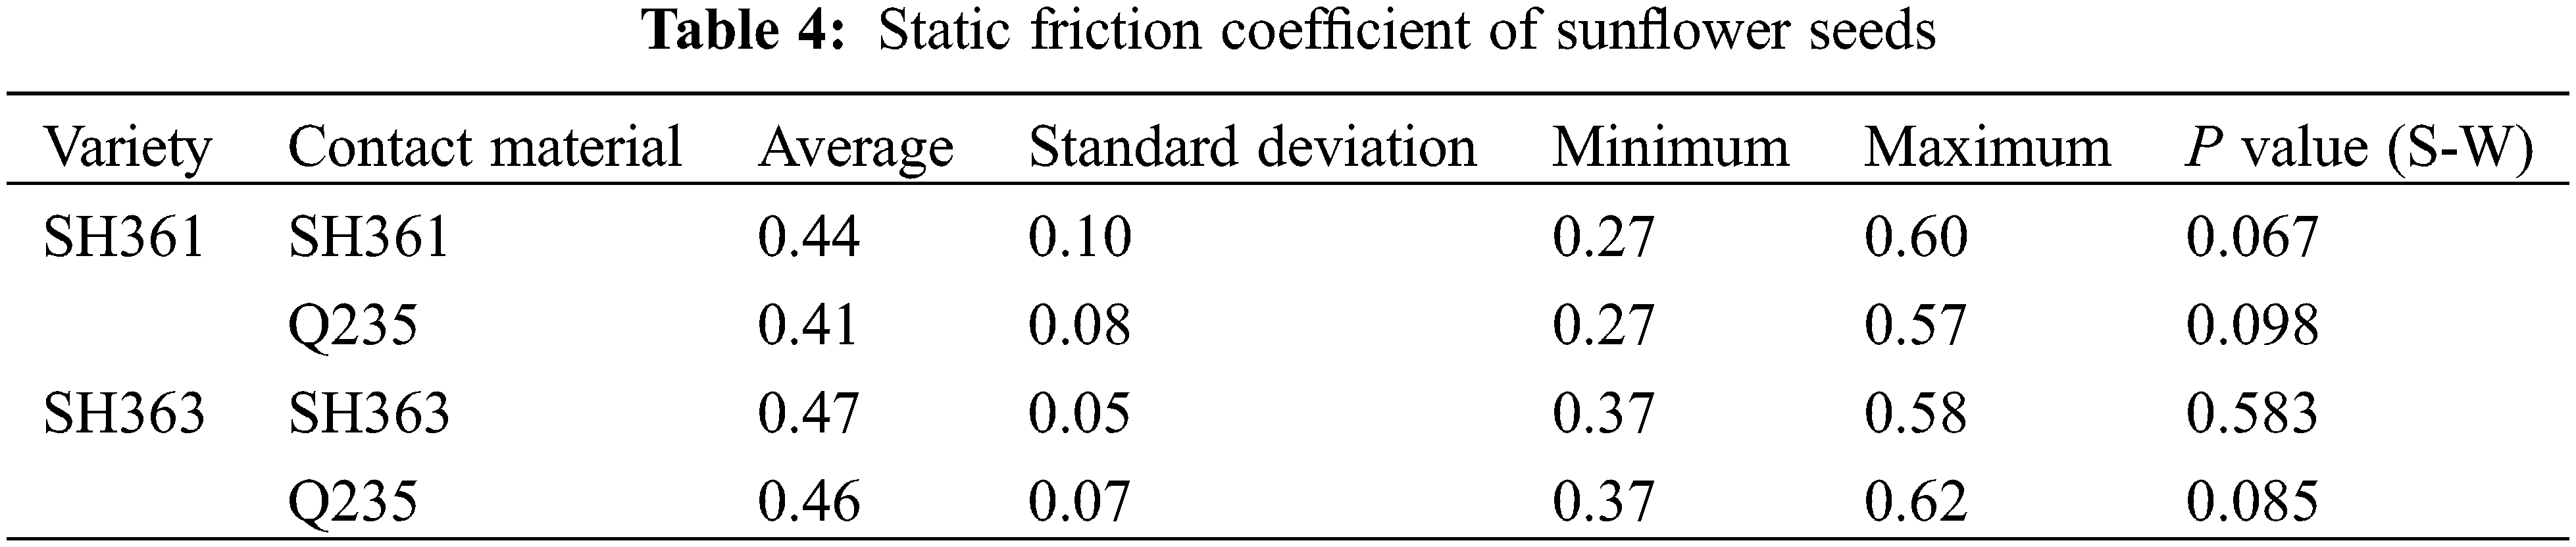
Using the same test method and data processing method, the statistical analysis results of the static friction coefficient between the sunflower seeds and the contact materials are shown in Table 4. The coefficient of variation is less than 15%, indicating that the test repeatability is good, and the difference between individuals is within an acceptable range.
The angle of repose refers to the angle between the cone bus and the bottom plane into which the bulk material accumulates when it falls naturally and continuously from a certain height to a plane, which can reflect the internal friction characteristics and scattering characteristics of the bulk material and is influenced by the shape, size and moisture content of the material [36]. In this paper, the bottomless cylinder method was used for the repose angle test. It is known that the maximum particle size of sunflower seeds is 14.89 mm, and the diameter of the bottomless cylinder should be greater than 4–5 times the particle size of the seeds, and the height of the cylinder is 3 times the diameter [37], so the inner diameter and height of the Q235 bottomless cylinder were made to be 70 and 210 mm, respectively. During the test, the bottom of the cylinder was in contact with a square steel plate with a side length of 45 mm, and the sunflower seeds were filled with the cylinder. The cylinder was lifted vertically upward at a speed of 500 mm/min by a CRIMS DDL200 universal testing machine, and the seeds slowly flowed out from the bottom of the cylinder to form a vertebra, as shown in Fig. 9. After the seed pile slope surface was stabilized, the camera was used to get a front view of the repose angle of the seeds and the test was repeated 5 times.
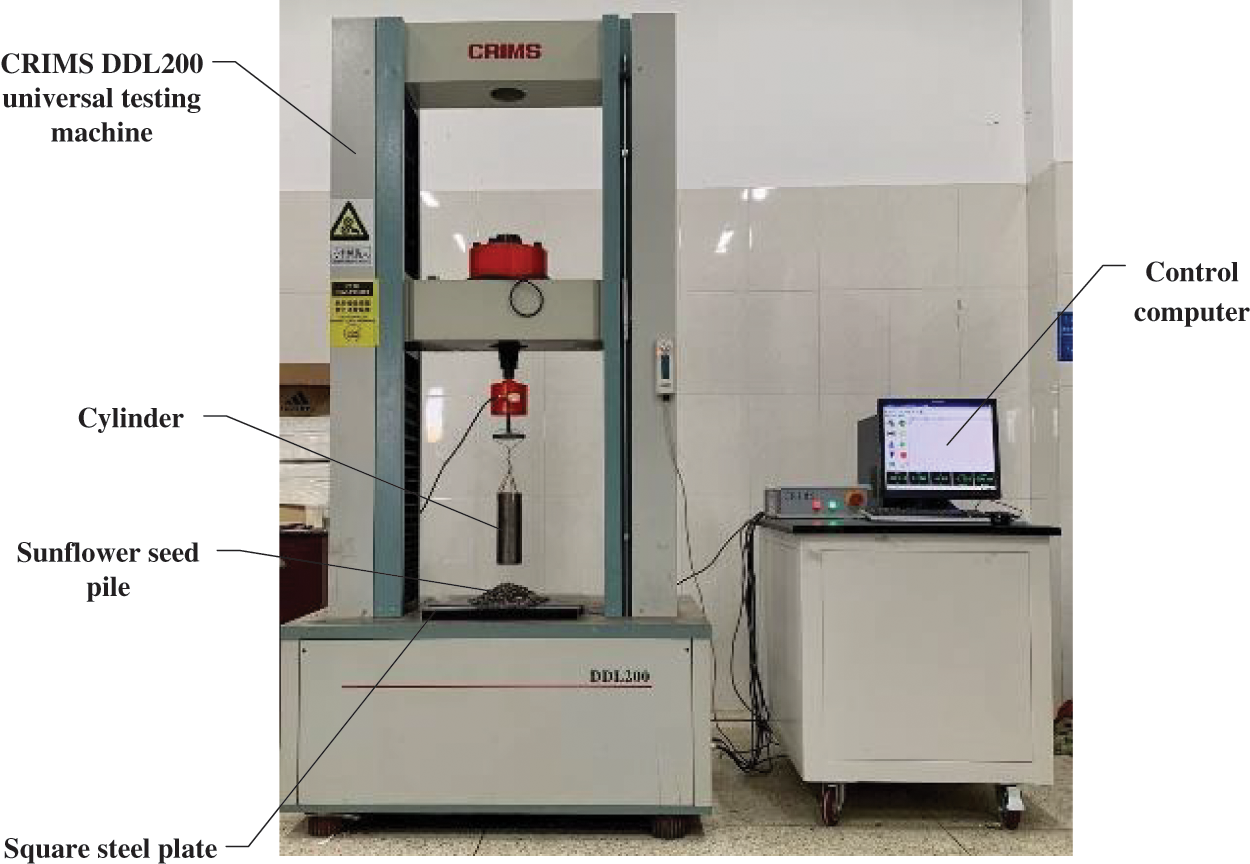
Figure 9: The angle of repose test of sunflower seeds
To obtain more accurate repose angle of sunflower seeds, this paper uses MATLAB image processing techniques to process the front view of the repose angle (Fig. 10a) in grayscale (Fig. 10b), binarize (Fig. 10c), invert the color (Fig. 10d), close the operational hole filling (Fig. 10e), extract the boundary curve and crop (Fig. 10f), and use the least squares method to linearly fit the boundary Fitting, obtaining the fitted linear equations, as shown in Figs.10g and 10h for the left profile and linear fit of the seed pile and the right profile and linear fit of the seed pile. The slope k of the linear equation is the tangent of the side angle of repose. The final angle of repose determination formula is shown in formula (16) [38]:
where, ρ is the angle of repose sunflower seeds, °; k is the slope of the fitted line of the sunflower seeds heap boundary.
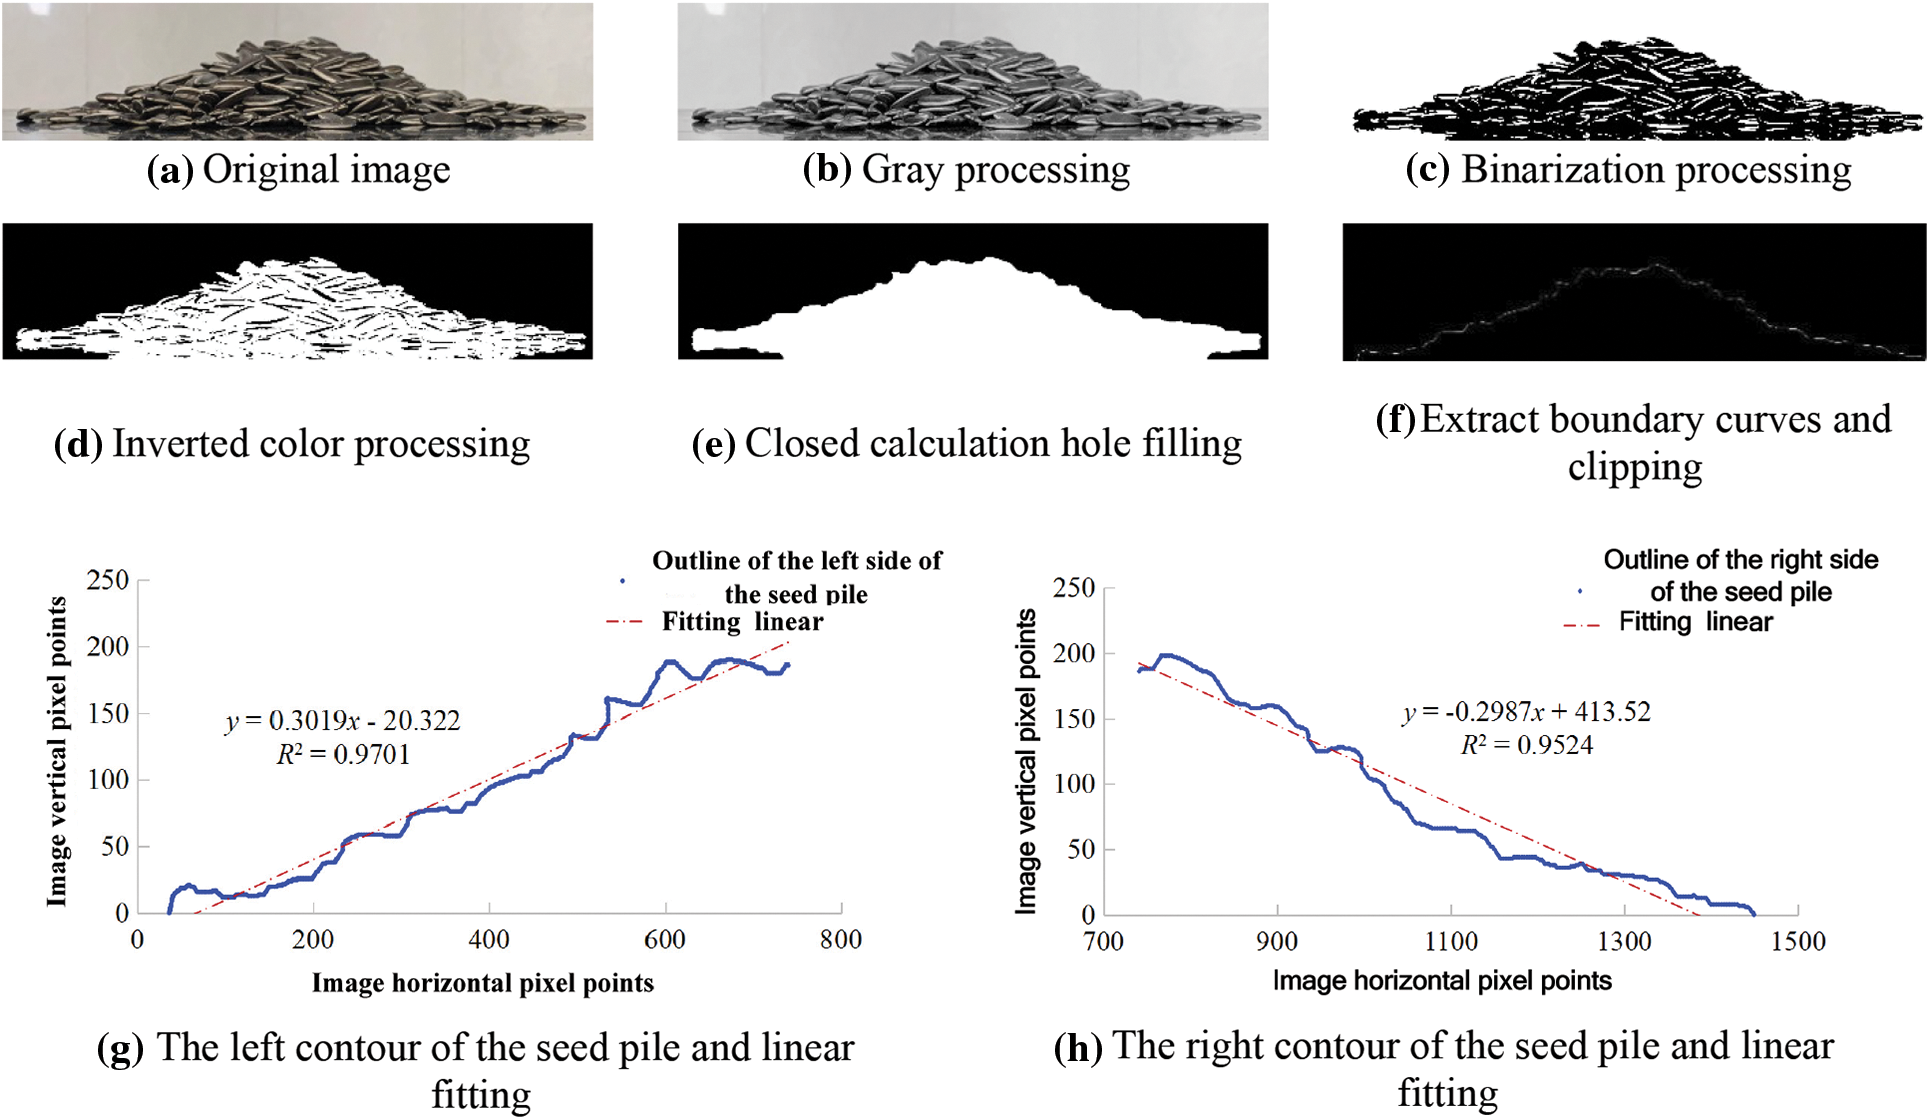
Figure 10: Sunflower seed angle of repose image processing
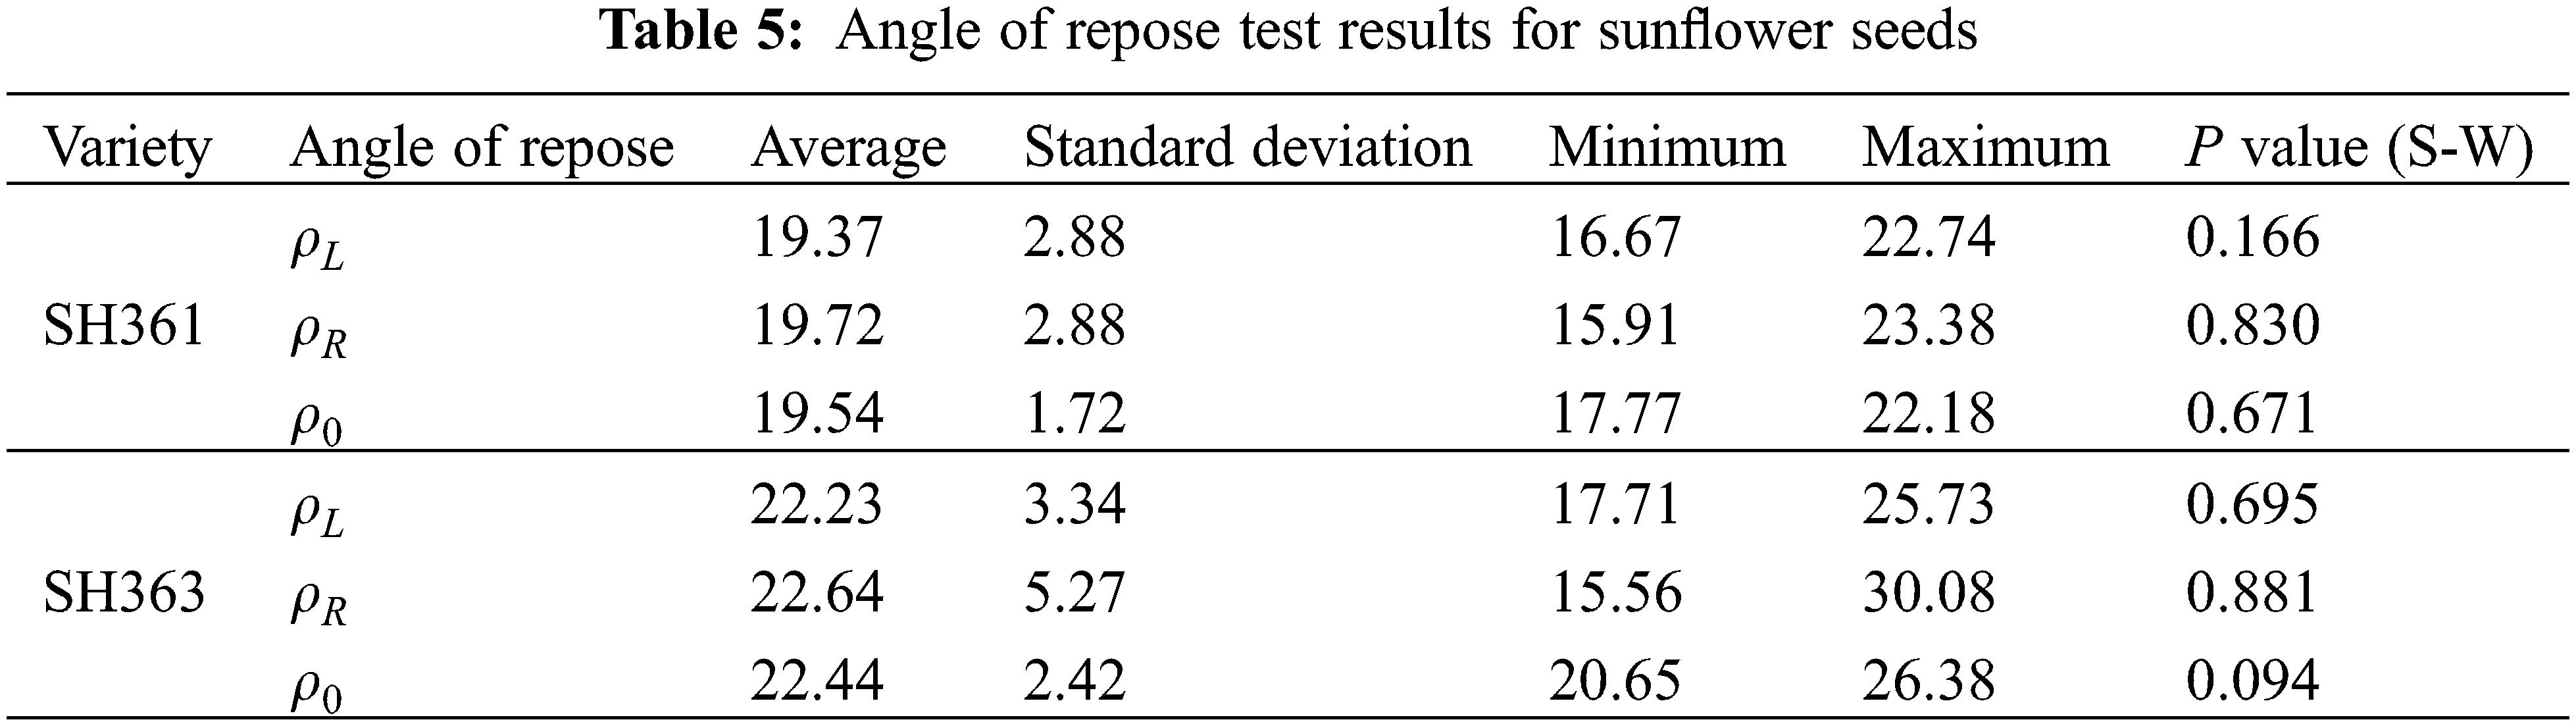
Among them, and are the accumulation angles on the left and right sides of the sunflower seeds. Under this condition, since the accumulation shape is not completely symmetrical, and are not completely equal, so the average of the two angles is taken as the accumulation condition angle of repose [39]. After the SW normal distribution test was performed on the measured results, and the Mahalanobis distance method was used to find and eliminate the multivariate outliers. The statistical results of the data are shown in Table 5.
4.2 Stacking Test Simulation Model
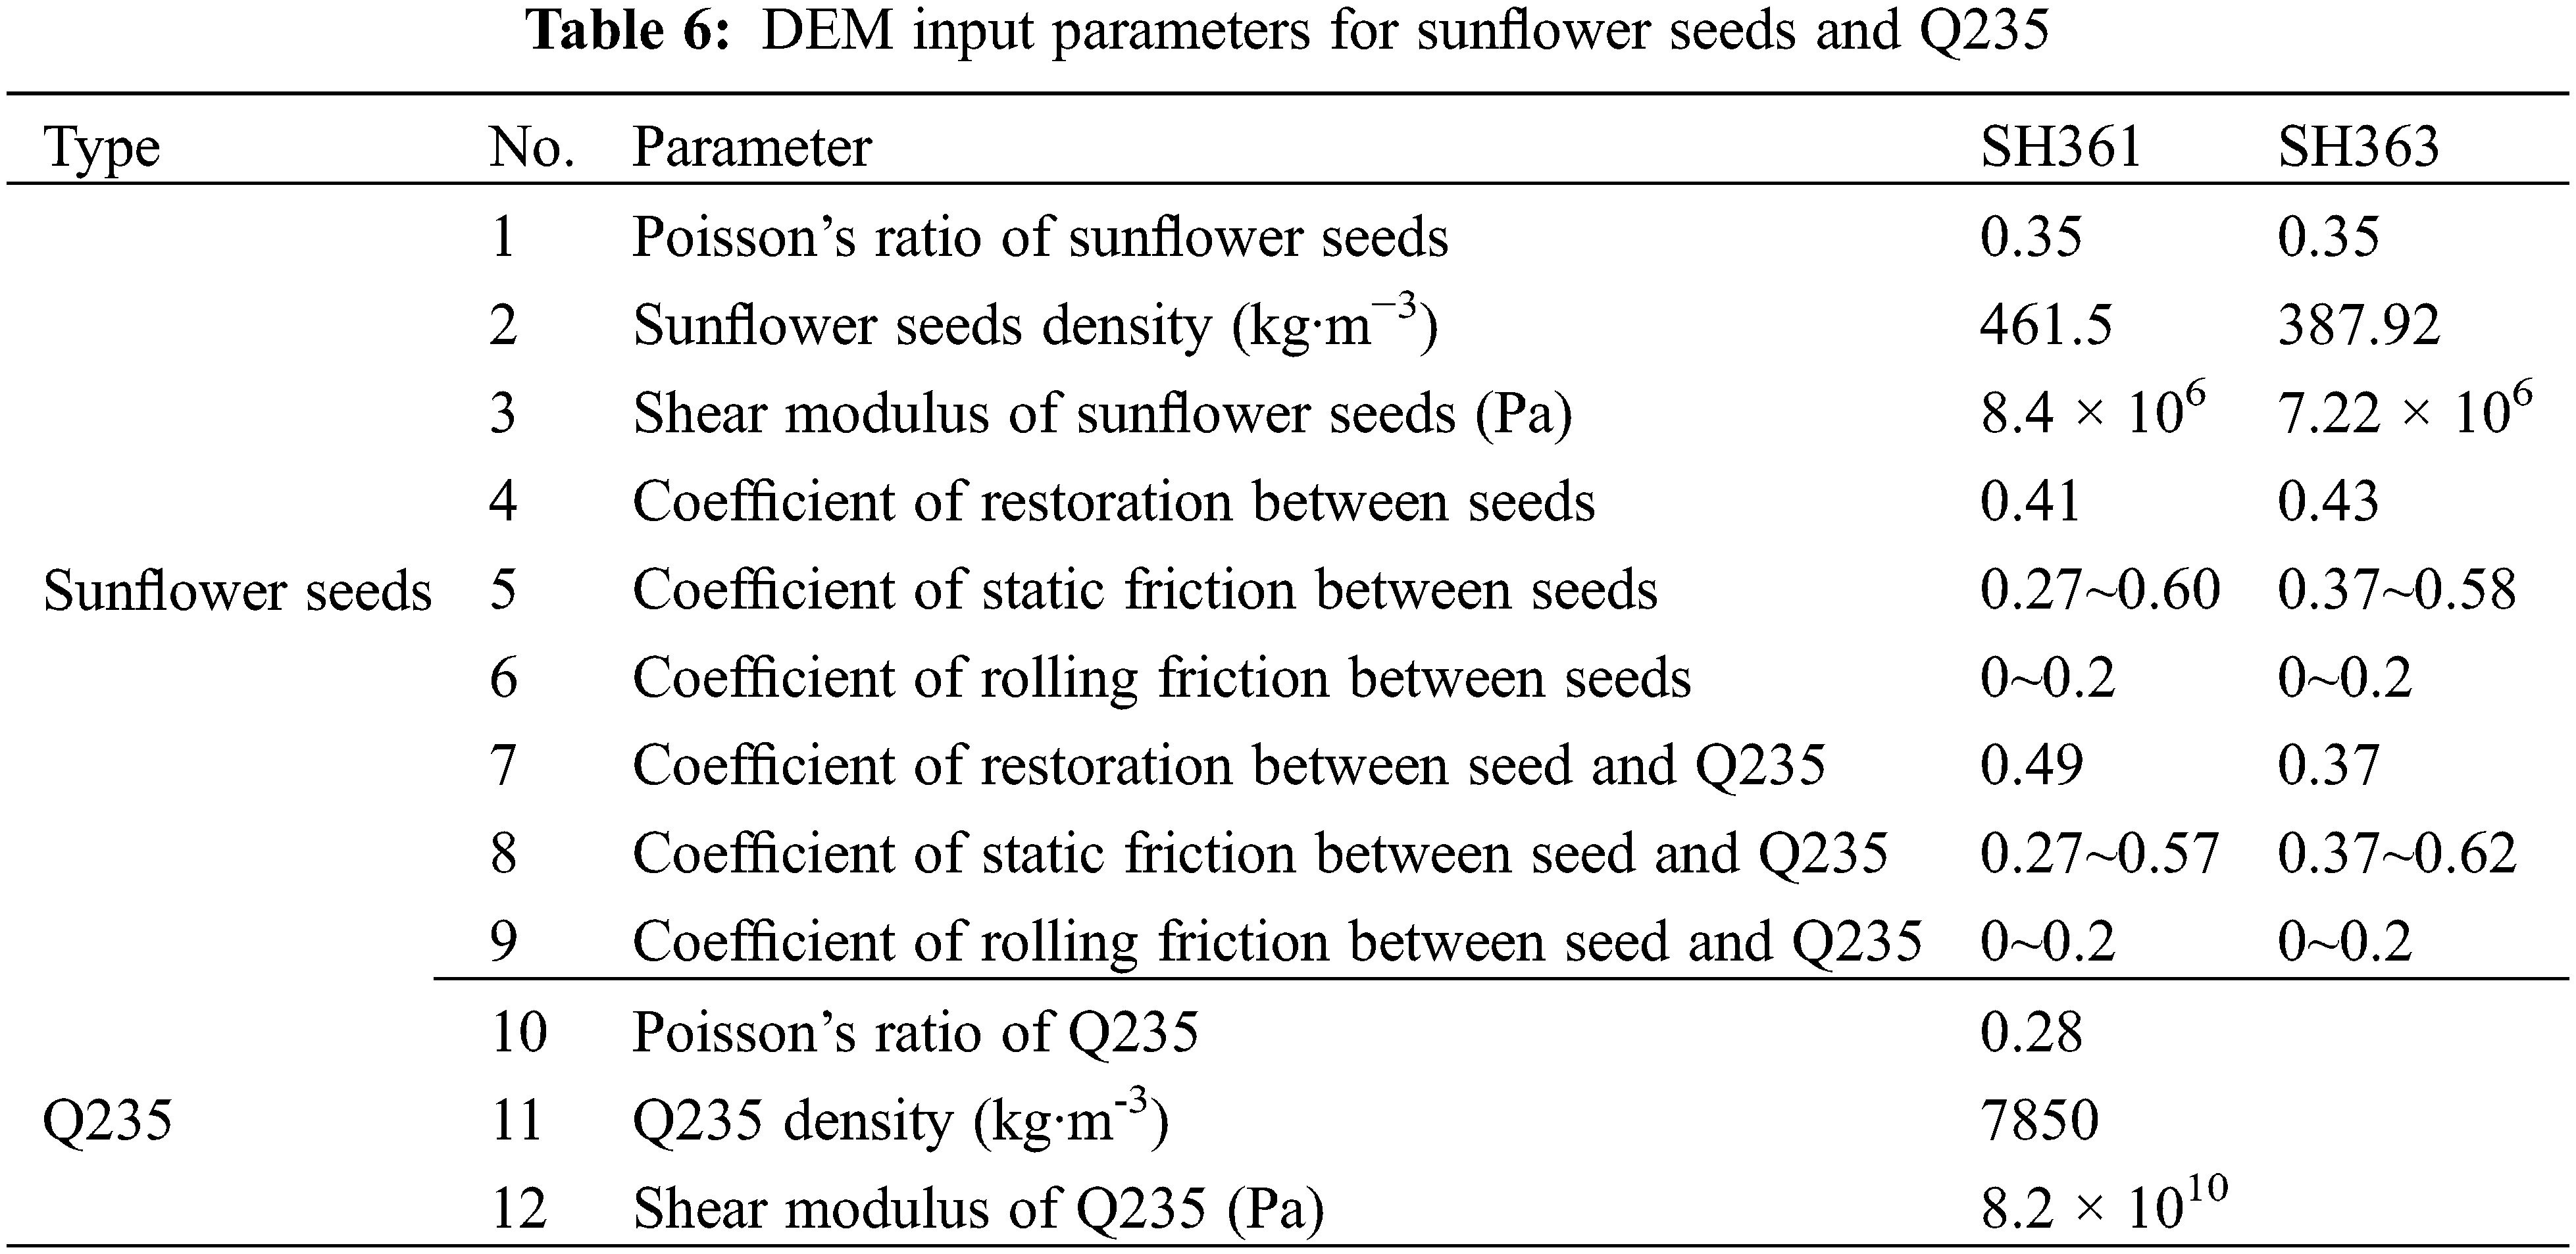
In the stacking test simulation, the inner diameter and height of the cylinder were the same as those used in the test (inner diameter: 70 mm; height: 210 mm), and the upper bottom surface of the cylinder was set as the particle plant. The DEM shape model for sunflower seed particles used the particle model shown in Figs. 3 and 4, which well characterized the shape of sunflower seeds. Based on the known volume distribution of sunflower seeds, it was determined that the volume of seeds in the simulation was generated randomly according to the standard normal distribution, and the seeds fell freely after generation and filled the whole cylinder. After the system reaches equilibrium, the cylinder is lifted vertically at a speed of 500 mm/s, and the particles will slowly flow out from the bottom of the cylinder and finally form a stable pile of seeds on the bottom plate. The cylinder modeling and seed stacking process are shown in Fig. 11. Combining the parameters obtained from each test in this study and referring to the relevant literature, the variation range of each simulation parameter in this study was determined as shown in Table 6. And the Hertz-Mindlin (no-slip) contact model was used. In addition, since the stress wave propagation in the particles is affected by the simulation parameters, the Rayleigh time step may be different in each simulation, so the time step is taken as 20% Rayleigh time step in all simulations. The mesh size in the simulation is taken as 3 times the minimum spherical cell size.
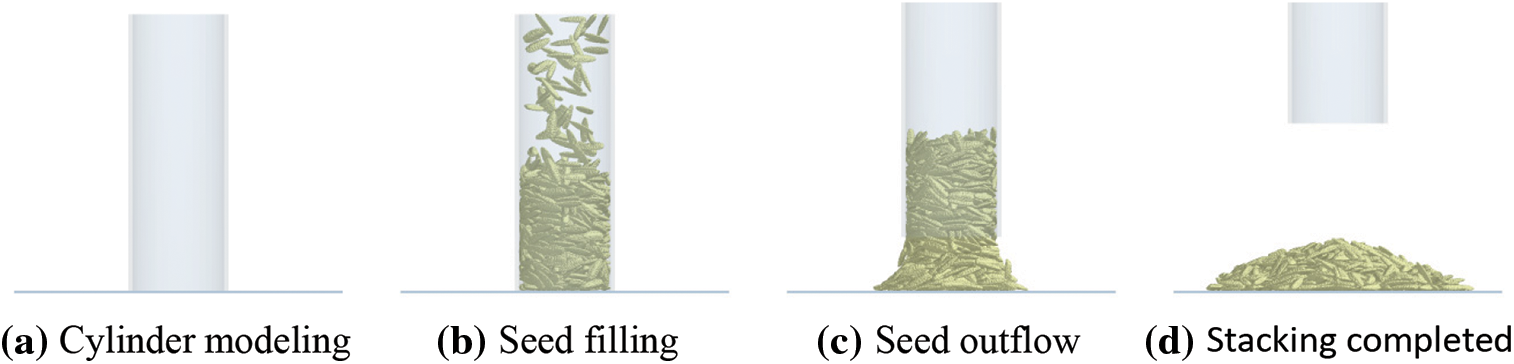
Figure 11: Cylinder modeling and sunflower seed simulation stacking process
4.3 Calibration of Friction Coefficient Between Sunflower Seeds
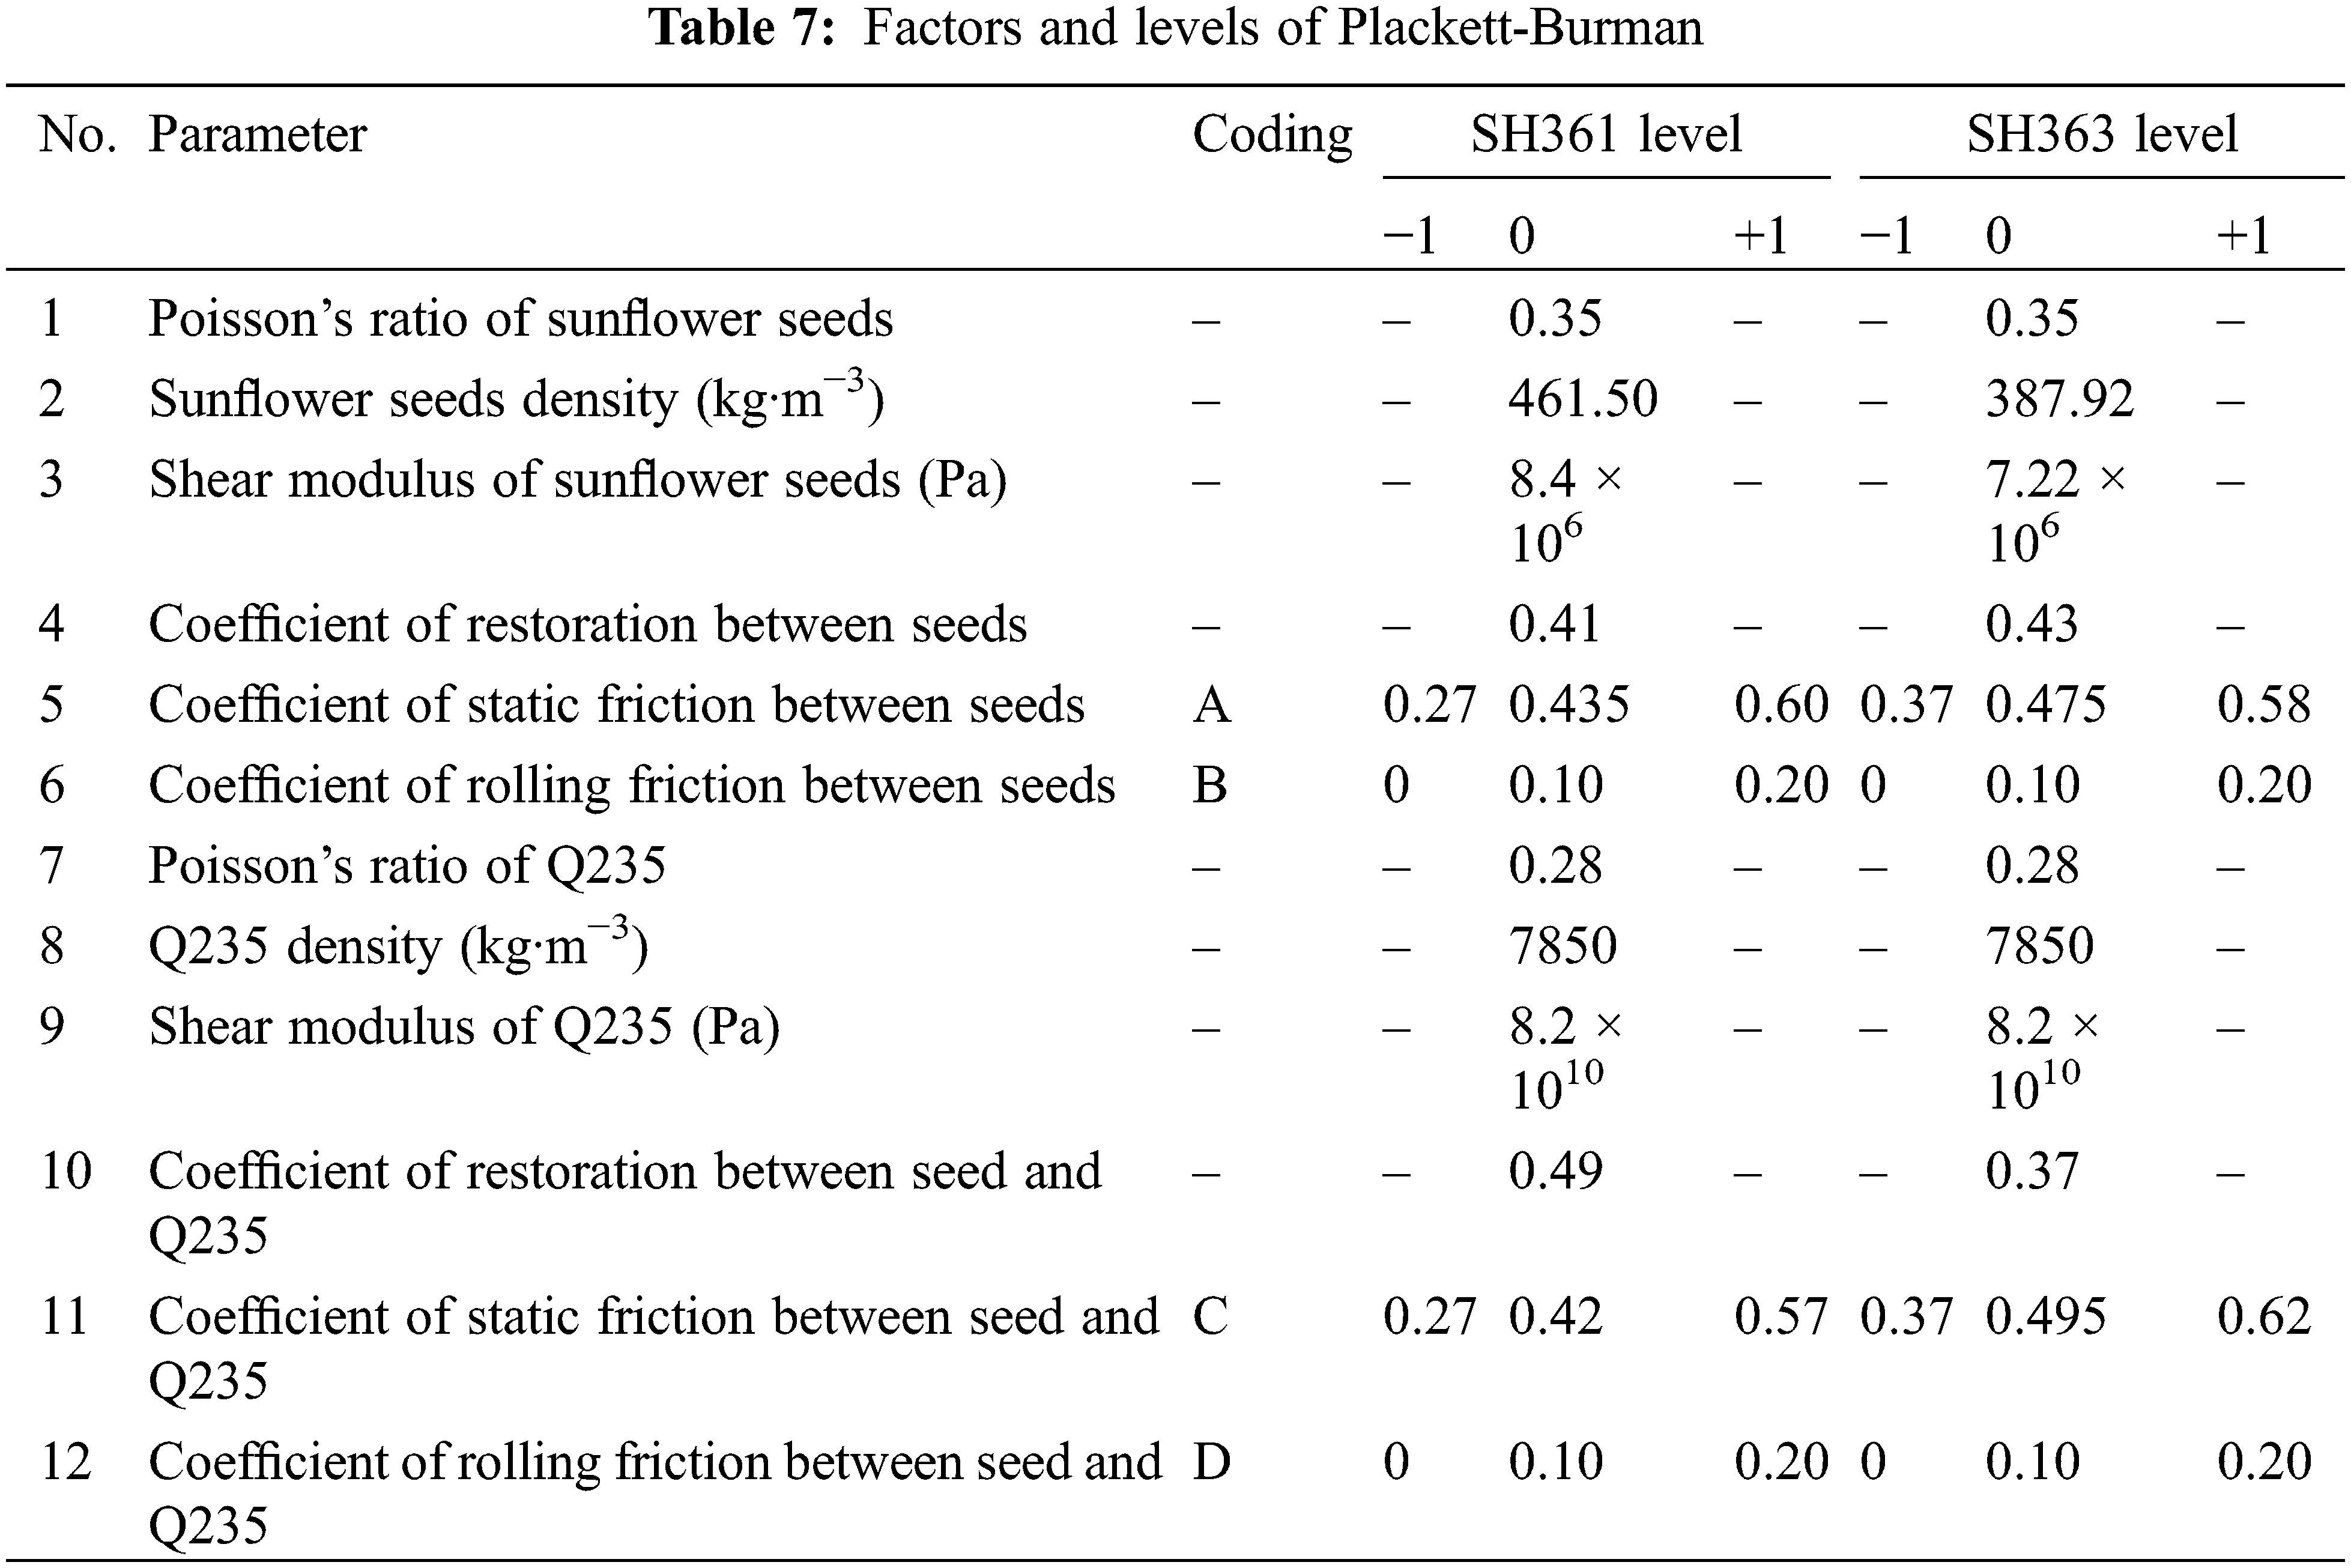
Because the friction coefficient between the sunflower seeds and between the seeds and the material has a significant influence on the angle of repose [6], this paper calibrates the static friction coefficient and rolling friction coefficient of the sunflower seeds. The four parameters of static friction coefficient and rolling friction coefficient between the seeds, between the seeds and the Q235 material are selected as the test factors, and the physical angle of repose of the sunflower is the response value, and the Plackett-Burman test design is carried out using Design Expert 11 software. Plackett-Burman screening tests were conducted to determine the parameters that significantly affect the stacking angle of sunflower seeds, and the static and rolling friction coefficients between sunflower seeds, and the static and rolling friction coefficients between seeds and Q235 were screened to determine the parameters that significantly affect the stacking angle of sunflower seeds. Among them, the minimum and maximum values of the physical test are selected for the static friction coefficient between seeds, between seeds and Q235, the minimum and maximum values of the rolling friction coefficient between seeds, between seeds and Q235 are determined to be 0 and 0.2 [7], and the average value of other input parameters is determined by experiments, and the maximum and minimum values of the four friction coefficients are coded as level +1 and −1, respectively. The results are shown in Table 7. The Plackett-Burman experimental design used 1 center point and a total of 13 simulated repose angle tests were carried out in EDEM 2020 software, and repose angle measurements were carried out using image processing methods after the seeds had gradually stabilized. The Plackett-Burman test protocol and results are shown in Table 8, and the significance analysis of the test parameters is shown in Table 9.
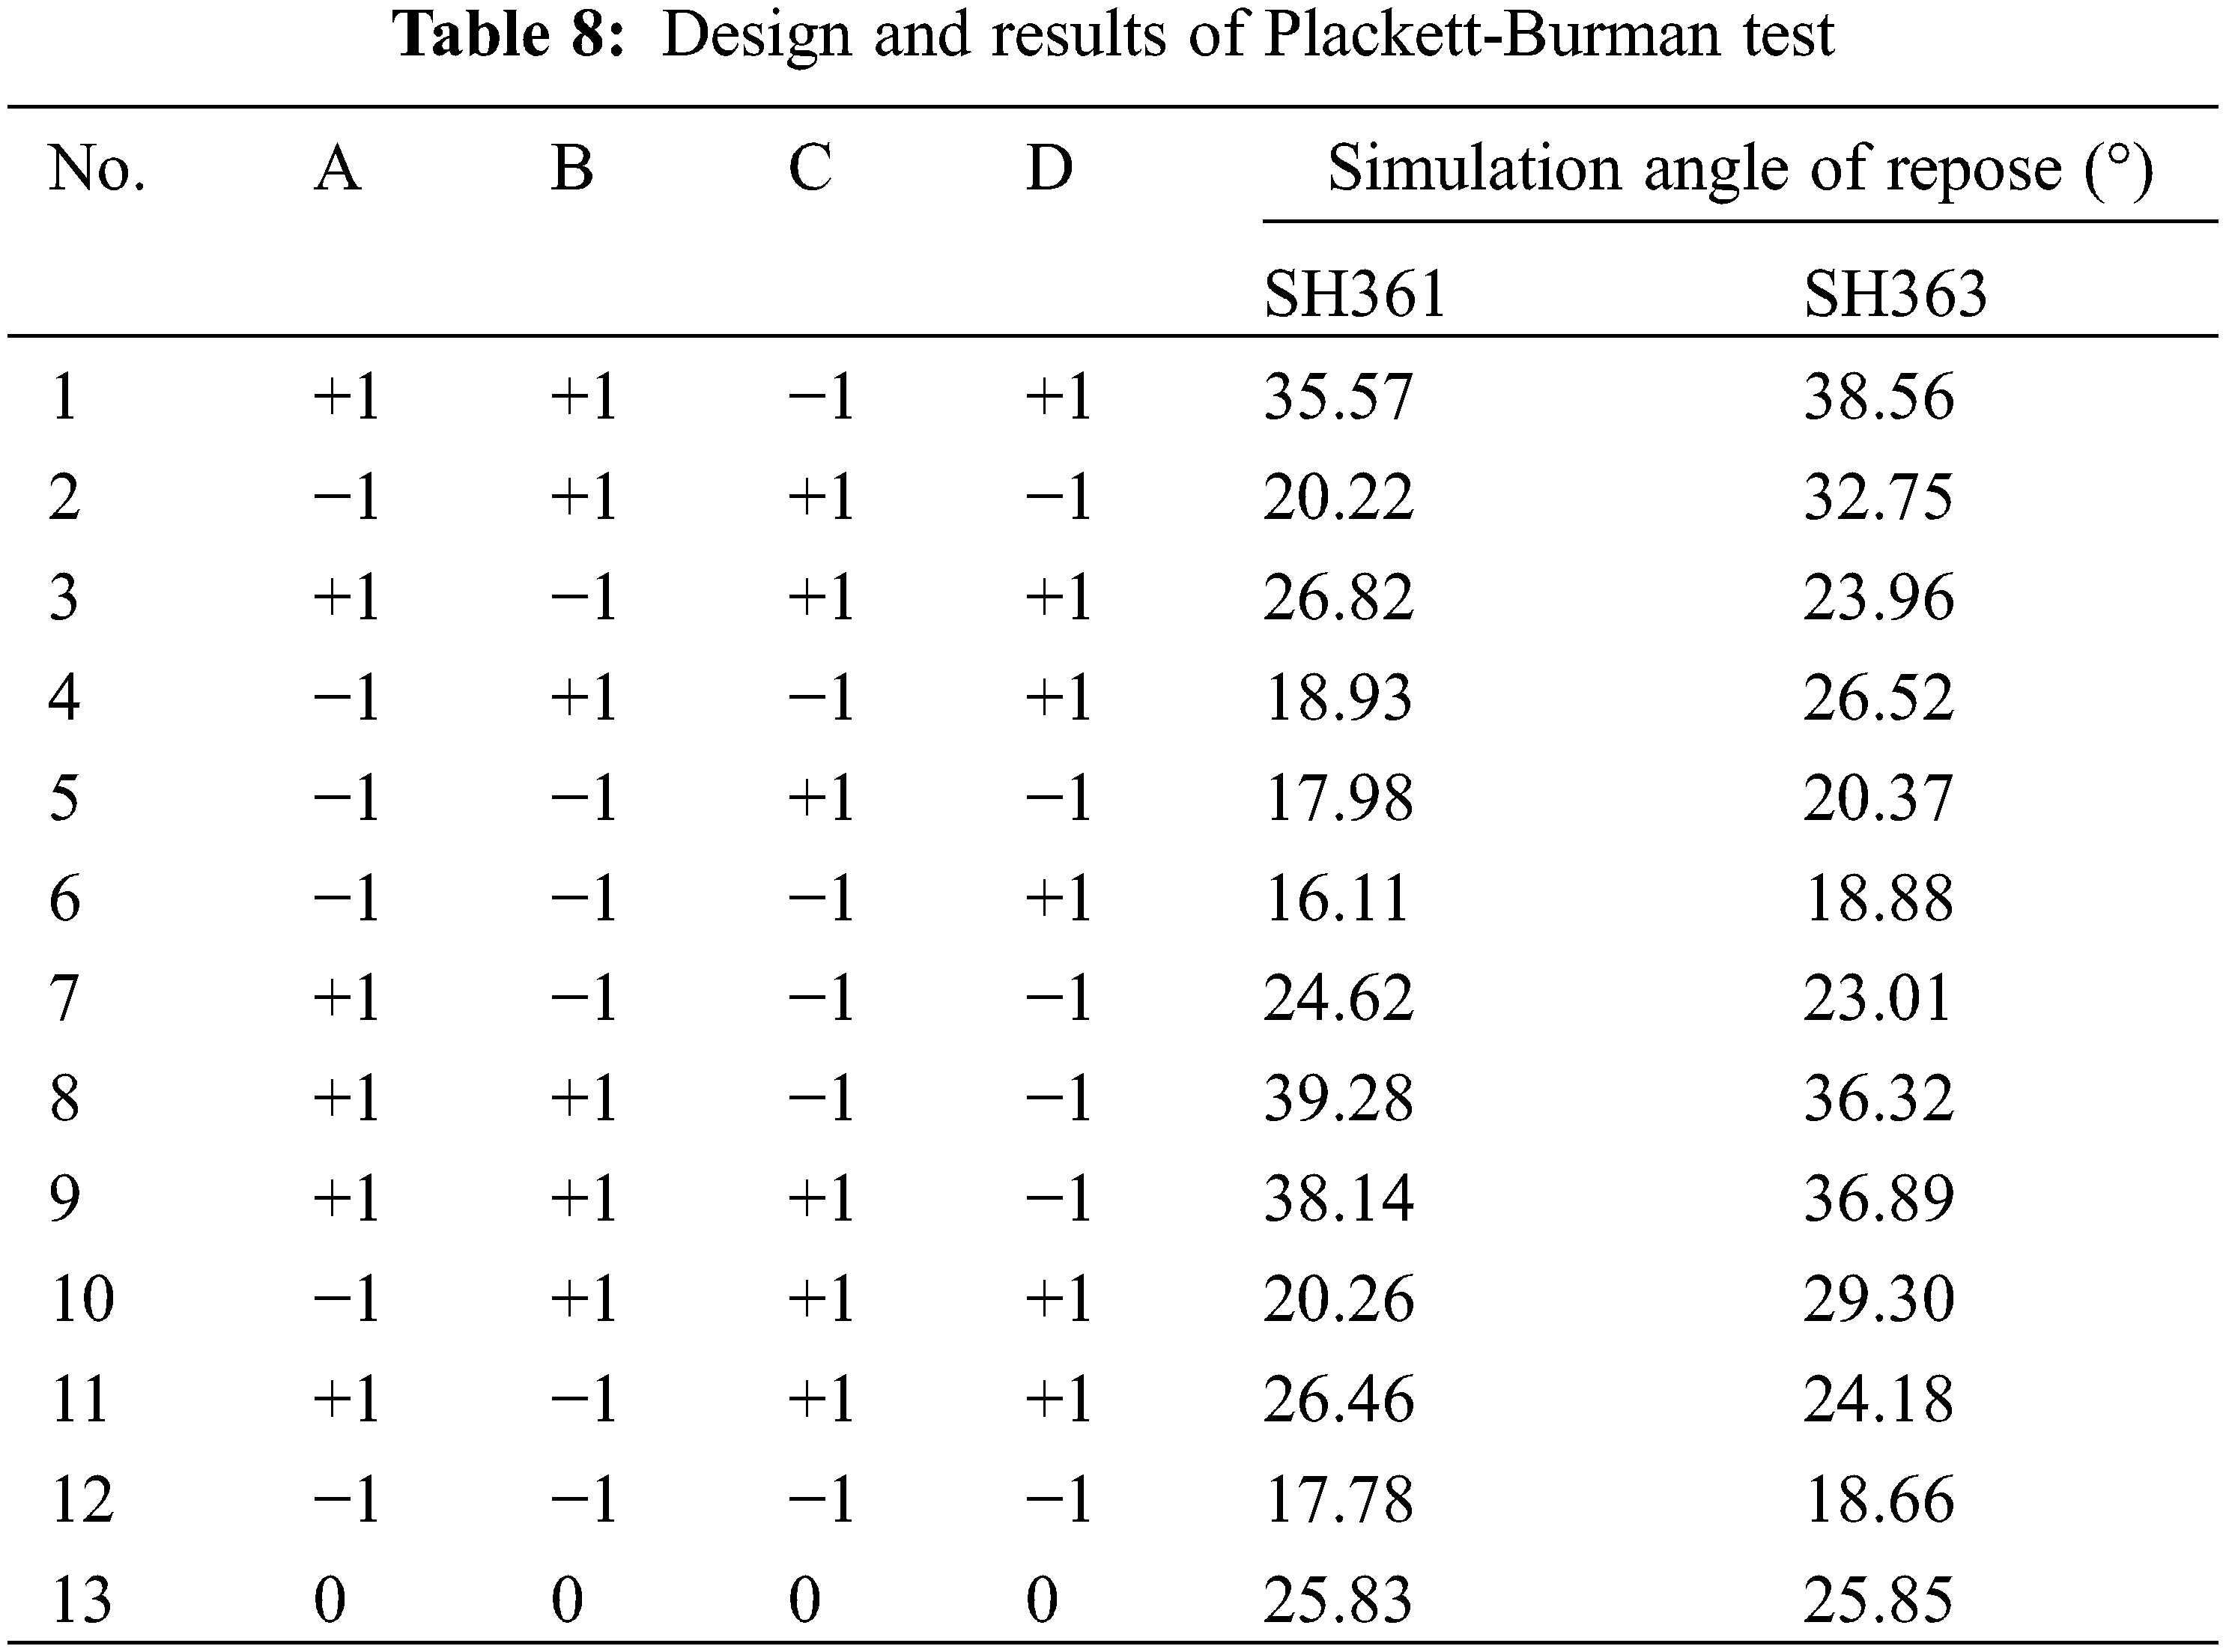
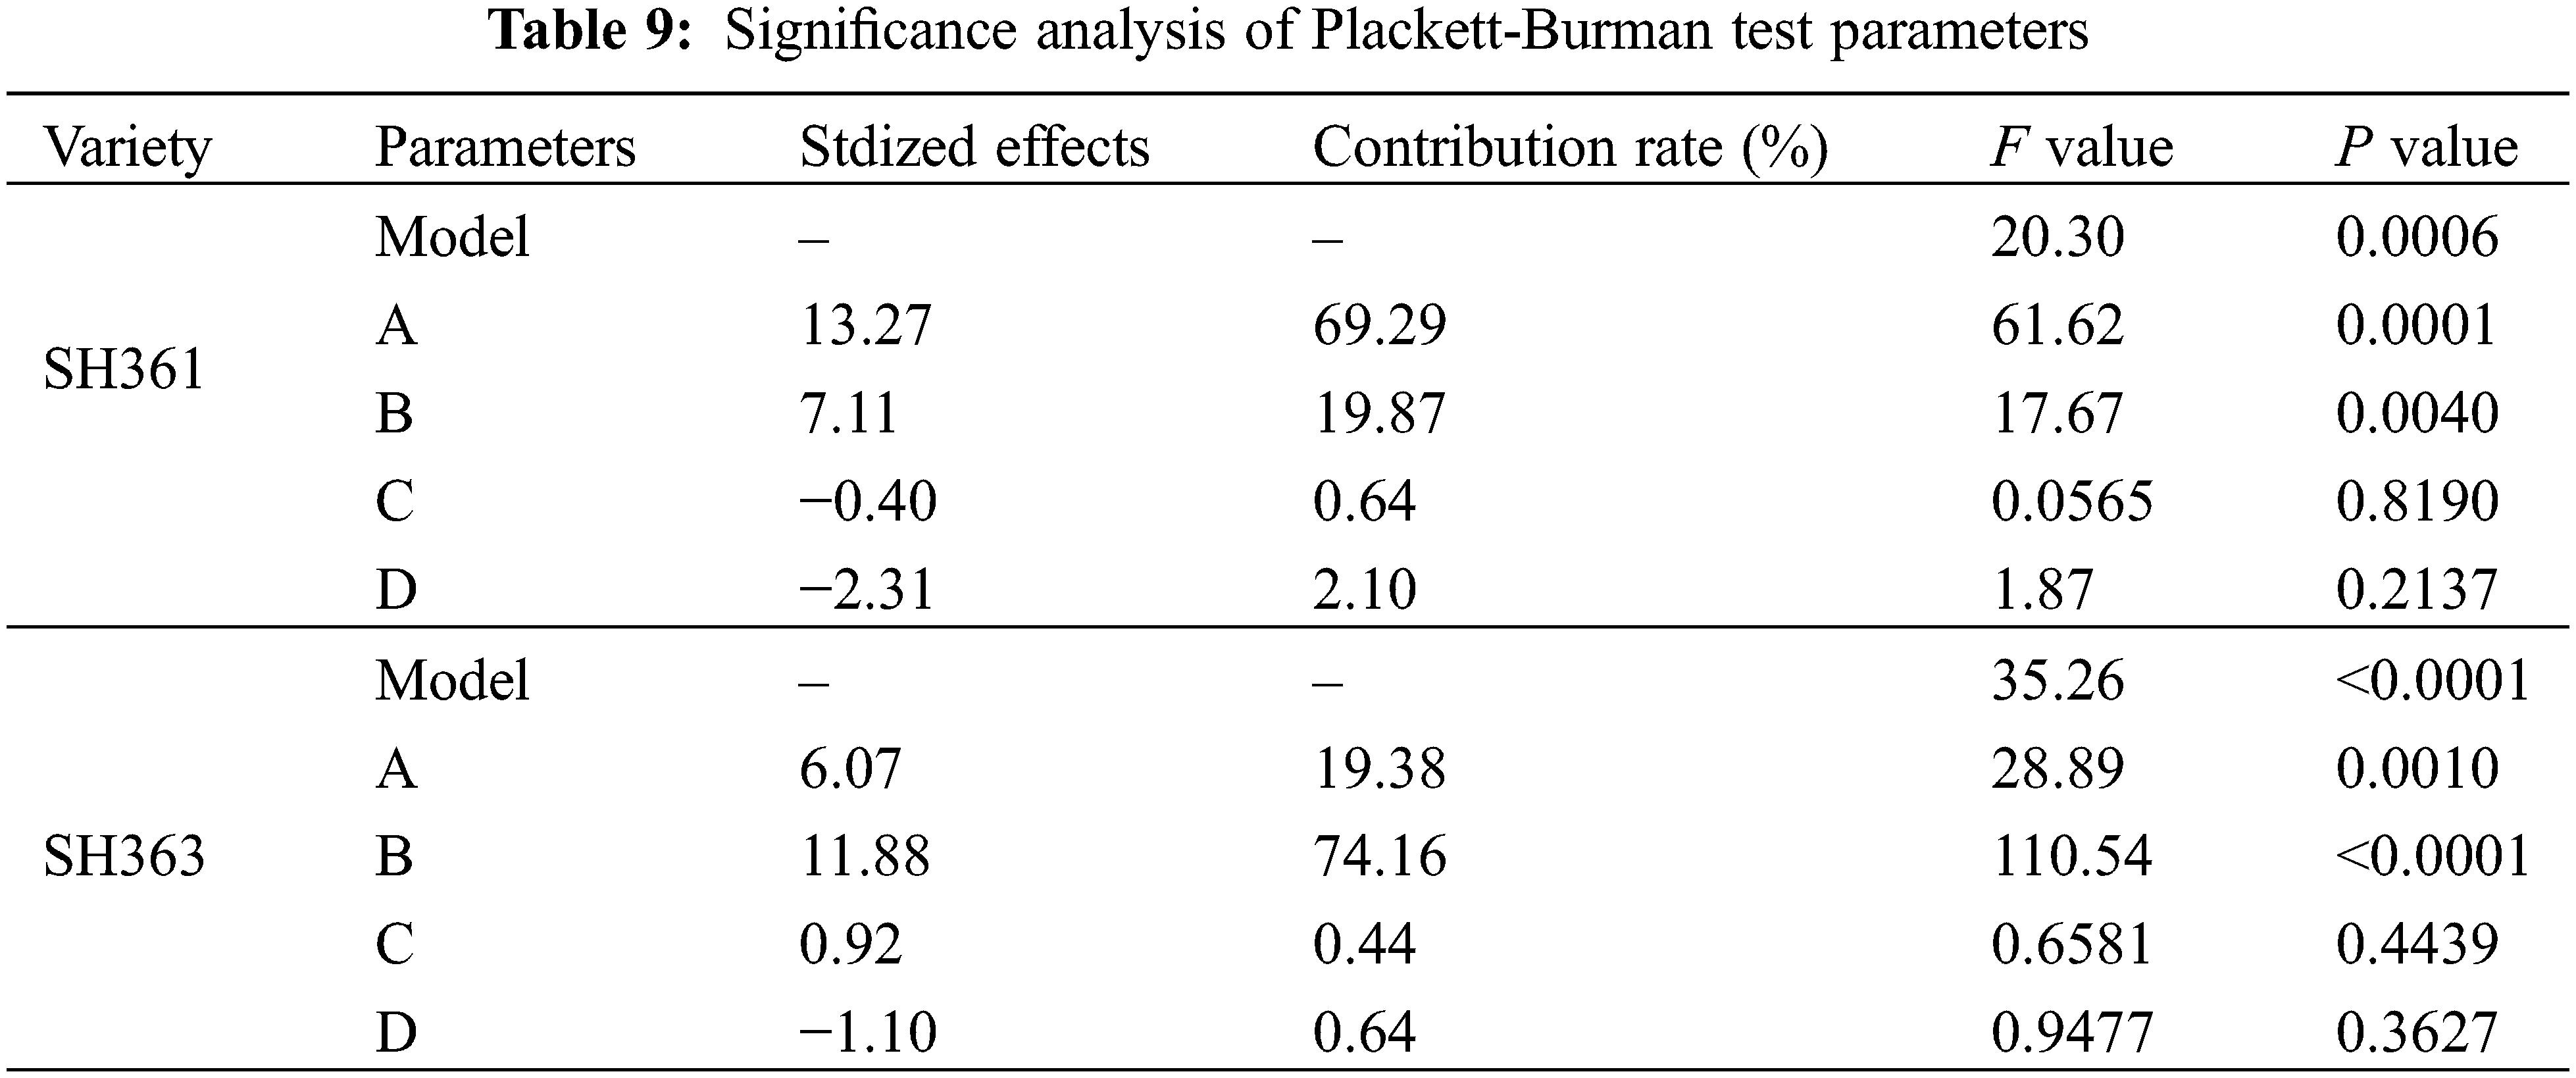
It can be seen from Table 9 that the P value for the models of SH361 and SH363 were less than 0.05, and the coefficient of determination R2 is 0.9207, 0.9527, respectively, which are all close to 1, indicating that the regression model is significant and the model can better predict the changing trend of each parameter. It can be seen from the standardization effect that A (coefficient of static friction between seeds) and B (coefficient of rolling friction between seeds) of SH361 have a positive effect on the repose angle, i.e., the repose angle increases as these 2 factors increase; and C (coefficient of static friction between seeds and Q235) and D (coefficient of static friction between seeds and Q235) have a negative effect, i.e., the repose angle decreases as these 2 factors increase. A, B, and C of SH363 have a positive effect on the repose angle, and D has a negative effect.
The influence of each factor on the repose angle was analyzed according to the contribution rate of each factor, in which A and B had a greater influence on the results with a contribution rate greater than 15%, and C and D had a smaller influence on the results with a contribution rate less than 5%. By comparing the magnitude of F value of each parameter, it was obtained that the effect of A on repose angle was greater than that of B. Therefore, the parameters with significant effects on the angle of repose were selected by the results of the Plackett-Burman test: A and B were considered as the parameters for the subsequent steepest climb test and the response surface analysis test.
According to the Plackett-Burman test design and results, the two more significant test parameters A and B, which have a positive effect on the repose angle of sunflower, are gradually increased according to a certain step. For the remaining parameters, choose the middle level for the steepest climbing test to quickly approach the optimal parameter area. Calculate the relative error between the simulated repose angle and the actual repose angle of the sunflower. The test plan and results are shown in Table 10.
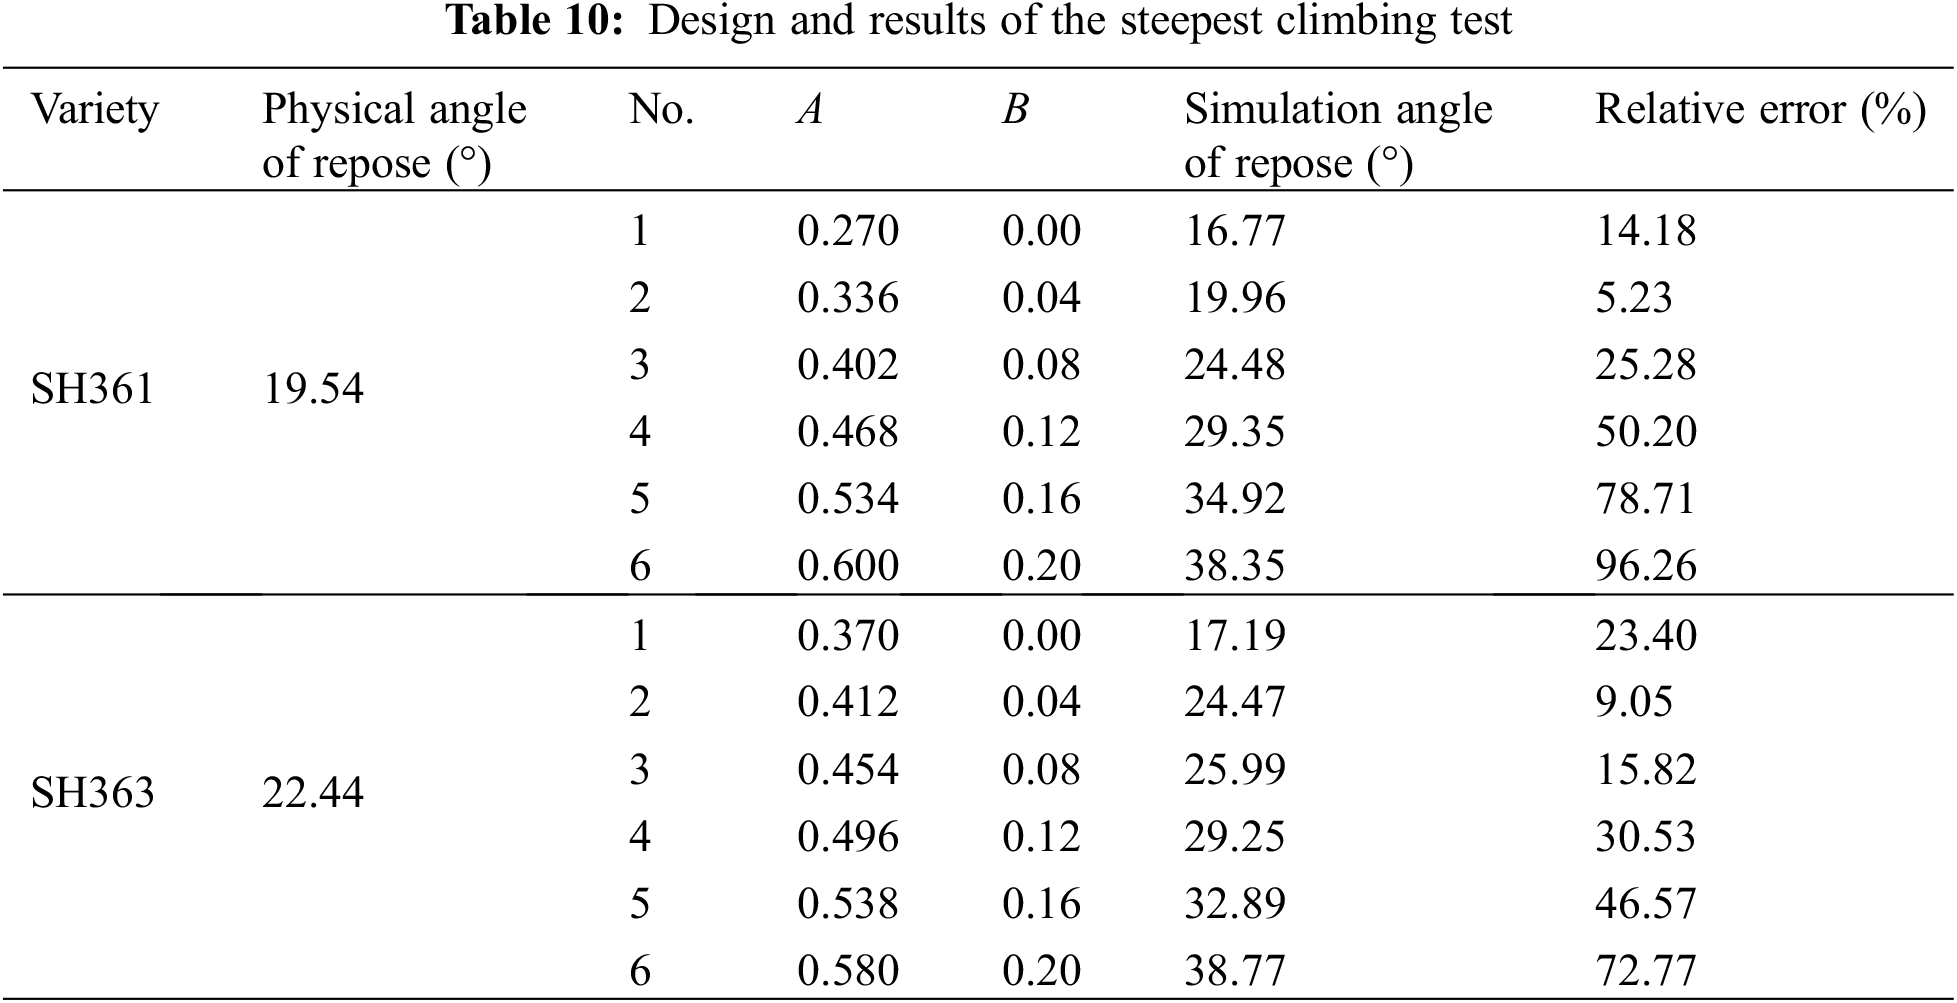
The steepest climbing test results show that with the increase of A and B, the simulated repose angle gradually increases, and the relative error with the repose angle measured by the physical experiment decreases first After the increase, the relative error of No. 2 test is the smallest. Therefore, the parameter values in the No. 2 experiment are taken as the central point of the response surface analysis test, and the parameter values of the No. 1 and No. 3 experiments are regarded as the low level and the high level respectively for the response surface analysis experiment.
4.3.3 Response Surface Analysis Test
According to the results of the steepest climbing test, the Box-Behnken design test was used to find the optimal values of the significant parameters using the response surface methodology. In the experiment, A and B were used as the test factors, and the repose angle was used as the test index. For other non-significant influencing factors, refer to the test levels of each factor in Table 5, and a total of 9 tests were carried out. One center point test was used for error analysis. The Box-Behnken test design scheme and results are shown in Table 11. +1 and −1 respectively represent the high and low levels of A and B.
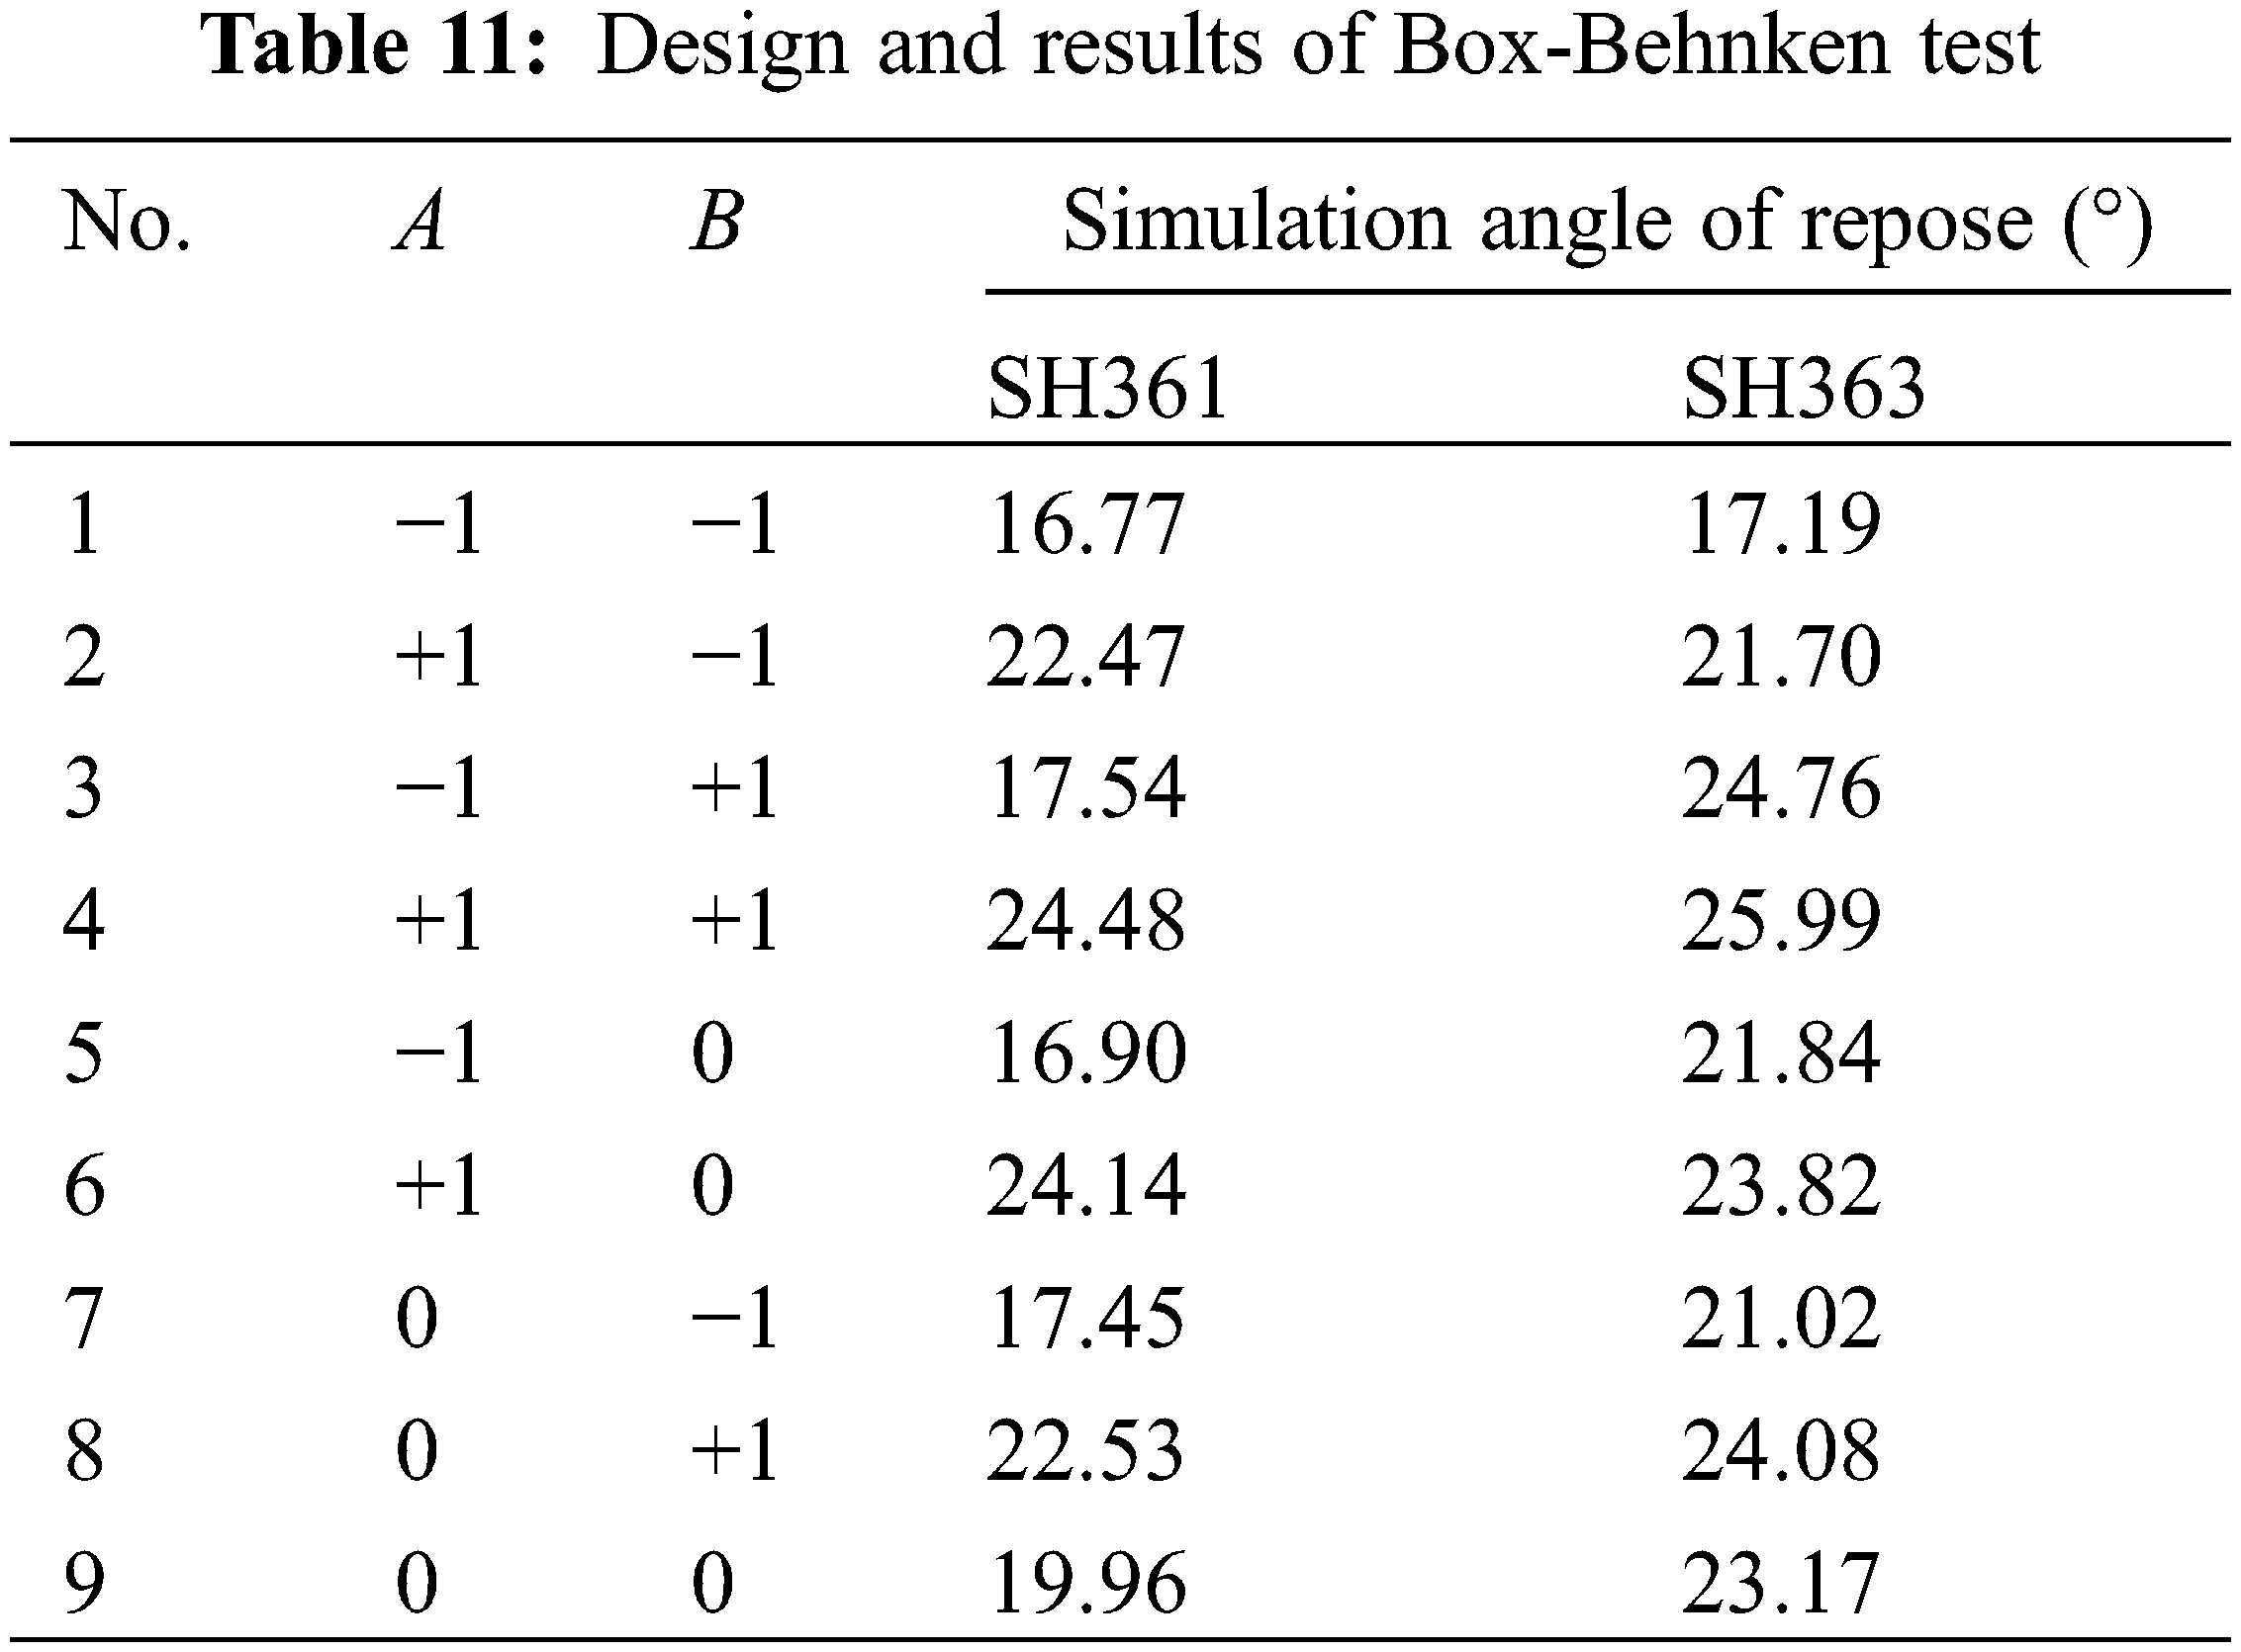
Design-expert software was applied to multiple regression fitting analysis of sunflower seed test results, with Y (angle of repose) as the response value and A and B as independent variables, and the repose angle regression equations for SH361 and SH363 were obtained as follows:
It can be seen from Table 12 that the P value of the repose angle regression model of the two varieties is less than 0.05, the determination coefficient R2 and the correction determination coefficient R2adj are all close to 1, the CV (coefficient of variation) is less than 15%, and the accuracy of the model is greater than 4. According to the book [40], the repose angle regression model is remarkable, with high degree of fit, good reliability and high accuracy, which can be used to predict the repose angle of sunflower seeds. Analyze the variance results of the regression model for each repose angle: the effect of A in SH361 on the repose angle is highly significant, and the effect of the remaining terms on the repose angle is not significant; the effect of B in SH363 on the repose angle is highly significant; the effect of the remaining terms on the repose angle is not significant. There was a quadratic nonlinear relationship between the experimental independent variables A and B and the response value Y. The effect of the interaction on the response value was not significant, and the response surface of the repose angle for each species is shown in Fig. 12.
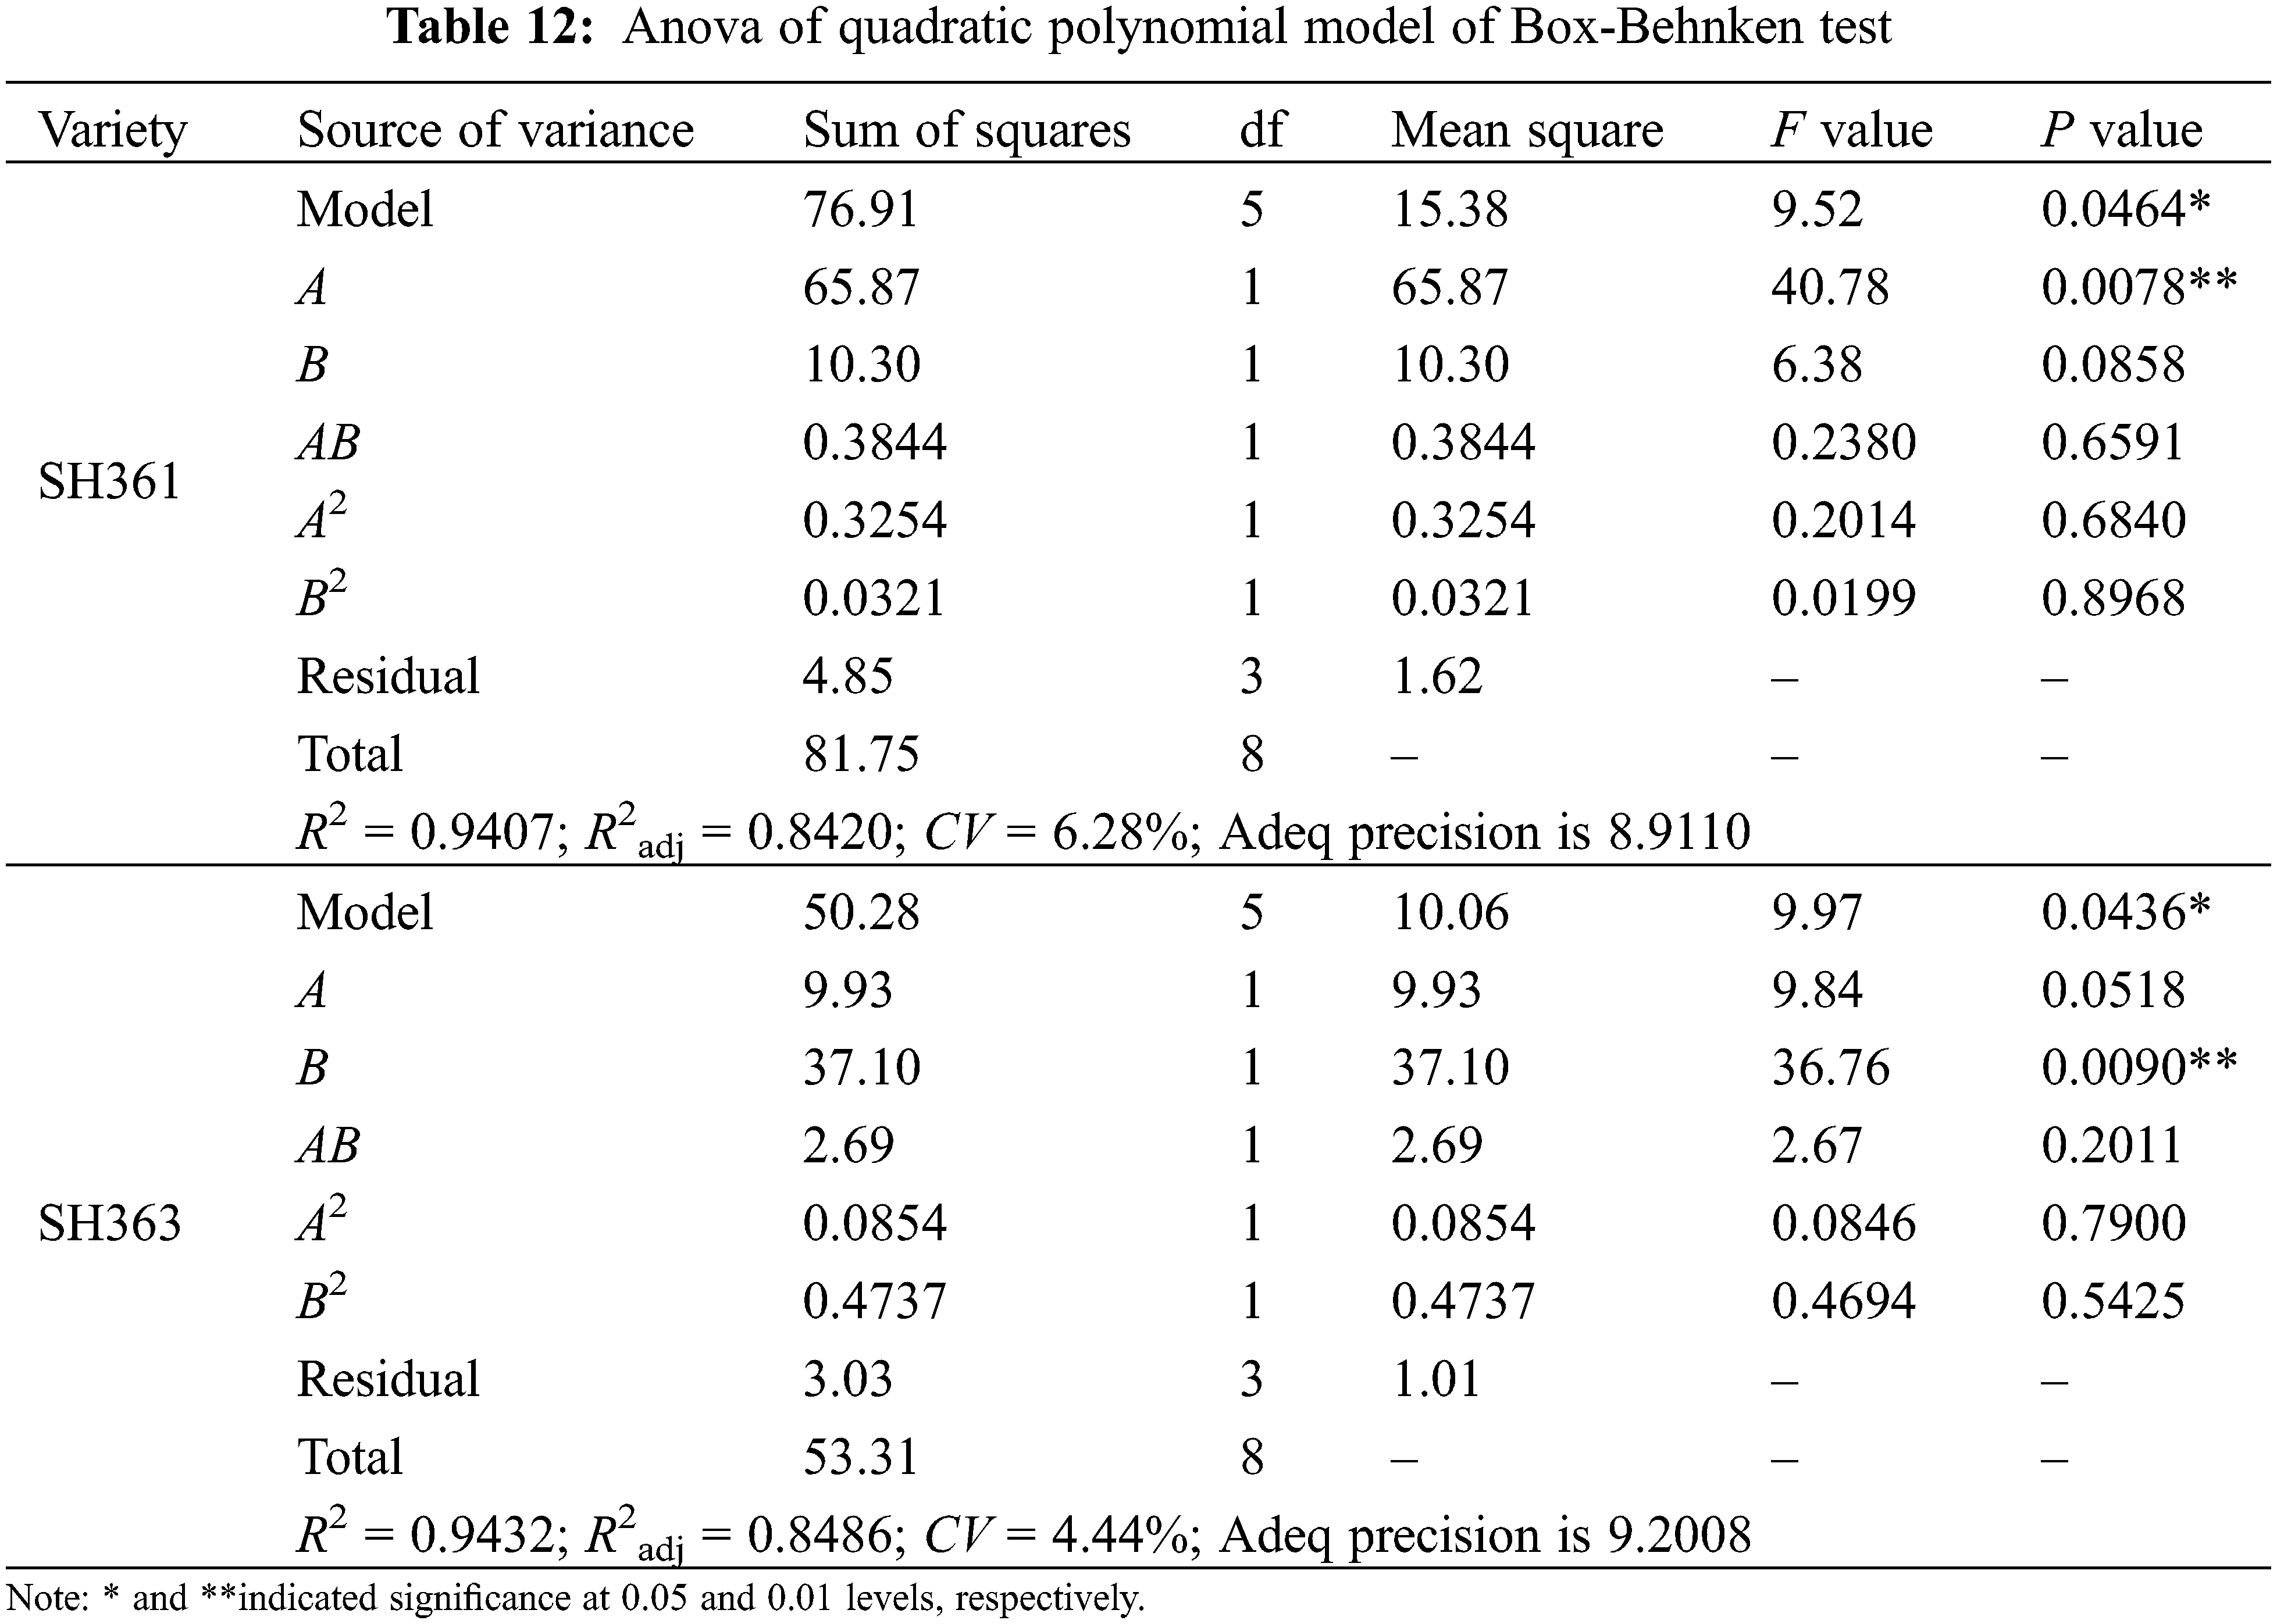
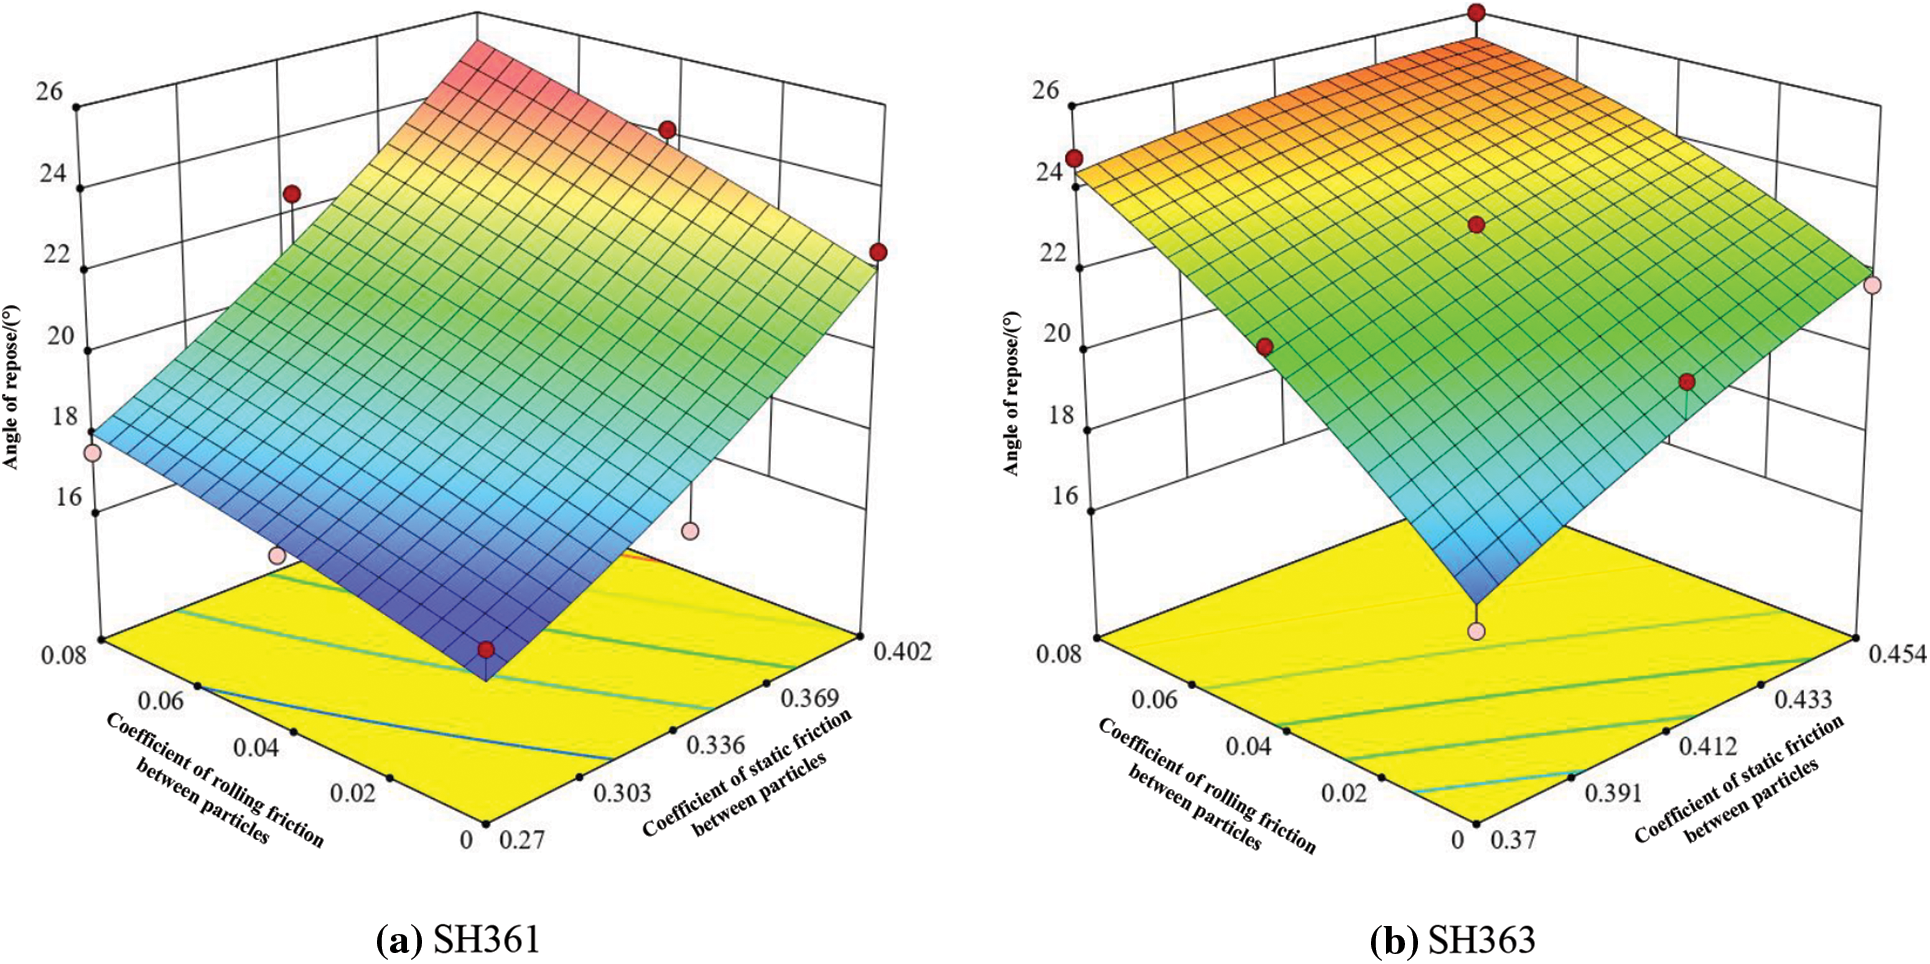
Figure 12: Angle of repose response surface for sunflower seeds
The optimization module in Design Expert 11 software has been used to solve the regression model (i.e., Eqs. (17) and (18)) with constrained objectives, in which the physical test values of the repose angle are defined as the optimization target values and A, and B are regarded as the optimization objects. Based on the Plackett-Burman test and the steepest climb test, the ranges of SH361 A, SH361 B, SH363 A and SH361 B have been determined to be 0.27~0.6, 0.27~0.57, 0.35~0.58, and 0.37~0.62, respectively. Therefore, the objective function and constraint function of the optimization problem are as in Eqs. (19) and (20).
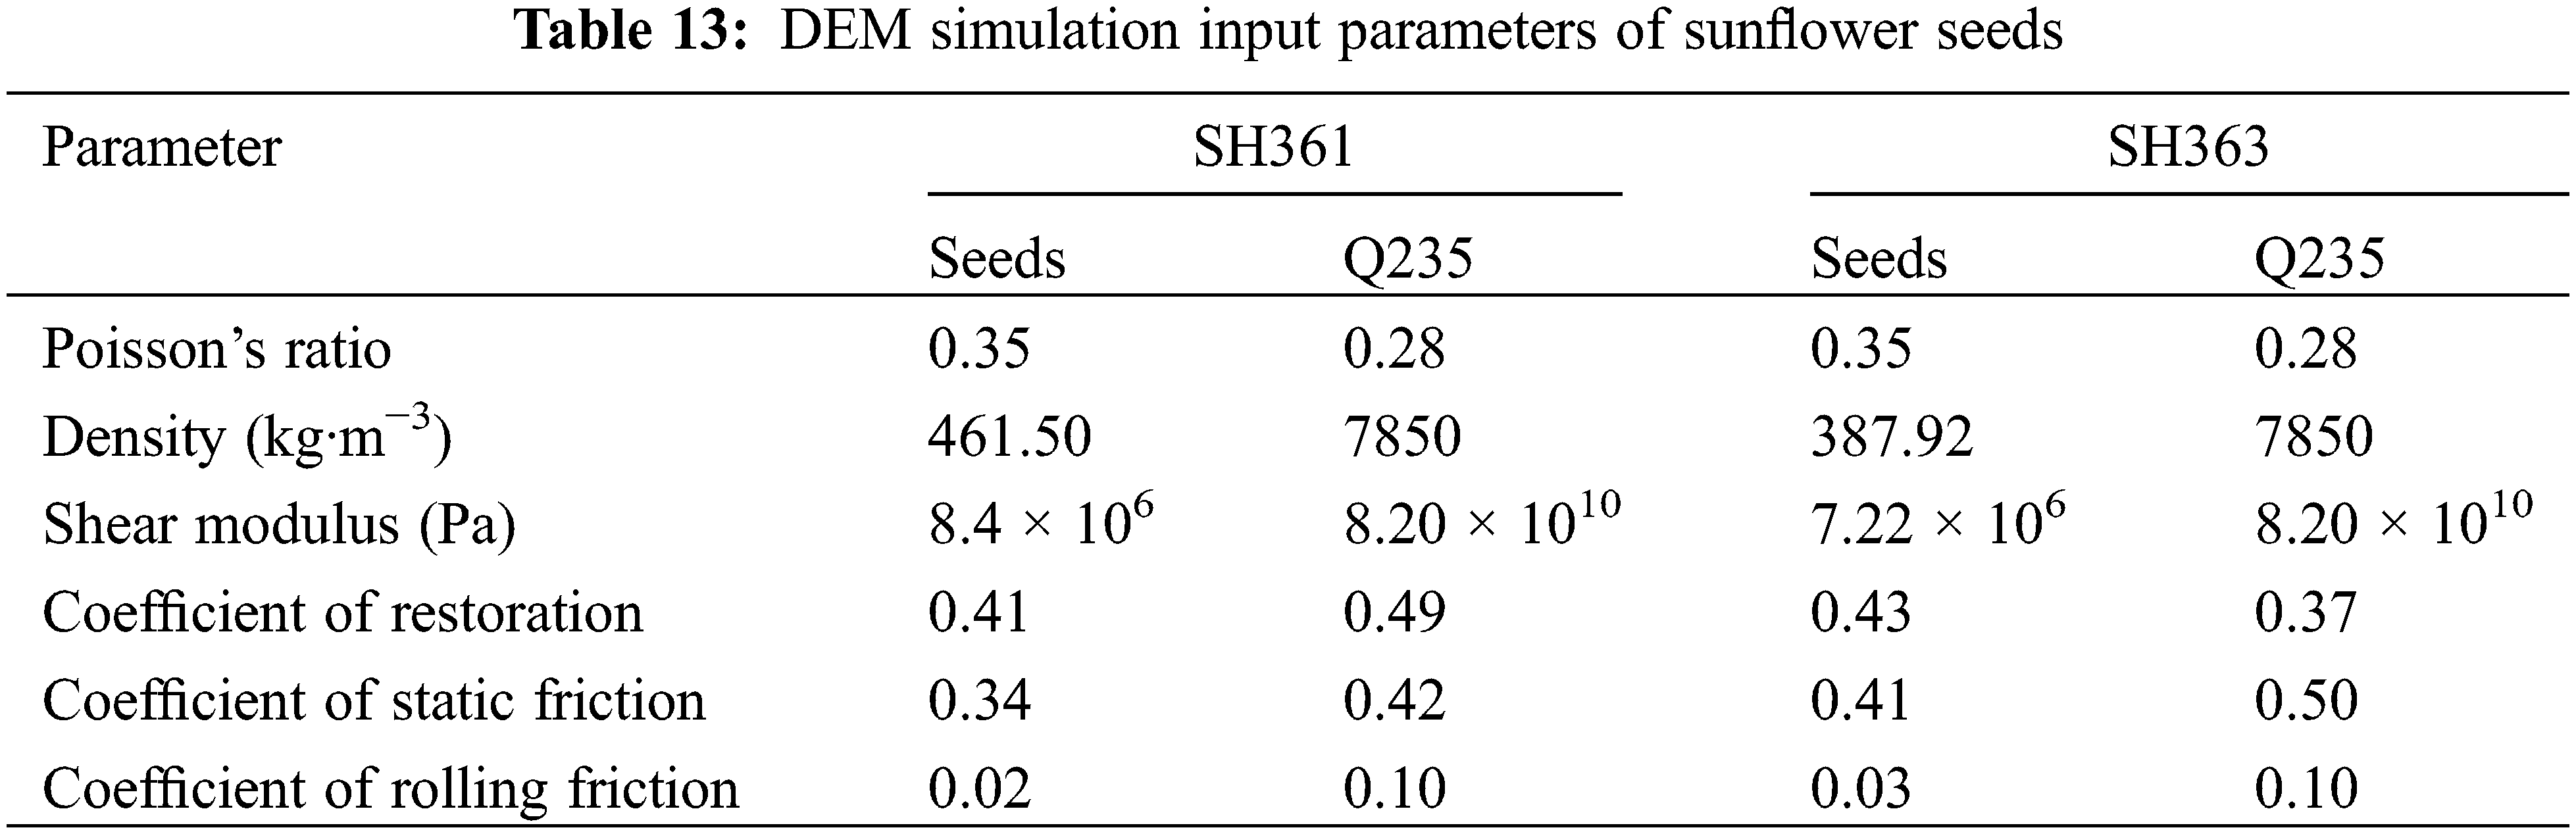
The repose angle simulation test is carried out with a number of optimized solutions as parameters, and the repose angle is compared and verified with the physical test. A set of data with the most similar size, shape, and formation process of the two repose angles is selected as the optimized solution, that is, SH361 A is 0.34, B is 0.02; SH363 A is 0.41, B is 0.03; Other non-significant parameters are set to intermediate levels, and the optimized DEM simulation parameters of sunflower seeds are shown in Table 13.
The optimal calibration parameters were input into the EDEM software to simulate the repose of the sunflower seeds, and the resulting simulated repose angles and relative errors of SH361 and SH363 are shown in Table 14. A two-sample t-test was conducted to detect significance between the simulated values and the physical test values. Therefore, an F-test of the simulated values against the physical test values was required first as a basis for selecting the t-test method. Table 15 shows the results of the F-test.
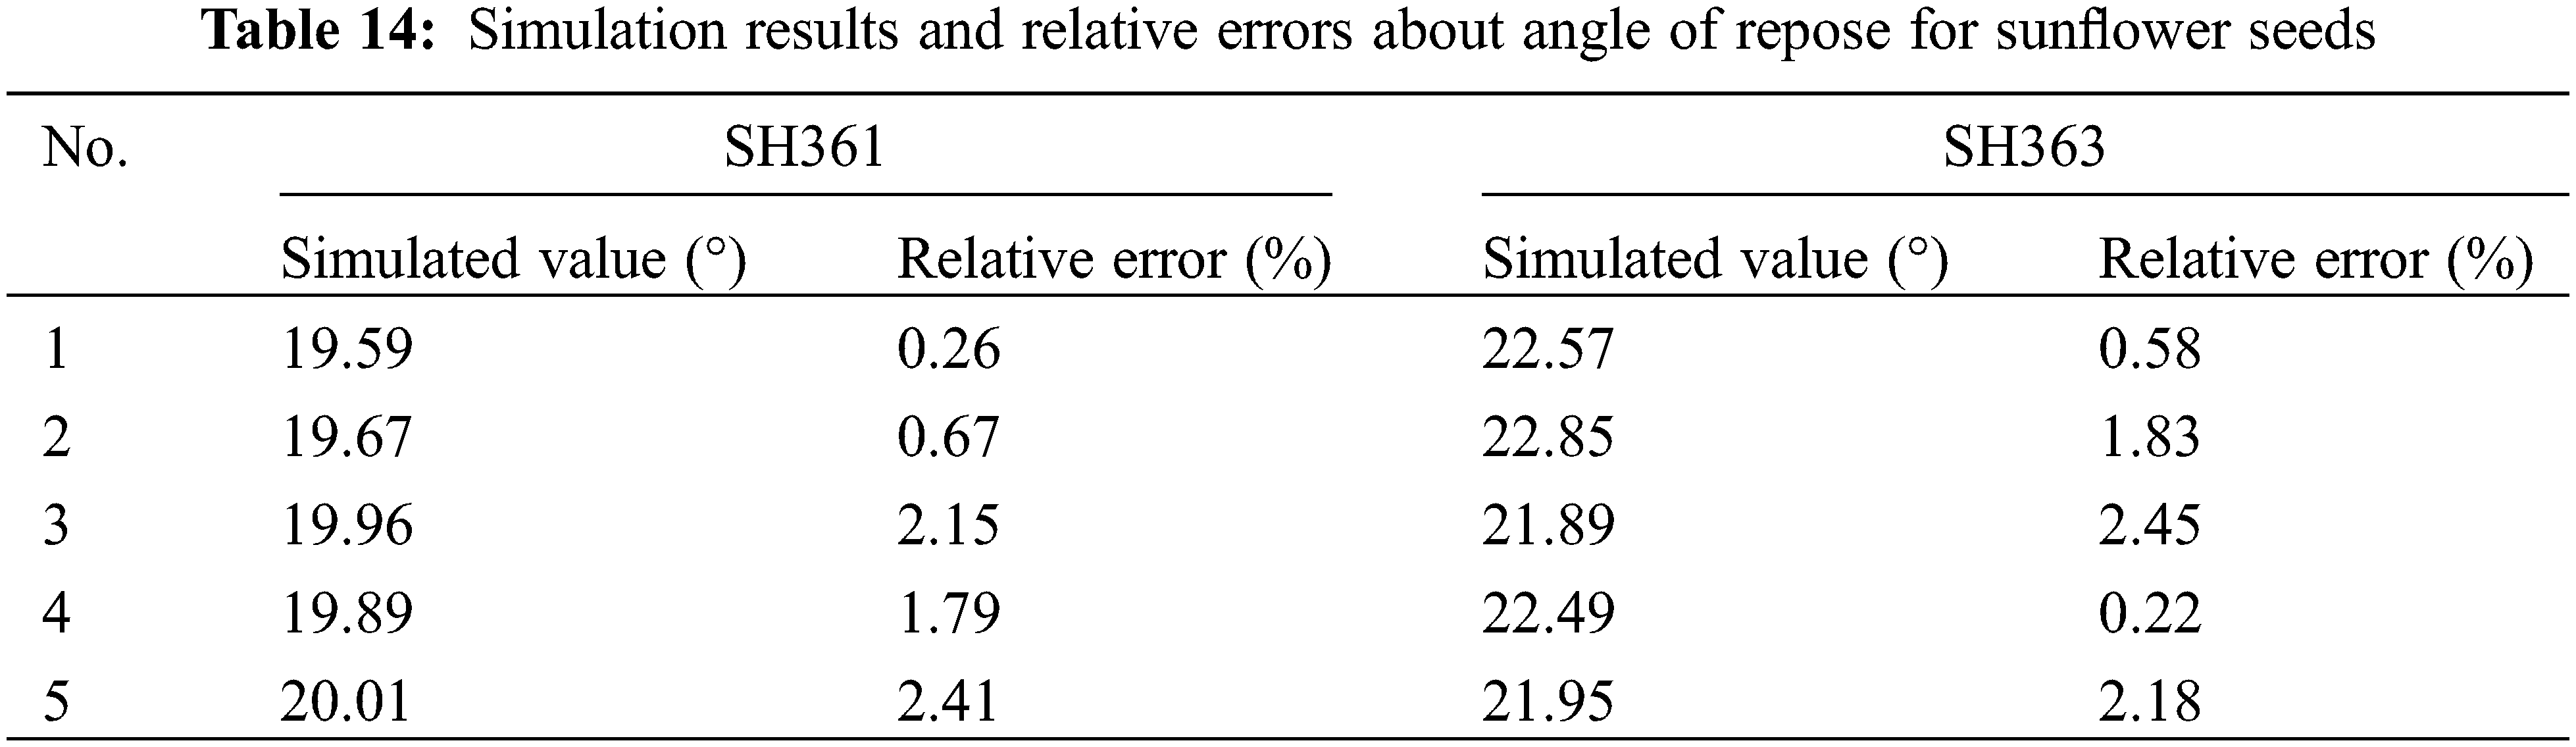
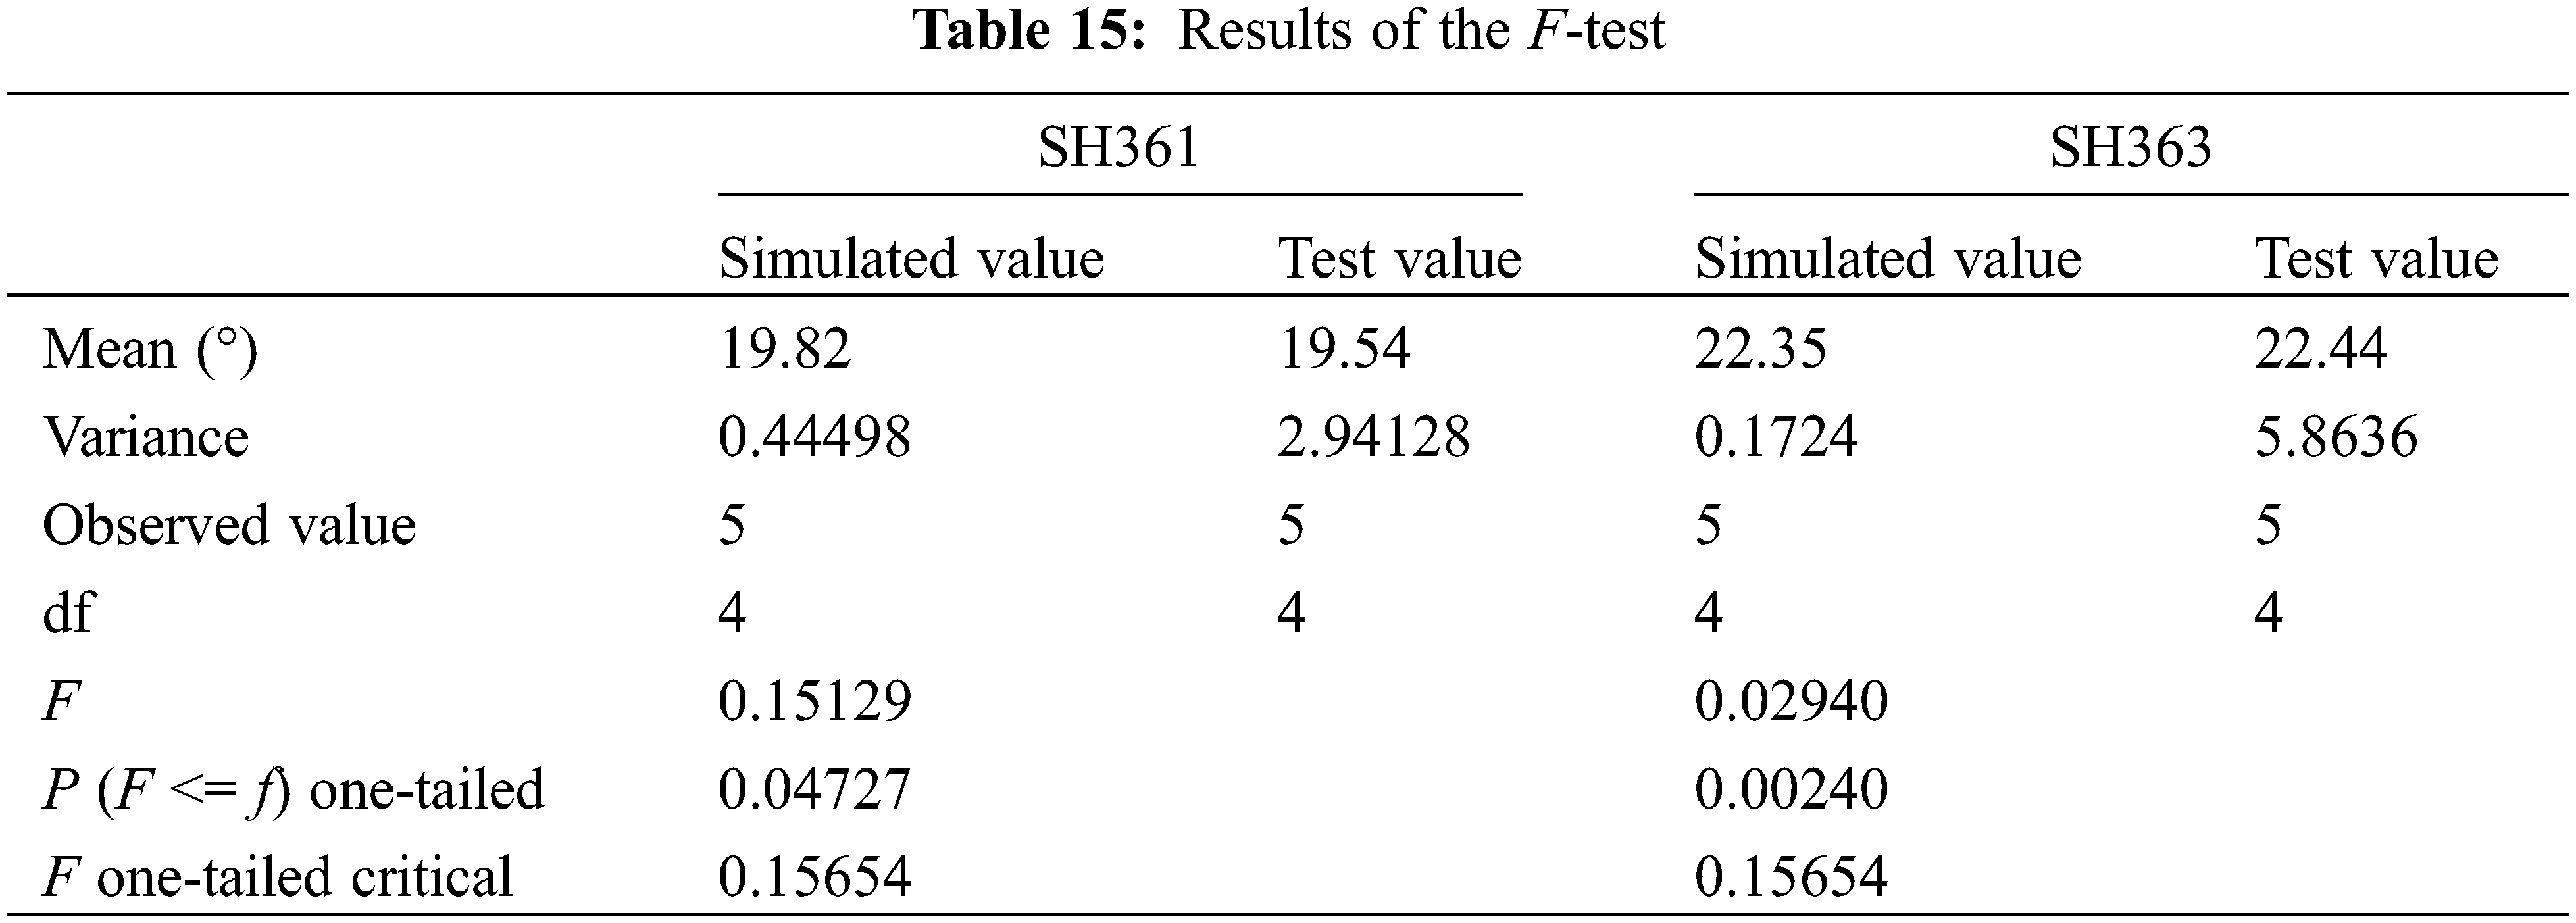
As shown in Table 15, the PSH361 = 0.04727 < 0.05 and PSH363 = 0.00240 < 0.05 indicates a significant difference between the two variances. So the heteroskedasticity t-test was used to detect significance between the simulated values and the physical test values. The results of the two-sample heteroskedasticity t-test are shown in Table 16.
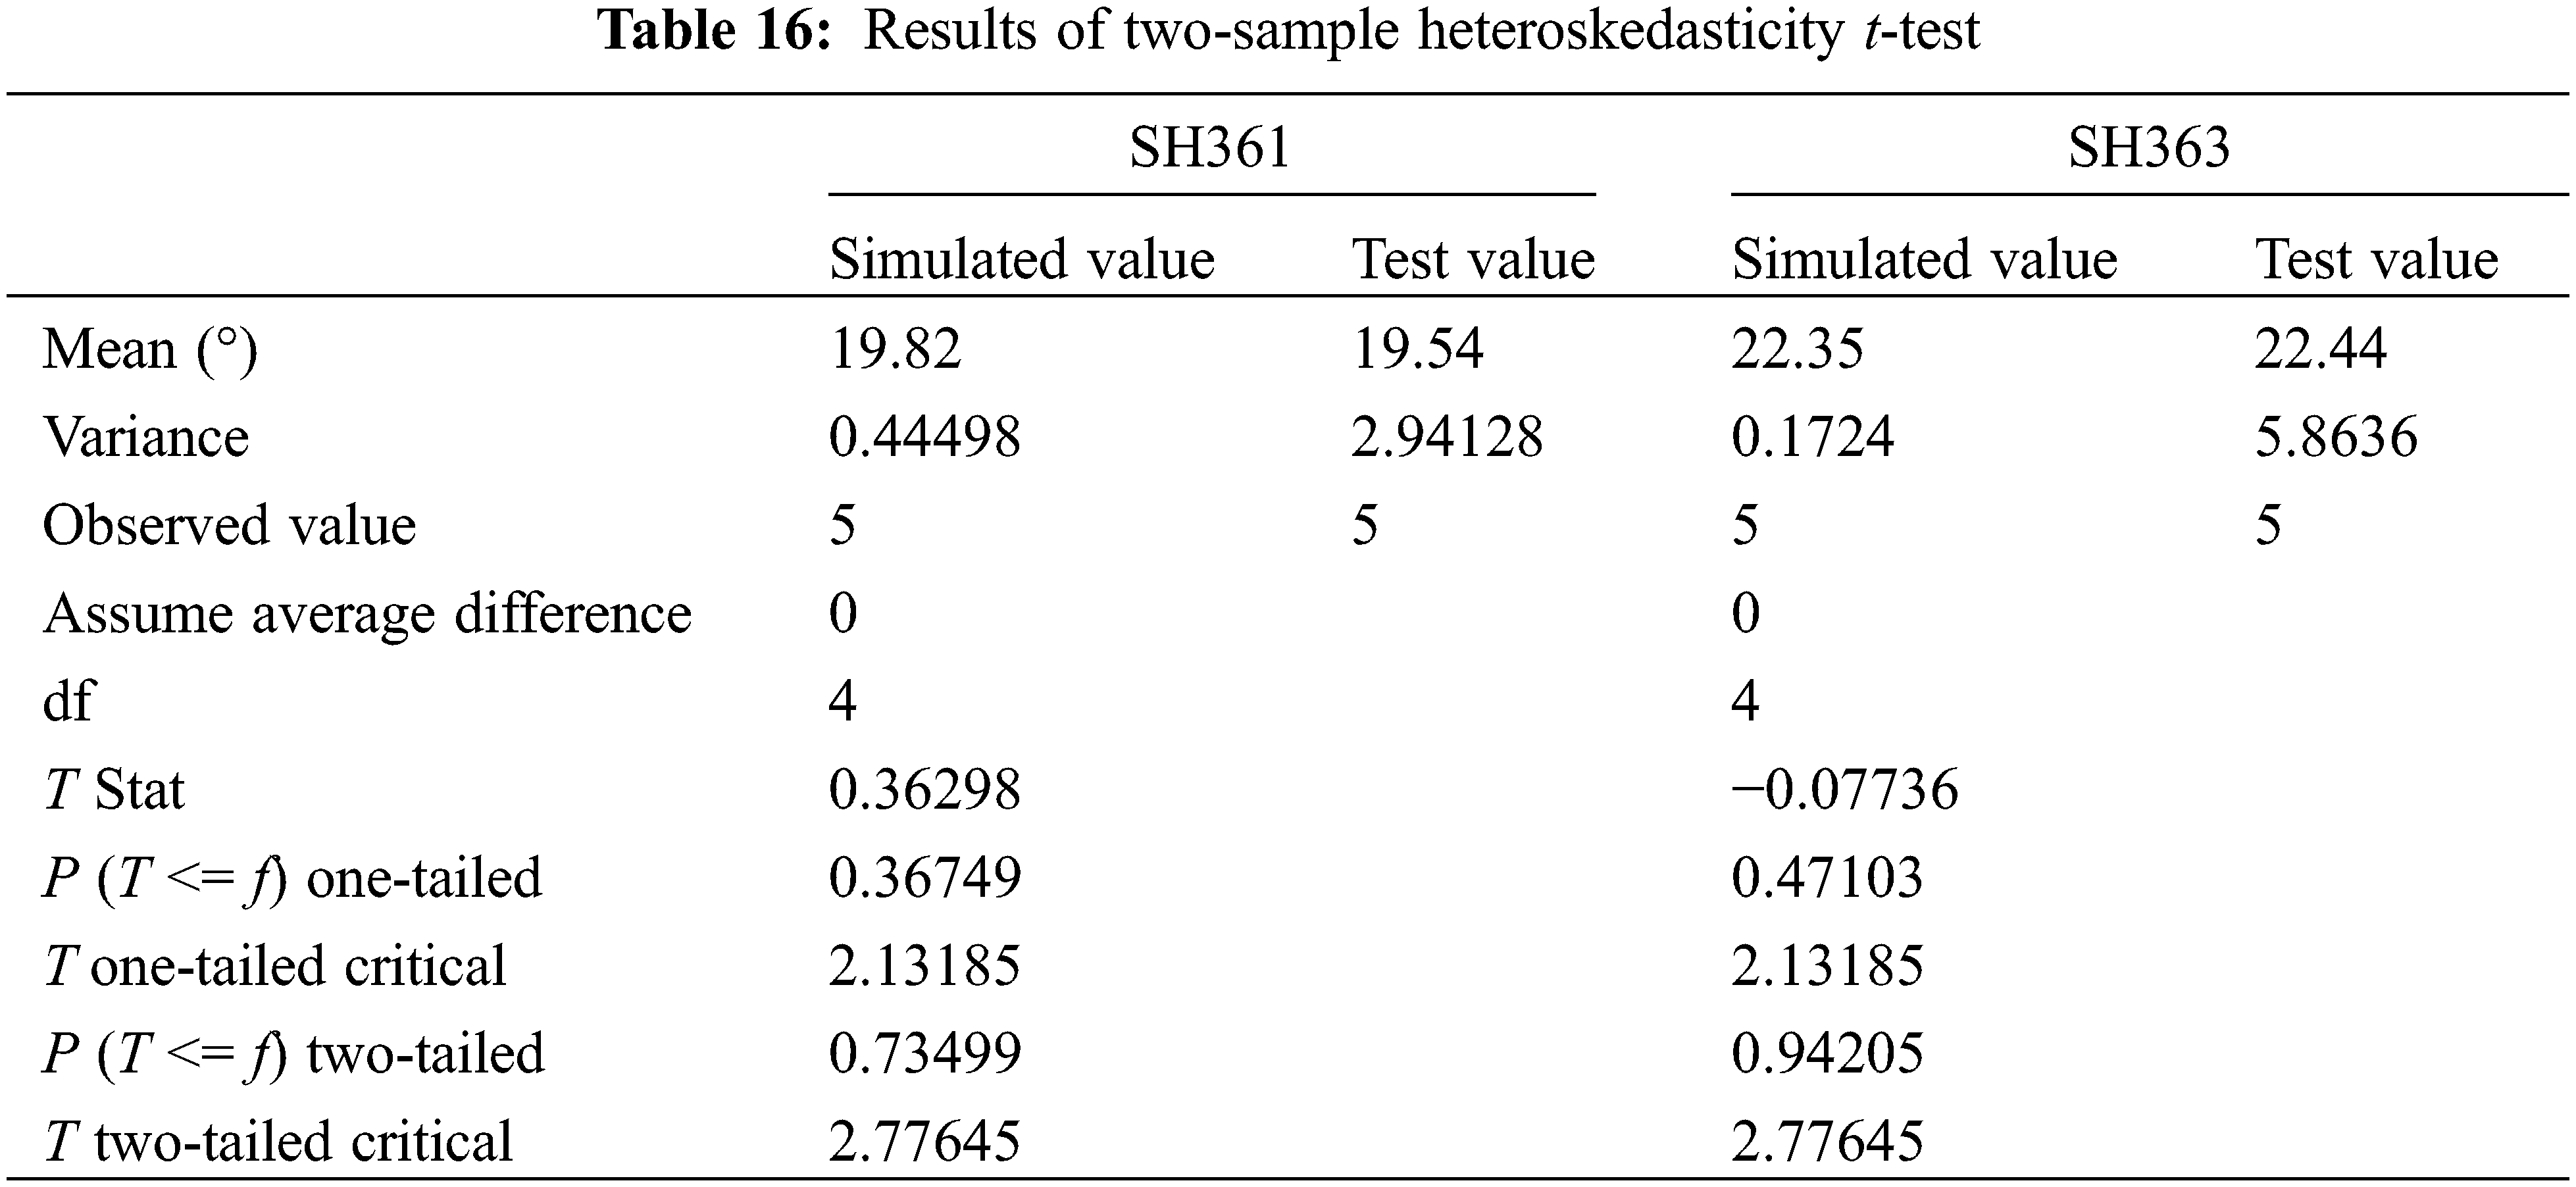
From the test results shown in Table 14, it can be seen that |T| < “T two-tailed critical”, “two-tailed” > 0.05, indicating that there is no significant difference between the simulated value and the physical test value after calibration of the simulation parameters. As shown by the comparison results of SH361 physical test (Fig. 13a) and simulation test (Fig. 13b), proved it can be used as a DEM simulation value of the characteristics of the sunflower seeds.

Figure 13: Comparison of physical and simulation tests
The above research results verify the accuracy of the DEM building method and friction coefficient calibration method for sunflower seeds proposed in this paper, and determine the DEM model and parameters for sunflower seeds, which helps the application of the DEM in the development of agricultural equipment for sunflower seeds. Compared with the DEM of sunflower seeds manually filled by Guo et al. [41], the automatic filling method used in this paper is efficient and the model is more accurate, which in turn improves the applicability of the DEM simulation parameters calibration. The results of our calibration tests concerning the friction coefficients are consistent with other studies of bulk particles, such as oil sunflower seeds [42], which implies that the static and dynamic friction coefficients between seeds are factors that have a significant effect on the resting angle of sunflower seeds, and the effect is positive.
DEM modeling and friction coefficient calibration were performed for edible sunflower seeds, SH361 and SH363, which are mainly planted in Inner Mongolia Autonomous Region, China. A new method for the calibration of DEM parameters of non-spherical and irregular particles was developed. The parameters required for the DEM model of sunflower seeds were obtained by physical tests: density, Young’s modulus, elastic modulus, collision recovery coefficient and static friction coefficient. Further, the static friction coefficient and rolling friction coefficient of sunflower seeds were calibrated by applying regression analysis and response surface analysis with reference to the static friction coefficient determination interval through simulation tests. The optimum combination of DEM parameters of sunflower seeds was determined with the rest angle measured by physical tests as the optimized target value. It shows that it is feasible to apply response surface analysis to calibrate the DEM simulation parameters, and the results of the calibrated DEM simulation model parameters of sunflower seeds are realistic and reliable, which can provide reference for the simulation of mechanized operations such as sunflower seed sowing and harvesting.
In this paper, a second-order mathematical model between the static friction coefficient between seeds, rolling friction coefficient between seeds and angle of repose was developed using RSM in the calibration of DEM friction coefficient of sunflower seeds. This method uses the Plackett-Burman, steepest climb, and Box-Behnken experimental design methods in turn and obtains certain data through simulation tests, and uses a multiple quadratic regression equation to fit the functional relationship between the friction coefficient and the angle of repose. However, the RSM requires experimental design to establish a suitable mathematical model from a large amount of experimental data, which will undoubtedly take a lot of time.
Further, we have obtained comprehensive results demonstrating that the inter-seed static friction coefficient and rolling friction coefficient had a significant positive effect on the resting angle of the simulation test. Therefore, in the future study, we should try to calibrate only the static and dynamic friction coefficients between seeds to obtain the results in a shorter time. However, the selection of sunflower seed varieties was limited in our paper; meanwhile, other complications, such as water content, were not considered in our paper, which would be our next tasks.
Authorship: The authors confirm contribution to the paper as follows: study conception and design: SW, ZY, WZ, DZ; experimentation: SW, DZ, A; analysis and interpretation of results: SW, ZY, WZ; draft manuscript preparation: SW, ZY. All authors reviewed the results and approved the final version of the manuscript.
Funding Statement: The authors received funding for this study from Nature Science Foundation of China, Grant No. (51865047).
Conflicts of Interest: The authors declare that they have no conflicts of interest to report regarding the present study.
1. Wu, Z. (2019). Sunflower planting details and market development report. http://www.khjingying.com/announce/show.php?itemid=25. [Google Scholar]
2. Wang, M., Lu, Z., Wan, W., Zhao, Y. (2021). A calibration framework for the microparameters of the DEM model using the improved PSO algorithm. Advanced Powder Technology, 32(2), 358–369. DOI 10.1016/j.apt.2020.12.015. [Google Scholar] [CrossRef]
3. Kruggel-Emden, H., Rickelt, S., Wirtz, S., Scherer, V. (2008). A study on the validity of the multi-sphere discrete element method. Powder Technology, 188(2), 153–165. DOI 10.1016/j.powtec.2008.04.037. [Google Scholar] [CrossRef]
4. Coetzee, C. J. (2017). Review: Calibration of the discrete element method. Powder Technology, 310, 104–142. DOI 10.1016/j.powtec.2017.01.015. [Google Scholar] [CrossRef]
5. Rackl, M., Hanley, K. J. (2017). A methodical calibration procedure for discrete element models. Powder Technology, 307(1), 73–83. DOI 10.1016/j.powtec.2016.11.048. [Google Scholar] [CrossRef]
6. Wu, M., Cong, J., Yan, Q., Zhu, T., Peng, X. et al. (2020). Calibration and experiments for discrete element simulation parameters of peanut seed particles. Transactions of the Chinese Society of Agricultural Engineering, 36(23), 30–38. [Google Scholar]
7. Liu, F., Zhang, J., Li, B., Chen, J. (2016). Calibration of parameters of wheat required in discrete element method simulation based on repose angle of particle heap. Transactions of the Chinese Society of Agricultural Engineering, 32(12), 247–253. [Google Scholar]
8. Wang, L., Li, R., Wu, B., Wu, Z., Ding, Z. (2018). Determination of the coefficient of rolling friction of an irregularly shaped maize particle group using physical experiment and simulations. Particuology, 38(3), 185–195. DOI 10.1016/j.partic.2017.06.003. [Google Scholar] [CrossRef]
9. Ghodki, B. M., Patel, M., Namdeo, R., Carpenter, G. (2019). Calibration of discrete element model parameters: Soybeans. Computational Particle Mechanics, 6(1), 3–10. DOI 10.1007/s40571-018-0194-7. [Google Scholar] [CrossRef]
10. Zhang, R., Jiao, W., Zhou, J., Qi, B., Liu, H. et al. (2020). Parameter calibration and experiment of rice seeds discrete element model with different filling particle radius. Transactions of the Chinese Society for Agricultural Machinery, 51(S1), 227–235. [Google Scholar]
11. Wu, J., Cao, C., Xie, C., Fang, L., Wu, Z. et al. (2019). Measurement of physical properties of Rasix peucedani seeds and parameter calibration of discrete element simulation model. Journal of Gansu Agricultural University, 54(4), 180–189. [Google Scholar]
12. Shi, L., Ma, Z., Zhao, W., Yang, X., Sun, B. et al. (2019). Calibration of simulation parameters of flaxed seeds using discrete element method and verification of seed-metering test. Transactions of the Chinese Society of Agricultural Engineering, 35(20), 25–33. [Google Scholar]
13. Yu, Q., Liu, Y., Chen, X., Sun, K., Lai, Q. (2020). Calibration and experiment of simulation parameters for Panax notoginseng seeds based on DEM. Transactions of the Chinese Society for Agricultural Machinery, 51(2), 123–132. [Google Scholar]
14. Ma, W., You, Y., Wang, D., Yin, S., Xun, X. (2020). Parameter calibration of Alfalfa seed discrete element model based on RSM and NSGA-II. Transactions of the Chinese Society for Agricultural Machinery, 51(8), 136–144. [Google Scholar]
15. Zhang, C., Du, W., Chen, Z., Su, R. (2019). The measurement of contact parameters of buckwheat rice screening material and discrete element simulation calibration. Journal of Agricultural Mechanization Research, 41(1), 46–51. [Google Scholar]
16. Hou, Z., Dai, N., Chen, Z., Qiu, Y., Zhang, X. (2020). Measurement and calibration of physical property parameters for Agropyron seeds in a discrete element simulation. Transactions of the Chinese Society of Agricultural Engineering, 36(24), 46–54. [Google Scholar]
17. Liao, Y., Wang, Z., Liao, Q., Wan, X., Zhou, Y. et al. (2020). Calibration of discrete element model parameters of forage rape stalk at early pod stage. Transactions of the Chinese Society for Agricultural Machinery, 51(S1), 236–243. [Google Scholar]
18. Ma, Y., Song, C., Xuan, C., Wang, H., Yang, S. et al. (2020). Parameters calibration of discrete element model for alfalfa straw compression simulation. Transactions of the Chinese Society of Agricultural Engineering, 36(11), 22–30. [Google Scholar]
19. Peng, F., Wang, H., Fang, F., Liu, Y. (2018). Calibration of discrete element model parameters for pellet feed based on injected section method. Transactions of the Chinese Society for Agricultural Machinery, 49(4), 140–147. [Google Scholar]
20. Peng, C., Xu, D., He, X., Tang, Y., Sun, S. (2020). Parameter calibration of discrete element simulation model for pig manure organic fertilizer treated with Hermetia illucen. Transactions of the Chinese Society of Agricultural Engineering, 36(17), 212–218. [Google Scholar]
21. Yuan, Q., Xu, L., Xing, J., Duan, Z., Ma, S. et al. (2018). Parameter calibration of discrete element model of organic fertilizer particles for mechanical fertilization. Transactions of the Chinese Society of Agricultural Engineering, 34(18), 21–27. [Google Scholar]
22. Zhang, L., Wang, B., Guo, Y., Li, S., Wang, F. (2020). Calibration of discreteelement model parameters for blueberry based on response surface methodology. Journal of Shenyang Agricultural University, 51(5), 540–548. [Google Scholar]
23. Liu, W., He, J., Li, H., Li, X., Zheng, K. et al. (2018). Calibration of simulation parameters for potato minituber based on EDEM. Transactions of the Chinese Society for Agricultural Machinery, 49(5), 125–135+142. [Google Scholar]
24. Wen, E., Li, Y., Niu, Z., Hou, J. (2021). Parameters calibration of discrete element model for garlic particles. Journal of Agricultural Mechanization Research, 43(5), 160–167. [Google Scholar]
25. Gupta, R. K., Das, S. K. (1997). Physical properties of sunflower seeds. Journal of Agricultural Engineering Research, 66(1), 1–8. DOI 10.1006/jaer.1996.0111. [Google Scholar] [CrossRef]
26. Kafashan, J., Wiacek, J., Abd Rahman, N., Gan, J. (2019). Two-dimensional particle shapes modelling for DEM simulations in engineering: A review. Granular Matter, 21(3), 1–19. DOI 10.1007/s10035-019-0935-1. [Google Scholar] [CrossRef]
27. Kafashan, J., Wiacek, J., Ramon, H., Mouazen, A. M. (2021). Modelling and simulation of fruit drop tests by discrete element method. Biosystems Engineering, 212, 228–240. [Google Scholar]
28. Hu, G. (2010). Analysis and simulation of particle system by discrete element method. Wuhan: China Wuhan University of Technology Press. [Google Scholar]
29. Hou, J., Li, J., Yao, E., Bai, J., Yang, Y. et al. (2019). Calibration and analysis of discrete element parameters of typical Castor. Journal of Shenyang Agricultural University, 50(5), 565–575. [Google Scholar]
30. Wang, G., Hao, W., Wang, J. (2010). Discrete element method and its practice on EDEM. X’ian, China: Northwestern Polytechnical University Press. [Google Scholar]
31. Wen, Y., Liu, M., Liu, R., Liu, B., Shao, Y. (2015). Comparative study between numerical simulation by discrete element method and typical experimental research of particles. China Powder Science and Technology, 21(3), 1–5. [Google Scholar]
32. ASAE S368.4 DEC2000 (R2008) (2008). Compression test of food materials of convex shape. USA: American Society of Agricultural and Biological Engineers. [Google Scholar]
33. Li, F., Chen, J., Liu, F., Liu, Y., Zhang, T. et al. (2018). Effect of seed adsorption attitude on seed discharge performance based on high-speed camera technology. Journal of China Agricultural University, 23(4), 128–136. [Google Scholar]
34. Zhou, Z. (1994). Agricultural material science. Beijing, China: Agricultural Press. [Google Scholar]
35. Sun, J. (2019). Study on the biomechanical properties and damage mechanism of coarse cereals (Master Thesis). China: Shanxi Agricultural University. [Google Scholar]
36. Ma, Y. (2015). Agricultural materials science. Beijing, China: Chemical Industry Press. [Google Scholar]
37. Wu, A., Sun, Y., Liu, X. (2002). Granular dynamic theory and its applications. Beijing, China: Metallurgical Industry Press. [Google Scholar]
38. Ileleji, K. E., Zhou, B. (2008). The angle of repose of bulk corn stover particles. Powder Technology, 187(2), 110–118. [Google Scholar]
39. Li, Y. (2005). Discrete element simulation of accumulation problem—Experimental research (Master Thesis). China: China Agricultural University. [Google Scholar]
40. Ge, Y. (2015). Experimental design methods and design-expert software applications. Harbin, China: Harbin Institute of Technology Press. [Google Scholar]
41. Guo, X., Zhang, H., Wu, J., Chen, T. (2019). Discrete element simulation study of EDEM-based scoop-and-wheel sunflower seed disperser. Journal of Chinese Agricultural Mechanization, 40(2), 19–24. [Google Scholar]
42. Hao, J., Wei, W., Huang, P., Qin, J., Zhao, J. (2021). Calibration and experimental verification of discrete element parameters of oil sunflower seeds. Transactions of the Chinese Society of Agricultural Engineering, 37(12), 36–44. [Google Scholar]
 | This work is licensed under a Creative Commons Attribution 4.0 International License, which permits unrestricted use, distribution, and reproduction in any medium, provided the original work is properly cited. |