| Phyton-International Journal of Experimental Botany |
DOI: 10.32604/phyton.2022.021455
ARTICLE
Transcriptome Profiling of Flower Development Reveals Key Genes Mediating Yellow Formation in Tree Peony
Life Science Department, Luoyang Normal University, Luoyang, 471934, China
*Corresponding Author: Yanzhao Zhang. Email: yzhao_zhang@163.com
Received: 15 January 2022; Accepted: 28 March 2022
Abstract: Tree peony cultivars with yellow flowers are rare and valuable, but the molecular mechanism of pigment accumulation is not clear. In this study, the petal transcriptome of three developmental stages were sequenced to determine the differentially expressed genes (DEGs) regulating yellow flowers color. The results showed that 10,842 and 12,022 DEGs were screened in stage 1 vs. stage 2 and in stage 2 vs. stage 3, respectively. Through analysis of flavonoid structural genes (FSGs), we found that the transcription level of DFR was very low in the three developmental stages. In a small group of cultivars, the DFR transcription level of red flowers was 862 times higher than that of yellow flowers. These data suggested that the flavonoid pathway is interrupted in the later stage due to the low transcriptional level of DFR, which limits the biosynthesis of anthocyanins in yellow flowers. The transcription levels of F3’H and FLS were upregulated from stage 1 to stage 2, while those of CHI and FLS were downregulated from stage 2 to stage 3. In addition, 67 MYBs and 44 bHLHs showed similar transcription profiles with different members of FSGs. The results deepen our understanding of the molecular mechanism of yellow pigment accumulation in tree peony.
Keywords: Tree peony; yellow flower; transcriptome; flavonoids; DFR gene
Tree peony is a well-known ornamental flower in China. Its flowers are rich in color and are classified into nine color groups: red, black, pink, purple, blue, white, green, yellow and variegated flowers. Yellow flower cultivars are popular in the market because of their unique and bright color. However, there are few yellow cultivars, which is an important direction of new cultivar cultivation. In recent years, researchers have analyzed the pigments in tree peony flowers and found that flavonoids are the main pigment of yellow flowers [1,2], but the molecular mechanism of yellow pigment accumulation is not clear.
According to the oxidation level of the C-ring, flavonoids are categorized into six main subclasses, i.e., flavonols, flavan-3-ols, flavanones, flavones, anthocyanins, and isoflavones [3]. In the red, pink and purple color groups of tree peony, flavonoids, mainly flavonols, flavones and anthocyanins, and the flower color are mainly determined by the type and concentration of anthocyanins [4–6]. Recently, Yang et al. [2] analyzed the pigments in yellow flowers of 14 Paeonia species and found 28 flavonol glycosides and one chalcone derivative. Flavonol usually occurs as a co-pigment and show colors ranging from milky white to light yellow [7], whereas the chalcone derivative is deep yellow in plants [8–10]. In tree peony, total flavonoids, especially chalconaringenin 2’-O-glucoside and quercetin 3-O-galloylglucoside, significantly affect the color of yellow flowers [2,11].
The main pigments in tree peony are synthesized via the flavonoid biosynthetic pathway, which has been well studied in plants [3,7]. Firstly, chalcone synthase (CHS) catalyzes 4-coumaroyl-CoA and three molecules of malonyl-CoA to generate tetrahydroxychalcone (THC), which is then isomerized via chalcone isomerase (CHI) to form naringenin. The tetrahydroxychalcone can also be converted to chalcone 2’-O-glucoside by UDP-glucose-dependent THC 2’-glucosyltransferase (THC2’GT). Naringenin is composed of three aromatic rings and is the basic skeleton of all flavonoids. Further, naringenin is hydroxylated by flavonoid 3-hydroxylase (F3H), generating a dihydroflavonol (dihydrokaempferol), which can be further hydroxylated at the 3’ position of the B-ring by flavonoid 3’-hydroxylase (F3’H) to generate dihydroquercetin. Subsequently, dihydrokaempferol is competitively catalyzed by flavonol synthase (FLS) and dihydroflavonol 4-reductase (DFR) to yield flavonols and leucoanthocyanidins, respectively. Leucoanthocyanidins are converted into anthocyanins by leucoanthocyanidin dioxygenase/anthocyanidin synthase (LDOX/ANS) and a 3-glucosyl transferase (3GT). In Arabidopsis, the early flavonoid biosynthetic genes (EBGs), including CHS, CHI, F3H, F3’H, are controlled by three R2R3-MYBs, MYB11, MYB12 and MYB111 [12]. In contrast, the late flavonoid biosynthetic genes (LBGs) are activated by transcription factors from the MYB, bHLH and WD40 families; the MYB-bHLH-WD40 complex binds to the promoter of structural genes to control their transcription [13].
In recent years, the flavonoid biosynthesis genes in tree peony have been screened using transcriptome sequencing technology [14–16]. Zhang et al. [17] reported that PsFLS redirected the anthocyanin pathway to flavonol biosynthesis in f3’h branches of cv. ‘Erqiao’. PlTHC2’GT is an important gene contributing to the yellow pigment in Paeonia delavayi flowers [18]. PsMYB58 and PsbHLH1 were verified to regulate the anthocyanin pathway in tree peony flowers [19,20]. However, the genes profile that determines the yellow pigment remains unclear in tree peony. ‘High Noon’ is a typical yellow flower tree peony cultivar, and its flower coloring process can be divided into three stages with obvious color differences. Through the comparative analysis of the transcriptome in the three coloring stages and the analysis of flavonoid-related genes, we aimed to clarify the molecular mechanism of the specific accumulation of the yellow pigment and lay a foundation for the cultivation of yellow flower cultivars.
Paeonia × lemoinei ‘High Noon’, ‘Yellow Crown’, ‘Nishiki Jima’, Paeonia suffruticosa ‘Caozhou Hong’, ‘Hohki’, and ‘Yoyono Homare’ were grown in a germplasm resource nursery at the Luoyang Academy of Agriculture and Forestry Sciences. Petals of ‘High Noon’ in three development stages with green, yellow-green and yellow colors and flowers of all of the above six cultivars in the initial open stage were collected from April 05 to 15, 2020. Spots with a purplish red color on the base of the petals were removed, and the remaining petals were immediately frozen in liquid nitrogen and stored at −80°C. For each cultivar, samples were collected from three independent plants.
2.2 Determination of Total Flavonoids and the Chlorophyll Concentration
According to the method described by Wu et al. [21] with some modifications, the total flavonoid concentration was detected according to the calibration curve of rutin and was expressed as milligrams of rutin per gram of fresh weight. The rutin standard (Solarbio, China) was dissolved in 60% ethanol, and a series of solutions with different concentrations (0, 0.04, 0.08, 0.12, 0.16 and 0.2 mg/mL) was prepared as follows: add 2 mL of each solution to 0.5 mL of 5% NaNO2 and allow the mixture to stand for 6 min. Then, add 0.5 mL of 10% Al (NO3)3, mix well and let it stand for 6 min. Finally, add 4 mL of 4% NaOH and 3 ml of 60% ethanol, mix well and let it stand for 15 min. The absorbance of each solution at 510 nm was determined by a model 752 UV spectrophotometer (Shanghai Shunyu Hengping Scientific Instrument Co., Ltd., China), and the standard curve of rutin was calculated as y = 13.974x − 0.0024 (r2 = 0.9993). Flower color was detected using 3 nh colorimeter (Model No. SR-60, Shenzhen ThreeNH Technology Co., Ltd., Shenzhen, China).
For detection of the chlorophyll concentration, 0.3 g of petals was thoroughly ground in a mortar with quartz sand and 80% acetone. The mixture was transferred into a 15 mL centrifuge tube and centrifuged at 4,000 rpm for 10 min. The supernatant was added to 25 mL of 80% acetone, and the absorbance values were measured at 663 and 645 nm. The chlorophyll concentration was calculated by the following formulas [22]:
where V is the volume of the extract (mL) and W is the fresh weight (FW) of the sample (g).
2.3 cDNA Library Construction and Transcriptome Sequencing
Total RNA was extracted using the EASYspin Plus Complex Plant RNA Kit (Aidlab, China) according to the manufacturer’s instructions. RNA purity, concentration and integrity were evaluated using an Agilent Bioanalyzer 2100 (Agilent Technologies, USA). RNA with RIN (RNA Integrity Number) >9.8 and 28S/18S between 1.8–2.1 was used for further analysis. Poly (A) mRNA was enriched from total RNA with oligo (dT)-attached magnetic beads and was broken into pieces using a fragmentation buffer. The first-strand cDNA was synthesized using random hexamer-primed reverse transcription, followed by second-strand cDNA synthesis. Fragments of the double-stranded cDNA were end repaired, and single nucleotide A (adenine) was added at the 3′ ends, which were subsequently connected to sequencing adaptors. The cDNA fragments were enriched by PCR amplification. The PCR products were purified by Ampure XP beads and were then heated, denatured and circularized by the splint oligo sequence to obtain the final library. All six libraries were sequenced on a DNBSEQ platform (BGI-Shenzhen, China). The raw data reported in this study have been deposited in the Genome Sequence Archive [23] under accession number CRA003209 and are publicly accessible at http://bigd.big.ac.cn/gsa.
2.4 De novo Assembly and Gene Annotation
To obtain high quality clean reads, the raw reads were filtered by SOAPnuke [24]. Reads containing sequencing adapters, low quality reads with more than 5% ambiguous ‘N’ bases, or those in which more than 20% of the bases scored < Q15 were removed. The six clean reads were assembled by Trinity [25] to obtain transcripts. Then, the assembled transcripts were clustered by the TGI clustering tool (Tgicl) [26] to obtain unigenes. The assembly quality was evaluated against a database of single-copy orthologous genes for plants as implemented in Benchmarking Universal Single-Copy Orthologs (BUSCO) [27]. To predict gene function, unigenes were aligned against public databases including NR, Nt, Swissprot, KEGG, KOG and Pfam using the BLAST program with an E-value threshold <1e–5. Pathway assignments were mapped based on the KEGG database. The transcription factors were identified using the Plant Transcription Factor Database PlantTFDB 4.0 [28].
2.5 Differentially Expressed Genes Analysis
Clean reads were mapped to unigenes using Bowtie2 [29], and the gene expression levels in each sample were calculated using RSEM [30]. Differentially expressed genes between groups of stage 1 and stage 2 and between groups of stage 2 and stage 3 were screened using DEseq2 [31], and thresholds were set as a Q value < 0.05 and absolute log2 fold change >1.
2.6 Quantitative Real-Time PCR (qRT-PCR) Analysis
Total RNA (1 μg) of each sample was used as a template, and first-strand cDNA was synthesized using the Prime ScriptTMRT reagent Kit with gDNA Eraser (TaKaRa, China) according to the manufacturer’s instructions. The cDNA was diluted 10 times with RNase free water and used as a template. Transcription levels of DEGs were detected using TB Green® Premix Ex Taq™ II (Tli RNaseH Plus) (TaKaRa, China) on the CFX96TM Real-Time System (Bio-Rad, USA). The quantitative real-time PCR reaction volume was 25 μL and included 12.5 μL TB Green Premix Ex Taq II, 1 μL forward primer, 1 μL reverse primer (10 μM/μL), 2 μL cDNA template, and 8.5 μL of RNase-free water. Primers used for qRT-PCR are shown in Table S1. The amplification program was initial denaturation 95°C for 3 min, followed by 40 cycles of 95°C for 10 s, 40°C–44°C for 15 s, and 72°C for 20 s. Ubiquitin was used as an internal control gene to normalize the expression of candidate genes [32]. The relative transcription levels of genes were calculated using the 2–ΔΔCt method [33]. Each gene expression data point represents the average of three biological repeats.
The differences of total flavonoids, chlorophyll concentration and gene expression levels in the three developmental stages of tree peony flower were assessed by one-way analysis of variance (ANOVA) with Tukey HSD multiple comparison post hoc test. One-way ANOVA was used to assess the difference of DFR expression level among tree peony cultivars. All statistical analysis was performed by SPSS 19.0 software. Differences were considered statistically significant at P < 0.05.
3.1 Total Flavonoids and the Chlorophyll Concentration in ‘High Noon’ Petals
In order to understand the flower coloring process of Paeonia suffruticosa ‘High Noon’, petals in three developmental stages with obvious color differences were selected for analysis. From stage 1 to stage 3, the petals were green, yellow green and yellow (Figs. 1A–1D). By measuring the flower color, we found that the values of L* (brightness), a* (redness), and b* (yellowness) gradually increased from stage 1 to stage 3 (Table S2). The total flavonoid concentration in stage 2 was the highest (37.93 mg/g), followed by that in stage 3 (32.19 mg/g) and stage 1 (20.93 mg/g) (Fig. 1E). The chlorophyll concentration drastically decreased from stage 1 to stage 3, with concentrations of 0.14 mg/g, 0.05 mg/g and 0.0096 mg/g (Fig. 1F). No anthocyanins were detected in the petals in each of the three stages. Principal component analysis (PCA) was carried out based on the concentrations of flavonoids, chlorophyll, and L*, a* and b* values. The results showed a significant separation between the three stages (Fig. S1).
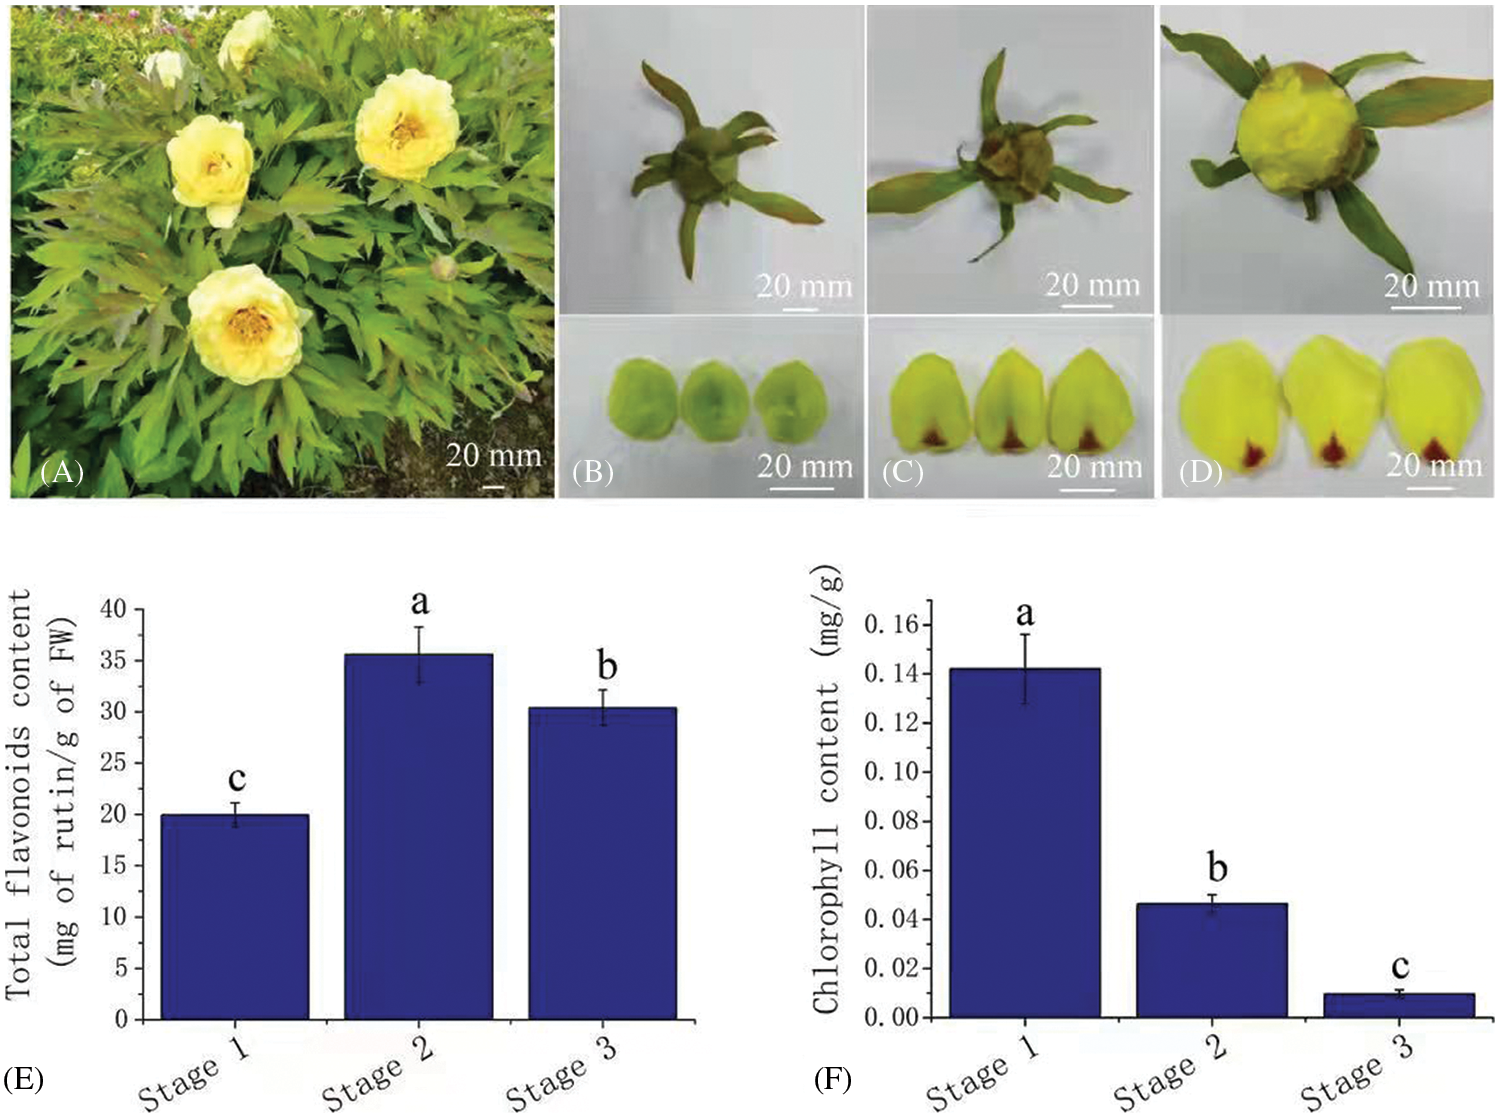
Figure 1: Total flavonoids and the chlorophyll concentration in yellow petals of tree peony. (A). Flowers of tree peony cv. ‘High Noon’; (B) to (D). Petal color in developmental stages 1 to 3; (E) to (F). Total flavonoids and the chlorophyll concentration in stage 1 to stage 3. Bars represent the standard errors of three biological replicates. Different lowercase letters indicate a significant difference (P < 0.05).
3.2 RNA-Seq and De Novo Transcriptome Assembly
Three cDNA libraries were constructed for each of the three developmental stages, and all cDNA libraries were subjected to sequencing using the DNBSEQ platform. After removal of low-quality reads and adapter sequences, 31.61, 31.96 and 31.58 Gb clean bases were obtained. These high-quality reads were de novo assembled, and 66,759 unigenes were obtained with an N50 value of 1,685 nt. Approximately 54% of them were 200–1000 bp in length (Fig. S2). The transcriptome completeness was assessed using the BUSCO tool; complete and single-copy genes accounted for about 43%, complete and duplicated genes accounted for about 54%, fragmented genes accounted for about 2%, and missing genes accounted for about 1% (Fig. S2). All these data show the relatively high quality of the transcriptome data set. All assembled unigenes were aligned to the public databases, including Nr, Nt, Swiss-Prot, KEGG, KOG, Pfam and GO; 43,584 unigenes (65.29%) were successfully annotated in at least one of the seven databases, and 17,165 unigenes (25.71%) were annotated in all seven databases.
3.3 Analysis of Differentially Expressed Genes during Flower Development
In total, 10,842 unigenes and 12,022 unigenes showed differential expression between stage 1 and stage 2 and between stage 2 and stage 3, respectively (Fig. 2). Among the DEGs, 5,160 unigenes were upregulated and 5,682 unigenes were downregulated from stage 1 to stage 2, whereas 6,230 unigenes were upregulated and 5,792 unigenes were downregulated from stage 2 to stage 3.
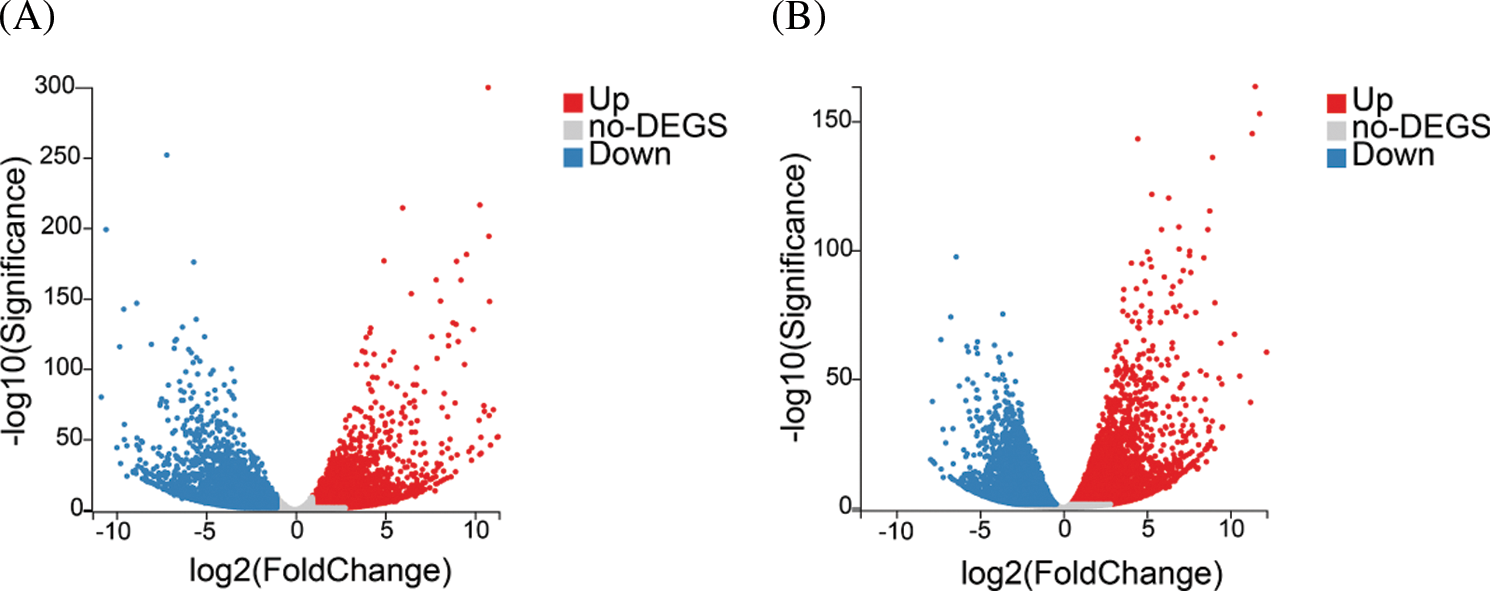
Figure 2: Analysis of differentially expressed genes (DEGs) in different developmental stages of yellow tree peony flowers. (A) to (B). Volcano plot of DEGs in stage 1 vs. stage 2 and stage 2 vs. stage 3
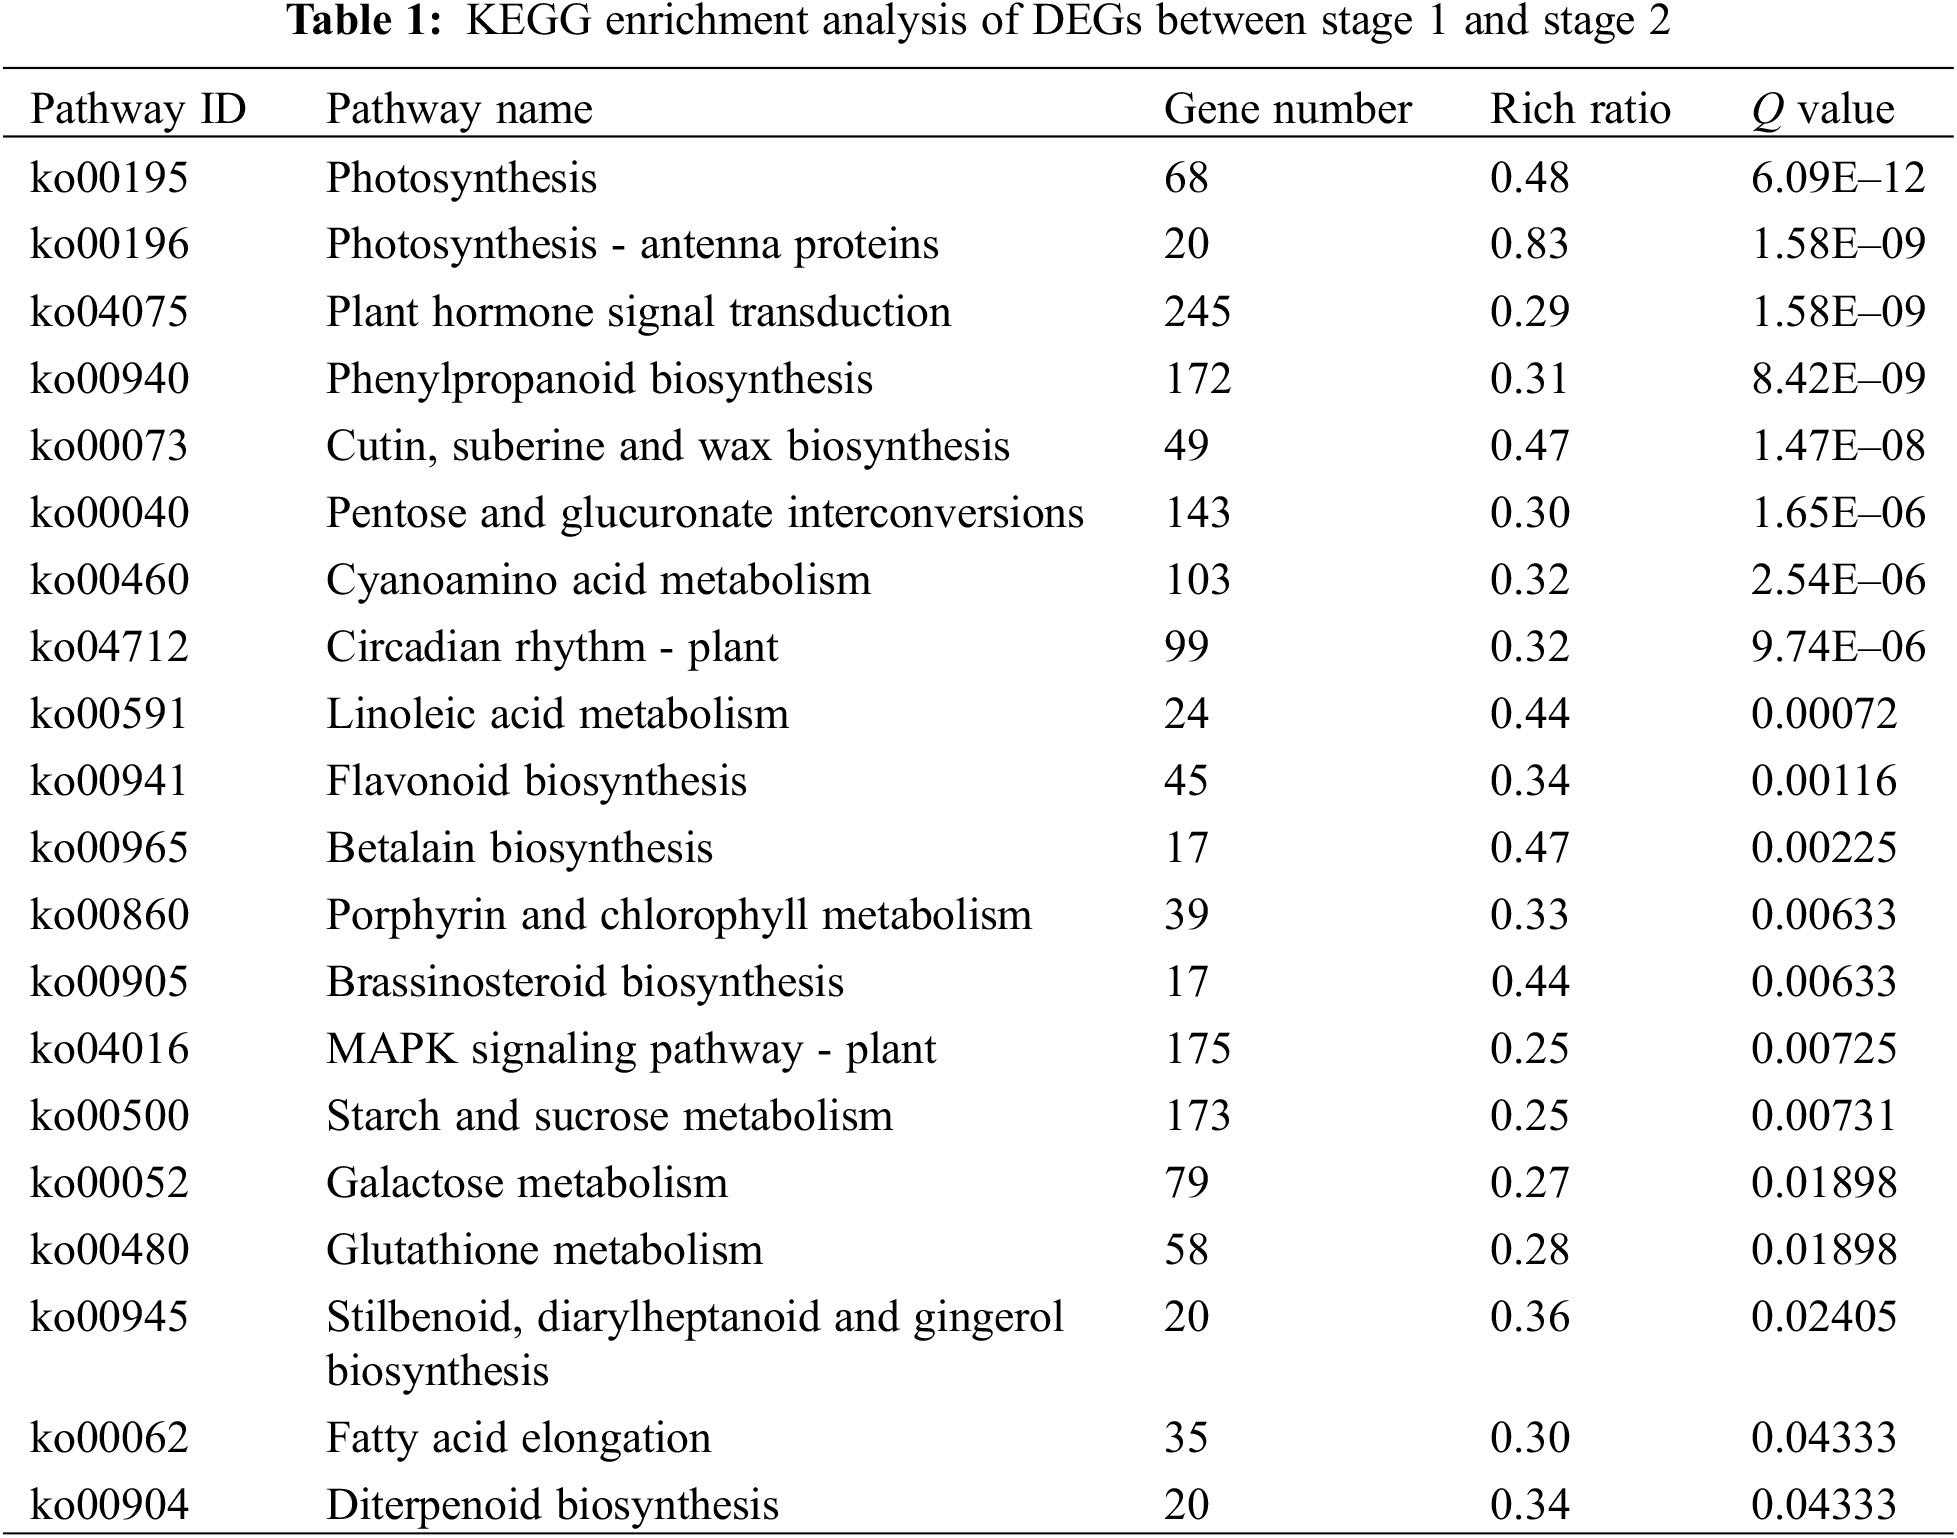
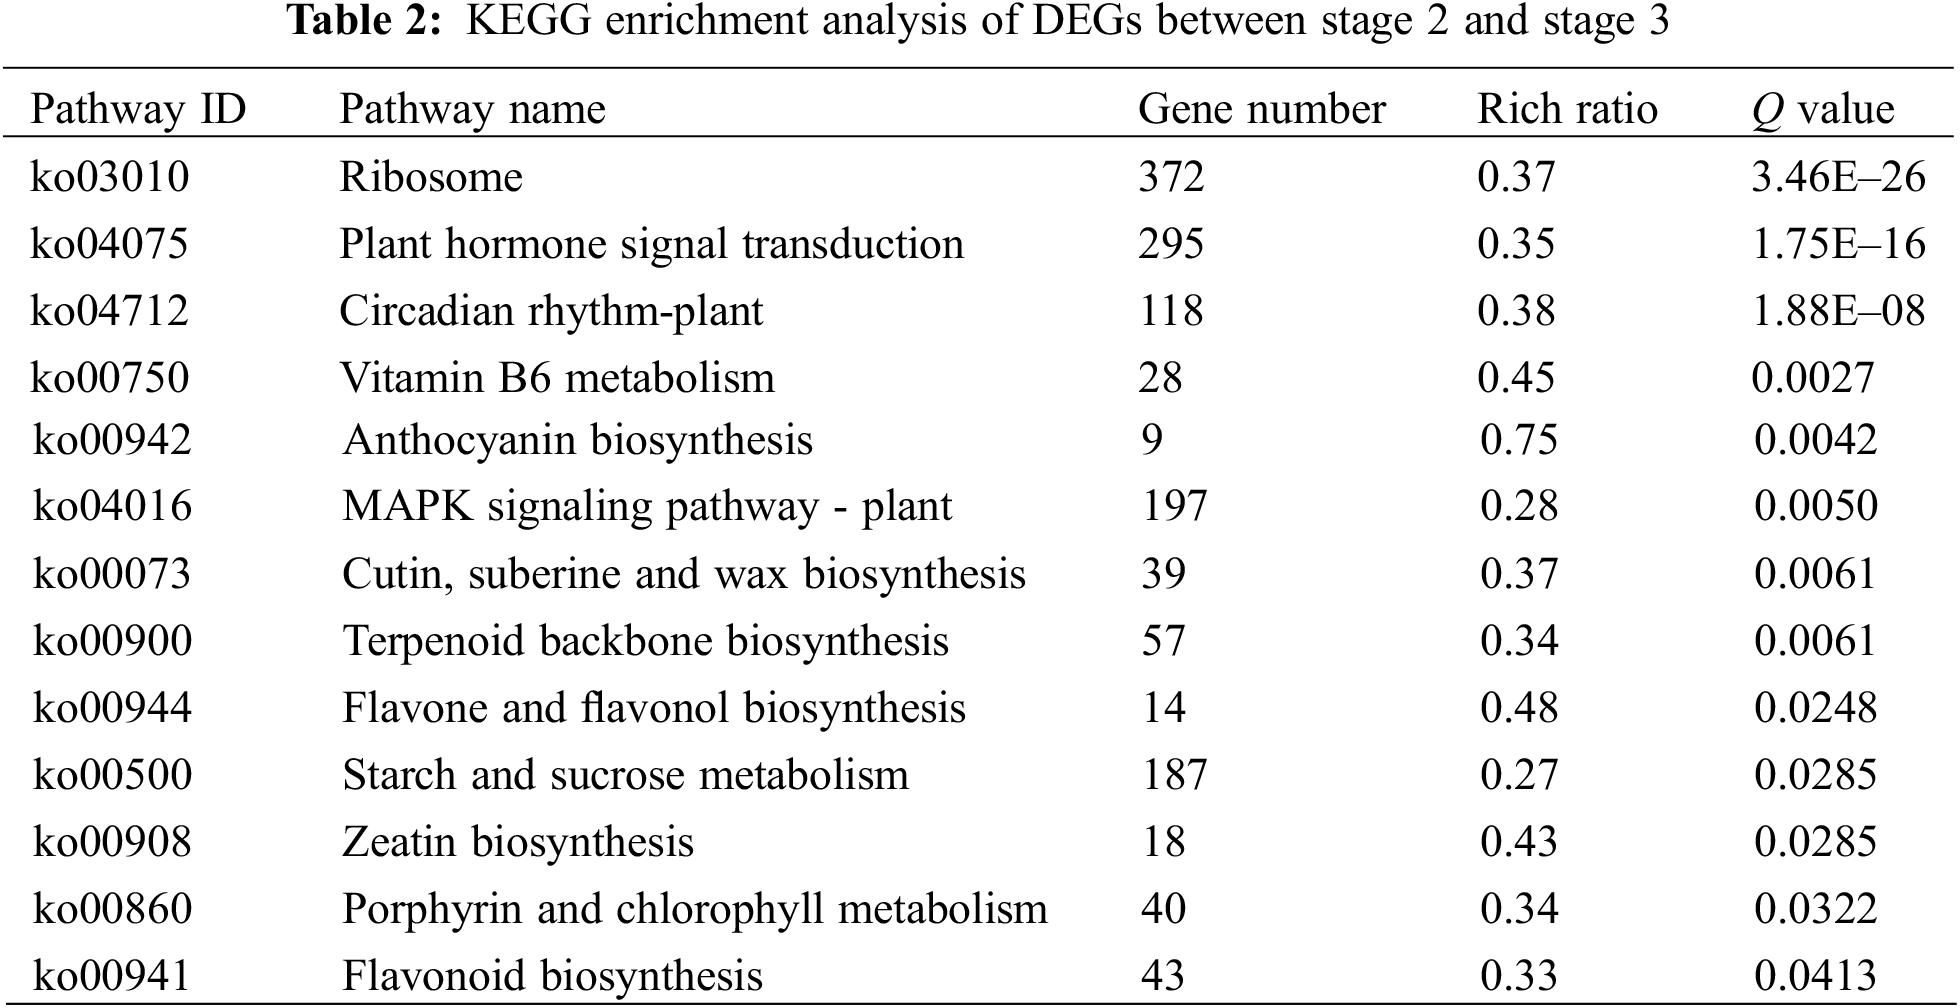
In order to understand the function of differentially expressed genes, we performed KEGG pathway analysis. In the stage 1 vs. stage 2 and stage 2 vs. stage 3 comparisons, 3,330 and 3,718 DEGs were mapped to 133 and 132 KEGG pathways, respectively. In stage 1 vs. stage 2, 20 pathways were significantly enriched, including three plant pigment pathways ‘flavonoid biosynthesis’, ‘betalain biosynthesis’ and ‘porphyrin and chlorophyll metabolism’ (Table 1). In stage 2 vs. stage 3, 13 pathways were significantly enriched, including four plant pigment pathways ‘anthocyanin biosynthesis’, ’flavone and flavonol biosynthesis’, ‘flavonoid biosynthesis’ and ‘porphyrin and chlorophyll metabolism’ (Table 2).
3.4 Identification of Genes Involved in the Flavonoid Pathway
A total of 14 flavonoid-related genes were found by querying the assembled unigenes combined with phylogenetic analysis (Table S3). Among them, the PsF3H, PsF3’H, PsFLS contain two members, Ps3GT contained four members, and the members of each gene family encode proteins that showed a similar identity.
According to the transcription profile, flavonoid synthesis genes can be divided into four groups (Fig. 3). Group 1 included PsCHS (Unigene 3948_All), PsF3H (CL4034.Contig2_All, CL4034.Contig3_All), and PsANS (Unigene13422_All), and their transcription levels were significantly upregulated from stage 1 to stage 2. Group 2 contained PsCHI (CL6819.Contig1_All), PsFLS (CL11554.Contig2_All, CL11554.Contig5_All) and two Ps3GT members (CL1307.Contig2_All, CL1307.Contig3_All); their transcription levels were downregulated from stage 2 to stage 3. Group 3 contained PsF3’H (CL2548.Contig1_All, CL2548.Contig2_All) and two Ps3GT members (CL1307.Contig4_All, CL1307.Contig5_All), and their transcription levels were upregulated from stage 1 to stage 2 but downregulated from stage 2 to stage 3. Group 4 contained PsDFR (Unigene15555_All), which was downregulated from stage 1 to stage 2.
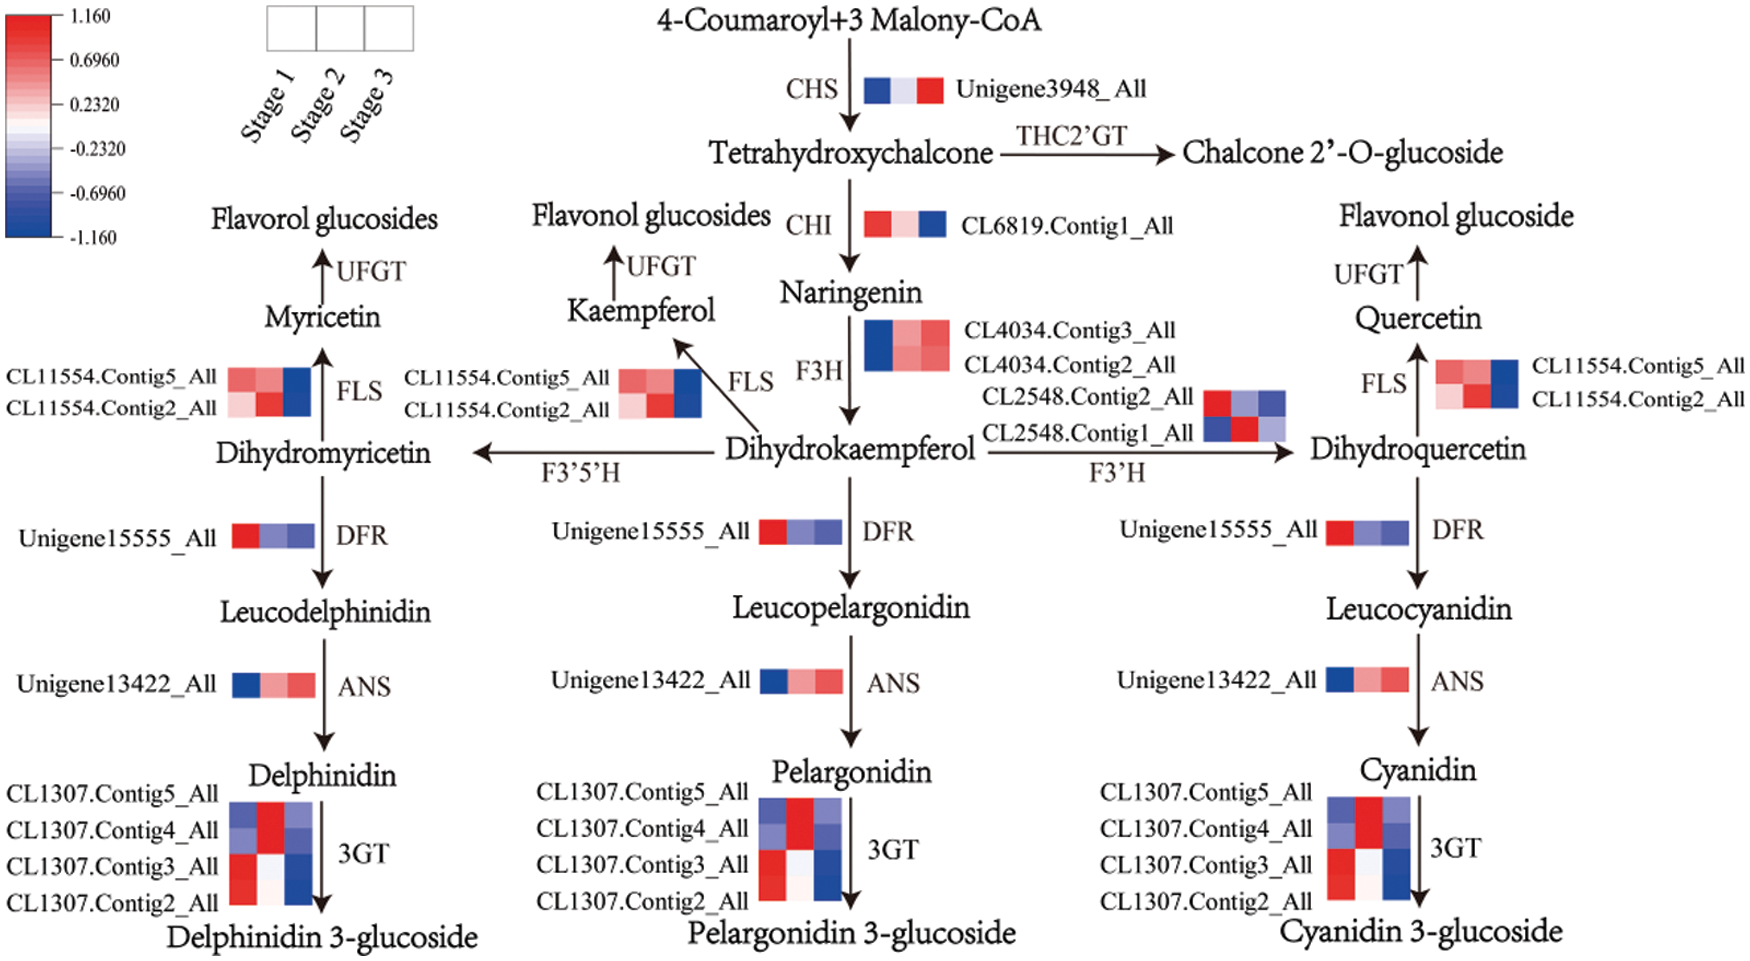
Figure 3: Transcript profiles of DEGs involved in the flavonoid pathway during yellow flower development of tree peony. The color scale from blue (low) to red (high) represents the FPKM values measured during flower development
In the flavonoid pathway, the FPKM value of DFR was 2.06, 0.24 and 0.03 from stage 1 to stage 3 (Table S3), which was significantly lower than that of other structural genes. The data indicated that the transcription level of DFR was very low in the three developmental stages of yellow flowers.
3.5 DEGs Involved in the Chlorophyll Biosynthesis Pathway
A total of 14 DEGs were identified, encoding 9 enzymes involved in the chlorophyll biosynthesis pathway (Fig. 4). Among them, hemL, chlH and CLH contained two members, and NOL contained three. From stage 1 to stage 2, hemL (CL24.Contig1_All, CL24.Contig2_All), hemB (CL7475.Contig1_All), chlH (CL5284.Contig1_All, CL5284.Contig2_All), chlM (Unigene5416_All), chlE (Unigene18834_All), and POR (Unigene4034_All), were significantly downregulated. However, CLH (CL8339.Contig1_All, CL8339.Contig2_All) was upregulated. From stage 2 to stage 3, chlE (Unigene18834_All) and chlG (Unigene19205_All) were downregulated, but chlH (CL5284.Contig1_All, CL5284.Contig2_All) and NOL (CL4585.Contig1_All, CL4585.Contig2_All, CL4585.Contig3_All) were upregulated.
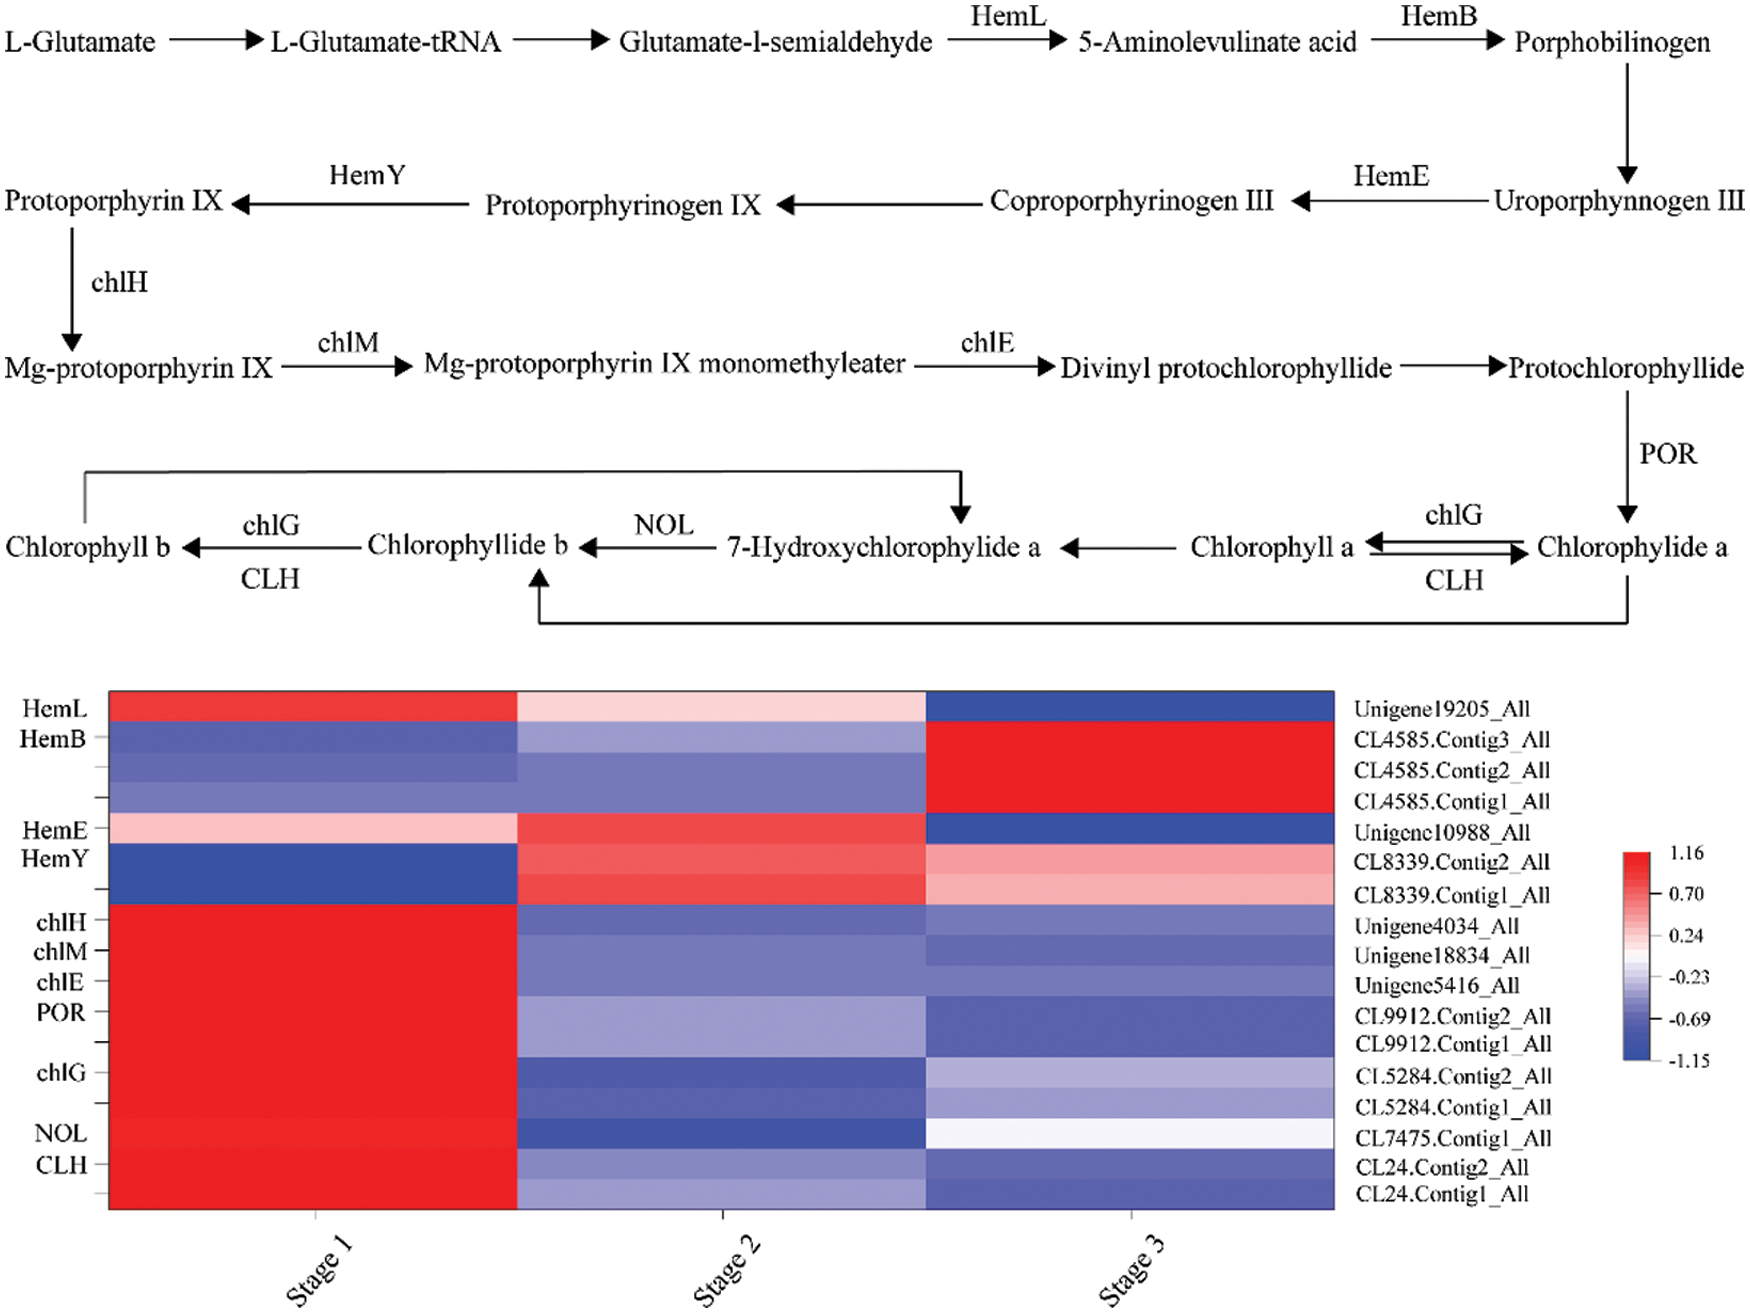
Figure 4: Transcript profiles of DEGs involved in the chlorophyll biosynthetic pathway during yellow flower development of tree peony
3.6 Expression Pattern of Transcription Factors
A total of 654 differentially expressed transcription factors (TFs) were screened in stage 1 vs. stage 2, and 583 differentially expressed TFs were screened in stage 2 vs. stage 3. The flavonoid pathway was usually controlled by members from the MYB and bHLH families. Among these TFs, 93 MYBs and 62 bHLHs were differently expressed among the three developmental stages. Transcription profiles of MYBs and bHLHs were shown in Fig. 5 and Table S4, the transcription profiles of group 1 to group 4 members were similar to those of group 1 to group 4 members of FSGs, a total of 67 MYBs and 44 bHLHs showed similar transcription profiles with different members of FSGs. The transcription profiles of group 5 members were different from that of FSGs.
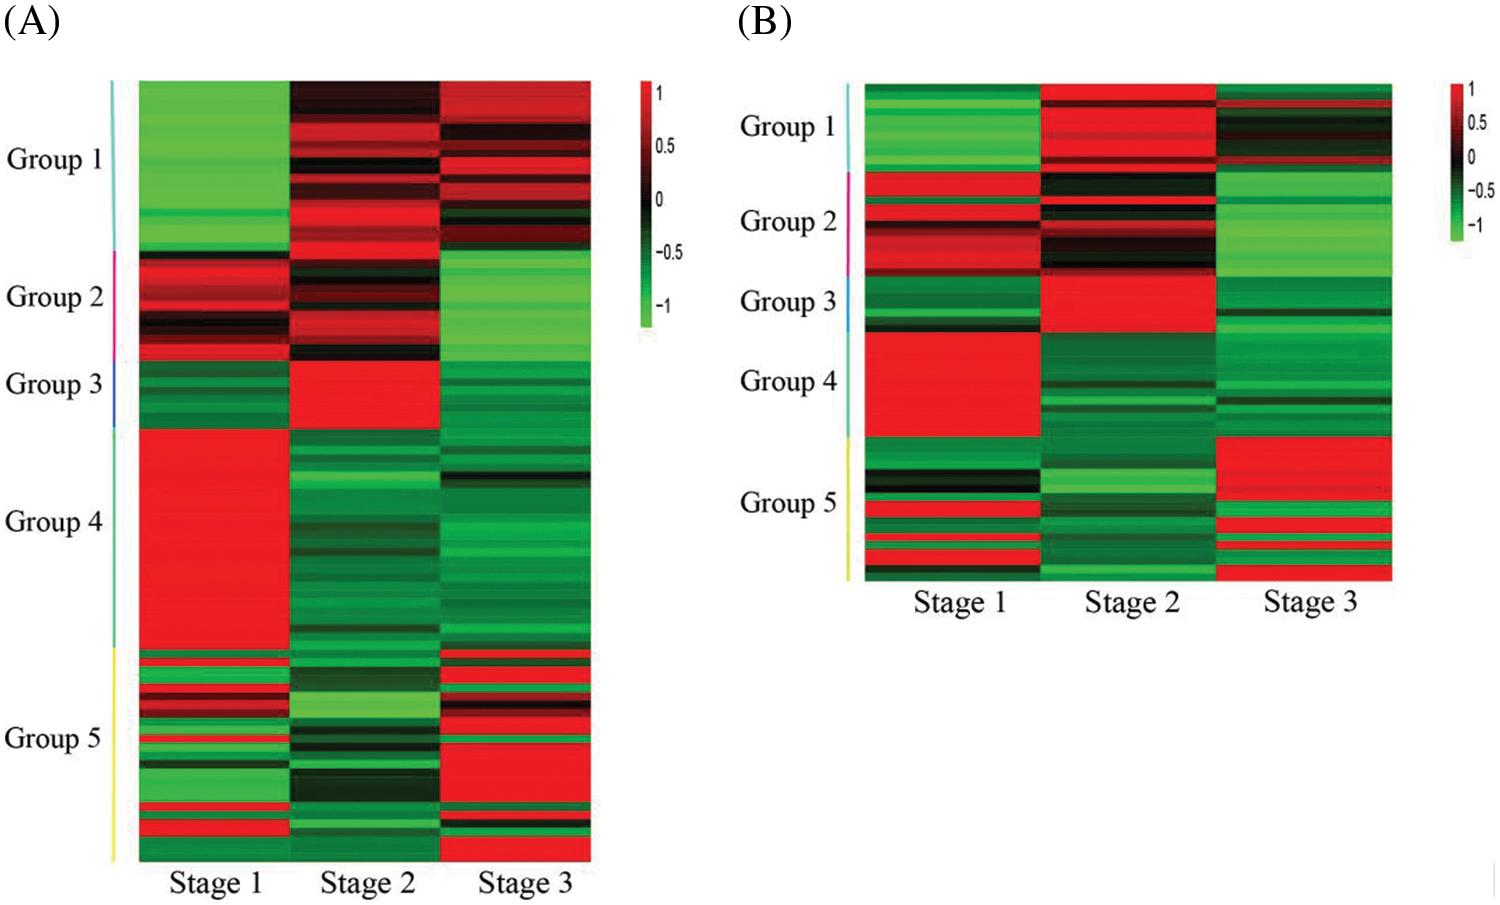
Figure 5: Heatmap of MYB and bHLH genes differentially expressed among flower developmental stages. (A) Heatmap of 93 MYB genes. (B) Heatmap of 62 bHLH genes
Four TFs PsbHLH1, PsbHLH2, PsbHLH3 and PsMYB58 were associated anthocyanin regulatory in tree peony [19,20,34]. Among the DEGs, PsbHLH1 (CL1465.Contig4_All, CL1465.Contig1_All), PsbHLH2 (Unigene7229_All) and PsbHLH3 (CL1499.Contig2_All, CL1499.Contig1_All) were identified. A MYB gene (Unigene9142_All), which showed about 82.4% nucleotide identity with PsMYB58, was also identified and renamed as PsMYB58-like (Fig. S3). The transcriptional profile of PsbHLH3 was similar to that of members of group 1, that of PsbHLH2 was similar to that of group 2, and that of PsMYB58-like was similar to that of group 3. PsbHLH1 was upregulated from stage 2 to stage 3.
3.7 qRT-PCR Analysis of Genes Involved in the Flavonoid Pathway
The transcription profiles of the flavonoid structural and regulatory genes were further confirmed by qRT-PCR (Fig. 6). In the three developmental stages of the flowers, the F3’H, ANS, 3GT, FLS, PsMYB58-like, PsbHLH1 and PsbHLH3 were significantly up regulated from stage 1 to stage 2. CHI, FLS, 3GT and PsbHLH2 were significantly down regulated from stage 2 to stage 3. The transcription level of DFR showed no significant difference among the three developmental stages.
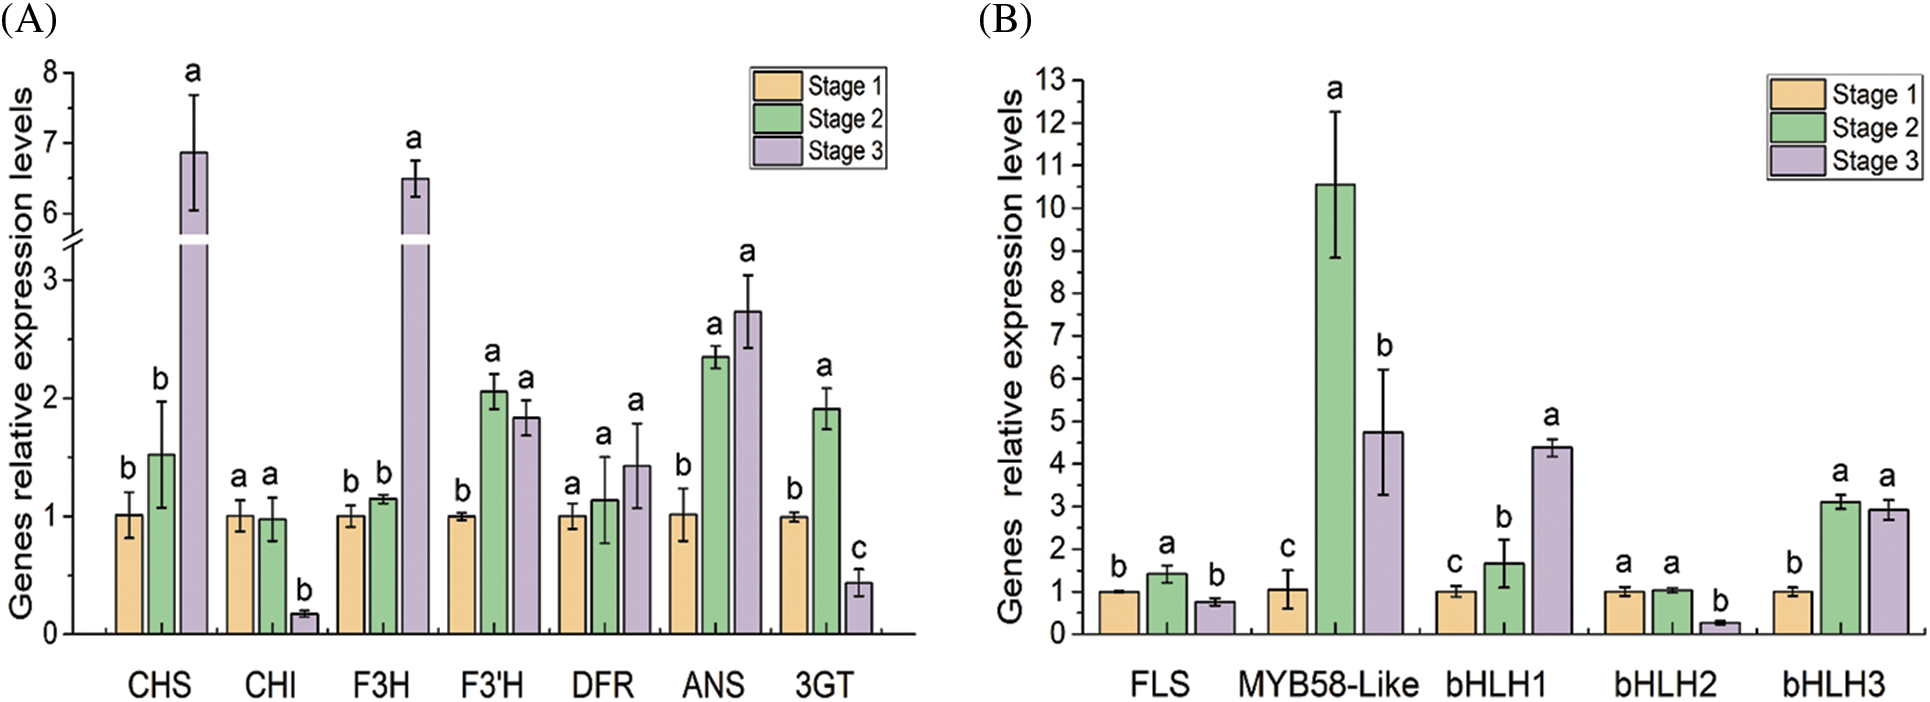
Figure 6: Expression analysis of 12 DEGs related to the flavonoid pathway in tree peony by qRT-PCR. Data represent the means ± SD of three independent biological replicates. Different lowercases indicate significant differences
3.8 Transcription Level Analysis of DFR in a Small Group of Tree Peony
In order to further confirm the relationship between the DFR gene and yellow flowers of tree peony, a small group of tree peony plants was selected for DFR transcription level analysis. This group included three red flower cultivars, ‘Yoyono Homare’, ‘Hohki’ and ‘Caozhouhong’, and three yellow flower cultivars, ‘High Noon’, ‘Yellow Crown’ and ‘Nishiki Jima’. The results showed that among the three red flower cultivars, the transcription level of DFR was the highest in ‘Yoyono Homare’, followed by ‘Caozhouhong’ and ‘Hohki’. Among the three yellow flower cultivars, the transcription level of DFR was the highest in ‘Nishiki Jima’, followed by ‘High Noon’ and ‘Yellow Crown’. The DFR transcription level of the three red flowers cultivars was 1,600 times higher than that of ‘High Noon’. The transcription level of DFR in ‘Hohki’ was 862 times that in ‘Nishiki Jima’. Overall, the transcription level of DFR in the red cultivars was significantly higher than that in the yellow flower cultivars (Fig. 7).
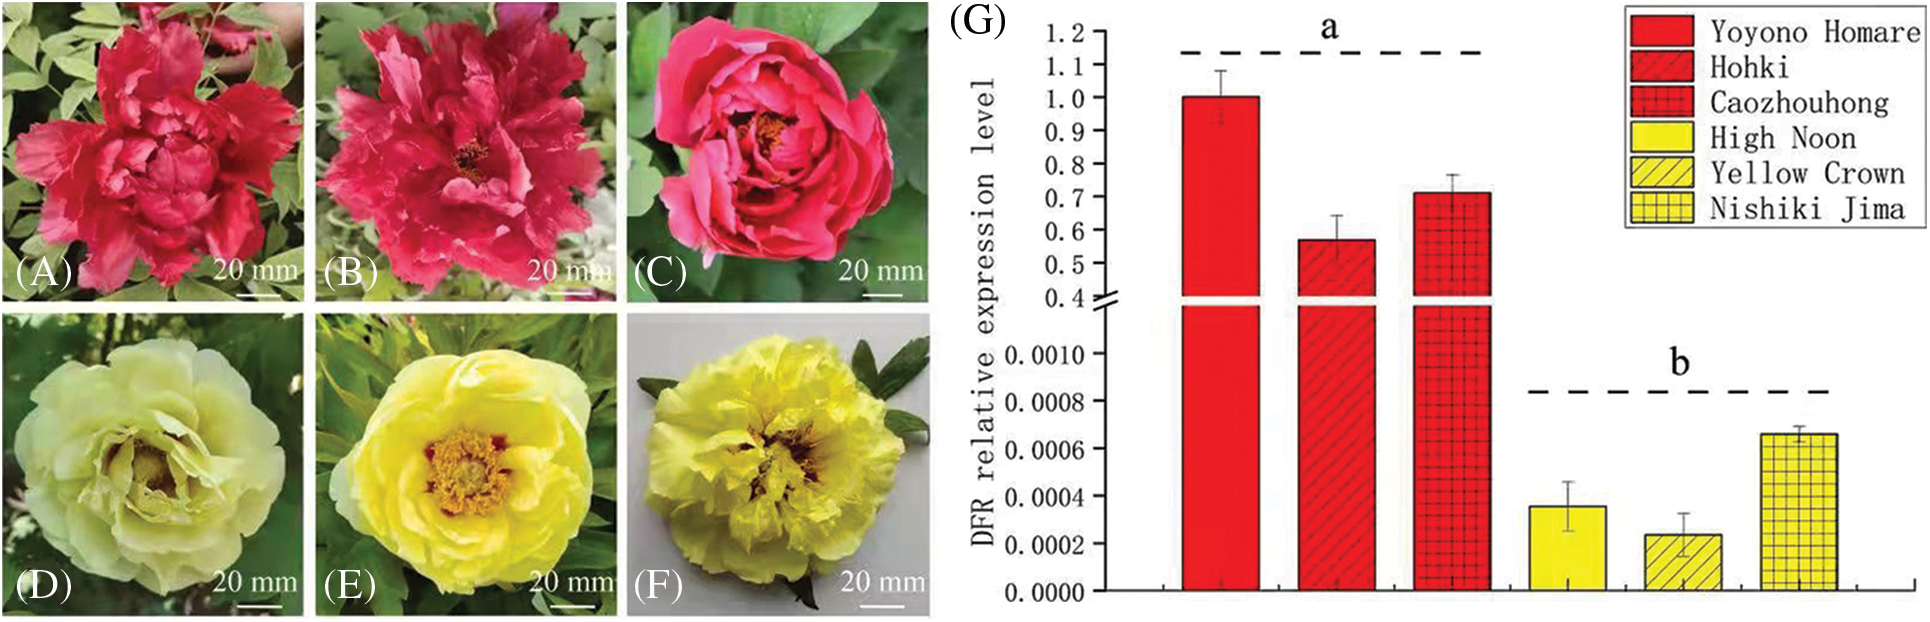
Figure 7: Transcription level analysis of DFR in a small group of tree peony cultivars, (A) to (F). Flower color of the tree peony cultivars ‘Yoyono Homare’, ‘Hohki’ ‘Caozhouhong’, ‘High Noon’, ‘Yellow Crown’ and ‘Nishiki Jima’; (G). Transcription level of DFR in flowers of the above six tree peony cultivars. Data represent the means ± SD of three independent biological replicates. Different lowercases indicate significant differences
In the tree peony cultivar ‘High Noon’, petals color varied significantly across the three developmental stages, gradually changing from green to yellow from stage 1 to stage 3. The chlorophyll concentration decreased significantly from stage 1 to stage 3, and the concentration of total flavonoids in the three stages was 20.93, 37.93 and 32.19 mg/g in stage 1, stage 2 and stage 3, respectively. Anthocyanins were not detected in all three stages. These data indicated that flavonoids were mainly responsible for the yellow flower color, which is consistent with previous research on the yellow flowers of tree peony [1,2]. In this study, the transcriptomes of the petals from the three developmental stages were sequenced, yielding 31.61, 31.96 and 31.58 Gb clean bases for stage 1, stage 2 and stage 3, respectively. In addition, 66,759 unigenes were de novo assembled, and the N50 value was 1,685 nt. Based on transcriptome comparative analysis, 10,482 DEGs were obtained in stage 1 vs. stage 2, and 12,022 DEGs were obtained in stage 2 vs. stage 3. These data provide a large amount of important information and lay a foundation for revealing the color process of yellow flowers in tree peony.
The transcriptional profiles of 12 flavonoid structural genes were detected using qRT-PCR to verify the transcriptome data. The FPKM value of DFR was very low in the three developmental stages, i.e., 2.06, 0.24 and 0.03 in stage 1, stage 2 and stage 3, respectively. Previous studies have shown that the gene expression data represented by low FPKM value may not be expressed, e.g., in soybean and Tibetan wild barley, respective FPKM values ≥1 and 2 were set as a threshold to count the expressed genes [35,36]. Combined the transcriptome data and qRT-PCR result, we suggest that the transcription level of DFR was very low, and there was no significant difference among the three stages.
The main pigments in ‘High Noon’ petals are flavonoids, and the total flavonoid concentration increased from stage 1 to stage 2, but decreased from stage 2 to stage 3. Yang et al. [2] and Li et al. [1] reported that pigments in ‘High Noon’ petals are mainly composed of seven kinds of flavonoid, which are the modified products of kaempferol, chalcononaringenin, quercetin and myricetin. In the flavonoid pathway, the synthesis of these four intermediates requires the participation of the early biosynthesis genes of the flavonoid pathway, including CHS, CHI, F3H, F3’H, FLS and THC2’GT. In ‘High Noon’ petals, the transcription levels of F3’H and FLS were upregulated from stage 1 to stage 2 and were responsible for the increase in the total flavonoid concentration. CHI and FLS were downregulated from stage 2 to stage 3, which may limit the synthesis of kaempferol, quercetin and myricetin, resulting in a decrease in the total flavonoid concentration. There were 67 MYBs and 44 bHLHs which showed similar transcription profiles with different members of FSGs, which may be related to flavonoid regulation.
THC2’GT converts naringenin chalcone to chalcone 2’-O-glucoside, which plays an important role in the process of yellow color formation [18,37]. However, THC2’GT was not differentially expressed in the three developmental stages, and it is suggested that the chalcone 2’-O-glucoside concentration in the three stages was mainly affected by the transcription level of CHS.
Anthocyanin is a branch of the flavonoid pathway. As there was no anthocyanin accumulation but total flavonoid accumulation in the petals of ‘High Noon’, we speculate that the interruption of the anthocyanin pathway in ‘High Noon’ may be related to the LBGs of the flavonoid pathway. Through analysis of the LBGs, it was found that the transcription level of the DFR gene was very low in the three stages of flower development, and the transcription level of the DFR gene in the red flower cultivars was more than 1,600 times that in ‘High Noon’. DFR is a key enzyme in the late stage of the flavonoid pathway, and its mutation leads to the inability of plants to accumulate anthocyanins [38,39]. Therefore, we suggest that the low transcription level of DFR was the key factor limiting anthocyanin accumulation in ‘High Noon’ flowers.
DFR is mainly regulated by transcriptors from the MYB and bHLH families; four regulatory genes may regulate the flavonoid pathway in tree peony [19,20,34]. In ‘High Noon’, DFR showed a different transcription profile with the flavonoid regulatory genes PsMYB58-Like, PsbHLH1, PsbHLH2 and PsbHLH3; therefore, the low transcription level of DFR may not be due to these four regulatory genes. Referring to the DFR promoter sequence of tree peony reported by Qi et al. [19], we obtained the DFR promoter from the red flower cultivar ‘Erqiao’, but not from the cultivar ‘High Noon’. Using a genomic walking technique, we obtained a 275 bp fragment of the DFR promoter from ‘High Noon’, which showed low similarity with that from ‘Erqiao’ at the 5’ end (Fig. S4). We suggest that the low transcription level of DFR in ‘High Noon’ flowers may be related to the specificity of its promoter. The transcriptional profiles of 26 MYB genes and 13 bHLH genes were similar to DFR, they may be candidate genes regulating DFR transcription.
In conclusion, the concentrations of chlorophyll and total flavonoids in ‘High Noon’ determined the color changes in the three stages of petal development, and the yellow color was mainly determined by the concentration of total flavonoids. The transcription level of DFR was very low in the three developmental stages, which disrupted the anthocyanin pathway and resulted in the yellow pigment mainly accumulating in petals. The transcription levels of F3’H and FLS were upregulated from stage 1 to stage 2, which led to the increase in the total flavonoid concentration. In contrast, CHI and FLS were downregulated from stage 2 to stage 3, resulting in a decrease in the total flavonoid concentration. The results help us to further understand the color process of yellow tree peony flowers at the molecular level. The analysis of flavonoid-related genes also lays a foundation for the cultivation of yellow flower cultivars.
Authorship: The authors confirm contribution to the paper as follows: study conception and design: Yanzhao Zhang; data collection: Chenyang Yu, Xi Lu; analysis and interpretation of results: Yanzhao Zhang, Yanwei Cheng; draft manuscript preparation: Yanzhao Zhang. All authors reviewed the results and approved the final version of the manuscript.
Funding Statement: This research was funded by Henan Province Science and Technology Breakthrough Project (212102110015) and the Key Scientific Research Projects of Colleges and Universities in Henan Province (21A180018).
Conflicts of Interest: The authors declare that they have no conflicts of interest to report regarding the present study.
1. Li, C., Du, H., Wang, L., Shu, Q., Zheng, Y. et al. (2009). Flavonoid composition and antioxidant activity of tree peony (Paeonia section Moutan) yellow flowers. Journal of Agricultural and Food Chemistry, 57(18), 8496–8503. DOI 10.1021/jf902103b. [Google Scholar] [CrossRef]
2. Yang, Y., Li, B., Feng, C., Wu, Q., Wang, Q. et al. (2020). Chemical mechanism of flower color microvariation in Paeonia with yellow flowers. Horticultural Plant Journal, 6(3), 179–190. DOI 10.1016/j.hpj.2020.04.002. [Google Scholar] [CrossRef]
3. Lepiniec, L., Debeaujon, I., Routaboul, J. M., Baudry, A., Pourcel, L. et al. (2006). Genetics and biochemistry of seed flavonoids. Annual Review of Plant Biology, 57(1), 405–430. DOI 10.1146/annurev.Arplant.57.032905.105252. [Google Scholar] [CrossRef]
4. Wang, L. S., Shiraishi, A., Hashimoto, F., Aoki, N., Shimizu, K. et al. (2001). Analysis of petal anthocyanins to investigate flower coloration of Zhongyuan (Chinese) and Daikon Island (Japanese) tree peony cultivars. Journal of Plant Research, 114(1), 33–43. DOI 10.1007/PL00013966. [Google Scholar] [CrossRef]
5. Zhang, B., Hu, Y., Han, J., Liu, Q. (2013). Study on flavonoids in petals of seven jiangnan tree peony cultivars. Northern Horticulture, 2, 61–65. [Google Scholar]
6. Zhang, Y., Zhang, Y., Duan, X., Liu, X., Yuan, S. et al. (2020). Anthocyanins in tree peony (Paeonia suffruticosa) and their relationship with flower color. Horticultural Science Technology, 38, 776–784. DOI 10.7235/HORT.20200070. [Google Scholar] [CrossRef]
7. Winkel-Shirley, B. (2001). Flavonoid biosynthesis. A colorful model for genetics, biochemistry, cell biology, and biotechnology. Plant Physiology, 126(2), 485–493. DOI 10.1104/pp.126.2.485. [Google Scholar] [CrossRef]
8. Nakayama, M. (2020). Flower pigments responsible for cyanic, yellow, and cream-white coloration in carnation. In: The carnation genome, pp. 61–79. German: Springer Press. [Google Scholar]
9. Yoshida, H., Itoh, Y., Ozeki, Y., Iwashina, T., Yamaguchi, M. (2004). Variation in chalcononaringenin 2′-O-glucoside content in the petals of carnations (Dianthus caryophyllus) bearing yellow flowers. Scientia Horticulturae, 99(2), 175–186. DOI 10.1016/S0304-4238(03)00093-1. [Google Scholar] [CrossRef]
10. Iwashina, T., Takemura, T., Mishio, T. (2009). Chalcone glycoside in the flowers of six Corylopsis species as yellow pigment. Journal of the Japanese Society for Horticultural Science, 78(4), 485–490. DOI 10.2503/jjshs1.78.485. [Google Scholar] [CrossRef]
11. Wang, J., Lewis, D., Shi, R., McGhie, T., Wang, L. et al. (2021). The colour variations of flowers in wild Paeonia delavayi plants are determined by four classes of plant pigments. New Zealand Journal of Crop and Horticultural Science, 50(1), 1–16. DOI 10.1080/01140671.2021.1927763. [Google Scholar] [CrossRef]
12. Stracke, R., Ishihara, H., Huep, G., Barsch, A., Mehrtens, F. et al. (2007). Differential regulation of closely related R2R3-MYB transcription factors controls flavonol accumulation in different parts of the Arabidopsis thaliana seedling. Plant Journal, 50(4), 660–677. DOI 10.1111/j.1365-313X.2007.03078.x. [Google Scholar] [CrossRef]
13. Hichri, I., Barrieu, F., Bogs, J., Kappel, C., Delrot, S. et al. (2011). Recent advances in the transcriptional regulation of the flavonoid biosynthetic pathway. Journal of Experimental Botany, 62(8), 2465–2483. DOI 10.1093/jxb/erq442. [Google Scholar] [CrossRef]
14. Zhang, C., Wang, Y., Fu, J., Dong, L., Gao, S. et al. (2014). Transcriptomic analysis of cut tree peony with glucose supply using the RNA-Seq technique. Plant Cell Reports, 33(1), 111–129. DOI 10.1007/s00299-013-1516-0. [Google Scholar] [CrossRef]
15. Zhang, Y., Cheng, Y., Ya, H., Xu, S., Han, J. (2015). Transcriptome sequencing of purple petal spot region in tree peony reveals differentially expressed anthocyanin structural genes. Frontiers in Plant Science, DOI 10.3389/fpls.2015.00964. [Google Scholar] [CrossRef]
16. Luo, J., Shi, Q., Niu, L., Zhang, Y. (2017). Transcriptomic analysis of leaf in tree peony reveals differentially expressed pigments genes. Molecules, 22(2), 324. DOI 10.3390/molecules22020324. [Google Scholar] [CrossRef]
17. Zhang, Y., Cheng, Y., Xu, S., Ma, H., Han, J. et al. (2020). Tree peony variegated flowers show a small insertion in the F3’H gene of the acyanic flower parts. BMC Plant Biology, 20(1), 1–13. DOI 10.1186/s12870-020-02428-x. [Google Scholar] [CrossRef]
18. Shi, Q., Zhou, L., Wang, Y., Li, K., Zheng, B. et al. (2015). Transcriptomic analysis of Paeonia delavayi wild population flowers to identify differentially expressed genes involved in purple-red and yellow petal pigmentation. PLoS One, 10(8), e0135038. DOI 10.1371/journal.pone.0135038. [Google Scholar] [CrossRef]
19. Qi, Y., Zhou, L., Han, L., Zou, H., Miao, K. et al. (2020). PsbHLH1, a novel transcription factor involved in regulating anthocyanin biosynthesis in tree peony (Paeonia suffruticosa). Plant Physiology Biochemistry, 154(10), 396–408. DOI 10.1016/j.plaphy.2020.06.015. [Google Scholar] [CrossRef]
20. Zhang, Y., Xu, S., Ma, H., Duan, X., Gao, S. et al. (2021). The R2R3-MYB gene PsMYB58 positively regulates anthocyanin biosynthesis in tree peony flowers. Plant Physiology Biochemistry, 164(2), 279–288. DOI 10.1016/j.plaphy.2021.04.034. [Google Scholar] [CrossRef]
21. Wu, Z., Hou, C., Mao, W. (2013). Extraction and determination of total flavonoids from peony stamens and pistils. Food Drug, 15, 344–345. DOI 10.3969/j.issn.1672-979X.2013.05.017. [Google Scholar] [CrossRef]
22. Shen, W. Q. (1988). Extraction of mixed solution for determination of chlorophyll content in rice leaf blade. Plant Physiology Communication, 3, 62–64. DOI 10.13592/j.cnki.ppj.1988.03.026. [Google Scholar] [CrossRef]
23. Wang, Y., Song, F., Zhu, J., Zhang, S., Yang, Y. et al. (2017). GSA: Genome sequence archive. Genomics Proteomics & Bioinformatics, 15(1), 14–18. DOI 10.1016/j.gpb.2017.01.001. [Google Scholar] [CrossRef]
24. Chen, Y., Chen, Y., Shi, C., Huang, Z., Zhang, Y. et al. (2018). SOAPnuke: A MapReduce acceleration-supported software for integrated quality control and preprocessing of high-throughput sequencing data. GigaScience, 7(1), 1–6. DOI 10.1093/gigascience/gix120. [Google Scholar] [CrossRef]
25. Grabherr, M. G., Haas, B. J., Yassour, M., Levin, J. Z., Thompson, D. A. et al. (2011). Full-length transcriptome assembly from RNA-Seq data without a reference genome. Nature Biotechnology, 29(7), 644–652. DOI 10.1038/nbt.1883. [Google Scholar] [CrossRef]
26. Pertea, G., Huang, X., Liang, F., Antonescu, V., Sultana, R. et al. (2003). TIGR gene indices clustering tools (TGICLA software system for fast clustering of large EST datasets. Bioinformatics, 19(5), 651–652. DOI 10.1093/bioinformatics/btg034. [Google Scholar] [CrossRef]
27. Simão, F. A., Waterhouse, R. M., Ioannidis, P., Kriventseva, E. V., Zdobnov, E. M. (2015). BUSCO: Assessing genome assembly and annotation completeness with single-copy orthologs. Bioinformatics, 31(19), 3210–3212. DOI 10.1093/bioinformatics/btv351. [Google Scholar] [CrossRef]
28. Jin, J., Tian, F., Yang, D. C., Meng, Y. Q., Kong, L. et al. (2016). PlantTFDB 4.0: Toward a central hub for transcription factors and regulatory interactions in plants. Nucleic Acids Research, 45(D1), 1040–1045. DOI 10.1093/nar/gkw982. [Google Scholar] [CrossRef]
29. Langmead, B., Salzberg, S. L. (2012). Fast gapped-read alignment with Bowtie 2. Nature Methods, 9(4), 357–359. DOI 10.1038/nmeth.1923. [Google Scholar] [CrossRef]
30. Li, B., Dewey, C. N. (2011). RSEM: Accurate transcript quantification from RNA-Seq data with or without a reference genome. BMC Bioinformatics, 12(1), 1–16. DOI 10.1186/1471-2105-12-323. [Google Scholar] [CrossRef]
31. Love, M. I., Huber, W., Anders, S. (2014). Moderated estimation of fold change and dispersion for RNA-seq data with DESeq2. Genome Biology, 15(12), 550. DOI 10.1186/s13059-014-0550-8. [Google Scholar] [CrossRef]
32. Li, J., Han, J., Hu, Y., Yang, J. (2016). Selection of reference genes for quantitative real-time PCR during flower development in tree peony (Paeonia suffruticosa Andr.). Frontiers in Plant Science, 20, 22–26. DOI 10.3389/fpls.2016.00516. [Google Scholar] [CrossRef]
33. Livak, K. J., Schmittgen, T. D. (2001). Analysis of relative gene expression data using real-time quantitative PCR and the 2−ΔΔCT method. Methods, 25(4), 402–408. DOI 10.1006/meth.2001.1262. [Google Scholar] [CrossRef]
34. Zhang, C., Wang, W., Wang, Y., Gao, S., Du, D. et al. (2014). Anthocyanin biosynthesis and accumulation in developing flowers of tree peony (Paeonia suffruticosa) ‘Luoyang Hong’. Postharvest Biology and Technology, 97, 11–22. DOI 10.1016/j.postharvbio.2014.05.019. [Google Scholar] [CrossRef]
35. Yuan, F., Yu, X., Dong, D., Yang, Q., Fu, X. et al. (2017). Whole genome-wide transcript profiling to identify differentially expressed genes associated with seed field emergence in two soybean low phytate mutants. BMC Plant Biology, 17(1), 16. DOI 10.1186/s12870-016-0953-7. [Google Scholar] [CrossRef]
36. Zeng, J., He, X., Wu, D., Zhu, B., Cai, S. et al. (2014). Comparative transcriptome profiling of two Tibetan wild barley genotypes in responses to low potassium. PLoS One, 9(6), e100567. DOI 10.1371/journal.pone.0100567. [Google Scholar] [CrossRef]
37. Togami, J., Okuhara, H., Nakamura, N., Ishiguro, K., Hirose, C. et al. (2011). Isolation of cDNAs encoding tetrahydroxychalcone 2′-glucosyltransferase activity from carnation, cyclamen, and catharanthus. Plant Biotechnology, 28(2), 231–238. DOI 10.5511/plantbiotechnology.11.0106b. [Google Scholar] [CrossRef]
38. Song, S., Kim, C. W., Moon, J. S., Kim, S. (2014). At least nine independent natural mutations of the DFR-A gene are responsible for appearance of yellow onions (Allium cepa L.) from red progenitors. Molecular Breeding, 33(1), 173–186. DOI 10.1007/s11032-013-9942-9. [Google Scholar] [CrossRef]
39. Kim, S., Yoo, K. S., Pike, L. M. (2005). Development of a PCR-based marker utilizing a deletion mutation in the dihydroflavonol 4-reductase (DFR) gene responsible for the lack of anthocyanin production in yellow onions (Allium cepa). Theoretical and Applied Genetics, 110(3), 588–595. DOI 10.1007/s00122-004-1882-7. [Google Scholar] [CrossRef]
 | This work is licensed under a Creative Commons Attribution 4.0 International License, which permits unrestricted use, distribution, and reproduction in any medium, provided the original work is properly cited. |