| Phyton-International Journal of Experimental Botany |
DOI: 10.32604/phyton.2022.016358
ARTICLE
Transcriptomic Analysis of the Tolerance Response to Dehydration and Rehydration in Wheat Seedlings
1College of Agronomy and Biotechnology, Yunnan Agricultural University, Kunming, 650201, China
2College of Natural Resources and Environment, Baoshan University, Baoshan, 678000, China
3Triticeae Research Institute, Sichuan Agricultural University, Chengdu, 610000, China
*Corresponding Author: Peng Qin. Email: qinpeng77@163.com
#These authors contributed equally to this work
Received: 28 February 2021; Accepted: 06 July 2021
Abstract: Drought is the main abiotic stress that restricts wheat production. The rapid development of sequencing technology and its widespread application to various fields have revealed the structural characteristics and regulation of related genes through gene expression analysis. Here, we studied responses of wheat plants under drought and re-watering conditions, using morphological and physiological indicators. Moreover, a transcriptome analysis was conducted on Jingmai 12, a drought-resistant wheat strain, to explore the mechanism underlying the response of drought-resistant wheat seedlings to drought stress at the transcriptome level. Drought stress caused morphological and physiological changes in both drought-resistant and -sensitive varieties, but to a greater extent in the drought-sensitive specimen. After re-watering, the drought-resistant wheat showed greater ability to recover than the drought-sensitive wheat. Transcriptome sequencing of Jingmai 12 revealed 97,422 genes, including 80,373 known genes and 17,049 newly predicted genes. The observed upregulation of genes was mostly involved in hormone and signal transduction, carbon metabolism, amino acid synthesis, small molecule production, transmembrane transport, ROS detoxification and defense, drought response protein, and protective enzyme activity. Downregulated genes were mostly involved in photosynthesis, lipid metabolism, signaling, and auxin response. Upon rehydration, these genes and metabolic pathways returned to normal. Our results suggest that all these changes are adaptations to drought stress. Through morphological adaptation, physiological regulation, and the expression of drought-induced genes, normal growth of drought-resistant varieties under drought stress can be promoted. These results increase our understanding of the transcriptomic changes taking place in drought-resistant wheat seedlings under drought stress, and provide a direction for future investigations.
Keywords: Drought stress; inducible gene; morphological indicator; physiological indicator; RNA sequencing; wheat seedling
Wheat is one of the most important staple food crops in the world, making a significant contribution to food security [1]. Water is one of the major factors limiting crop growth and development [2]. Drought is an important abiotic stress that affects crop yield and profitability worldwide. Plant growth and survival are largely dependent on water availability [3], and plants respond to drought via different mechanisms, including biochemical changes and regulation of gene expression. The study of these mechanisms contributes to a better understanding of responses to drought and helps breeders develop new crop varieties more tolerant to this stress [4].
Drought tolerance in plants is generally studied by observing morphological and structural indicators, or physiological and biochemical indicators. Stress can limit plant growth, but due to long-term evolution, plants have adapted to stress by adjusting their morphological structure, as well as their growth rate and response of their organs (including stomatal closure, leaf-curling, increased root-to-shoot ratio, etc.). Studies on wheat seedlings have shown that drought stress significantly reduces their height, root length, stem diameter, root fresh weight, and relative water content [5]. However, lack of water can also increase the abscisic acid (ABA) content of leaves [6], severely decrease photosynthetic characteristics, water status, and chlorophyll content [7], and increase malondialdehyde (MDA) concentration [5] and activity of antioxidative processes [8]. Drought stress also results in increased reactive oxygen species (ROS), lipid peroxidation and membrane permeability, and the accumulation of soluble sugars, proline, and free amino acids [9].
Drought tolerance is a complex quantitative trait, involving interactions and changes in multiple genes, transcription factors, micro RNAs, hormones, proteins, cofactors, ions, and metabolites [10]. In eukaryotes, micro RNAs are endogenous non-coding RNAs with regulatory functions. Studies have found that their expression levels and patterns in drought-tolerant and drought-sensitive wheat, and their target transcripts, are altered under drought stress [11], as several stress-related genes are subject to post-transcriptional regulation [12]. There are hundreds of genes that encode plant transcription factors, including DREB, bZIP, WRKY, MYB/MYC, and NAC, which are involved in signal conversion, transmission, and gene expression regulation [13]. Overexpression of transcription factors activates the synergistic expression of stress resistance genes, which significantly enhances plant resistance to stress. DREB is a subfamily of the AP2/EREBP transcription factor family, and possesses a conserved AP2 domain that binds specifically to the DRE/CRT cis-acting elements, to regulate the expression of downstream stress-induced genes under abiotic stress conditions, thereby enhancing tolerance. Gao et al. [14] found that the upland cotton transcription factor gene, GhDREB, enhanced drought tolerance in transgenic wheat. MYB transcription factors are among the most numerous and diverse of those found in plants, and play important roles in many life processes. Cai et al. [15] suggested that TaMYB3R1 may be involved in the response of wheat to drought stress. NACs are a unique family of transcription factors in plants that play important roles in growth and development, hormone regulation, and resistance to adversity. Huang et al. [16] cloned a gene from this family of transcription factors, TaNAC29, in wheat, and when introduced into Arabidopsis thaliana, they found that the drought tolerance of plants harboring this gene was improved under water stress. It has also been shown that TaRNAC1 may play a role in root growth and enhance drought resistance in wheat [17]. The bZIP class of proteins are basic leucine zipper proteins, which are very important transcription factors in plants. They can regulate plant growth and development processes, are involved in light signaling, preventing disease, responding to stress, causing ABA sensitivity, and other signaling. Li et al. [18] found that TabZIP174 overexpression in transgenic Arabidopsis enhanced drought resistance, suggesting that it may be involved in regulating plant responses to drought stress. WRKY is a plant-specific transcription factor super family, which all contain a conserved WRKYGQK domain. Gao et al. [19] showed that TaWRKY2 enhances drought tolerance and improves wheat yield.
Drought leads to dehydration and osmotic stress in plant cells, which seriously affects various physiological and metabolic processes. Stress signals are perceived by cell surface receptors and initiate relevant signal transduction pathways. We hypothesized that various resistant wheat cultivars would exhibit diverse morphological, physiological and biochemical traits and have different adaptive mechanisms for drought stress. In this study, the responses of drought-tolerant wheat seedlings, under drought and rehydration, were investigated in terms of morphological and physiological indicators and the patterns of RNA transcription. The analysis of gene expression and related pathways associated with drought stress will help us understand the molecular mechanisms of drought tolerance in wheat and contribute to the improvement of drought-tolerant wheat varieties.
2.1 Materials Screening and Drought Treatment
Test materials were selected from 348 copies of Yunnan native wheat resources. A total of 348 seedlings were planted in 50-well (60 × 40 × 15 cm) seedling trays, guaranteeing the growth of 15–25 seedlings of each variety. Twenty-four drought-tolerant varieties and sixteen drought-sensitive varieties (see Appendix-A for details) were initially selected according to their wilting degradation, and seedling height after drought treatment (some seedlings showed irreversible wilting), during the 3 leaves unfolded main shoot stage (GS13; Zadok’s scale). The selected varieties were planted in seedling trays, in the greenhouse, and the drought treatment and control groups were set up. For the control group, a normal field management protocol was used, according to conventional cultivation management technology. Five drought-tolerant and drought-sensitive varieties (see Appendix-B for details) were identified according to their seedling height, root fresh weight, shoot fresh weight, root dry weight, and shoot dry weight after the drought treatment. The most drought-tolerant (Jingmai 12, Crop Germplasm Resources Conservation Bank of Yunnan Province) and moisture-sensitive (Pimai, Kaiyuan) varieties were selected as test materials according to their seedling height, whole seedling fresh weight, whole seedling dry weight, total root length, total root surface area, total root volume, and average root diameter (see Appendix-C for details).
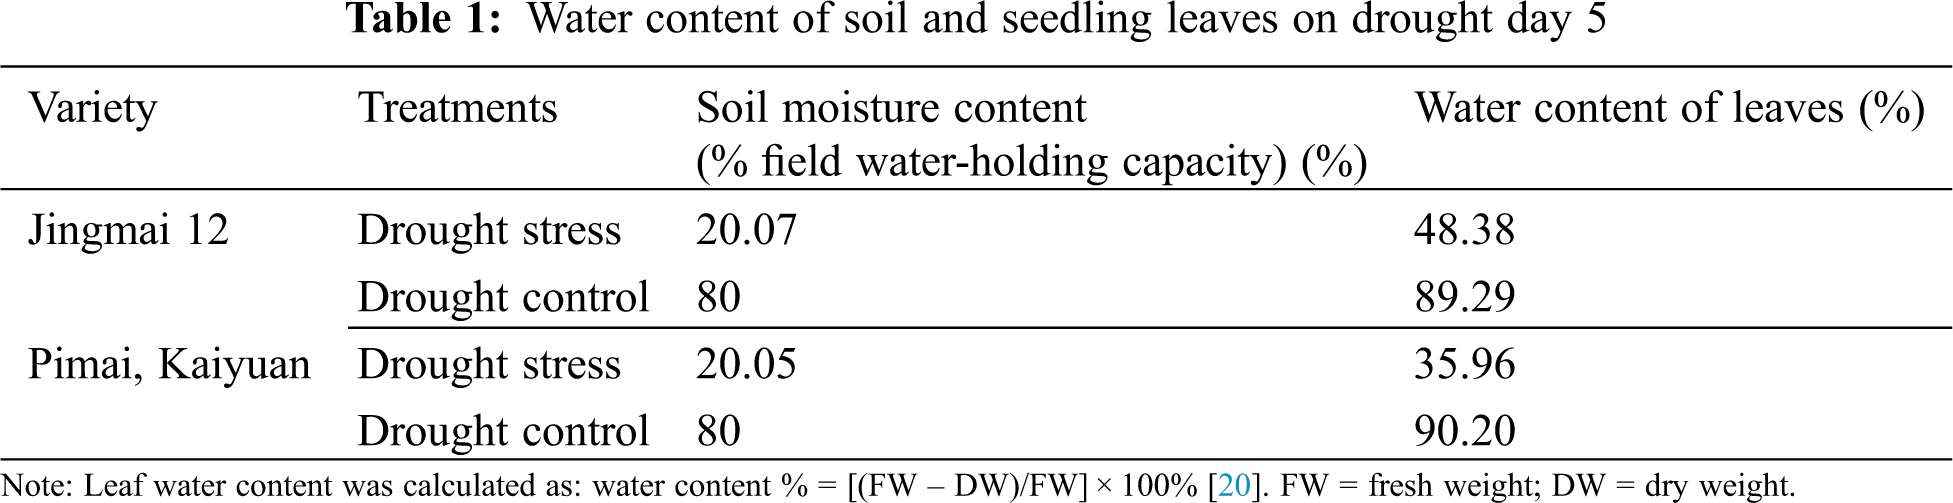
Uniform, full, intact seeds were selected for each of the two varieties, sterilized with 0.2% HgCl2 (All-Style Gold Biotechnology Co., Beijing, China), and placed in a light incubator at a constant temperature (25°C) until dew white. Fifty seeds were planted evenly in the seedling tray of a rain shelter (average temperature: ~25°C, low humidity, sunlight duration 6–8 h). A mixture of nutrient-rich soil [organic matter molecular mass: 45; N + P4O10 + K2O ≥ 5.0; water mass fraction (fresh sample) ≤ 30 PLEASE ADD UNITS TO THESE VARIABLES; PH 5.5–8.5] and sand (1:3) was used as a cultivation medium, with one hole per seedling. The ground was covered with oil paper to prevent root entry, and was watered normally during growth; the soil moisture content was maintained at approximately 80% of the field water-holding capacity. Seedlings were selected at the stage when the first tiller appeared on the main shoot (GS21; Zadok’s scale), with uniform growth, and re-watered after 5 d of drought stress (see Tab. 1 for details on drought conditions). A normal, water-managed group of seedlings was used as control.
2.2 Material Selection and Sample Collection
The leaves of the two varieties were sampled in triplicate from the treatment and control groups, after 5 d of drought and 5 d of re-watering. The morphological and physiological indexes of the two cultivars were determined, and transcriptome sequencing was carried out on the drought-tolerant variety Jingmai 12. For sequencing, leaves were cut from the seedlings in trays, stored in tubes, and frozen in liquid nitrogen. Sampling was performed in triplicate, and a total of 12 samples were prepared for sequencing.
2.3 Determination of Morphological and Physiological Indexes
Sampling was performed in triplicate for each index, to determine seedling height, root dry weight, shoot dry weight, and root morphology (including primary rooting number, total root length, average root diameter, total root volume, and total root surface area). A Vernier caliper was used to measure the seedling height as the distance from the base of the seedling to the tip of the uppermost spreading leaf. The root morphology indexes were measured using the Microtek i800 plus (WinRhizo-2 professional analysis software; https://regentinstruments.com/assets/references.html#winrhizo). The seedlings were divided into two parts: shoot (stem and leaf) and root. The seedlings were deactivated at 110°C for 30 min and dried to a uniform weight at 80°C. The dry weight was measured to obtain the root-shoot ratio. The physiological indexes, including abscisic acid, proline, chlorophyll, malondialdehyde, peroxidase, catalase, superoxide dismutase, soluble protein, soluble sugar, and total antioxidant capacity, were measured with an enzyme-linked immunosorbent assay kit (All-Style Gold Biotechnology Co., Beijing, China).
2.4 RNA Extraction, Library Construction, and Transcriptome Sequencing
Leaves were harvested and ground into powder in liquid nitrogen. Total RNA was extracted with the Easy Pure Plant RNA Kit (All-Style Gold Biotechnology Co., Beijing, China). Library construction, sequencing, and assignment of accession numbers were performed by Shenzhen Huada Gene Technology Co., Shenzhen, China. Total RNA was processed with mRNA enrichment or the rRNA removal method. The RNA was then fragmented with interrupting buffer, and reverse transcribed with random N6 primers, and cDNA duplex (TransScript® First-Strand cDNA Synthesis SuperMix; All-Style Gold Biotechnology Co., Beijing, China) was synthesized to form double-stranded DNA. The end of the synthesized double-stranded DNA was complemented and phosphorylated at the 5′ end to form a sticky end with a protruding “A” at the 3′ end, or a “T” blistered joint. The final ligated product was amplified by polymerase chain reaction (PCR) using specific primers, and PCR products were heat-denatured into single strands. The single-stranded DNA was cyclized using a section of bridge primers to obtain a single-stranded circular DNA library for sequencing.
2.5 Data Quality Control and Transcript Assembly
Reads containing connectors and unknown base N content, and low-quality reads were removed using the filtering software SOAPnuke v1.4.0 [21] (parameters: -l 5 -q 0.5 -n 0.1) and Trimmomatic v0.36 [22] (parameters: illuminaclip:2:30:10 leading:3 trailing:3 slidingwindow:4. 15 minlen:50) (http://www.usadellab.org/cms/?page=trimmomatic).
StringTie v1.0.4 [23] (parameters: -f 0.3 -j 3 -c 5 -g 100 -s 10000 -p 8; http://ccb.jhu.edu/software/stringtie), Cufflinks v2.2.1 [24] (parameters: -p 12; http://cole-trapnell-lab.github.io/cufflinks), and CPC v0.9-r2 [25] (parameters: default parameters; http://cpc2.cbi.pku.edu.cn) were used for transcriptome assembly by first comparing reads to the reference genome [26] (Chinese_Spring_v1.1_20181018; URGI; RefSeq Annotations v1.1; http://www.wheatgenome.org/). Then, the regions were compared to construct a connection map of all possible transcripts. Lastly, the lines of the connection map were used to assemble the overlapping reads into multiple transcripts.
2.6 Gene Annotation and Identification of Differentially Expressed Genes (DEGs)
Once transcripts were obtained, new transcripts with protein-coding potential were added to the reference gene sequence to form the complete reference sequence. The clean reads were compared to the reference genome using Bowtie2 [27] and then RSEM v1.2.8 [28] (parameters: default; http://deweylab.biostat.wisc.edu/rsem/ and http://rsem-calculate-expression.html) to calculate the expression of genes and transcripts. The genes were compared to the PRGdb database v2.0 [29] (http://prgdb.crg.eu/) using the comparison software for annotation. Finally, DEGs were detected between samples according to the method described by Wang et al. [30]. The selection criteria for DEGs were log2 fold change ≥ 1 or ≤ −1 and false discovery rate (FDR) with a Q-value of 0.001. Pearson’s correlation coefficients were calculated for gene expression between sample pairs using the Cor function in R software (https://www.r-project.org/), and these coefficients were displayed as a heatmap for principal component analysis (PCA). Venn plots were drawn based on the set expression thresholds.
2.7 Gene Ontology (GO), Kyoto Encyclopedia of Genes and Genomes (KEGG), and Mapman Analyses
DEGs were functionally classified according to GO and KEGG pathway annotation results and official classifications, and enrichment analysis was performed using the phyper function of the R software. The P-value was calculated according to
where N is the number of genes with KEGG annotation in all genes, n is the number of different genes in N, M is the number of genes in a KEGG pathway in N, and m is the number of differentially expressed genes in a KEGG pathway in M.
FDR correction was then applied to the P-value, and a q-value ≤ 0.05 was considered significantly enriched for the function [31]. GO enrichment of DEGs was assessed using the agriGO analysis tool [32]. Metabolic and gene regulatory network(s) for drought tolerance were generated using MapMan v 3.6.0RC1 [33]. Metabolism and gene categories were generated using DEGs with fold change ≥ 2.0 or ≤ −2.0.
All experiments were performed in triplicate and repeated at least twice. Data are represented as arithmetic mean ± SD. To test the statistically significant difference between the treatments, one way-analysis of variance (ANOVA) was carried out followed by Tukey’s post-hoc test using SPSS 25.0 software. For all the analyses, a p value less than 0.05 was considered statistically significant.
3.1 Analysis of Variance of Morphological and Physiological Indexes between Varieties and Treatments
Under drought stress, the morphology and physiology of the two wheat varieties showed different degrees of change. There were significant differences between the two cultivars in seedling height, shoot dry weight, root dry weight, root-shoot ratio, total root length, average root diameter, total root volume, and total root surface area (P < 0.05). However, there were no significant differences in primary root number (P > 0.05). There were significant differences between the treatment and control groups in shoot dry weight, root-shoot ratio, average root diameter, and total root volume (P < 0.05), whereas seedling height, primary root number, total root length, and total root surface area showed no significant differences (P > 0.05). The shoot dry weight, root dry weight, root-shoot ratio, total root length, average root diameter, total root volume, and total root surface area in the interaction cultivars and treatments were significantly different (P < 0.05), while seedling height and primary root number showed no significant differences (P > 0.05) (Tab. S1).
Catalase (CAT), peroxidase (POD), superoxide dismutase (SOD), total antioxidant capacity (TAC), soluble sugar (SS), soluble protein (SP), and chlorophyll (CHL) content differed significantly between the cultivars (P < 0.05). Malondialdehyde (MDA), proline (PRO), and ABA were not significantly different (P > 0.05). CAT, POD, SOD, PRO, TAC, SS, and CHL differed significantly in the different treatments (P < 0.05), whereas MDA, ABA, and SP were not significantly different (P > 0.05). CAT, POD, SOD, MDA, PRO, TAC, SP, SS, and CHL in the interaction cultivars and treatments were significantly different (P < 0.05), but there was no significant difference in ABA (Tab. S2).
3.2 Morphological and Physiological Responses to Drought
The response of the two varieties to drought stress was tested through the analysis of multiple indexes. Under the influence of drought, the growth indexes of both varieties changed considerably. Compared with the control, all indicators decreased approximately 1.5-fold, but the seedling height of the Pimai (Kaiyuan) variety decreased approximately 2.3-fold. Under drought conditions, all tested indexes of Jingmai 12 were more than twice those of Pimai (Kaiyuan), and the total root volume was 4-fold greater. Jingmai 12 plants were relatively less affected by drought and showed a better performance in various growth indexes. After re-watering, Jingmai 12 recovered quickly, but the injury to Kaiyuan seedlings tended to become further aggravated after 5 days of re-watering. Therefore, Jingmai 12 had better morphological conditions to resist drought stress at the seedling stage (Tab. 2 and Fig. S1).

Similarly, the analysis of physiological indexes showed that Jingmai 12 displayed a better enzyme activity (up to 1.5-fold higher than Kaiyuan), higher content of osmotic regulating substances (more than twice those on Kaiyuan), and a slower decline in chlorophyll content (up to 1.9-fold slower than that of Kaiyuan) under drought stress and rehydration (Tab. 3 and Fig. S2). Thus, Jingmai 12 had a greater ability to resist drought stress and recover after rehydration than Kaiyuan. Jingmai 12 showed a stronger root system under drought stress (Fig. S3), and its morphological characteristics recovered significantly better upon re-watering compared with those of the drought-sensitive varieties (Fig. S4). Taken together, our results showed that Jingmai 12 could better withstand and recover from adverse conditions than the drought-sensitive variety.

3.3 Summary of Sequencing Data
A total of 12 samples were tested, with an average output of 10.95 GB. A total of 97,422 genes were detected: 80,373 known genes and 17,049 predicted genes. Genes with fragments per kilobase of exon model per million reads mapped (FPKM) values < 1.0 accounted for 52% of the total genes, those with FPKM of 1.0–10.0 accounted for 36%, and those with FPKM > 10.0 accounted for 12%. The average comparison rate with the genome was 87.79%, the average comparison rate with the gene set was 79.39%, and Q30 was 86.16%, showing reliable quality (Tab. 4). Principal components analysis (PCA) can be used to compare samples, and it is convenient for finding outliers and identifying clusters with high similarity. On the whole, the samples subjected to different treatment conditions differed significantly and there was good repeatability. However, there were large differences among the three re-watered samples and the reproducibility was relatively poor. However, this did not greatly affect the subsequent results (Fig. 1). Based on a representative heatmap of 100 expressed genes (Fig. S5), the three samples under drought stress were very different from the other nine samples. The re-watered sample and the control group were gathered together, with a very similar pattern, indicating that the expression of many genes in the re-watered group had returned to normal.

Figure 1: Principal component analysis (PCA) of 12 sequenced samples based on transcriptome data. Dro_control, drought treatment controls; Re_control, rehydration treatment controls; Re_water, rehydration treatment samples

3.4 GO and KEGG Pathway Analyses
In the drought vs. drought control group, the cellular component comprised the largest number of genes (45,213), involving 15 GO functional categories including 11,879 cells (26.27%), 8,496 organelles (18.79%), and 7916 membranes (17.51%). In the biological processes, there were 33,826 genes, in 21 GO functional categories, including 9,588 cellular processes (29.14%), 9,342 metabolic processes (27.62%), and 3,330 biological regulation (9.84%). Lastly, there were 26,197 genes involved in molecular functioning across 14 GO functional categories, including 11,152 catalytic activities (42.57%), 10,979 binding (41.91%), and 1,595 transporter activities (6.11%) (Tab. S3).
In the rehydration vs. rehydration control group, there were 23,784 cellular component genes across 15 GO functional categories, 18,594 biological process genes in 21 GO functional categories, and 14,642 molecular function genes in 15 GO functional categories. Among the cellular components, the distribution was: cell 6,396 (26.89%), organelle 4,496 (18.90%), and membrane 4,164 (17.51%). In the biological processes, there were 5,344 cellular processes (28.74%), 5,085 metabolic processes (27.35%), and 1,842 biological regulation (9.91%). Among the molecular functions, there were 6,211 catalytic activities (42.42%), 6,115 binding (42.4%), and 912 transporter activities (6.23%) (Tab. S4).
In the KEGG pathway annotation of our classification and enrichment analysis, there were a total of 6 categories, 21 subcategories, and 134 metabolic pathways. The top three genes in the drought vs. drought control group (Fig. S6A) were Ribosome/ko03010, Endocytosis/ko04144, and Carbon metabolism/ko01200. The significant pathway was photosynthesis-antenna proteins/ko00196. The top three pathways with the most enriched genes in the rehydration vs. rehydration control group (Fig. S6B) were the MAPK signaling pathway/ko04016, ribosome/ko03010, biosynthesis of amino acids/ko01230, and carbon metabolism/ko01200. The notable pathways were photosynthesis-antenna proteins/ko00196 and lysine biosynthesis/ko00300.
3.5 Screening and Analysis of DEGs
We analyzed DEGs among three groups (Fig. 2): drought vs. drought control with 15,913 differentially expressed drought-resistant response genes; rehydration vs. drought with 14,235 differentially expressed rehydration response genes; and rehydration vs. rehydration control with 14,920 DEGs. Fig. 3 shows the overlap among the identified DEGs.

Figure 2: Histograms of the number of differentially expressed genes in the different groups. Drought vs. Dro_control, the number of differentially expressed genes in drought and its control; Re_water vs. Drought, the number of differentially expressed genes after rehydration and during drought; Re_water vs. Re_control, the number of differentially expressed genes after rehydration and its control

Figure 3: Intergroup venn diagram of differentially expressed genes
Genes for inducible and long-acting responses were screened (a total of 9,099 genes [2,421 + 6,678]), and the proportion of genes involved in the drought response was relatively high (57.18%). A total of 3,757 long-acting genes were screened, and the proportion of genes involved in the drought response was low (~23.61%).
3.6 Identification of Inducible and Long-Acting DEGs
A total of 9,099 candidate inducible response genes and 3,757 long-acting response genes were analyzed (Fig. S7). Most of the genes were expressed in the opposite direction in drought induction and rehydration. There were 8,966 (98.54%) inducible response genes, which indicated that the identified induced response genes accounted for 56.34% of the total drought resistance response genes, and the rehydration process restored back to normal the expression of many drought-resistance genes. There were 3,718 long-acting response genes, accounting for 23.34% of the drought-resistant response genes, indicating that many of these genes may still play a role after rehydration (see Appendix-D for details).
3.7 AgriGO Categorization and Mapman Analysis
Focusing on the identified drought stress-inducible genes, 8,966 inducible response genes were analyzed for GO term enrichment. The 20 most notable results are shown in Tab. S5. Among the up-regulated genes, the most affected groups were the catalytic activity, single-organism metabolic process, single-organism process, oxidoreductase activity, and response to water, whereas among the down-regulated genes, they included the catalytic activity, photosynthesis, metabolic processes, photosynthetic membranes, and thylakoids groups.
Fig. 4A shows the level of enrichment of up-regulated, inducible response genes. Many pathways were significantly up-regulated in response to drought stress, including the Responses to water, inorganic substance, acid chemical, and abiotic stimulus. Resistance to drought may involve the metabolism of small molecules, increased osmotic potential, redox processes, enhanced clearance of active oxygen, carbohydrate metabolism, and energy-consuming replenishment processes. In the down-regulated group (Fig. 4B), Photosynthesis, Phosphorylation, Macromolecule modification, and Glycine metabolic process were significantly down-regulated.

Figure 4: Significant gene ontology (GO) terms among differentially expressed genes. (A) represents the up-regulated genes and (B) the down-regulated genes. Redder color represents a higher enrichment. The P-value indicates the significant level of enrichment
MapMan was used to analyze drought response genes. As shown in Fig. 5, in the drought vs. drought control group, the four pathways with the greatest up-regulation were photosynthesis, lipid metabolism, hormones, and cell wall (Fig. 5A). In the rehydration vs. rehydration control group, many of the metabolic pathways involved were restored (Fig. 5B). Other functions, such as transmembrane transport, lipid metabolism, carbon metabolism, amino acid synthesis, small molecule production, peroxides, hormones, and other substances (cytotaxins, ethylene), also changed at varying degrees.


Figure 5: MapMan pathway analysis of inductive genes. (A) represents the drought treatment, and (B) represents the re-watering treatment. Blue and red indicate downregulation and upregulation, respectively
After rehydration (Fig. 6), there were fewer long-acting response genes involved in metabolic processes than in the drought stress group. There were significant increases in hormones, cellular respiration, oxidative phosphorylation, cytochrome c oxidase complex, lipid metabolism, and lipid body-associated activities, carbohydrate metabolism, starch and amino acid metabolism, glutamate family, glutamate-derived amino acids, and proline. There were significantly down-regulated genes involved in cell wall organization including cell wall proteins, expansin activities, hemicellulose, xyloglucan, pectin, modification and degradation, hemicellulose, heteromannan biosynthesis, cutin, and suberin.

Figure 6: MapMan pathway analysis of long-term effect genes in rehydration conditions. Blue and red indicate downregulation and upregulation, respectively
Drought negatively affects crop growth and yield. To adapt to soil drought, plants change their physiology and regulate the process of tissue osmosis to actively maintain their physiological water balance. They may change root growth and structure, and reduce water loss by increasing absorption of soil water and closing stomata [34]. This is consistent with the changes observed in some morphological and physiological indices measured in the present study. We found that drought stress had less effect on wheat varieties with strong drought resistance. The ability to recover after rehydration was also stronger in the Jingmai 12 strain than in the drought-sensitive control variety.
Our findings on changed patterns of gene expression, and related pathways, suggests that through the transition from growth-oriented to being in water shortage crisis, physiological growth-related processes are seriously affected. Within this adaptation process is the weakening of the photosynthetic pathway, which leads to a blocked energy supply, no additional storage, and limited available energy, with existing storage being used to improve resistance by increasing ABA content, producing osmotic regulators, enhancing protective enzyme activity, enhancing ROS scavenging, and improving membrane protein protection. These resistance-response processes are detrimental to plant growth. However, during rehydration, these processes change rapidly and the plants soon return to normal growth as genes involved in this process also quickly return to normal levels, presumably to remove growth restrictions.
Induced response genes, whose expression is transiently changed by drought conditions, return to normal levels soon after re-watering. They have a great influence on the growth process. However, long-acting response genes may not significantly change their expression by watering after being induced by drought stress; they may show some hysteresis that contributes to their rapid response to new drought stress conditions.
WRKY [35], MYB/MYC [36,37], NAC [16], bHLH [38], and other transcription factors have been shown to play an important role in drought response. Our results showed that these transcription factors were specifically expressed under drought stress. WRKY, MYB/MYC, and NAC were the most highly up-regulated inducible genes, whereas bHLH and MYB were the most down-regulated. Among the drought-induced genes, drought-resistant genes, and related genes that are directly or indirectly involved in wheat are: aldehyde dehydrogenase, ABA responsive element binding factor (ABF) [39], xanthoxin dehydrogenase (ABA2) [40], aldehyde dehydrogenase, ALDH7A1/ALDH18A1 [41], cell autophagy related genes (TdAtg8) [42], ubiquinol oxidase (AOX1/AOX2) [43], H+ transporters, F-box and leucine-rich repeat protein (FBXL), plant G-box-binding factor (GBF) [44], glutathione S-transferase [5], jasmonate ZIM domain-containing protein (JAZ) [44], threonine protein kinase (SNRK2) [40,45], histone (H2A/H2B) [46,47], auxin-responsive protein IAA (IAA) [48], regulator AP2-EREBP [49], lipoxygenase (LOX) [3], protein phosphatase 2C (PP2C) [50], was-ester synthase/diacylglycerol O-acyltransferase (WSD), glutathione peroxidase (GPX) [51], zeaxanthin epoxidase (ZEP), light capture complex I and chlorophyll a/b binding proteins in complex II (LHCA and LHCB), MAPK related to protein kinase signal, zinc finger proteins 96, and plant hormone signal transduction (G2-like).
After experiencing drought stress, in the short term, plants are better able to adapt to the same threat; a typical example are acclimatization seedlings, which may rely on the fact that some resistance-response genes delay recovery or continue to function after rehydration. When the plant is dehydrated again, it has higher resistance because it can mobilize resistance genes faster [52]. Among the long-acting genes, the important transcription factors involved are the same as those induced, and the related genes play a crucial role after the induced genes expression is restored.
Drought stress reduces the photosynthetic activity of plants, photosynthetic rate, stomatal conductance, transpiration rate, total antioxidant potential, and activities of carbohydrate metabolic enzymes and hence energy supply. This occurs through a change in the chlorophyll content, resulting in an overall growth retardation [53]. Light-harvesting complex (LHC) proteins are a class of pigment proteins that can capture light energy and rapidly transmit it to the reaction center to cause photochemical reactions. They play an important role in the absorption and transmission of light energy, in maintenance of membrane structure, and adaptation to environmental changes [54]. In this study, LHC pigment protein-related genes were not found to be long-acting, but there were several LHC protein-related genes (154 in total) in the down-regulated group. In the up-regulated group, a large number of ferredoxin-, PSB-, and H2B-related genes were found, indicating that these protein families may be involved in wheat drought resistance.
ABA, auxin (IAA), cytokinin (CTK), and jasmonic acid (JA) are typical plant hormones that play important roles in signal transduction. ABA, in particular, is a central regulator of water use, directly regulating stomatal opening and transpiration, and regulating abiotic stress [55]. In this study, positive protein kinase regulatory factor (SnRK2) was up-regulated in the process of ABA signal transduction, which is conducive to ABA synthesis. Some inducible genes for ABF transcription factors were also up-regulated, but there were significantly more in the long-acting gene group and the inducible down-regulated group. In the CTK transduction process, the expression of phosphotransferase (AHP) and response regulator (A-ARR) were up-regulated, which was beneficial for CTK synthesis. Lipoxygenase (LOX) is a key enzyme that catalyzes the JA biosynthesis [56], and a large number of LOX-related genes were expressed among the inducible genes. There were also a large number of jasmonate ZIM domain-containing proteins and IAA-responsive protein-related genes among the inducible up-regulated genes.
Genes involved in amino acid and carbohydrate metabolisms, and ascorbic acid-glutathione, and flavonoid metabolisms are up-regulated in response to dehydration stress. Drought resistance and the accumulation of protective metabolites, ascorbic acid, and glutathione, enhance the Krebs cycle, increase polyamine synthesis and the metabolism of flavonoids. This helps to improve osmotic regulation, oxidation resistance, pressure signal transduction, and energy production with defense purposes, maintaining a steady metabolism under the pressure of dehydration [57]. Expansin protein (TaEXPB) is a component of the cell wall and a key regulator of cell wall expansion during plant growth. Plant hormones regulate the expression of expansin genes and plant growth under drought stress, and are involved in the cell elongation and drought resistance response of wheat [58]. Studies have also found that the autophagy gene in wheat seedlings is related to drought resistance [59].
TCA (ko00020) is the hub of carbohydrate, lipid, and amino acid metabolisms, which is specifically expressed in both up-regulated and down-regulated genes. Others include the ascorbic and uronic acid metabolisms, carbohydrate metabolism (ko00053), fatty acid synthesis (ko00061), fatty acid degradation (ko00071), photosynthetic energy metabolism (ko00195), carbon fixation in the photosynthetic organism energy metabolism (Ko00710), arginine biosynthesis (ko00220), glutamic and alanine metabolisms (ko00250), serine and threonine metabolisms (ko00260), valine, leucine, and isoleucine biosynthesis (ko00290), arginine and proline metabolisms (ko00330), glutathione (ko00480), starch and sucrose (carbohydrate) metabolisms (ko00500), flavonoid biosynthesis, and other secondary metabolites biosynthesis (ko00941), autophagy—other transport and catabolism (ko04136), MAPK signaling pathway—plant signal transduction, and phosphatidylinositol signaling system signal transduction (ko04070). This indicates that there may be a certain relationship between the above-mentioned metabolic processes and drought resistance of wheat seedlings.
Each of these genes will, in some way, affect and regulate various metabolic pathways to adapt to drought stress. This mechanism is also the result of natural selection, allowing plants to adapt to frequent droughts by cost saving. In this study, we focused on drought-induced genes and paid less attention to long-acting response genes. This will be a future topic of research into resistance to stress in wheat seedlings, the main pathways involved, the differences between them and the induced response genes, and whether they can be reasonably explained. In the future, we will further identify and analyze these genes, and investigate their specific response mechanisms when plants are exposed to drought stress and rehydration treatments. The differences that were shown in the physiological and morphological measurements between drought controls and after re-watering may be a response that plants (Dro-controls) received a constant amount of water, while after re-watering, the (Re-control) group received water abundance. Meanwhile, no significant difference between the Dr-control and Re-controls were observed at the transcriptomic level. Moreover, another limitation of this study was that only changes during the wheat seedling stage were addressed. We will study the drought-resistant response of drought-resistant materials in different growth stages, and further verify the function of possible drought-resistant genes, in a future study.
The Jingmai 12 and Pimai (Kaiyuan) exhibited a different response to drought stress. Compared with the drought-sensitive wheat variety Pimai (Kaiyuan), the drought-resistant wheat variety Jingmai 12 showed a lower reduction in the root index and absorbed more water through its root system penetrating into the soil. Additionally, compared to Pimai (Kaiyuan), Jingmai 12 exhibited a (1) higher root-to-shoot ratio, (2) greater dry matter accumulation, (3) higher enzyme activity, (4) higher content of osmosis-regulating substances and hormones, (5) lower rate of chlorophyll content decrease, (6) stronger ability to clear harmful substances and (7) maintenance of normal physiological metabolism under drought as an adaptation to this stress. Under drought stress, the metabolic pathways with the most significant changes included photosynthesis, lipid metabolism, hormone release, carbon metabolism, amino acid synthesis, small molecule production, transmembrane transport, signal transduction, and protective enzyme activities. Our results suggest that all of these changes are adaptations to drought stress. Through morphological adaptation, physiological regulation, and the expression of drought-induced genes, normal growth of drought-resistant varieties under drought stress can be promoted. Our results also indicated that this particular landrace Jingmai 12 could be used as a gene donor to improve the drought resistance of bread wheat varieties.
Acknowledgement: This work was supported by the China Yunnan Provincial Agricultural Foundation Joint Special Key Project (2018FG001-005) and Yunnan Province Academician Workstation (2019IC006). The research materials were provided by the Institute of Biotechnology and Germplasm Resources, Yunnan Academy of Agricultural Sciences. We would like to thank Editage (https://www.editage.cn) for English language editing.
Funding Statement: This research was funded by the China Yunnan Province Agriculture Joint Key Project (2018FG001-005) and Yunnan Academician Workstation (2019IC006).
Conflicts of Interest: The authors declare that they have no conflicts of interest to report regarding the present study.
1. Qiu, Z., Li, Y., Li, J., Zhang, L. (2017). Physiological and transcriptome analysis of He-Ne laser pretreated wheat seedlings in response to drought stress. Scientific Reports, 7(1), 6108. DOI 10.1038/s41598-017-06518-z. [Google Scholar] [CrossRef]
2. Hu, L., Xie, Y., Fan, S. J. (2018). Comparative analysis of root transcriptome profiles between drought-tolerant and susceptible wheat genotypes in response to water stress. Plant Science, 272, 276–293. DOI 10.1016/j.plantsci.2018.08.010. [Google Scholar] [CrossRef]
3. Kumar, J., Gunapati, S., Kianian, S. F., Singh, S. P. (2018). Comparative analysis of transcriptome in two wheat genotypes with contrasting levels of drought tolerance. Protoplasma, 255(5), 1487–1504. DOI 10.1007/s00709-018-1237-x. [Google Scholar] [CrossRef]
4. Al, K. W., Al, S. A., Schroeder, D., Musallan, I. (2017). Phenotypic and molecular variation in drought tolerance of Jordanian durum wheat (Triticum durum Desf.) landraces. Physiology & Molecular Biology of Plants, 23(2), 311–319. DOI 10.1007/s12298-017-0434-y. [Google Scholar] [CrossRef]
5. Qiu, Z., He, Y., Zhang, Y., Guo, J., Wang, L. (2018). Characterization of miRNAs and their target genes in He-Ne laser pretreated wheat seedlings exposed to drought stress. Ecotoxicology & Environmental Safety, 164, 611–617. DOI 10.1016/j.ecoenv.2018.08.077. [Google Scholar] [CrossRef]
6. Faghani, E., Javad, G., Setsuko, K., Mehdi, M., Ramzan, A. K. et al. (2015). Comparative physiology and proteomic analysis of two wheat genotypes contrasting in drought tolerance. Journal of Proteomics, 114, 1–15. DOI 10.1016/j.jprot.2014.10.018. [Google Scholar] [CrossRef]
7. Gupta, S., Agarwal, V. P., Gupta, N. K. (2012). Efficacy of putrescine and benzyladenine on photosynthesis and productivity in relation to drought tolerance in wheat (Triticum aestivum L.). Physiology & Molecular Biology of Plants, 18(4), 331–336. DOI 10.1007/s12298-012-0123-9. [Google Scholar] [CrossRef]
8. Mamenko, T. P., Iaroshenko, O. A. (2009). Effect of salicylic acid on water potential, ethylene secretion and activity of antioxidative processes in the winter wheat leaves under drought conditions. Ukains’kyi Biokhimichmyi Zhurnal, 81(2), 117–124. https://www.ncbi.nlm.nih.gov/pubmed/19873885. [Google Scholar]
9. Abid, M., Ali, S., Qi, L. K., Zhoor, R., Tian, Z. et al. (2018). Physiological and biochemical changes during drought and recovery periods at tillering and jointing stages in wheat (Triticum aestivum L.). Scientific Reports, 8(1), 4615. DOI 10.1038/s41598-018-21441-7. [Google Scholar] [CrossRef]
10. Hikmet, B., Babarr, H., Zaeema, K., Ozturk, N. Z. (2015). From genetics to functional genomics: Improvement in drought signaling and tolerance in wheat. Frontiers in Plantence, 6, 1012. DOI 10.3389/fpls.2015.01012. [Google Scholar] [CrossRef]
11. Akdogan, G., Tufekci, E. D., Uranbey, S., Unver, T. (2016). Mirna-based drought regulation in wheat. Funct Integr Genomics, 16(3), 221–233. DOI 10.1007/s10142-015-0452-1. [Google Scholar] [CrossRef]
12. Bakhshi, B., Fard, E. M., Gharechahi, J., Safarzadeh, M., Nikpay, N. et al. (2017). The contrasting microRNA content of a drought tolerant and a drought susceptible wheat cultivar. Journal of Plant Physiology, 216, 35–43. DOI 10.1016/j.jplph.2017.05.012. [Google Scholar] [CrossRef]
13. Xin, H., Feng, Q. (2012). Transcription factors involved in environmental stress responses in plants. Environmental Adaptations & Stress Tolerance of Plants in the Era of Climate Change, 13, 279–295. DOI 10.1007/978-1-4614-0815-4-13. [Google Scholar] [CrossRef]
14. Gao, S. Q., Chen, M., Xia, L. Q., Xiu, H. J., Xu, Z. S. et al. (2009). A cotton (Gossypium hirsutum) DRE-binding transcription factor gene, GhDREB, confers enhanced tolerance to drought, high salt, and freezing stresses in transgenic wheat. Plant Cell Reports, 28(2), 301–311. DOI 10.1007/s00299-008-0623-9. [Google Scholar] [CrossRef]
15. Cai, H., Tian, S., Liu, C., Dong, H. (2011). Identification of a MYB3R gene involved in drought, salt and cold stress in wheat (Triticum aestivum L. ). Gene, 485(2), 146–152. DOI 10.1016/j.gene.2011.06.026. [Google Scholar] [CrossRef]
16. Huang, Q. J., Wang, Y., Li, B. (2015). TaNAC29, a NAC transcription factor from wheat, enhances salt and drought tolerance in transgenic Arabidopsis. Bmc Plant Biology, 15(1), 268. DOI 10.1186/s12870-015-0644-9. [Google Scholar] [CrossRef]
17. Chen, D., Chai, S., Mcintyre, C. L., Xue, G. P. (2018). Overexpression of a predominantly root-expressed NAC transcription factor in wheat roots enhances root length, biomass and drought tolerance. Plant Cell Reports, 37(2), 225–237. DOI 10.1007/s00299-017-2224-y. [Google Scholar] [CrossRef]
18. Li, X. Y., Feng, B., Zhang, F. J., Tang, Y. M., Zhang, L. P. et al. (2016). Bioinformatic analyses of subgroup-a members of the wheat bZIP transcription factor family and functional identification of TabZIP174 involved in drought stress response. Frontiers in Plant Science, 7, 1643. DOI 10.3389/fpls.2016.01643. [Google Scholar] [CrossRef]
19. Gao, H. M., Wang, Y. F., Xu, P. (2018). Overexpression of a WRKY transcription factor TaWRKY2 enhances drought stress tolerance in transgenic wheat. Frontiers in Plant Science, 9, 997. DOI 10.3389/fpls.2018.00997. [Google Scholar] [CrossRef]
20. Egilla, J. N., Davies, F. T., Boutton, T. W. (2005). Drought stress influences leaf water content, photosynthesis, and water-use efficiency of hibiscus rosa-sinensis at three potassium concentrations. Photosynthetica, 43(1), 135–140. DOI 10.1007/s11099-005-5140-2. [Google Scholar] [CrossRef]
21. Chen, Y., Chen, Y., Shi, C., Huang, Z., Zhang, Y. et al. (2018). SOAPnuke: A mapReduce acceleration-supported software for integrated quality control and preprocessing of high-throughput sequencing data. GigaScience, 7(1), 1–6. DOI 10.1093/gigascience/gix120. [Google Scholar] [CrossRef]
22. Bolger, A. M., Marc, L., Bjoern, U. (2014). Trimmomatic: A flexible trimmer for Illumina sequence data. Bioinformatics, 15, 2114–2120. DOI 10.1093/bioinformatics/btu170. [Google Scholar] [CrossRef]
23. Pertea, M., Pertea, G. M., Antonescu, C. M., Chang, T. C., Mendell, J. T. et al. (2015). StringTie enables improved reconstruction of a transcriptome from RNA-seq reads. Nature Biotechnology, 33(3), 290–295. DOI 10.1038/nbt.3122. [Google Scholar] [CrossRef]
24. Ghosh, S., Chan, C. (2016). Analysis of RNA-seq data using topHat and cufflinks. Methods in Molecular Biology, 1374, 339–361. DOI 10.1007/978-1-4939-3167-5-18. [Google Scholar] [CrossRef]
25. Carlevaro-Fita, J., Rahim, A., Vardy, L. A., Johnson, R. (2016). Cytoplasmic long noncoding RNAs are frequently bound to and degraded at ribosomes in human cells. RNA, 22(6), 1–16. DOI 10.1261/rna.053561.115. [Google Scholar] [CrossRef]
26. Pingault, L., Choulet, F., Alberti, A., Glover, N., Wincker, P. et al. (2015). The libraries are described in: Deep transcriptome sequencing provides new insights into the structural and functional organization of the wheat genome. Genome Biology, 16(2), 29. DOI 10.1186/s13059-015-0601-9. [Google Scholar] [CrossRef]
27. Langmead, B. (2012). Fast gapped-read alignment with Bowtie 2. Nature Methods, 9(4), 357–359. DOI 10.1038/nmeth.1923. [Google Scholar] [CrossRef]
28. Li, B., Dewey, C. N. (2011). RSEM: Accurate transcript quantification from RNA-seq data with or without a reference genome. BMC Bioinformatics, 12(1), 323–323. DOI 10.1186/1471-2105-12-323. [Google Scholar] [CrossRef]
29. Sanseverino, W. (2010). PRGdb: A bioinformatics platform for plant resistance gene analysis. Nucleic Acids Research, 38(Database issue), D814–D821. DOI 10.1093/nar/gkp978. [Google Scholar] [CrossRef]
30. Wang, L. K., Feng, Z. X., Wang, X., Wang, X. W., Zhang, X. G. (2010). DEGseq: An R package for identifying differentially expressed genes from RNA-seq data. Bioinformatics, 26(1), 136–138. DOI 10.1093/bioinformatics/btp612. [Google Scholar] [CrossRef]
31. Berkopec, A. (2007). Hyperquick algorithm for discrete hypergeometric distribution. Journal of Discrete Algorithms, 5(2), 341–347. DOI 10.1016/j.jda.2006.01.001. [Google Scholar] [CrossRef]
32. Tian, T., Liu, Y., Yan, H. Y., Qi, Y., Xin, Y. et al. (2017). agriGOv2.0: A GO analysis toolkit for the agricultural community. Nucleic Acids Research, 45(suppl_2), W122–W129. DOI 10.1093/nar/gkx382. [Google Scholar] [CrossRef]
33. Thimm, O., Bläsing, O., Gibon, Y., Nagel, A., Meyer, S. et al. (2004). MAPMAN: A user-driven tool to display genomics data sets onto diagrams of metabolic pathways and other biological processes. Plant Journal, 37(6), 914–939. DOI 10.1111/j.1365-313X.2004.02016.x. [Google Scholar] [CrossRef]
34. Gupta, A., Andres, R. M., Cao-delgado, A. I. (2020). The physiology of plant responses to drought. Science, 368(6488), 266–269. DOI 10.1126/science.aaz614. [Google Scholar] [CrossRef]
35. El-esawi, M. A., Al-ghamdi, A. A., Ali, H. M., Ahmad, M. (2019). Overexpression of AtWRKY30 transcription factor enhances heat and drought stress tolerance in wheat (Triticum aestivum L.). Genes, 10, 2. DOI 10.3390/genes10020163. [Google Scholar] [CrossRef]
36. Li, Y. Q., Zhang, S. C., Zhang, N., Zhang, W. Y., Li, M. J. et al. (2019). MYB-Cc transcription factor, TaMYBsm3, cloned from wheat is involved in drought tolerance. BMC Plant Biology, 19(1), 143. DOI 10.1186/s12870-019-1751-9. [Google Scholar] [CrossRef]
37. Zhang, L., Song, Z., Li, F., Li, X., Yang, S. (2019). The specific MYB binding sites bound by TaMYB in the GAPCp2/3 promoters are involved in the drought stress response in wheat. BMC Plant Biology, 20(1), 566–566. DOI 10.1186/s12870-019-1948-y. [Google Scholar] [CrossRef]
38. Wang, J. Y., Hu, Z. Z., Zhao, T. M., Yang, Y. W., Chen, T. Z. et al. (2015). Genome-wide analysis of BHLH transcription factor and involvement in the infection by yellow leaf curl virus in tomato (Solanum lycopersicum). BMC Genomics, 16(1), 39. DOI 10.1186/s12864-015-1249-2. [Google Scholar] [CrossRef]
39. Qin, N., Xu, W., Hu, L., Li, Y., Hua, X. (2014). Erratum to: Drought tolerance and proteomics studies of transgenic wheat containing the maize c4 phosphoenolpyruvate carboxylase (PEPC) gene. Protoplasma, 253(6), 1513. DOI 10.1007/s00709-015-0906-2. [Google Scholar] [CrossRef]
40. Zhang, H., Mao, X., Wang, C., Jing, R. (2010). Overexpression of a common wheat gene TaSnRK2.8 enhances tolerance to drought, salt and low temperature in Arabidopsis. PLoS One, 5(12), e16041. DOI 10.1371/journal.pone.0016041. [Google Scholar] [CrossRef]
41. Chen, J., Wei, B., Li, G., Fan, R., Zhong, Y. et al. (2015). TraeALDH7B1-5A, encoding aldehyde dehydrogenase 7 in wheat, confers improved drought tolerance in Arabidopsis. Planta, 242(1), 137–151. DOI 10.1007/s00425-015-2290-8. [Google Scholar] [CrossRef]
42. Kuzuoglu-ozturk, D., Yalcinkaya, O. C., Akpinar, B. A., Mitou, G., Korkmaz, G. et al. (2012). Autophagy-related gene, tdAtg8, in wild emmer wheat plays a role in drought and osmotic stress response. Planta, 236(4), 1081–1092. DOI 10.1007/s00425-012-1657-3. [Google Scholar] [CrossRef]
43. Wu, Q., Feng, H. Q., Li, H. Y., Wan, D. S., Liang, H. G. (2006). Effects of drought stress on cyanide-resistant respiration and metabolism of reactive oxygen in wheat seedling. Journal of Plant Physiology & Molecular Biology, 32(2), 217. [Google Scholar]
44. Monika, D., Sarika, S., Sneha, T., Rao, A. R., Kishor, G. (2018). Transcriptome analysis reveals interplay between hormones, ROS metabolism and cell wall biosynthesis for drought-induced root growth in wheat. Plant Physiology & Biochemistry, 130, 482–492. DOI 10.1016/j.plaphy.2018.07.035. [Google Scholar] [CrossRef]
45. Zhang, H. Y., Li, W. (2015). Characterization of genomic sequence of a drought-resistant gene TaSnRK2.7 in wheat species. Journal of Genetics, 94(2), 299–304. DOI 10.1007/s12041-015-0505-1. [Google Scholar] [CrossRef]
46. Xu, W. J., Li, Y. C., Cheng, Z. H., Xia, G. M., Wang, M. C. (2016). A wheat histone variant gene TaH2A.7 enhances drought tolerance and promotes stomatal closure in Arabidopsis. Plant Cell Reports, 35(9), 1853–1862. DOI 10.1007/s00299-016-1999-6. [Google Scholar] [CrossRef]
47. Wang, X. B., Ren, Y. Z., Li, J. J. (2019). Knock-down the expression of TaH2B-7D using virus-induced gene silencing reduces wheat drought tolerance. Biological Research, 52(1), 14. DOI 10.1186/s40659-019-0222-y. [Google Scholar] [CrossRef]
48. Dandan, C., Terese, R., Shoucheng, C., Lynne, M. C., Rae, A. L. et al. (2016). Drought-up-regulated TaNAC69-1 is a transcriptional repressor of TaSHY2 and TaIAA7, and enhances root length and biomass in wheat. Plant & Cell Physiology, 57(10), 2076–2090. DOI 10.1093/pcp/pcw126. [Google Scholar] [CrossRef]
49. Xing, L. P., Di, Z. C., Yang, W. W., Liu, J. Q., Li, M. N. et al. (2017). Overexpression of ERF1-v from Haynaldia villosa can enhance the resistance of wheat to powdery mildew and increase the tolerance to salt and drought stresses. Frontiers in Plant Science, 8, 1948. DOI 10.3389/fpls.2017.01948. [Google Scholar] [CrossRef]
50. Yu, X. F., Han, J. P., Li, L., Zhang, Q., Yang, G. X. et al. (2020). Wheat PP2C-a10 regulates seed germination and drought tolerance in transgenic Arabidopsis. Plant Cell Reports, 39(5), 635–651. DOI 10.1007/s00299-020-02520-4. [Google Scholar] [CrossRef]
51. Cui, G., Zhao, X., Liu, S., Sun, F., Zhang, C. et al. (2017). Beneficial effects of melatonin in overcoming drought stress in wheat seedlings. Plant Physiology & Biochemistry, 118, 138–149. DOI 10.1016/j.plaphy.2017.06.014. [Google Scholar] [CrossRef]
52. Tombesi, S., Frioni, T., Poni, S., Palliotti, A. (2018). Effect of water stress memory on plant behavior during subsequent drought stress. Environmental & Experimental Botany, 150, 106–114. DOI 10.1016/j.envexpbot.2018.03.009. [Google Scholar] [CrossRef]
53. Osakabe, Y., Osakabe, K., Shinozakii, K., Tran, L. S. P. (2014). Response of plants to water stress. Frontiers in Plantence, 5, 86. DOI 10.3389/fpls.2014.00086. [Google Scholar] [CrossRef]
54. Chen, Y. E., Cui, J. M., Su, Y. Q., Zhang, C. M., Yuan, S. (2017). Comparison of phosphorylation and assembly of photosystem complexes and redox homeostasis in two wheat cultivars with different drought resistance. Scientific Reports, 7(1), 12718. DOI 10.1038/s41598-017-13145-1. [Google Scholar] [CrossRef]
55. Mega, R., Abe, F., Kim, J. S., Tsuboi, Y., Tanaka, K. et al. (2019). Tuning water-use efficiency and drought tolerance in wheat using abscisic acid receptors. Nature Plants, 5(2), 153–159. DOI 10.1038/s41477-019-0361-8. [Google Scholar] [CrossRef]
56. Turner, J. G., Ellis, C., Devoto, A. (2002). The jasmonate signal pathway. Plant Cell, 14(suppl_1), S153. DOI 10.1105/tpc.000679. [Google Scholar] [CrossRef]
57. Li, Z., Zhang, Y., Zhang, X., Merewitz, E., Peng, Y. et al. (2017). Metabolic pathways regulated by chitosan contributing to drought resistance in white clover. Journal of Proteome Research, 16(8), 3039–3052. DOI 10.1021/acs.jproteome.7b00334. [Google Scholar] [CrossRef]
58. Zhao, M. R., Li, F., Fang, Y., Gao, Q., Wang, W. (2011). Expansin-regulated cell elongation is involved in the drought tolerance in wheat. Protoplasma, 248(2), 313–323. DOI 10.1007/s00709-010-0172-2. [Google Scholar] [CrossRef]
59. Li, C. S., Huang, C. (2019). Autophagic survival precedes programmed cell death in wheat seedlings exposed to drought stress. International Journal of Molecular Sciences, 20(22), 5777. DOI 10.3390/ijms20225777. [Google Scholar] [CrossRef]
 | This work is licensed under a Creative Commons Attribution 4.0 International License, which permits unrestricted use, distribution, and reproduction in any medium, provided the original work is properly cited. |