| Phyton-International Journal of Experimental Botany |
DOI: 10.32604/phyton.2022.017633
ARTICLE
EoPHR2, a Phosphate Starvation Response Transcription Factor, Is Involved in Improving Low-Phosphorus Stress Resistance in Eremochloa ophiuroides
1Poplar Germplasm Enhancement & Variety Improvement Laboratory, Nanjing Forestry University, Nanjing, 210037, China
2Institute of Botany, Jiangsu Province and Chinese Academy of Sciences, Nanjing, 210014, China
3Taixing Rural Energy Technology Development Service Station, Taixing, 225400, China
*Corresponding Author: Haoran Wang. Email: njlydxwhr@163.com
#Ying Chen and Chuanqiang Liu contributed equally to this work
Received: 25 May 2021; Accepted: 29 July 2021
Abstract: As a macronutrient, Phosphorus (P) takes many roles in plant growth and development. It should be significant to explore the molecular mechanism of low-phosphorus stress response of plants. Phosphate starvation response (PHR) transcription factors play important roles in response to phosphorus deficiency stress in plants. In this study, we isolated a gene related to the plant phosphorus signaling system from the acid-soil-resistant centipedegrass (Eremochloa ophiuroides [Munro] Hack.), termed EoPHR2. The subcellular localization of EoPHR2 protein was observed to be nuclear located. The expression patterns of EoPHR2 in different tissues and Al/Pi-stress conditions were analyzed by qRT-PCR, they suggested a potential role in response to the multiple-stress under acid soil adversity. Based on the functional identification through transgenic plants, we found that (1) EoPHR2 is involved in the Pi-signaling pathway, and (2) overexpression of EoPHR2 mimics Pi-starvation signalling resulting on enhanced roots whether under Pi-deficiency stress or not. In conclusion, EoPHR2 transcription factor plays a role in response to the multiple stresses under acid soil conditions, improving the low-phosphorus stress resistance of Eremochloa ophiuroides.
Keywords: Phosphate starvation response; transcription factor; phosphorus signaling system; acid soil adaptability; Eremochloa ophiuroides
As an essential macronutrient in plants, phosphorus (P) is a structural component of nucleic acid and cell membrane lipids in plant cells. It participates in various metabolic processes and plays an important role in growth and development [1]. Plants acquire P as free inorganic phosphate (Pi) from soils. The total amount of P in most soils seems to be adequate for plant requirements. However, due to low mobility and a high fixation rate, the actual availability of P can be a limiting factor for plant growth, particularly on acid soils with abundant aluminium (Al) which fixes P at a high rate [2,3]. In plants, the uptake and utilization of phosphorus depend on the phosphate transporters (PTs) [4,5]. Previous studies have shown that a series of PT proteins are involved in the uptake of phosphorus in roots, or the translocation of phosphorus among tissues [5]. Like many phosphate starvation-induced (PSI) genes, the transcription of most PT genes are induced by Pi starvation, some of which are controlled by the phosphate starvation response (PHR) transcription factors (TFs), the key regulators of Pi starvation signaling [6–9]. PHR transcription factors belong to the MYB-CC family, and regulate the expression of PSI genes by binding to the imperfect palindromic sequences (P1BS; GNATATNC) present in their proximal promoter regions [8]. Previous studies in model plants have revealed that, the AtPHR1 gene in Arabidopsis, or its orthologous gene OsPHR2 in rice, are key regulators in the pathway responding to phosphorus signals [3,5,10]. For the plant phosphorus-signaling system-involved AtPHR1/OsPHR2 transcription factor (abbreviated as PHR1 below), three types of downstream pathways have been reported: PHR1-miR399-PHO2 pathway, PHR1-miR827-NLA pathway, or PHR1 directly activates phosphorus related functional proteins [9,11]. In addition, studies on PHR1 homologous genes in several species [e.g., maize (Zea mays) [12], soybean (Glycine max) [13], also suggested the important role of the PHR1 transcription factor in response to the phosphorus related stress.
Centipedegrass [Eremochloa ophiuroides (Munro.) Hack.] is recognized as an excellent warm-season turfgrass species originated in China [14]. It is naturally distributed on P-deficient acid soils. It should be significant to explore the molecular mechanism that allows centipedegrass adaptation to low-phosphorus acid soil conditions. In this study, based on the protein sequence similarity of AtPHR1/OsPHR2, we isolated an orthologous gene in centipedegrass, termed EoPHR2. The protein subcellular localization was observed through the Arabidopsis protoplast transient expression system. The expression patterns of EoPHR2 in different tissues and Al/Pi-stress conditions were analyzed by qRT-PCR. They suggested a potential role in response to the multiple-stresses under acid soil conditions. Further, to verify the function of EoPHR2 in the Pi-signaling regulation system, we developed transgenic lines with overexpression of EoPHR2 in Arabidopsis for functional identification. The results indicated that (1) EoPHR2 is involved in the Pi-signaling pathway, and (2) overexpression of EoPHR2 mimics Pi-starvation signalling resulting on enhanced roots whether under Pi-deficiency stress or not. In conclusion, EoPHR2 transcription factor plays a role in response to the multiple stresses found under acid soil conditions, improving the low-phosphorus stress resistance of Eremochloa ophiuroides.
Centipedegrass seedlings of the acid-soil-resistant strain ‘E041’ were used for RACE (Rapid Amplification of cDNA Ends) and Real-time PCR analysis. The seedlings were collected from the Turfgrass Germplasm Resource nursery at the Institute of Botany, Chinese Academy of Sciences, Jiangsu Province. Potted seedlings of Arabidopsis thaliana ‘Col-0’ were used for protoplast transfection and plant transformation.
2.2 Extraction and Purification of DNA and RNA
Genomic DNA was extracted from the newly expanded leaves using the DNAsecure Plant Kit (Tiangen Biotech, Beijing, China). Total RNA was extracted from various tissues or organs with the RNAprep Pure Plant Kit (Tiangen) with on-column DNaseI digestion. The nucleic acid concentration was quantified using an ND-1000 spectrophotometer (Nanodrop Technologies Inc., Rockland, DE, USA).
2.3 Cloning and Sequencing of Full-Length EoPHR2 Gene
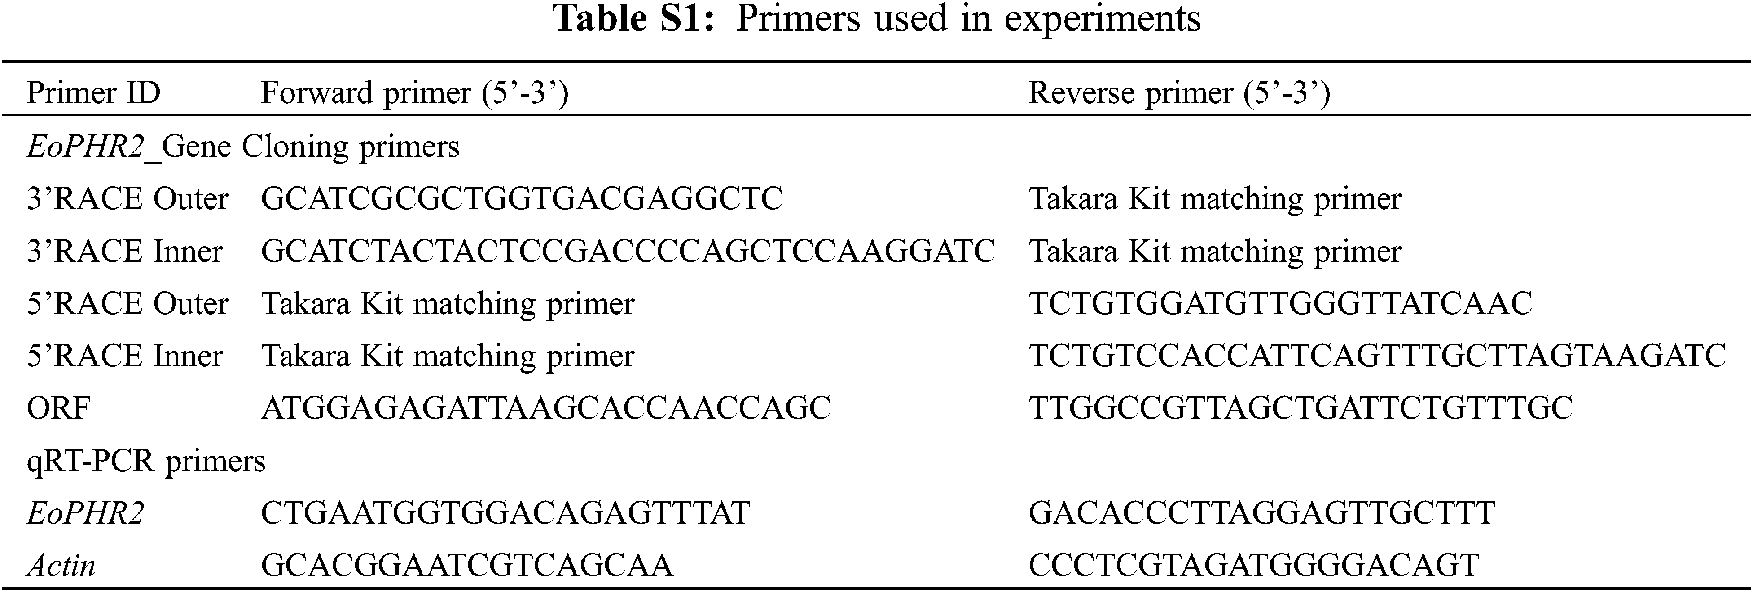
Based on the transcriptome sequencing data of centipedegrass, nested primers of 3′-RACE and 5′-RACE were designed for the EoPHR2 gene (Supplementary Table). The 3′-Full RACE Core Set Kit and 5′-Full RACE Kit (Takara, Dalian, China) were used to amplify the full-length sequences. The PCR products were separated on 1% agarose gels, cloned into the pMD19-T vector (Takara), and finally transformed into competent cells of Escherichia coli strain Top10. Colonies were checked by PCR, and inserts from positive colonies were sequenced. The full-length cDNA sequence of the EoPHR2 gene was obtained by aligning and comparing 3′-RACE and 5′-RACE products. The predicted ORFs were subsequently amplified by PCR and verified by sequencing.
Online BLAST software of The National Center for Biotechnology Information (NCBI) (http://www.ncbi.nlm.nih.gov) was used to analyze the DNA and protein sequences. The theoretical isoelectric point (pI) and mass value for the proteins were predicted and calculated using Expasy Protparam (http://web.expasy.org/protparam/). The functional domains of the protein were predicted using the SMART program (http://smart.embl-heidelberg.de/). Secondary structure of amino acid sequences was predicted by the SOPMA program (https://npsa-prabi.ibcp.fr/cgi-bin/npsa_automat.pl?page=npsa_sopma.html). The tertiary structure of deduced amino acid sequences was predicted using the SWISS MODEL (https://www.swissmodel.expasy.org/). The protein affinity and hydrophobicity were predicted using the ProtScale (https://web.expasy.org/protsca/). The protein signal peptide was predicted using the SignalP 4.1(http://www.cbs.dtu.dk/services/SignalP-4.1/). Phosphorylation site was predicted using the NetPhos (http://www.cbs.dtu.dk/services/NetPhos/). Protein transmembrane structure was predicted using the TMHMM 2.0. Multiple-sequence alignments of EoPHR2 proteins were carried out using the ClustalX 2.1 software [15]. The phylogenetic tree was constructed using MEGA6 software with the Neighbor-Joining method and 1000 bootstraps.
2.5 Protoplast Transfection (EoPHR2 Localization Experiment)
In this study, plasmids were constructed using the Gateway technology (Invitrogen, Carlsbad, CA, USA), according to the manufacturer’s protocol. The EoPHR2 coding region was cloned into the entry vector, pCR8/GW-TOPO (Invitrogen), via a simple T-A cloning reaction. An LR clonase enzyme mix (Invitrogen) was used to transfer the insert from the entry vector to its destination vector, p2GWF7.0 for C-terminal GFP fusion. The generated GFP fusion vector (35S:: EoPHR2-GFP) was a high copy vector driven by a double 35S cauliflower mosaic virus (CaMV) promoter with ampicillin as the bacterial selection marker. The plant protoplast preparation and transformation kit (Real-Times Biotechnology, Beijing, China) was used to isolate and transform Arabidopsis protoplasts. The protoplasts were observed using a BX53 microscope (Olympus, Tokyo, Japan).
Based on the centipedegrass hydroponic culture system [16], the hydroponic seedlings were pre-cultured for 2 weeks to the best growth state, and then treated using the “long-term Al-P alternate treatment” method [17]. Four treatment conditions, defined as ‘Control’ (−Al/+Pi), ‘P-deficiency’ (−Al/−Pi), ‘Al-toxicity’ (+Al/+Pi) and ‘Al-toxicity & P-deficiency’ (+Al/−Pi), were set up as follows:
Control (−Al/+Pi): A normal solution (1/2 Hoagland, in which the concentration of Pi was 500 μM, pH 4.0) and a Mock solution (0.5 mM CaCl2 solution, pH 4.0) were set up as alternating treatments.
P-deficiency (−Al/−Pi): A P-deficient solution (1/2 Hoagland, the concentration of Pi was adjusted to 10 μM, pH 4.0) and Mock solution (0.5 mM CaCl2 solution, pH 4.0) were set up as alternating treatments.
Al-toxicity (+Al/+Pi): A normal solution (1/2 Hoagland, in which the concentration of Pi was 500 μM, pH 4.0) and an Al-toxicity solution (0.5 mM CaCl2 solution with 1.5 mM AlCl3, pH 4.0) were set up as alternating treatments.
Al-toxicity & P-deficiency (+Al/−Pi): A P-deficient solution (1/2 Hoagland substrate, the concentration of Pi was adjusted to 10 μM, pH 4.0) and an Al-toxicity solution (0.5 mM CaCl2 solution with 1.5 mM AlCl3, pH 4.0) were set up as alternating treatments.
After 2 weeks of growing in the Normal nutrient solution, the seedlings were exposed to a 0.5 mM CaCl2 solution either with (+Al) or without (−Al) AlCl3 for 1 day. Thereafter, they were grown in the Normal (+Pi) or P-deficiency solution (-Pi) on alternate days. After 3 weeks of alternating treatments, the root, stem and leaf tissues were harvested (3 biological replicates). The fresh samples were first cleaned and then immediately frozen in liquid nitrogen.
Total RNA extraction from various tissues was performed as described above. The cDNA was synthesized from the total RNA using Oligo(dT)18 with the Promega ImPromII Reverse Transcription System (Promega, Madison, WI, USA). For semi-quantitative RT-PCR, specific primers were designed for the EoPHR2 gene (Supplementary Table). Real-time RT-PCR was carried out in a 20 μl reaction mixture using the FastStart Universal SYBR Green Master Mix (Roche Applied Science, Indianapolis, IN, USA). Real-time PCR was performed on an ABI ViiA7 Real-time PCR System (ABI, Foster City, CA, USA). The cycling conditions were: 50°C for 2 min, 95°C for 10 min, and 40 cycles of 95°C for 15 s and 60°C for 1 min. All reactions were performed in triplicate. The relative quantitative method [18] was used for data analysis.
Plasmids used in this study were constructed by Gateway technology (Invitrogen). The insert was transferred from the entry vector to its destination vector, pBI121-3HA, with a C-terminal HA-tag. The generated GFP fusion vector (35S::EoPHR2-HA) was a high copy vector driven by overexpression elements [35S promoter from cauliflower mosaic virus (CaMV)]. Potted seedlings of Arabidopsis thaliana ‘Col-0’ were used for the transgenic experiments. The seedlings were transformed by the Agrobacterium-mediated inflorescence infiltration method. Then, the homozygous transgenic seedlings of the T3 generation were screened, and tested for their function with the methods as follows:
Potted seedlings culture and treatment: After germinated on the solid MS medium, the wild-type/transgenic seedlings were transplanted to pots. The culture substrate (peat: vermiculite: perlite = 1:1:1) pre-mixed with a base fertilizer of 1:10 diluted MS nutrient solution was no longer fertilized. Potted seedlings were grown under a cycle of 16 h light/8 h dark at 22°C/18°C (day/night) and irrigated with pure water for 3 weeks. Thereafter, the phenotypes were observed.
Aseptic seedlings culture and treatment: Based on the solid MS medium (pH 5.8; added sucrose 20 g/L, agar 9 g/L), the phosphorus concentration was controlled by adjusting the addition amount of KH2PO4 (KCl was added to supplement K to the standard level). Four treatment conditions were set up as follows: 0 mM (Pi-absent), 0.0625 mM (low-Pi), 0.625 mM (half-Pi), 1.25 mM (full-Pi). The seeds of the wild-type and 2 transgenic lines were first sterilized and then seeded on the medium containing any of the four treatments.. The phenotypes were observed 3 weeks later: (1) The growth phenotype were scanned by a scanner (WinRHIZO Pro 2017 system); (2) A total of 25 seedlings were weighed to evaluate the fresh weight from each of the wild-type or transgenic lines exposed to the diverse treatment conditions. Meanwhile, the seedlings were frozen in liquid nitrogen and stored at −80°C for RNA extraction and real-time RT-PCR analysis.
3.1 Isolation and Characterization of the EoPHR2 Gene
The full-length cDNA sequence of the EoPHR2 gene was cloned from E. ophiuroides ‘E041’ by RACE (Rapid amplification of cDNA ends) procedures. It was 1991 bp in length, containing an open reading frame (ORF) of 1287 bp, flanked by 246 bp of 5´-untranslated region (UTR) and 458 bp of 3´-UTR. The encoded polypeptide consisted of 429 amino acids, with a corresponding molecular weight (MW) of 46.93 kDa (Fig. 1).
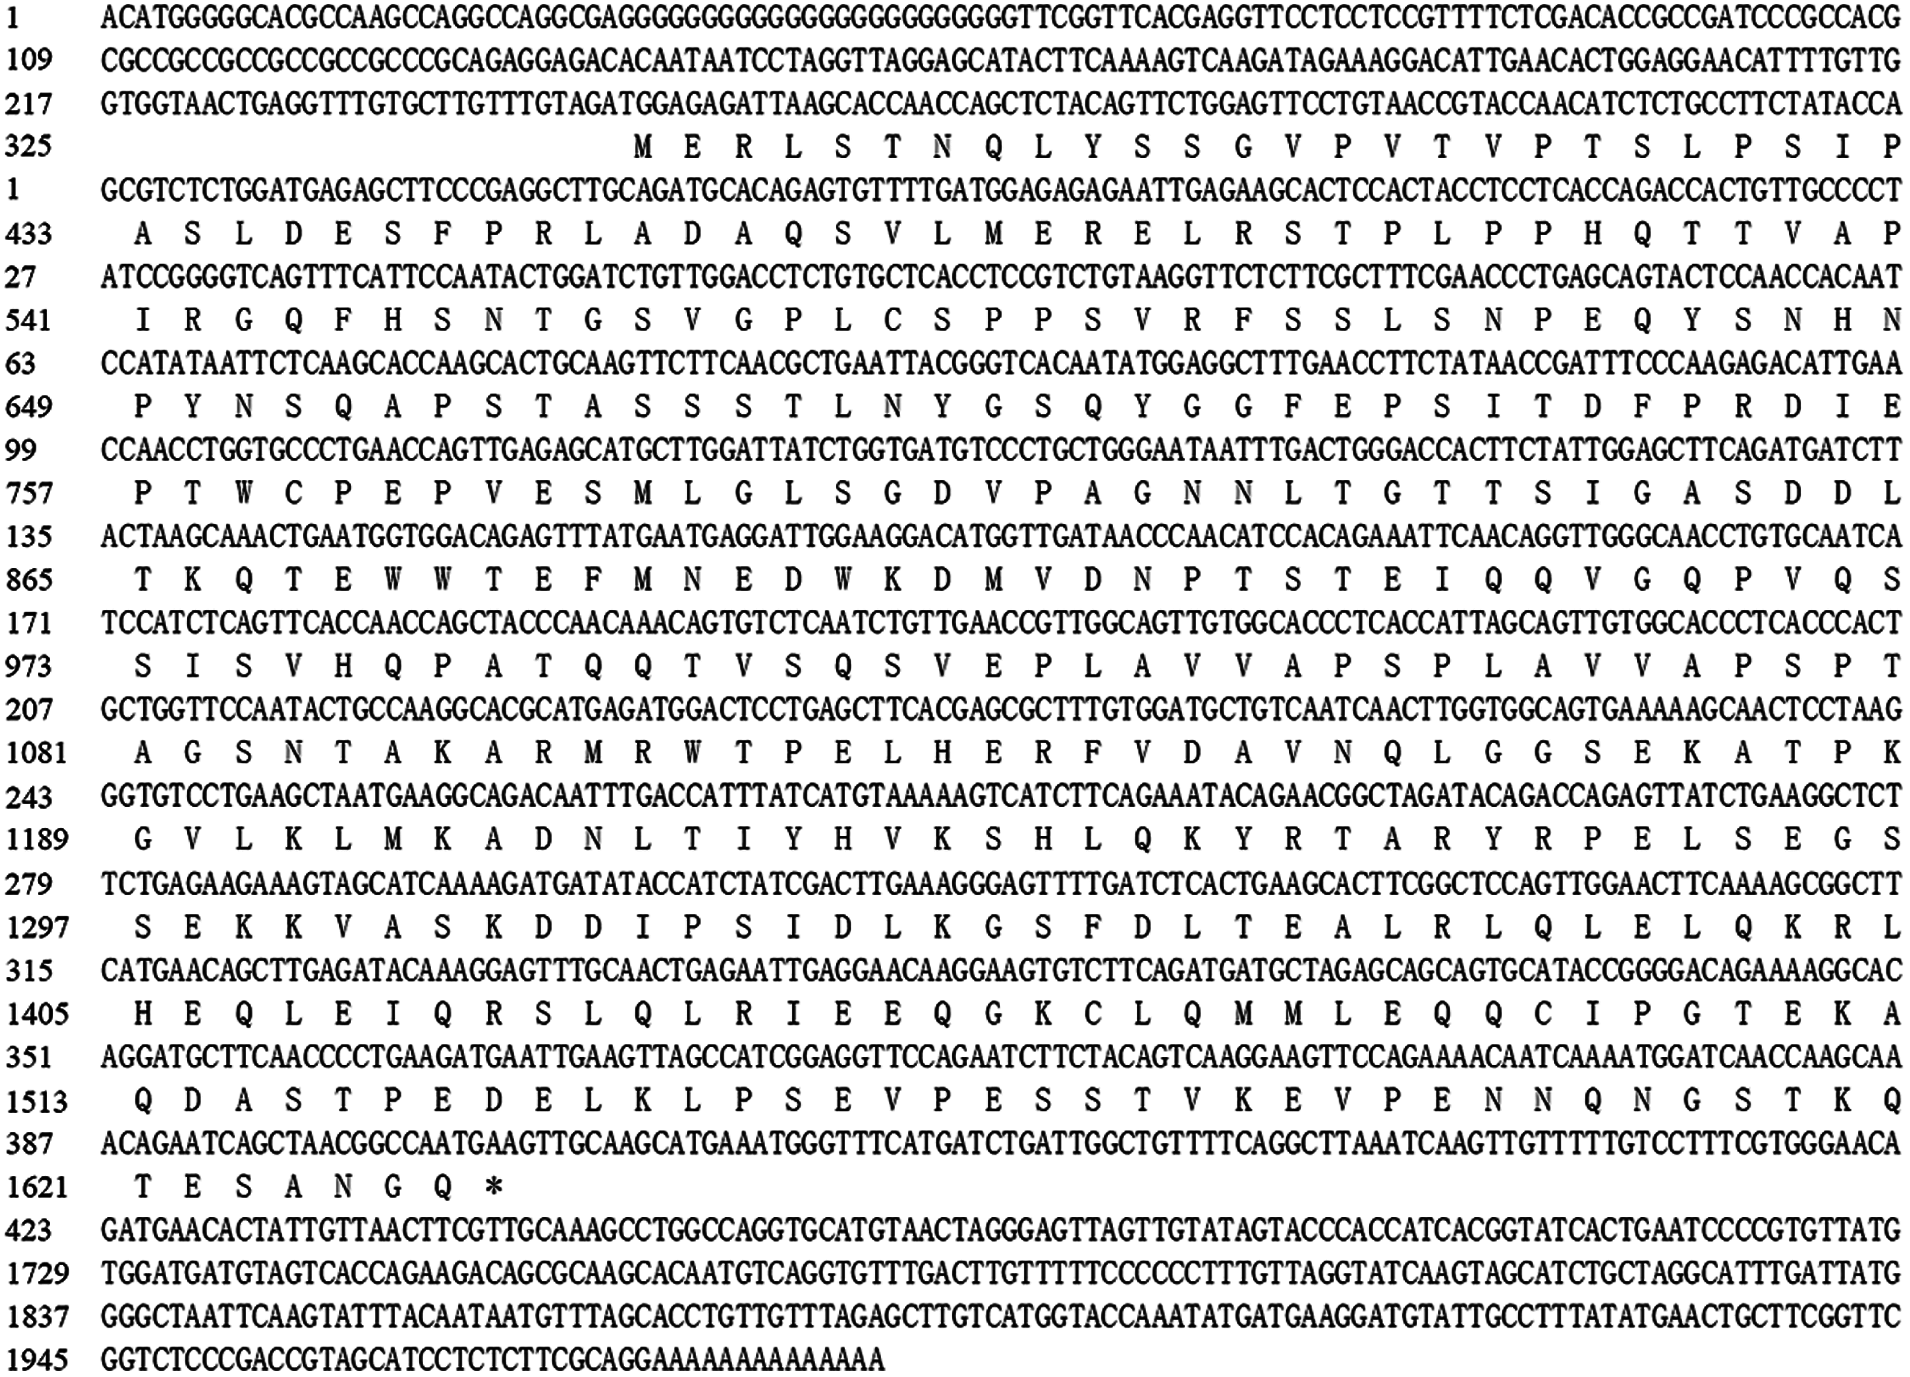
Figure 1: cDNA and amino acid sequence of EoPHR2
The physical and chemical properties of the protein encoded by EoPHR2 were predicted by the ProtParam software. It was shown that the theoretical isoelectric point, fatty acid coefficient, average hydrophilicity and instability parameter were 4.99, 70.44, −0.634 and 55.58, respectively. The protein domain predicted by SMART showed a low complexity domain (222-243), a Myb_DNA-binding domain (251-302), and a Myb-CC_LHEQLE domain (334-380) with the conserved LHEQLE motif (Fig. 2A). The secondary structure analysis of the EoPHR2 protein, identified using the SOPMA program, revealed the following proportions of each component: 26.57% alpha helices, 6.06% extended strands, 2.33% beta turns and 65.03% random coils (Fig. 2B). Furthermore, the three-dimensional model of EoPHR2 constructed by the SWISS MODEL was consistent with the prediction of a secondary structure (Fig. 2C). In addition, phosphorylation site analysis of the EoPHR2 protein, predicted using the DISPHOS program, showed that 59.615% of serine sites, 36.364% of threonine sites and 50.000% of tyrosine sites were phosphorylated (Fig. 2D).

Figure 2: Amino acid sequence analysis of the EoPHR2 protein. (A) Protein functional domain; (B) Secondary structure prediction, blue: α-helix, green represents β-folding, red: irregular crimping, purple: extended chain; (C) Three-dimensional structure prediction model; (D) Phosphorylation site analysis, S: serine sites, T: threonine sites, Y: tyrosine sites
According to the protein BLAST software, the predicted EoPHR2 protein belonged to the Myb-CC family with the conserved LHEQLE motif. The various alignments of the amino acid sequences were performed with the homologous proteins from different plant species using the ClustalX 2.1 software (GeneBank: Eremochloa ophiuroides, EoPHR2; Sorghum bicolor, XP_021309376.1; Zea mays, XP_008651544.1; Panicum miliaceum, RLN35937.1; Panicum hallii var. hallii, PUZ69446.1; Setariaitalica, XP_004956084.1; Dichanthe- liumoligosanthes, OEL30463.1; Eragrostiscurvula, TVU39510.1; Aegilops tauschiisubsp.Tauschii, XP_020191223.1; Triticum turgidum subsp. Durum, VAN57702.1; Hordeum vulgare, KAE8802583.1; Brachypodium distachyon, XP_003563187.1; Oryza meyeriana var . Granulata, KAF0909536.1; Oryza sativa Japonica Group, XP_015647735.1, OsPHR2; Oryza brachyantha, XP_006657651.1). The multiple alignments of the homologous proteins ranged, in percentage identity to EoPHR2 (Eremochloa ophiuroides), from 92.09% (Sorghum bicolor) to 71.89% (Oryza brachyantha), and revealed a conserved Myb-CC_LHEQLE domain in the C-terminus (Fig. 3).
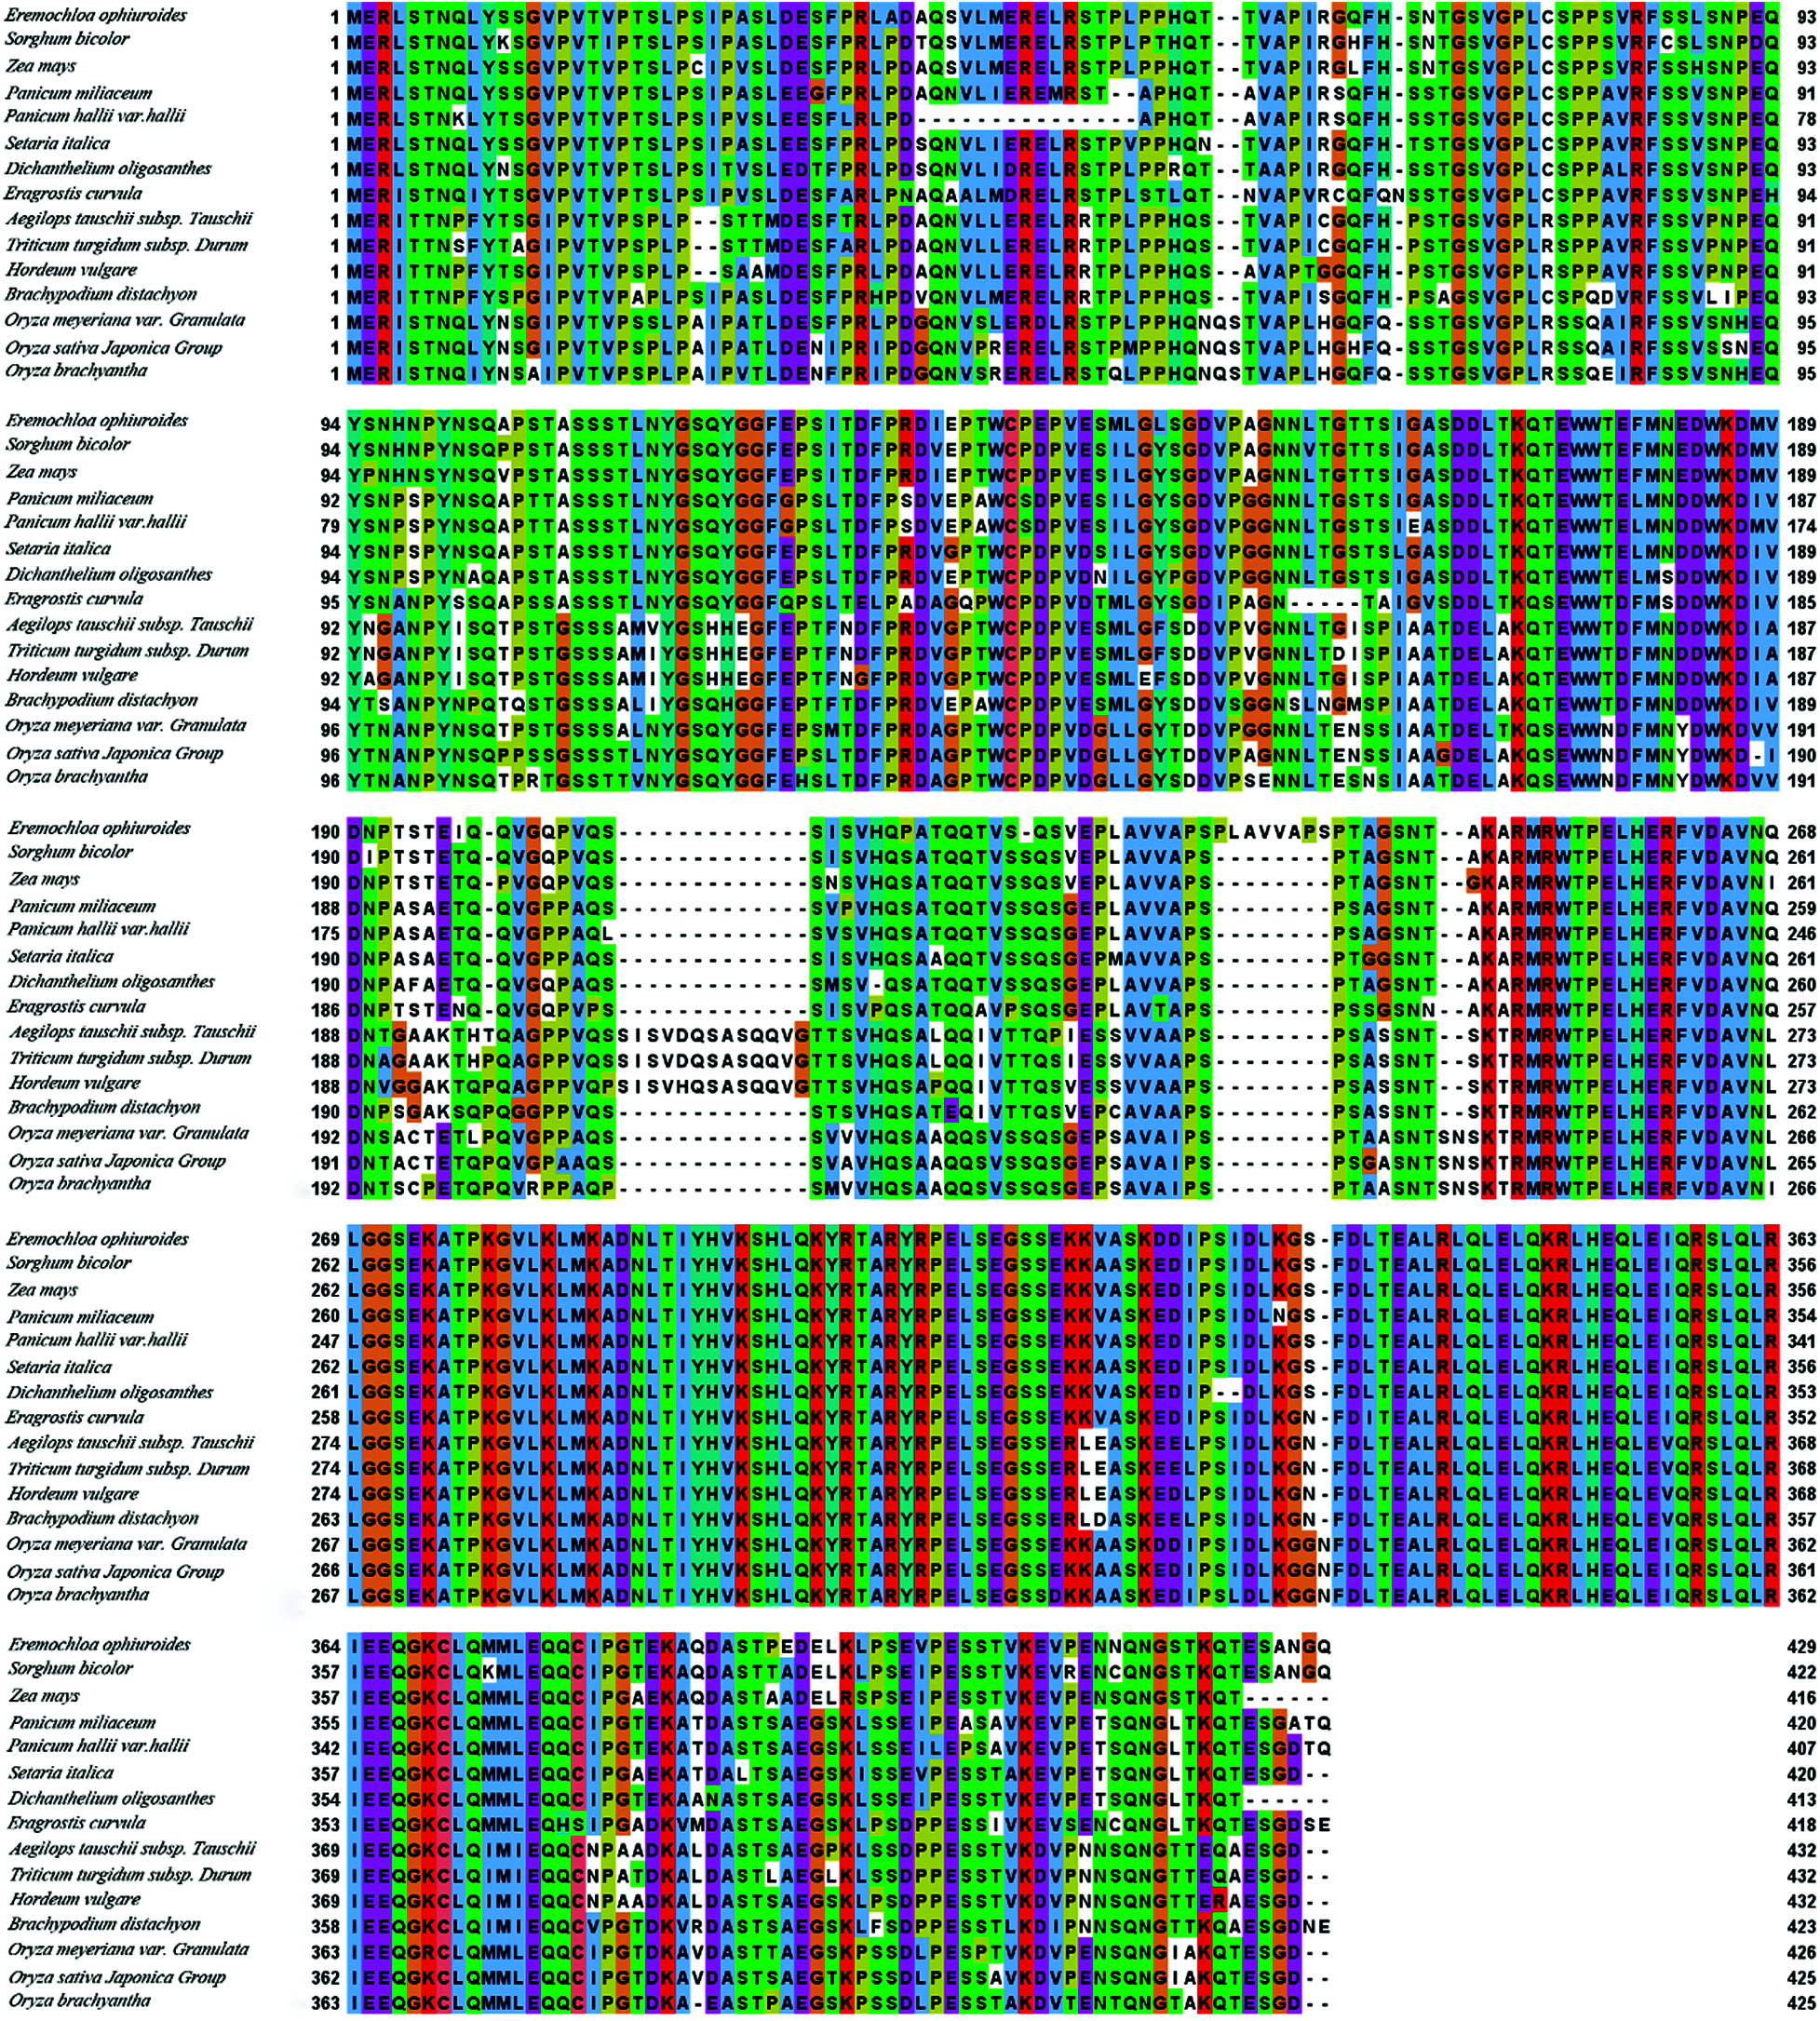
Figure 3: Alignment of the amino acid sequences on EoPHR2 proteins from various species
To understand the evolutionary relationships of the EoPHR2 proteins from different species, the amino acid sequences of 15 EoPHR2 proteins were aligned, and the phylogenetic tree of the homologous proteins was constructed by the Neighbor-Joining method using the MEGA6 software with bootstrap testing on 1000 replicates. The results showed the evolutionary relationships among the 15 proteins from different species (Fig. 4). The shortest evolutionary distance from E. ophiuroides was Sorghum bicolor, another member of the Panicoideae. The longest evolutionary distance from E. ophiuroides was Oryza brachyantha in the Oryzoideae.
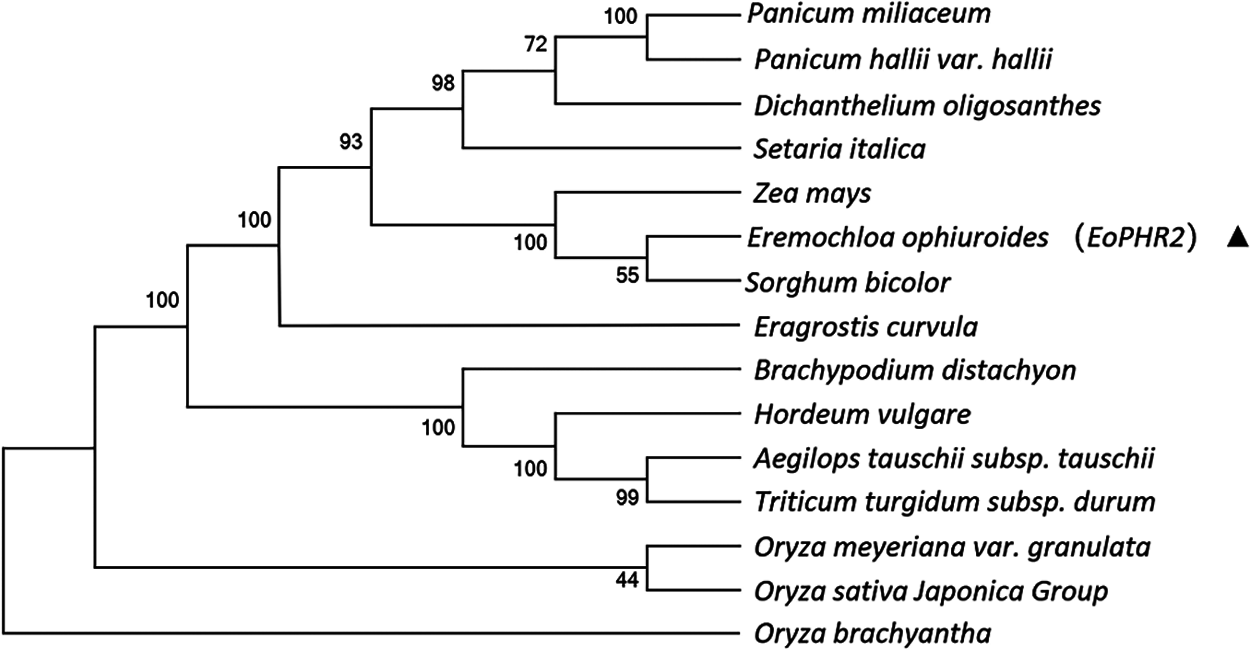
Figure 4: Phylogenetic analysis of EoPHR2 proteins from various species
3.2 Subcellular Localization of the EoPHR2 Protein
Subcellular localization information is one of the key features of protein function research. The amino acid sequence of the EoPHR2 protein was predicted and analyzed by SignalP 4.1. The results showed that the average S-score of the EoPHR2 protein was 0.103 and no signal peptide sequence was found. This indicated that the protein was a non-secretory protein. Further, the cellular localization of the EoPHR2 protein was probed using the Arabidopsis protoplast transient expression system. Using fluorescence microscopy, the EoPHR2-GFP fusion protein was detected in the nucleus in protoplasts, while the fluorescence signal of 35::GFP fusion protein had no clear cellular localization as the positive control (Fig. 5). The observed subcellular localization of the EoPHR2 protein was consistent with its functional localization as a transcription factor.
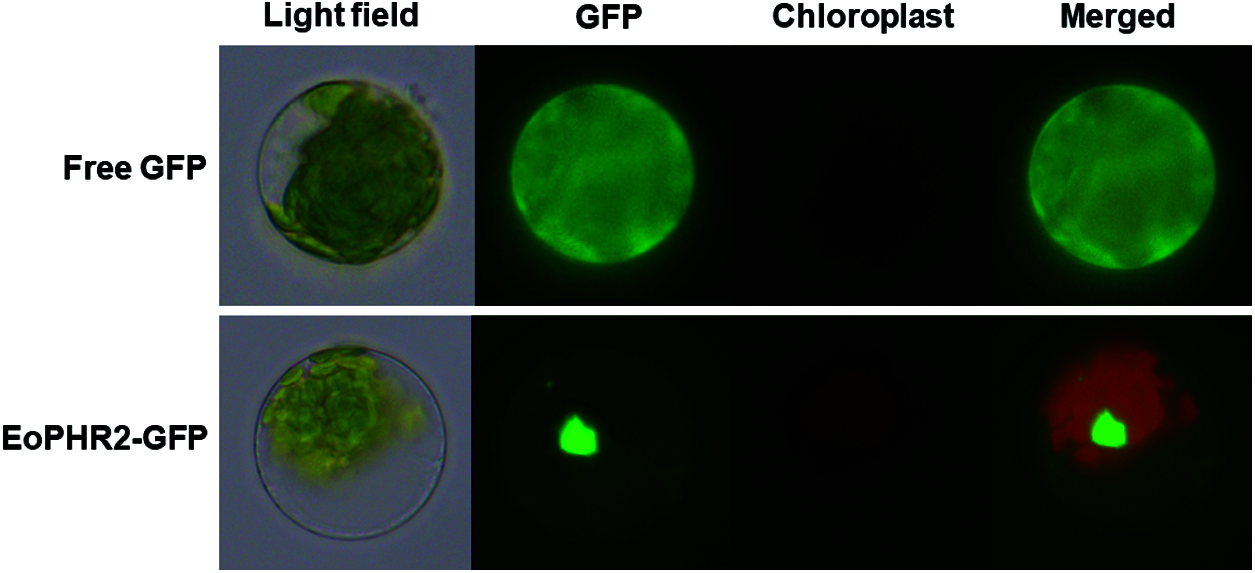
Figure 5: Subcellular localization of the EoPHR2 protein. The EoPHR2-GFP fusion protein was detected in the nucleus. The 35::GFP protein was used as a positive control
3.3 Expression Pattern of EoPHR2 under Multiple Conditions
To verify the expression pattern of EoPHR2 in E. ophiuroides, the expression levels of the EoPHR2 gene were measured in diverse tissues under different Al-P conditions by real-time PCR. It was found that under the ‘Control’ condition, EoPHR2 mainly expressed in root (Fig. 6A). Under the P-deficiency stress, the expression of EoPHR2 appeared no significantly differ in root, stem or leaf tissue, relative to the Control condition (Fig. 6B). These results showed that the EoPHR2 gene was mainly expressed in the root and would not be significantly induced by the P-deficiency stress, which confirmed the conclusions drawn from the homologous genes of other plant species [3,5,10].
On the other hand, interestingly, the expression level of EoPHR2 could be significantly up-regulated by Al-toxicity stress or Al-toxicity & P-deficiency multiple-stress in root, stem and leaf tissues, among which the gene expression was induced strongly in root. In addition, in root and leaf tissues, the EoPHR2 gene showed a stronger up-regulation under the multiple-stress of Al-toxicity & P-deficiency than the single stress of Al-toxicity (Fig. 6B). The results suggest a potential role of EoPHR2 in the Al-toxicity stress response of centipedegrass.
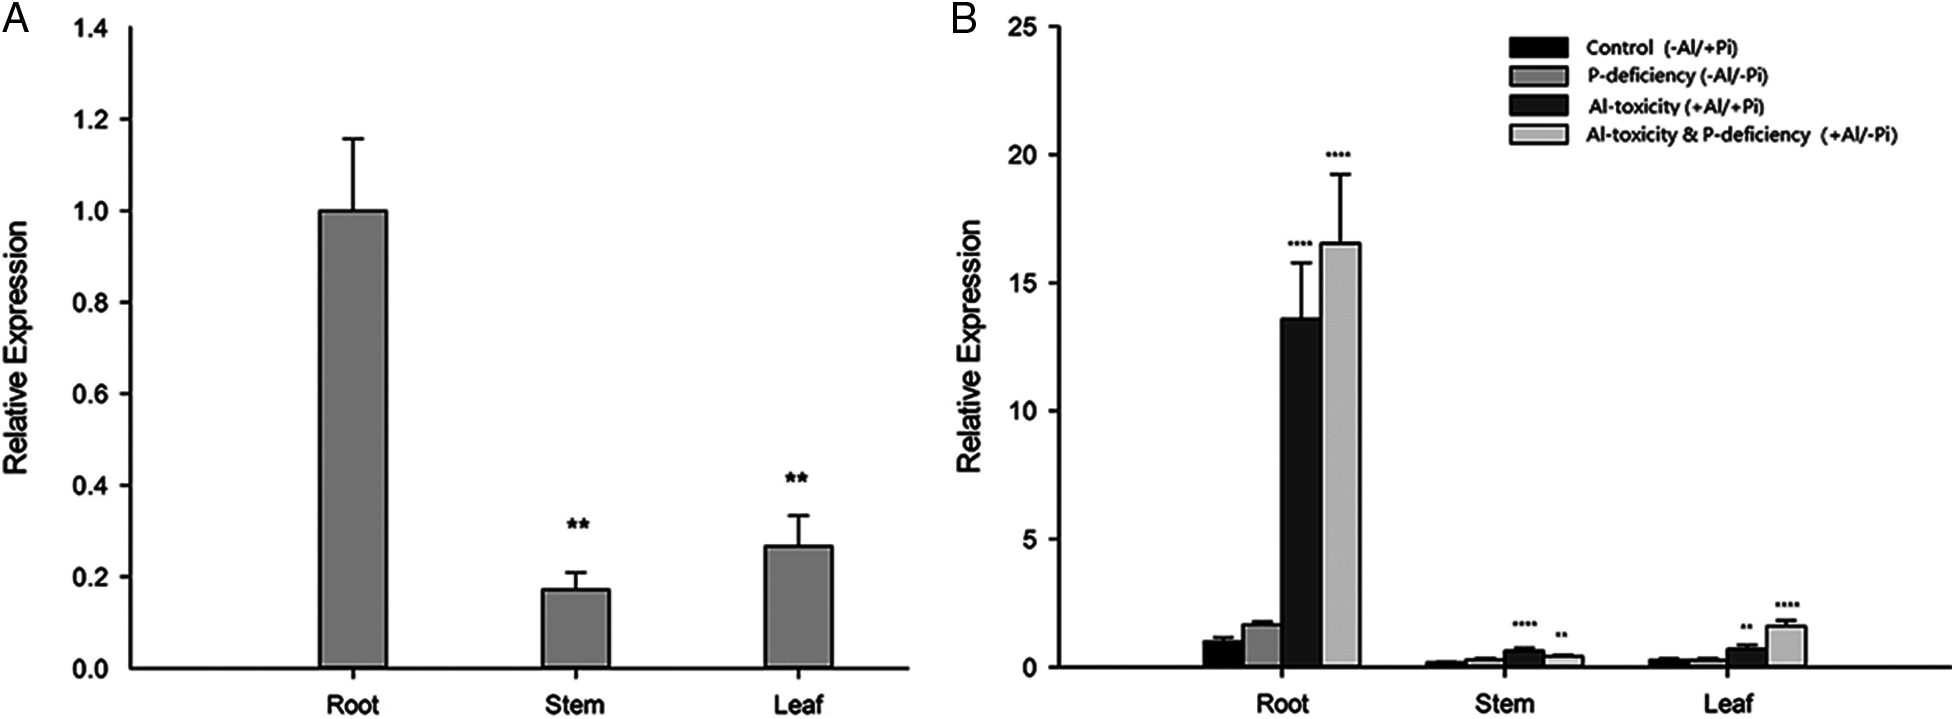
Figure 6: Gene expression profile analysis of EoPHR2 in E. ophiuroides. (A) Expression of EoPHR2 in different plant tissues; the expression levels were calculated relative to the ‘Root’; (B) Expression of EoPHR2 under different treatments; the expression levels were calculated relative to the ‘Root’ of ‘Control’. Bars indicate mean expression ± SD of three replicates. The **, ***, and **** mean P < 0.01, P < 0.001, P < 0.0001, respectively
3.4 EoPHR2 is Involved in Regulating Plant Growth under Pi Deficiency
Transgenic Arabidopsis plants overexpressing the EoPHR2 gene were generated to analyze the function of EoPHR2 in vivo. The full-length coding sequence (CDS) region of the EoPHR2 gene was amplified from cDNAs, subcloned into a modified pBI121-HA overexpression vector, and transferred into Arabidopsis using an Agrobacterium-mediated transformation method. After a period of iteratively screen, two homozygous transgenic lines were confirmed for the further experiments, termed EoPHR2-OV1 and EoPHR2-OV2 (Supplementary Figure).
In the condition of potted culture and treatment, growth of the 2 transgenic Arabidopsis lines was observed better than that of the wild-type (Fig. 7A). Then, the seeds of wild-type (WT) and 2 transgenic (EoPHR2-OV1, EoPHR2-OV2) lines were sterilized and sown on the solid medium with inorganic phosphorus concentration of 0 mM (Pi-absent), 0.0625 mM (low-Pi), 0.625 mM (half-Pi) or 1.25 mM (full-Pi), respectively. Three weeks later, the phenotype was observed and the fresh-weight was determined. In the extremely Pi-absent condition (0 mM Pi), the wild-type and transgenic lines showed obvious growth inhibition as a result of absence of the essential macronutrient. Then, in the condition of low-Pi (0.0625 mM Pi), the transgenic plants began to show advantages in vegetative growth compared with the wild-type; the fresh weight of transgenic plants was slightly higher than that of the wild-type. Moreover, the transgenic plants appeared to have more developed lateral roots. Further, in the condition with the half-Pi concentration of 0.625 mM, the transgenic plants showed obvious growth advantages compared with the wild-type; the two transgenic lines exhibited higher fresh weight with better developed root systems than the wild-type. In addition, under the full-Pi condition (1.25 mM Pi), there was no significant difference in plant fresh weight between the transgenic and the wild-type plants. However, the root systems of the transgenic lines were still observed superior to that in the wild-type (Figs. 7B and 7C).
Previous studies in the model plants have revealed that AtPHR1/OsPHR2 is a key regulator in the pathway responding to phosphorus signals [3,5,10]. Overexpression of EoPHR2 should be able to mimic Pi-starvation signalling and activate the transcription of the Pi-starvation-induced PHT1 genes in transgenetic Arabidopsis plants. The expression levels of PHT1 genes were measured by real-time RT-PCR to verify the mode of action of EoPHR2. According to previous studies [19], nine Arabidopsis PHT1 genes were found, and primers were designed to quantify the level of expression of each AtPHT1 gene. Under the full-Pi condition (1.25 mM Pi), the expression levels of most PHT1 genes were up-regulated in the transgenic plants without Pi-starvation stress, relative to the wild type. Overexpression of EoPHR2 could induce the expression of eight AtPHT1 genes apart from the AtPHT1-9 (Fig. 8, Fig. S2). As members of an important phosphate transporter famliy, PHT1 genes have frequently been used to study phosphate starvation responses in plants. The induction of PHT1 genes in transgenic plants suggests a potential in vivo role for EoPHR2 in the Pi-signaling pathway and low-phosphorus stress resistance.

Figure 7: Phenotype identification of EoPHR2 in transgenetic Arabidopsis plants. (A) Phenotype of potted seedlings; (B) Fresh weight of seedlings under different phosphorus concentration treatments (each from 25 plants). Bars indicate mean ± SD of three replicates. The *, **, mean P < 0.05, P < 0.01, respectively; (C) Phenotypes of seedlings under different phosphorus concentration treatments
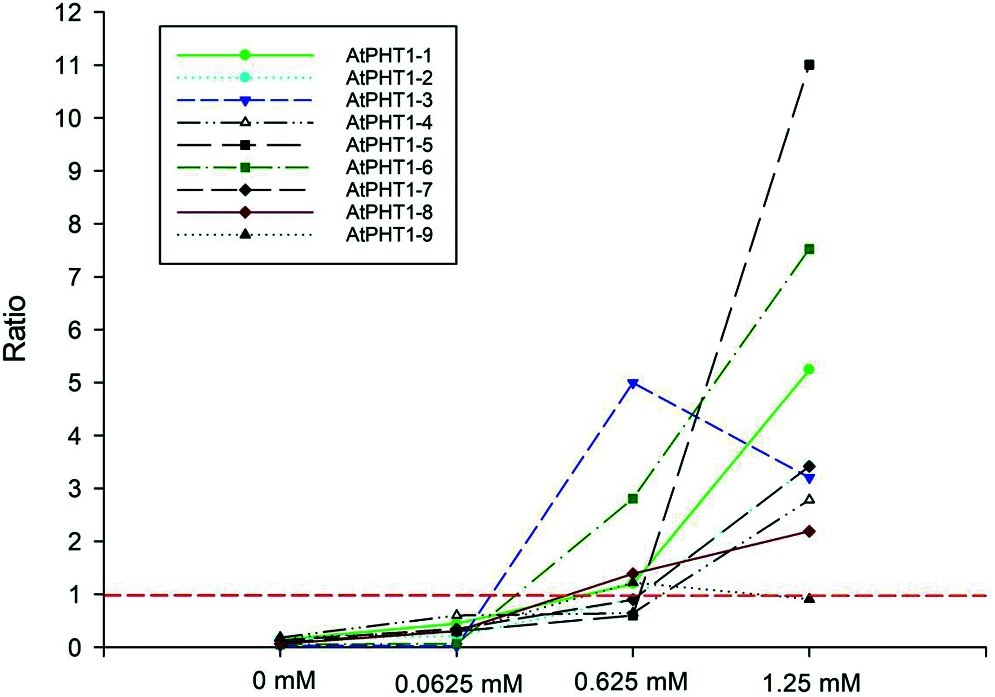
Figure 8: Gene expression profile analysis of AtPHT1 family genes in transgenetic Arabidopsis plants. Under different phosphorus concentration treatments, all nine AtPHT1 genes were verified by real-time RT-PCR respectively. The ratio of gene expression level in transgenetic Arabidopsis plants relative to the wild-type was used for evaluation. Ratio greater than 1: gene up-regulated in transgenic plants; Ratio less than 1: gene down-regulated in transgenic plants; Ratio equal to 1: gene was not induced in transgenic plants
Acid soils are distributed globally. Approximately 30% of the world’s total land area consists of acid soils, and it has been estimated that over 50% of the world’s potential arable lands are acidic [20]. Decades ago, acid soils accounted for 22.7% of the total land area in China [21]. As a native species in southern China [14], centipedegrass (Eremochloa ophiuroides) is naturally distributed in the low-phosphorus soil areas, particularly on the extremely P-deficient acid soils. It is important to explore the molecular mechanism of low-phosphorus stress responses in plants which naturally adapt to low-phosphorus soil conditions. This is to guide breeding of P-efficient varieties, for improving the utilization rate and ecology of barren land areas. In this study, a low-phosphorus response related gene was first cloned from centipedegrass (E. ophiuroides), identified to be an orthologous gene of the AtPHR1/OsPHR2 gene, termed EoPHR2.
According to previous studies in the model species, the AtPHR1 gene in Arabidopsis, or its orthologous gene OsPHR2 in rice, are key regulators in the pathway responding to phosphorus starvation signal [3,5,10]. Therefore, the root architectural alteration of transgenic plants overexpressing AtPHR1/OsPHR2 (abbreviated as PHR1 below) is considered as the strategy of plants to cope with low-phosphorus stress [6,7]. On the other hand, previous studies of phosphorus transporter genes found that the level of phosphorus content in the roots was not the decisive factor to determine the root architectural alteration in response to low-phosphorus stress [22,23]. It is speculated that PHR1 regulates root development through an unknown pathway independently of the plant tissue phosphorus level. In this study, EoPHR2 transgenic plants showed well developed and architecturally alterative roots compared to the wild-type, whether under low-Pi (0.0625 mM Pi), half-Pi (0.625 mM) and full-Pi (1.25 mM Pi) conditions. The results were consistent with previous studies in that EoPHR2 could regulate root development by a growth regulation pathway unaffected by the level of plant tissue phosphorus. Additionally, in the extremely Pi-absent condition (0 mM Pi), the growth inhibition observed in either wild-type or transgenic lines could be a result of absence of the essential macronutrient.
In previous studies, overexpression of the PHR1 transcription factor would cause growth inhibition because of toxic physiological effects due to excessive Pi accumulation in shoots, called Pi-toxicity [6,7]. In this study, the fresh weight of transgenic plants did not increase significantly in comparison with the wild-type in the full-Pi condition. This was despite the significantly well-developed roots of the transgenic plants, which suggested that the growth of the aerial parts was inhibited. Nevertheless, the increased fresh weight of transgenic plants was observed under the conditions of low-Pi and half-Pi. It is speculated that the Pi-toxicity and the Pi nutritional limitation act as a pair of competitive factors affecting the growth of the aerial parts. In the case of P-deficiency, the phosphorus efficiency advantage may exceed the negative effect of Pi-toxicity in the transgenic plants, appearing as a better growth phenotype. Considering the actual low P-availability in natural soils [2], as expected, the transgenic plants would grow better than the wild-type in pots.
Based on previous studies in various species, the PHR1 gene should mainly express in roots, and the gene expression could not be induced by low-phosphorus stress [3,5,10]. In this study, we analysed the expression pattern of the EoPHR2 gene which responded to low-phosphorus stress (10 μM Pi) in different plant tissues. The result showed that the EoPHR2 constitutively expressed in roots, unrelated to the low-phosphorus stress, which was consistent with the results of previous studies. Considering that the centipedegrass is naturally distributed on acid soils with low-phosphorus coupled with Al-toxicity stress [20], we also analysed the gene expression pattern under ‘Al-toxicity’ (1.5 mM Al) and ‘Al-toxicity & P-deficiency’ (10 μM Pi, 1.5 mM Al) treatments. Interestingly, as a phosphorus-related gene, the expression of EoPHR2 could be significantly induced by ‘Al-toxicity’ stress or ‘Al-toxicity & P-deficiency’ couple-stress. It suggested that some special regulatory mechanisms respond to the Al-P stress in acid soils and relate to the phosphorus efficiency of centipedegrass. However, this hypothesis should be further studied in the future.
Acknowledgement: Thanks are due to Lijuan Zhao for assistance with the experiments and to Junxiang Chen for valuable discussion. Useful suggestions given by Zhiyi Wang are also acknowledged.
Availability of Data and Materials: The sequence data of the EoPHR2 gene has been submitted to the GenBank and acquired the accession number MZ227015.
Author Contributions: HW designed the research. HW, YC and CL wrote the manuscript. HW, CL, QH, JL, JW, LL, XY, SZ and YC performed the research.
Funding Statement: This work was supported by the National Natural Science Foundation of China (Grant No. 31902046), the National Natural Science Foundation of China (Grant No. 32072608), the National Natural Science Foundation of China (Grant No. 31902060), the Natural Science Foundation of Jiangsu Province, China (Grant No. BK20180315), and the Foundation of Jiangsu Key Laboratory for the Research and Utilization of Plant Resources (Institute of Botany, Jiangsu Province and Chinese Academy of Sciences).
Conflicts of Interest: The authors declare that they have no conflicts of interest to report regarding the present study.
1. Sun, L., Tian, J., Zhang, H., Liao, H. (2016). Phytohormone regulation of root growth triggered by P deficiency or Al toxicity. Journal of Experimental Botany, 67(12), 3655–3664. DOI 10.1093/jxb/erw188. [Google Scholar] [CrossRef]
2. Raghothama, K. G. (1999). Phosphate acquisition. Annual Review of Plant Physiology and Plant Molecular Biology, 50(1), 665–693. DOI 10.1146/annurev.arplant.50.1.665. [Google Scholar] [CrossRef]
3. Wu, P., Shou, H., Xu, G., Lian, X. (2013). Improvement of phosphorus efficiency in rice on the basis of understanding phosphate signaling and homeostasis. Current Opinion in Plant Biology, 16(2), 205–212. DOI 10.1016/j.pbi.2013.03.002. [Google Scholar] [CrossRef]
4. Lopez-Arredondo, D. L., Leyva-Gonzalez, M. A., Gonzalez-Morales, S. I., Lopez-Bucio, J., Herrera-Estrella, L. (2014). Phosphate nutrition: Improving low-phosphate tolerance in crops. Annual Review of Plant Biology, 65(1), 95–123. DOI 10.1146/annurev-arplant-050213-035949. [Google Scholar] [CrossRef]
5. Gu, M., Chen, A., Sun, S., Xu, G. (2016). Complex regulation of plant phosphate transporters and the gap between molecular mechanisms and practical application: What is missing? Molecular Plant, 9(3), 396–416. DOI 10.1016/j.molp.2015.12.012. [Google Scholar] [CrossRef]
6. Rubio, V., Linhares, F., Solano, R., Martín, A. C., Iglesias, J. et al. (2001). A conserved MYB transcription factor involved in phosphate starvation signaling both in vascular plants and in unicellular algae. Genes & Development, 15(16), 2122–2133. DOI 10.1101/gad.204401. [Google Scholar] [CrossRef]
7. Zhou, J., Jiao, F., Wu, Z., Li, Y., Wang, X. et al. (2008). OsPHR2 is involved in phosphate-starvation signaling and excessive phosphate accumulation in shoots of plants. Plant Physiology, 146(4), 1673–1686. DOI 10.1104/pp.107.111443. [Google Scholar] [CrossRef]
8. Bustos, R., Castrillo, G., Linhares, F., Puga, M. I., Rubio, V. et al. (2010). A central regulatory system largely controls transcriptional activation and repression responses to phosphate starvation in Arabidopsis. PLoS Genetics, 6(9), e1001102. DOI 10.1371/journal.pgen.1001102. [Google Scholar] [CrossRef]
9. Guo, M. N., Ruan, W. Y., Li, C. Y., Huang, F. L., Zeng, M. et al. (2015). Integrative comparison of the role of the PHR1 subfamily in phosphate signaling and homeostasis in rice. Plant Physiology, 168(4), 1762–1776. DOI 10.1104/pp.15.00736. [Google Scholar] [CrossRef]
10. Chien, P. S., Chiang, C. P., Leong, S. J., Chiou, T. J. (2018). Sensing and signaling of phosphate starvation: From local to long distance. Plant and Cell Physiology, 59(9), 1714–1722. DOI 10.1093/pcp/pcy148. [Google Scholar] [CrossRef]
11. Zhong, Y., Wang, Y., Guo, J., Zhu, X., Shi, J. et al. (2018). Rice SPX6 negatively regulates the phosphate starvation response through suppression of the transcription factor PHR2. New Phytol, 219(1), 135–148. [Google Scholar]
12. Wang, C., Yue, W., Ying, Y., Wang, S., Secco, D. et al. (2015). Rice SPX-Major Facility Superfamily3, a vacuolar phosphate efflux transporter, is involved in maintaining phosphate homeostasis in rice. Plant Physiology, 169(4), 2822–2831. [Google Scholar]
13. Xue, Y. B., Xiao, B. X., Zhu, S. N., Mo, X. H., Liang, C. Y. et al. (2017). GmPHR25, a GmPHR member up-regulated by phosphate starvation, controls phosphate homeostasis in soybean. Journal of Experimental Botany, 68(17), 4951–4967. DOI 10.1093/jxb/erx292. [Google Scholar] [CrossRef]
14. Hanna, W. W. (1995). Centipedegrass—diversity and vulnerability. Crop Science, 35(2), 332–334. DOI 10.2135/cropsci1995.0011183X003500020007x. [Google Scholar] [CrossRef]
15. Larkin, M. A., Blackshields, G., Brown, N. P., Chenna, R., McGettigan, P. A. et al. (2007). Clustal W and Clustal X version 2.0. Bioinformatics, 23(21), 2947–2948. DOI 10.1093/bioinformatics/btm404. [Google Scholar] [CrossRef]
16. Yan, J., Chen, J., Zhang, T., Liu, J., Liu, H. (2009). Evaluation of aluminum tolerance and nutrient uptake of 50 centipedegrass accessions and cultivars. HortScience, 44(3), 857–861. DOI 10.21273/HORTSCI.44.3.857. [Google Scholar] [CrossRef]
17. Chen, R. F., Zhang, F. L., Zhang, Q. M., Sun, Q. B., Dong, X. Y. et al. (2012). Aluminium-phosphorus interactions in plants growing on acid soils: Does phosphorus always alleviate aluminium toxicity? Journal of the Science of Food and Agriculture, 92(5), 995–1000. DOI 10.1002/jsfa.4566. [Google Scholar] [CrossRef]
18. Schmittgen, T. D., Livak, K. J. (2008). Analyzing real-time PCR data by the comparative CT method. Nature Protocols, 3(6), 1101–1108. DOI 10.1038/nprot.2008.73. [Google Scholar] [CrossRef]
19. Lapis-Gaza, H. R., Jost, R., Finnegan, P. M. (2014). Arabidopsis PHOSPHATE TRANSPORTER1 genes PHT1;8 and PHT1;9 are involved in root-to-shoot translocation of orthophosphate. BMC Plant Biology, 14(1), 225. DOI 10.1186/s12870-014-0334-z. [Google Scholar] [CrossRef]
20. Zheng, S. J. (2010). Crop production on acidic soils: Overcoming aluminium toxicity and phosphorus deficiency. Annals of Botany, 106(1), 183–184. DOI 10.1093/aob/mcq134. [Google Scholar] [CrossRef]
21. Shen, R. F., Yang, Z. M., Zheng, S. J. (2008). Aluminum in the soil: Behavior in plants and plant adaptation mechanisms. Beijing: Science Press. [Google Scholar]
22. Hu, R., Qi, G., Kong, Y., Kong, D., Gao, Q. et al. (2010). Comprehensive analysis of NAC domain transcription factor gene family in Populus trichocarpa. BMC Plant Biology, 10, 145. [Google Scholar]
23. Li, Y., Li, C., Cheng, L., Yu, S., Shen, C. et al. (2019). Over-expression of OsPT2 under a rice root specific promoter Os03g01700. Plant Physiology and Biochemistry, 136, 52–57. [Google Scholar]
Supplementary Figure and Table
Appendix A
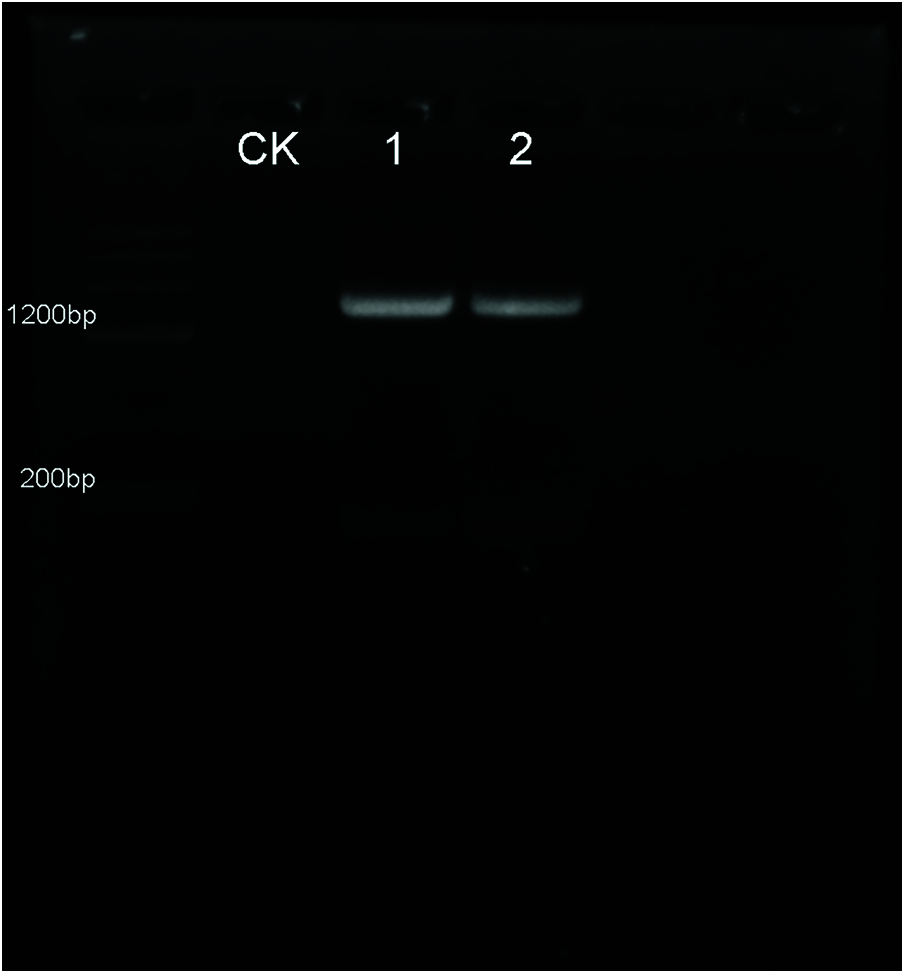
Figure S1: Verification of the transgenic Arabidopsis seedlings by PCR. The EoPHR2 gene was amplified from cDNA, subcloned into a modified pBI121-HA overexpression vector, and transferred into Arabidopsis using an Agrobacterium-mediated transformation method. According to the results of PCR using specific detecting primers, 2 transgenic plants of EoPHR2 (showed in lanes 1, 2) were confirmed. CK stands for the wild-type plant
Appendix B
Appendix C
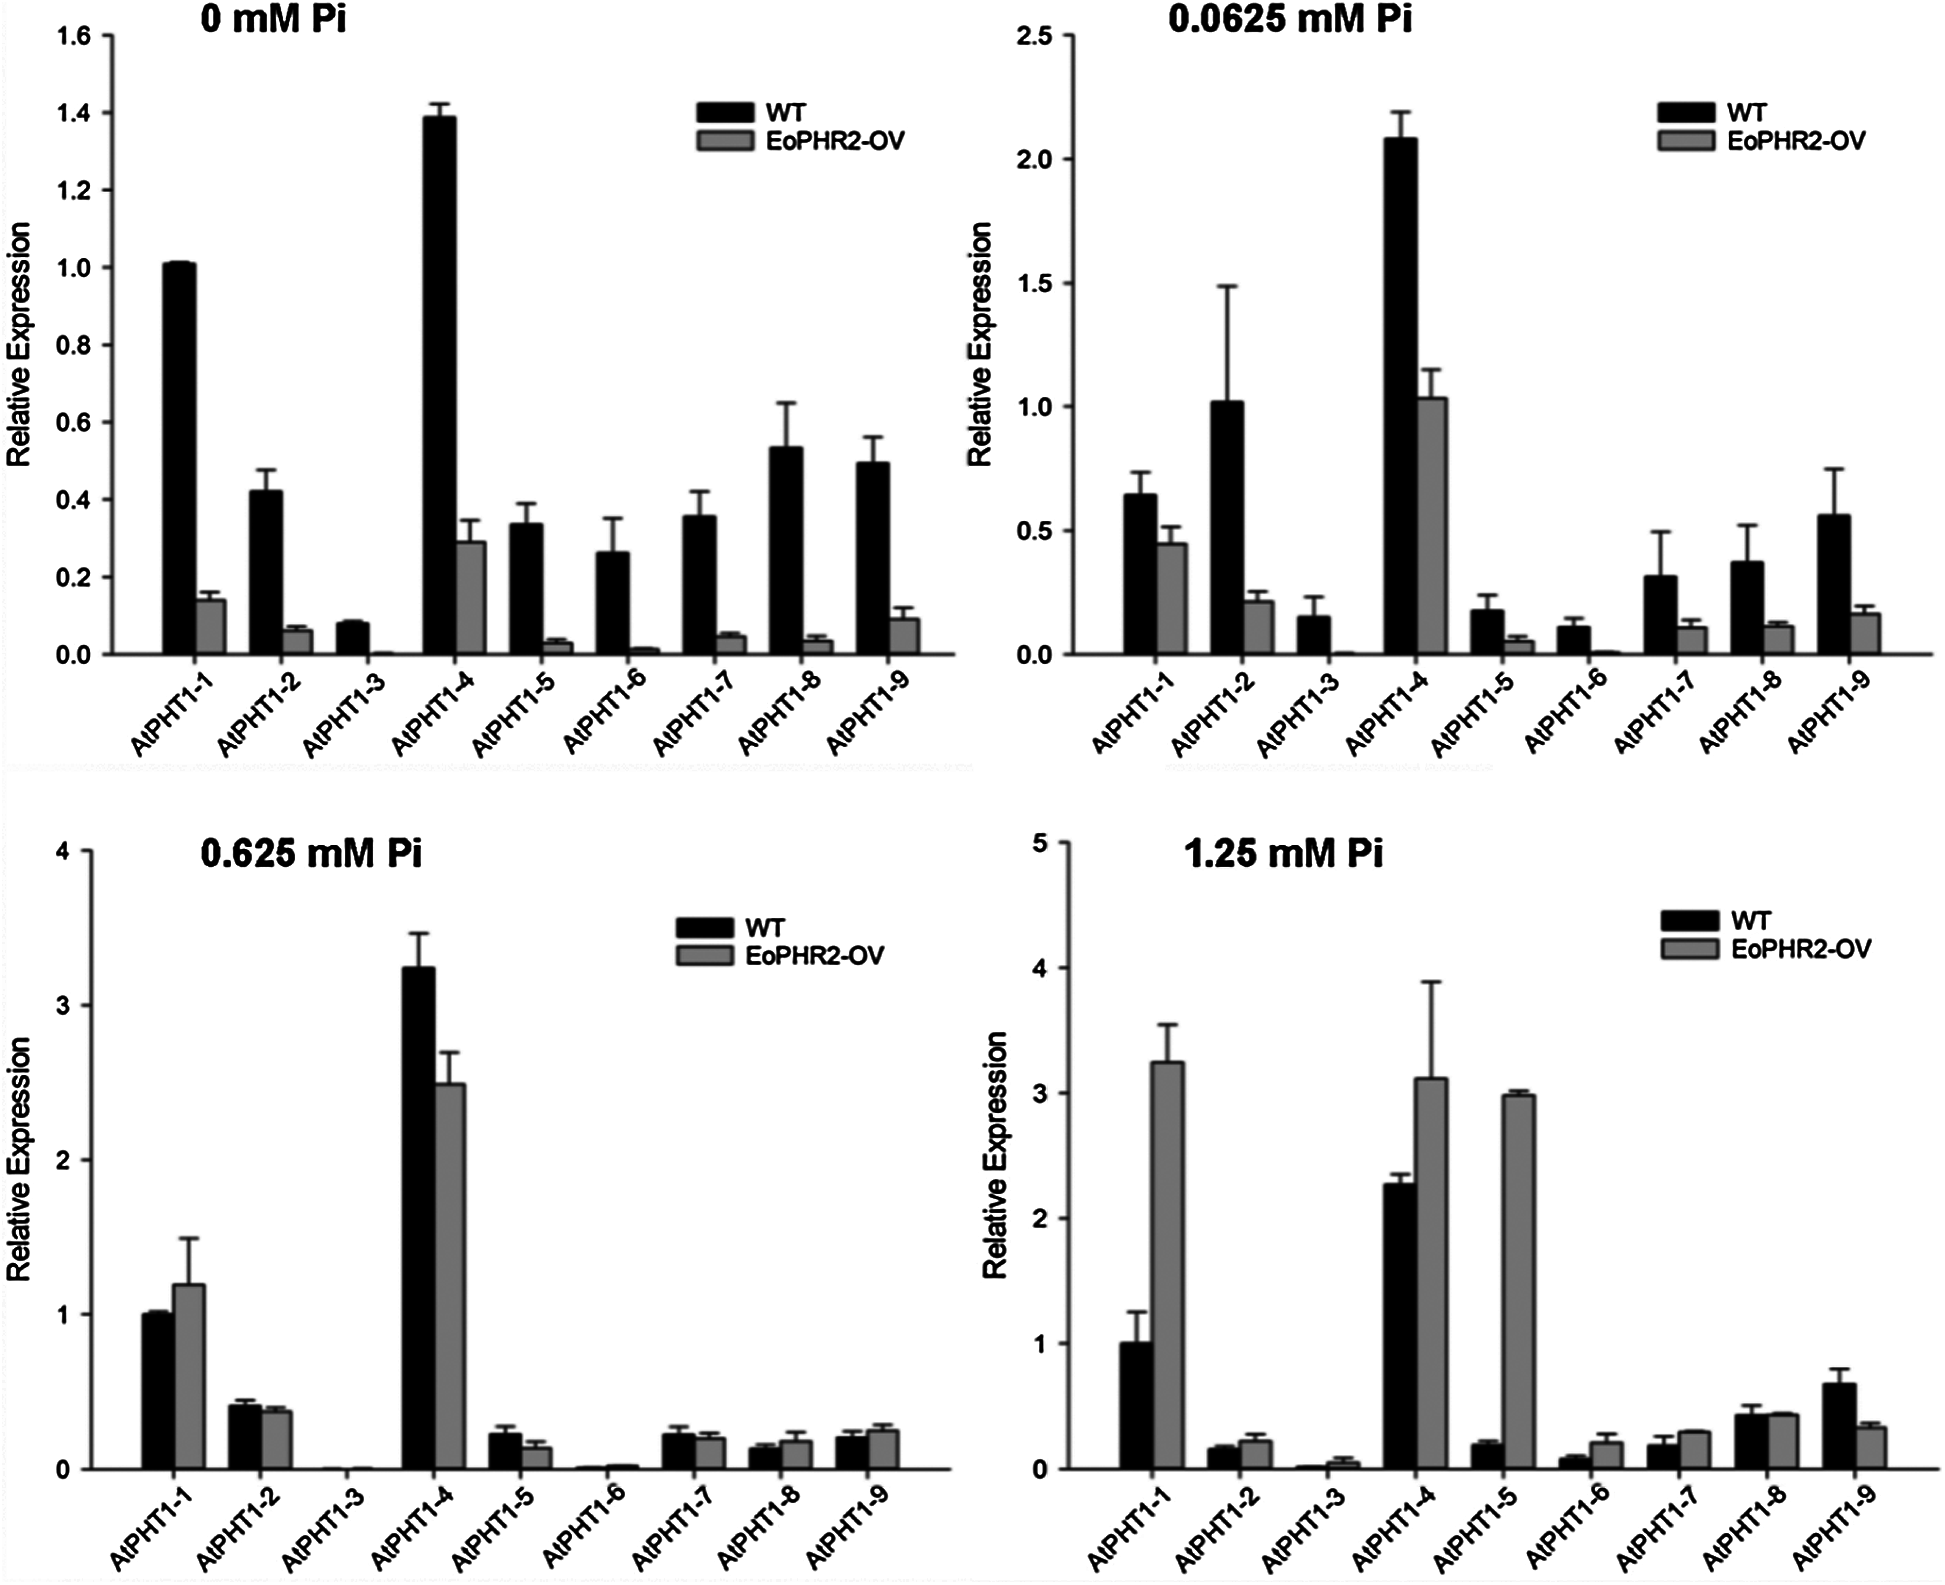
Figure S2: Gene expression profile analysis of AtPHT1 family genes in the wild-type and transgenetic Arabidopsis plants
 | This work is licensed under a Creative Commons Attribution 4.0 International License, which permits unrestricted use, distribution, and reproduction in any medium, provided the original work is properly cited. |