| Phyton-International Journal of Experimental Botany |
DOI: 10.32604/phyton.2022.017741
ARTICLE
Diversity Assessment of an Endemic Carpinus oblongifolia (Betulaceae) Using Specific-Locus Amplified Fragment Sequencing and Implications for Conservation
Institute of Botany, Jiangsu Province and Chinese Academy of Sciences, Nanjing Botanical Garden Memorial Sun Yat-Sen, Nanjing, 210014, China
*Corresponding Author: Ya Li. Email: yalicnbg@163.com
Received: 02 June 2021; Accepted: 17 August 2021
Abstract: Carpinus oblongifolia is an endemic species and the extant wild populations show a fragmentation distribution in the Baohua Mountain of Jiangsu Province in eastern China. Understanding of genetic diversity plays an important role in C. oblongifolia survival and sustainable development. The wild C. oblongifolia population was artificially divided into four subpopulations according to the microhabitats, and another two subpopulations were constructed by progeny seedlings cultivated with the mature seeds. Then, the leaf buds of 80 individuals from six subpopulations were sampled to develop single nucleotide polymorphisms (SNPs) using specific-locus amplified fragment sequencing (SLAF-seq). Based on these SNPs, we aimed to characterize the genetic diversity and population structure of C. oblongifolia and provide an illumination and reference for effective management of such a small endemic population. The level of genetic diversity was low at the species level, and the progeny subpopulations had a relatively higher genetic diversity than the wild subpopulations. This may be attributed to a high gene flow and an excess heterozygosity to reduce the threat of genetic drift-based hazards. Moreover, the progeny subpopulations had the ability to form new clusters and a great contribution to the genetic structure variation of C. oblongifolia. These results will assist with the development of conservation and management strategies, such as properly evacuating competitive trees to provide more chance for pollen and seed flow in situ conservation, and establishing sufficient seedling plantlets under laboratory conditions for reintroduction to enlarge the effective population size.
Keywords: Carpinus oblongifolia; endemic species; genetic diversity; population structure; SLAF
Carpinus species are very abundant worldwide and approximately 40 species have been reported, of which the majority are from Asia, especially China [1]. Carpinus oblongifolia (Hu) Hu & W. C. Cheng (Betulaceae) is an endemic species, which is only distributed in the Baohua Mountain of Jiangsu Province in eastern China (east longitude 118°58′–119°58′, north latitude 31°37′–32°19′, Fig. 1A according to the records from Flora of China [2]. Baohua Mountain is one of the preserved areas of subtropical vegetation with relatively complete natural ecosystems; the main vegetation types are deciduous evergreen broadleaved mixed forests [3], which contain some endemic, wild rare plant resources such as Yulania zenii (W. C. Cheng) D. L. Fu (Magnoliaceae), an identified ‘critically endangered’ plant species by the China Expert Workshop (2014) in IUCN (https://dx.doi.org/10.2305/IUCN.UK.2014-1.RLTS.T32427A2818816.en). The highest peak of Baohua mountain is 437 m above sea level. According to our recent field investigations, the extant wild C. oblongifolia population distributes at an altitude of 170–300 m along roads, paths and ravines in the northeast hillsides, within an area of 3 km2, with approximately 130 trees [3]. Carpinus oblongifolia is a monoecious deciduous tree (up to 12-m tall), blooms from end March to early April with wind-pollinated flowers and ripens in mid-October with wing-like seeds. Despite the scarcity, this species is not yet among the rare or endangered plants in China for the time being, and its genetic background (essential to create management strategies) has never been studied. The incomplete diameter class structure, especially with insufficient number of seedlings and saplings at the young stage, and the non-dominant importance values in the wood layer indicated that the population structure of C.oblongifolia is unstable [3]. This will affect its long-term survival and evolution in changing environments. Furthermore, only a few wild trees with a high diameter at the breast height were found to produce seeds during our field investigations. The regeneration ability of the progeny will directly affect the population maintenance and development.
Genetic diversity is a fundamental component of biological diversity. Knowledge of the genetic background of a plant species plays an important role in its survival and sustainable development [4], especially for endemic species affected by habitat fragmentation. Habitat fragmentation has been generally recognized as a major threat to plant population survival, and a decreased genetic diversity may limit a species’ ability to adapt to different environmental conditions [5]. Based on previous studies on endemic species, genetic divergences were expected between endemic populations even on small islands [6,7]. Small, isolated populations are particularly vulnerable to the effects of inbreeding, genetic drift and reduced genetic diversity. Genetic diversity is suggested to be the forefront of conservation policies and management [8]. Numerous previous studies have mainly focused on the genetic diversity of fragmented populations. For example, Parrotia subaequalis (H. T. Chang) R. M. Hao & H. T. Wei (Hamamelidaceae), an endemic species distributed in eastern China, is identified as a ‘critically endangered’ plant species in IUCN, and in situ and ex situ conservation plannings were implemented based on genetic data of the population [9,10]. Therefore, understanding the genetic background of C. oblongifolia will help to evaluate and develop its conservation strategies for maintaining the biodiversity and ecosystems of the Baohua Mountain.
Single nucleotide polymorphisms (SNPs) are the most abundant type of genetic markers in most genomes, and are considered an ideal molecular marker for evaluating the genetic background [11]. Next-generation sequencing technology can generate high-density SNP datasets for most analyzed organisms and provide a viable new strategy for studying population genetics [12]. High-throughput specific-locus amplified fragment sequencing (SLAF-seq) is an accurate and cost-effective sequence-based SNP identification method [13,14] that has been conducted on a wide variety of plants since its first use in several varieties of Thinopyrum elongatum (Host) D.R. Dewey (Poaceae) [15]. SNPs can be used to more precisely address DNA variations at the population and individual levels than traditional methods, because SLAF-seq technology deepens sequencing depth and ensures genotyping accuracy [13,16]. This is especially suitable for species without reference genomes and can effectively overcome genomic complexity. In this study, we developed genome-wide SNP markers using SLAF-seq technology for a C. oblongifolia population with 80 individuals of four wild subpopulations and two progeny subpopulations. Genetic diversity and population structure were estimated by 1,267,011 newly developed genome-wide SNPs. Our study aimed to elucidate the genetic background of the C.oblongifolia population, which would provide an illumination and reference for effective management of such a small endemic population.
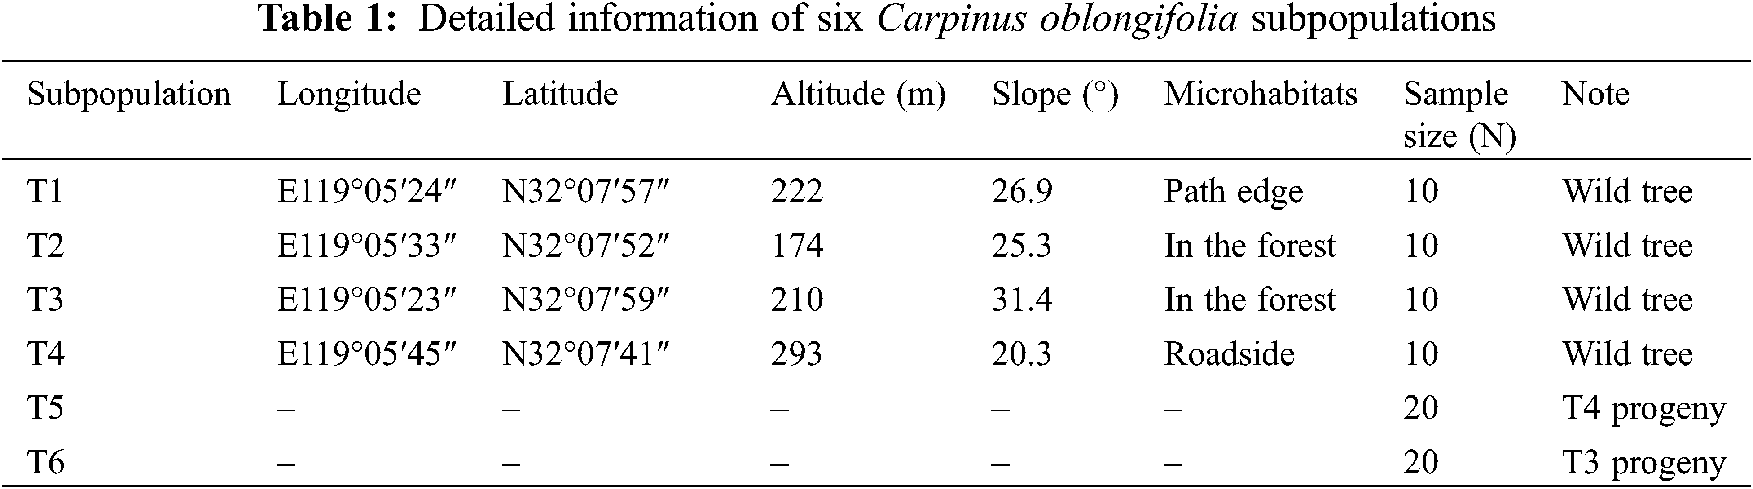
The extant wild C. oblongifolia population was artificially divided into four subpopulations based on the microhabitats in the core of its distribution (Fig. 1B). Then, bulked healthy leaf buds were collected from 10 wild trees (diameter at breast height > 2.5 cm to avoid obvious progeny plants as much as possible) in each subpopulation. A total of 40 wild trees were sampled, which represented nearly one-third of the extant population and these samples were dried in silica gel and stored at −80°C before DNA extraction. On the other hand, mature seeds were collected from one individual wild tree on each T3 and T4 subpopulations in mid-Oct, respectively. Then, these seeds were cultivated at the greenhouse during one year to obtain true progeny seedlings. After 8 months, 20 progeny seedlings from each of the T3 and T4 subpopulations were arbitrarily selected, which were correspondingly named T6 and T5 subpopulations. The leaf buds of these seedlings were sampled separately. Finally, 80 C. oblongifolia individuals including 40 wild trees and 40 progeny seedlings were used for DNA extraction and SLAF-seq analysis. Detailed information on the sampling site is listed in Table 1.

Figure 1: Location of study area. (A) Location of Baohua mountain in Jiangsu province. (B) Location of four wild subpopulations of C. oblongifolia in the core of its distribution
2.2 DNA Extraction and SLAF-Seq
The DNA was isolated via the CTAB protocol [17]. The DNA concentration and quality of all samples were examined using a NanoDrop-2000 UV-Vis spectrophotometer (Thermo, USA), and DNA samples were diluted to 100 ng/µl for SLAF-seq. The isolated genomic DNA was then digested with the restriction enzyme RsaI + EcoRV-HF®, which was used for Juglans regia L. (Juglandaceae) [18], a closest relative-related genus in an all known genomes. The enzyme digestion efficiency was 93.49% using the known genome (Oryza sativa subsp. japonica) as the control. The paired-end mapping of the control genome showed 97.40% of double-end comparison using SOAP (version 2.1.7) [19]. The obtained SLAF tags were linked to Dual-index sequencing adapters and a SLAF sequencing library was constructed according to procedures described by Sun et al. [13] with a few modifications. The paired-end sequencing was performed on the Illumina HiSeq 2500 sequencing platform (Illumina Inc., USA) at Beijing Biomarker Technologies Corporation (Beijing, China).
2.3 Data Processing and SNP Markers Development
The raw output produced by Illumina HiSeq 2500 was further analyzed for each sample using Dual-Index [20]. After adapter sequences were filtered by Fastx–toolkit (version 0.0.13) [21], the data quality was estimated by calculating GC content and Q30 (Q = −10 × log10e; this indicates a 0.1% chance of an error). SLAF tag number and depth of each sample were evaluated. The sample with the most tags was used as the reference. Polymorphic SLAF tags were determined by comparing the sequence variation between different individuals, and were mapped to the reference sequence using the Burrows–Wheeler Alignment (BWA, version 2.1) tool [22]. Alleles were defined in each SLAF by minor allele frequencies > 0.05. SNP markers were identified from polymorphic SLAF tags using GATK (version 4.0) [23] and SAMTOOLS (version 2.6.2) [24]. Only SNP markers called by both methods were considered to have a high consistence in the sequencing population.
After SNP pretreatment, genetic diversity parameters including the number of observed alleles (Ao) and expected alleles (Ae), observed heterozygosity (Ho), expected heterozygosity (He), genetic diversity (Ne), Shannon’s diversity index (I), polymorphism information content (PIC) and inbreeding coefficient (Fis) were calculated for species and each subpopulation using calculation scripts developed by Biomarker Technologies Corporation (Beijing, China). The hierarchical analysis of molecular variance (AMOVA) was estimated and used to partition the genetic variance among subpopulations and within individuals in ARLEQUIN (version 3.5.2.2) [25]. The fixation index (Fst), as a measure of population divergence, was also estimated in ARLEQUIN.
Bayesian clustering was applied to analyze the population structure of the 80 individuals of C. oblongifolia using ADMIXTURE (version 1.3.0) [26]. Based on the same set of SNPs, the number of subgroups (K) was predicted from 1 to 10, and the number of ancestors was determined according to the position of the minimum value, with an error rate obtained from cross-validation (CV). Then, a clustering tree was constructed in MEGA X (version 10.0.2) [27] using the neighbor-joining (NJ) algorithm (Kimura 2-parameter model, 1000 bootstrap replicates) [28]. Principal component analysis (PCA) was also carried out to identify the genetic similarity of the populations using EIGENSOFT (version 5.0.1) [29].
A total of 474.64 Mb of reads were obtained after filtering and removing adaptor sequences from SLAF-seq of the 80 C. oblongifolia individuals. Among these reads, 94.74% of sequencing bases were high-quality with quality scores of 30 (Q30, which indicates a 0.1% error rate), and the average guanine–cytosine (GC) content was 38.09%. The distribution of SLAF tag lengths was shown in Supplementary Fig. 1, and most tags were between 314–364 bp. In the wild subpopulations T1–T4, the number of SLAFs for each individual ranged from 131,315 to 323,600 (average, 187,553), and the SLAF sequencing depth ranged from 18.1-to 68.8-fold (average, 32.8-fold). In the progeny subpopulations T5 and T6, the number of SLAFs for each progeny ranged from 135,042 to 273,972 (average, 175,442), and the SLAF sequencing depth ranged from 16.0-to 36.0-fold (average, 26.0-fold; Supplementary Fig. 2). Altogether, 1,124,547 SLAFs were obtained, of which 222,092 were polymorphic SLAFs (19.7%) with an average sequencing depth of 29.45-fold. SLAF-seq alignment and clustering by both GATK and SAMTOOLS generated a total of 1,267,011 SNPs. Detailed information on the SLAF sequencing and SNP detection results for the 80 C. oblongifolia individuals is shown in Supplementary Table 1.
Based on these high-quality SNPs, genetic parameters were separately estimated to evaluate C. oblongifolia genetic diversity. At the species level, the He and PIC were 0.287 and 0.237, respectively (Table 2). The He and PIC of 40 wild individuals were 0.285 and 0.229, and that of 40 progeny seedlings were 0.317 and 0.257, respectively. At the subpopulation level, T5 (He = 0.341, PIC = 0.275) had the highest genetic diversity, whereas T3 (He = 0.297, PIC = 0.244) had the lowest genetic diversity. The genetic diversity of the wild subpopulations T3 (He = 0.297, PIC = 0.244) and T4 (He = 0.317, PIC = 0.257) was lower than that of their progeny subpopulations T6 (He = 0.332, PIC = 0.268) and T5 (He = 0.341, PIC = 0.275), respectively. Moreover, the Ho was always higher than its He, and all values of Fis were negative in six subpopulations (Table 2).

The hierarchical AMOVA revealed that 5.7% of the total molecular variation was attributed to among subpopulations, and 94.3% to within individuals (P < 0.001, Table 3). In addition, the Fst value was 0.057. Based on the Fst value, the number of migrants per generation (Nm) was 4.114.

Three methods were used to analyze the molecular variation of individual plants to assess the genetic structure of six subpopulations. Firstly, the membership fractions of the 80 C. oblongifolia individuals were estimated (K ranged from 1 to 10), and the results showed an optimum value of K = 3 according to cross-validation (CV) errors. Comparison of population structures of the 80 individuals when K = 3 showed that most individuals from T1–T3 subpopulations clustered together, most individuals from T4 and T5 subpopulations clustered together, and the individuals of the T6 subpopulation formed another cluster (Fig. 2). Groups 1–3 included 35, 31 and 14 individuals, respectively (Table 4). Secondly, the NJ clustering tree showed two major groups (Fig. 3A). Group 1 included T1, T2, T3 and T6 subpopulations, and Group 2 contained T4 and T5 subpopulations. Finally, PCA separated the 80 individuals into two clusters (Fig. 3B). One cluster was made up of T1–T3 and T6 subpopulations, and the other cluster was mainly composed of T4 and T5 subpopulations.

Figure 2: Analysis results of population structure. The estimated number of groups through cross-validation (CV) errors (K from 1 to 10) and the variation pattern of six subpopulations when K = 3. Different colors indicated different clustered groups

Figure 3: Characterization of the genetic structure of 80 C. oblongifolia individuals. (A) Phylogenetic tree of the 80 individuals based on analysis of the 1,267,011 SNPs. The number in the figure represent the branch length. (B) PCA plot of the six subpopulations based on analysis of 1,267,011 SNPs

Further analysis found that the Group 3 identified by ADMIXTURE analysis was integrated into the Group 1 in the NJ clustering tree and PCA analysis. Moreover, the group 3 by ADMIXTURE analysis were mostly from the T6 and T3 progeny subpopulations (Table 4). Therefore, the genetic structure of T1–T4 subpopulations, T3 and its progeny T6 subpopulations, T4 and its progeny T5 subpopulations, was separately analyzed. Four wild subpopulations showed an optimum value of K = 1 and one group of PCA plot (Fig. 4), T3 and its progeny T6 subpopulations displayed an optimum value of K = 2 and two clusters of PCA plot (Fig. 5), and T4 and its progeny T5 subpopulations showed an optimum value of K = 1 and one group of PCA plot (Fig. 6).

Figure 4: Variation in the genetic structure of four wild C. oblongifolia subpopulations. (A) Estimated K value based on cross-validation errors. (B) PCA plot of the four subpopulations

Figure 5: Variation in the genetic structure of T3 and its progeny T6 subpopulations. (A) The estimated K value ranged from 1 to 10 based on cross-validation errors. (B) PCA plot of all individuals in the T3 and its progeny (T6) subpopulations

Figure 6: Variation in the genetic structure of T4 and its progeny T5 subpopulations. (A) The estimated K value ranged from 1 to 10 based on cross-validation errors. (B) PCA plot of all individuals in the T4 and its progeny (T5) subpopulations
4.1 SNP-Marker Development Using SLAF-Seq
In this study, 80 C. oblongifolia individuals were analyzed by SLAF-seq with an average sequencing depth of 29.45-fold and Q30 value of 94.74%. This is the first application of SLAF-seq in Carpinus, a genus with no reference genome. Finally, a total of 1,267,011 SNPs were identified from the 222,092 polymorphic SLAFs. The number of SNPs identified from genome-wide range far exceeded the number of polymorphisms detected using traditional methods in Carpinus, such as fewer than 200 polymorphic bands in AFLP analyzing the genetic diversity of Carpinus laxiflora (Siebold & Zucc.) Blume (Betulaceae) [30] and Carpinus betulus L. (Betulaceae) [31] populations. The molecular markers density of SLAF-seq indicates its superiority in analyzing genetic backgrounds, which satisfied the need in assessment of genetic diversity and population structure.
Genetic diversity can reflect the potential of plants to adapt to environmental changes, and reveal the biodiversity and maintenance mechanisms of ecosystem functions. At the species level, the genetic diversity of 80 examined C. oblongifolia (He = 0.287) was lower than that of C. betulus using SSR technology (He = 0.309) [32] and AFLP markers (Hj = 0.333) [31] , and that of C. laxiflora based on microsatellite markers (He = 0.780) [33]. Moreover, compared with other endemic species, the He value of C. oblongifolia (He = 0.287) was lower than that of Parrotia subaequalis (He = 0.464) [10] and Sinojackia rehderiana Hu (Styracaceae) (He = 0.782) [34], and also lower than that of perennial (He = 0.650) and wind-dispersed (He = 0.610) endemic species [35]. Genetic diversity of a species is correlated with its geographic distribution, life form, breeding system, seed dispersal, gene flow, natural selection, and habitat fragmentation [36]. The relatively low level of genetic diversity in C. oblongifolia is probably attributed to its extremely narrow distribution, because the genetic diversity of species in small populations is lower than in large populations under influence of genetic drift and inbreeding [37,38].
However, the progeny subpopulations of C. oblongifolia had a relatively higher genetic diversity than the wild subpopulations (Table 2), even though the progeny seedlings were clearly derived from only one wild tree. It is possible that gene flow is responsible for the diversity within populations, because wind-pollinated plants have evolved a higher outcrossing rate than animal- or insect-pollinated species [39]. Pollen dispersal ability of wind-pollinated C. laxiflora is higher than that of insect-pollinated Magnolia obovata Thunberg (Magnoliaceae), although they have common migration histories in the same area [30]. Previous studies have indicated that species of Betulaceae are predominately outcrossing [40]. Moreover, the significantly negative values for Fis in wild trees and progeny seedlings demonstrated a higher excess heterozygosity than expected (Table 2). This was obviously different from that of C. laxiflora (Fis = 0.618), another species of the same genus [30]. Heterozygotes produced by frequent gene exchange might increase the genetic diversity in a population and reduce the incidence of deleterious gene homozygosity from inbreeding, because the breeding system has been shown to be a major determinant of plant genetic diversity [41]. Therefore, high gene flow and excess heterozygosity might be the features of C. oblongifolia, which help maintain the genetic diversity and reduce the threat of genetic drift-based hazards, such as the depletion of genetic variation and inbreeding depression.
Outcrossing system can guarantee that a few migrants per generation are sufficient to counter genetic differentiation [42]. These outcrossing species are generally characterized by low genetic differentiation between populations, as Carpinus. The Fst value reflecting genetic differentiation was 0.057 among C. oblongifolia subpopulations, which was even lower than that in C. laxiflora (Fst = 0.060) [30], C. betulus (Fst = 0.074) , and Carpinus orientalis Mill (Betulaceae) (Fst = 0.086) [31]. This was supported by the fact that genetic variation was mainly attributed to individual differences (Table 2). The difference among individuals was consistent with the high levels of gene flow among populations (Nm = 4.114). A high Nm may facilitate gene exchange between populations, which effectively inhibits genetic differentiation caused by genetic drift. Gene flow is a critical determinant of population genetic structure. In the analysis of genetic structure of three different methods, T4 subpopulation and its progeny T5 subpopulation always clustered together to form an independent group. The number of groups in ADMIXTURE analysis were one more than that in NJ clustering tree and PCA analysis, but the new cluster was mainly composed of the T6 subpopulation. Further analysis confirmed that the progeny T6 subpopulation had the ability to form new cluster. That is, the progeny seedlings have a great contribution to the genetic structure variation of C. oblongifolia. Moreover, Ho was always higher than He, which indicated that C. oblongifolia could have experienced genetic bottlenecks [43]. The relatively narrow genetic background of C. oblongifolia, a limit number of parents, and the founder effect could lead to chain unevenness imbalance. Thus, it is feasible to enlarge the effective population of C. oblongifolia through more progeny seedlings to maintain health development and genetic diversity of the population.
4.4 Implications for Conservation and Management
Baohua Mountain was designated as a provincial nature reserve by the government of Jiangsu Province, which provides a certain amount of protection to these plants and their habitats; however, it is clearly insufficient, because threats are still present due to human activities. In addition, not much action has been taken yet, which creates uncertainty regarding the future viability of this endemic species. This indicates a need to construct a management plan.
Undoubtedly, in situ conservation is the most effective method to conserve species resources [44,45]. According to investigations, C. oblongifolia distributes fragmentated in mixed evergreen and deciduous broadleaved forests with a non-dominant importance value in the wood layer [3]. This makes it difficult for the pollen and seeds of C. oblongifolia to disperse over long distances in the forests, even though its seeds are small with wing-like structures that theoretically allow them to be dispersed over long distances to increase effective population size. However, the features of high gene flow and excess heterozygosity in C. oblongifolia population would help maintain the genetic diversity. The progeny subpopulations had a relatively higher genetic diversity than the wild subpopulations and had a great contribution to the genetic structure variation. However, the supply of sapling and seedlings in the extant wild population is really insufficient [3] and only few wild trees with higher diameter at breast height can grow seeds. Therefore, we suggest that the competitive trees should be properly evacuated to provide more chance for pollen and seed flow of C. oblongifolia to improve effective gene exchange. This consideration is especially important for in situ conservation because gene flow by pollen and seeds has considerable potential as an evolutionary force. Moreover, a detailed investigation that should be made is the further analysis of the environmental conditions that allow seedling and sapling establishment to provide an opportunity for the natural regeneration of the C. oblongifolia population.
In ex situ measures now underway, seeds are stored and living plants are grown at Nanjing Botanical Garden Mem. Sun Yat-sen, where is near Baohua Mountain. The relatively higher genetic diversity in the progeny subpopulations indicated that the replenishment of more seedling plants could enlarge the effective population size. Considering that there are only few saplings and seedlings in the extant wild population, seed quality and germination tests were conducted in the same research institute, which showed that the viability of seeds was very low. Therefore, we recommend that seeds should be collected as much as possible to cultivate sufficient seedling under laboratory conditions. Then these plantlets could be reintroduced to Baohua Mountain or located in neighboring nature reserves to enlarge the effective population size. Additional, different biotechnological approaches could be applied for conservation of endemic species [46]. The genetic diversity within the reintroduction population might be higher than that in its source population as reported in previous studies [47,48].
Acknowledgement: We are grateful to the Management Committee of Baohua National Forest Park for their assistance in collecting samples in the field. We thank Xiangdong Ma for his great help in collecting plant materials. We thank Mallory Eckstut, Ph. D., from Liwen Bianji, Edanz Editing China (www.liwenbianji.cn/ac), for editing the English text of a draft of this manuscript.
Availability of Data and Materials: All raw data files are available from the NCBI database (SRA Accession No. PRJNA650558).
Authors’ Contributions Conception and Design: YL, QW, SL; experiments: PW, SW, RY; data analysis: SL, PW and QW; writing: SL; revisions: all authors.
Funding Statement: This work was funded by the Full-Cover Conservation Plan of Native Plant Species in China (KFJ-3W-No1-141) and the Open Fund of Jiangsu Key Laboratory for Research and Utilization of Plant Resources (JSPKLB201844).
Conflicts of Interest: The authors declare that they have no conflicts of interest to report regarding the present study.
1. Jeon, J. I., Chang, C. S., Chen, Z. D., Park, T. Y. (2007). Systematic aspects of foliar flavonoids in subsect. Carpinus (Carpinus, Betulaceae). Biochemical Systematics and Ecology, 35, 606–613. DOI 10.1016/j.bse.2007.04.004. [Google Scholar] [CrossRef]
2. Flora of China (2019). Carpinus Linnaeus, 2019; Sp. Pl. 2: 998. 1753. 4, 296. http://www.efloras.org/florataxon.aspx?flora_id=2&taxon_id=210000178. [Google Scholar]
3. Li, S., Wang, Q., Wang, S., Wang, P., Li, Y. (2020). Analysis on population status of Carpinus oblongifolia in Baohua Mountain of Jiangsu province. Journal of Plant Resources and Environment, 29, 52–58. DOI 10.3969/j.issn.1674-7865.2020.01.07. [Google Scholar] [CrossRef]
4. Frankham, R. (2010). Where are we in conservation genetics and where do we need to go? Conservation Genetics, 11, 661–663. DOI 10.1007/s10592-009-0010-2. [Google Scholar] [CrossRef]
5. Young, A., Boyle, T., Brown, T. (1996). The population genetic consequences of habitat fragmentation for plants. Trends in Ecology and Evolution, 11, 413–418. DOI 10.1016/0169-5347(96)10045-8. [Google Scholar] [CrossRef]
6. Mallet, B., Martos, F., Blambert, L., Pailler, T., Humeau, L. (2014). Evidence for isolation-by-habitat among populations of an epiphytic orchid species on a small oceanic island. PLoS One, 9, e87469. DOI 10.1371/journal.pone.0087469. [Google Scholar] [CrossRef]
7. Garot, E., Joët, T., Combes, M. C., Lashermes, P. (2019). Genetic diversity and population divergences of an indigenous tree (Coffea mauritiana) in Reunion Island: Role of climatic and geographical factors. Heredity, 122, 833–847. DOI 10.1038/s41437-018-0168-9. [Google Scholar] [CrossRef]
8. Hoban, S. M., Hauffe, H. C., Pérez-Espona, S., Arntzen, J. W., Brufford, M. et al. (2013). Bringing genetic diversity to the forefront of conservation policy and management. Conservation Genetics Resources, 5, 593–598. DOI 10.1007/s12686-013-9859-y. [Google Scholar] [CrossRef]
9. Geng, Q., Yao, Z., Yang, J., He, J., Wang, D. et al. (2015). Effect of Yangtze River on population genetic structure of the relict plant Parrotia subaequalis in eastern China. Ecology and Evolution, 5, 4617–4627. DOI 10.1002/ece3.1734. [Google Scholar] [CrossRef]
10. Zhang, Y. Y., Shi, E., Yang, Z. P., Geng, Q. F., Qiu, Y. X. et al. (2018). Development and application of genomic resources in an endangered palaeoendemic tree, Parrotia subaequalis (Hamamelidaceae) from eastern China. Frontier in Plant Science, 9, 246. DOI 10.3389/fpls.2018.00246. [Google Scholar] [CrossRef]
11. Liu, J., Huang, S., Sun, M., Liu, S., Liu, Y. et al. (2012). An improved allele-specific PCR primer design method for SNP marker analysis and its application. Plant Methods, 8(1), 34. DOI 10.1186/1746-4811-8-34. [Google Scholar] [CrossRef]
12. Davey, J. W., Hohenlohe, P. A., Etter, P. D., Boone, J. Q., Catchen, J. M. et al. (2011). Genome-wide genetic marker discovery and genotyping using next-generation sequencing. Nature Reviews Genetics, 12, 499–510. DOI 10.1038/nrg3012. [Google Scholar] [CrossRef]
13. Sun, X., Liu, D., Zhang, X., Li, W., Liu, H. et al. (2013). SLAF-seq: An efficient method of large-scale de novo SNP discovery and genotyping using high-throughput sequencing. PLoS One, 6, e58700. DOI 10.1371/journal.pone.0058700. [Google Scholar] [CrossRef]
14. Zhang, Y., Wang, L., Xin, H., Li, D., Ma, C. et al. (2013). Construction of a high-density genetic map for sesame based on large scale marker development by specific length amplified fragment (SLAF) sequencing. BMC Plant Biology, 13, 141. DOI 10.1186/1471-2229-13-141. [Google Scholar] [CrossRef]
15. Chen, S., Huang, Z., Dai, Y., Qin, S., Gao, Y. et al. (2013). The development of 7E chromosome-specific molecular marker for Thinopyrum elongatum based on SLAF-seq technology. PLoS One, 8, e65122. DOI 10.1371/journal.pone.0065122. [Google Scholar] [CrossRef]
16. Sims, D., Sudbery, I., Ilott, N., Heger, A., Ponting, C. (2014). Sequencing depth and coverage: Key considerations in genomic analyses. Nature Reviews Genetics, 15, 121–132. DOI 10.1038/nrg3642. [Google Scholar] [CrossRef]
17. Doyle, J. J., Doyle, J. L. (1987). A rapid DNA isolation procedure for small quantities of fresh leaf tissue. Phytochemical Bulletin, 19, 11–15. [Google Scholar]
18. Martínez-García, P. J., Crepeau, M. W., Puiu, D., Gonzalez-Ibeas, D., Whalen, J. et al. (2016). The walnut (Juglans regia) genome sequence reveals diversity in genes coding for the biosynthesis of nonstructural polyphenols. Plant Journal, 87, 507–532. DOI 10.1111/tpj.13207. [Google Scholar] [CrossRef]
19. Li, R., Yu, C., Li, Y., Lam, T. W., Yiu, S. M. et al. (2009). SOAP2: An improved ultrafast tool for short read alignment. Bioinformatics, 25, 1966–1967. DOI 10.1093/bioinformatics/btp336. [Google Scholar] [CrossRef]
20. Kozich, J. J., Westcott, S. L., Baxter, N. T., Highlander, S. K., Schloss, P. D. (2013). Development of a dual-index sequencing strategy and curation pipeline for analyzing amplicon sequence data on the MiSeqIllumina sequencing platform. Applied and Environmental Microbiology, 79, 5112–5120. DOI 10.1128/AEM.01043-13. [Google Scholar] [CrossRef]
21. Gordon, A., Hannon, G. J. (2010). Fastx-toolkit. FASTQ/A short-reads preprocessing tools unpublished. http://hannonlabcshledu/fastx_toolkit. [Google Scholar]
22. Li, H., Durbin, R. (2009). Fast and accurate short read alignment with Burrows-Wheeler transform. Bioinformatics, 25(14), 1754–1760. DOI 10.1093/bioinformatics/btp324. [Google Scholar] [CrossRef]
23. McKenna, A., Hanna, M., Banks, E., Sivachenko, A., Cibulskis, K. et al. (2010). The genome analysis toolkit: A MapReduce framework for analyzing next-generation DNA sequencing data. Genome Research, 20(9), 1297–1303. DOI 10.1101/gr.107524.110. [Google Scholar] [CrossRef]
24. Li, H., Handsaker, B., Wysoker, A., Fennell, T., Ruan, J. et al. (2009). The sequence alignment/map format and SAMtools. Bioinformatics, 25(16), 2078–2079. DOI 10.1093/bioinformatics/btp352. [Google Scholar] [CrossRef]
25. Excoffier, L., Laval, G., Schneider, S. (2005). Arlequin (version 3.0An integrated software package for population genetics data analysis. Evolutionary Bioinformatics, 1, 47–50. DOI 10.1177/117693430500100003. [Google Scholar] [CrossRef]
26. Alexander, D. H., Novembre, J., Lange, K. (2009). Fast model-based estimation of ancestry in unrelated individuals. Genome Research, 19(9), 1655–1664. DOI 10.1101/gr.094052.109. [Google Scholar] [CrossRef]
27. Kumar, S., Stecher, G., Li, M., Knyaz, C., Tamura, K. (2018). MEGA X: Molecular evolutionary genetics analysis across computing platforms. Molecular Biology and Evolution, 35, 1547–1549. DOI 10.1093/molbev/msy096. [Google Scholar] [CrossRef]
28. Saitou, N., Nei, M. (1987). The neighbor-joining method: A new method for reconstructing phylogenetic trees. Molecular Biology and Evolution, 4, 406–425. DOI 10.1093/oxfordjournals.molbev.a040454. [Google Scholar] [CrossRef]
29. Price, A. L., Patterson, N. J., Plenge, R. M., Weinblatt, M. E., Shadick, N. A. et al. (2006). Principal components analysis corrects for stratification in genome-wide association studies. Nature Genetics, 38, 904–909. DOI 10.1038/ng1847. [Google Scholar] [CrossRef]
30. Ahn, J., Lee, J., Lee, M., Hong, K. (2019). Genetic diversity and structure of Carpinus laxiflora populations in South Korea based on AFLP markers. Forest Science and Technology, 15, 192–201. DOI 10.1080/21580103.2019.1666748. [Google Scholar] [CrossRef]
31. Coart, E., van Glabeke, S., Petit, R. J., van Bockstaele, E., Roldán-Ruiz, I. (2005). Range wide vs. local patterns of genetic diversity in hornbeam (Carpinus betulus L.). Conservation Genetics, 6, 259–273. DOI 10.1007/s10592-004-7833-7. [Google Scholar] [CrossRef]
32. Cărăbuṣ, M., Leinemann, L., Curtu, A. L., Ṣofletea, N. (2015). Preliminary results on the genetic diversity of Carpinus betulus in carpathian populations. Bulletin of the Transilvania University of Braşov Series II, 8, 1–6. [Google Scholar]
33. Tono, A., Iwasaki, T., Seo, A., Murakami, N. (2016). Postglacial lineage admixture in the contact zones of the two Japanese deciduous broad-leaved tree species estimated by nuclear microsatellite and chloroplast DNA markers. Acta Phytotaxonomica et Geobotanica, 67, 1–16. DOI 10.18942/apg.KJ00010238482. [Google Scholar] [CrossRef]
34. Yao, X., Zhang, J., Ye, Q., Huang, H. (2011). Fine-scale spatial genetic structure and gene flow in a small, fragmented population of Sinojackia rehderiana (Styracaceaean endangered tree species endemic to China. Plant Biology, 13, 401–410. DOI 10.1111/j.1438-8677.2010.00361.x. [Google Scholar] [CrossRef]
35. Nybom, H. (2004). Comparison of different nuclear DNA markers for estimating intraspecific genetic diversity in plants. Molecular Ecology, 13, 1143–1155. DOI 10.1111/j.1365-294X.2004.02141.x. [Google Scholar] [CrossRef]
36. Hamrick, J. L., Godt, M. J. W. (1996). Effects of life history traits on genetic diversity in plant species. Philosophical Transactions of the Royal Society B Biological Science, 351, 1291–1298. DOI 10.1098/rstb.1996.0112. [Google Scholar] [CrossRef]
37. Willi, Y., van Buskirk, J., Hoffmann, A. A. (2006). Limits to the adaptive potential of small populations. Annual Review of Ecology Evolution and Systematics, 37, 433–458. DOI 10.2307/30033839. [Google Scholar] [CrossRef]
38. Li, Y. Y., Guan, S. M., Yang, S. Z., Luo, Y., Chen, X. Y. (2012). Genetic decline and inbreeding depression in an extremely rare tree. Conservation Genetics, 13, 343–347. DOI 10.1007/s10592-011-0286-x. [Google Scholar] [CrossRef]
39. Goodwillie, C., Kalisz, S., Eckert, C. G. (2005). The evolutionary enigma of mixed mating systems in plants: Occurrence, theoretical explanations and empirical evidence. Annual Review of Ecology Evolution and Systematics, 36, 47–79. DOI 10.1146/annurev.ecolsys.36.091704.175539. [Google Scholar] [CrossRef]
40. Xie, C. Y., El-Kassaby, Y. A., Ying, C. C. (2002). Genetics of red alder (Alnus Rubra Bong.) populations in British Columbia and its implications for gene resources management. New Forests, 24, 97–112. DOI 10.1023/A:1021230427110. [Google Scholar] [CrossRef]
41. Glemin, S., Bazin, E., Charlesworth, D. (2006). Impact of mating systems on patterns of sequence polymorphism in flowering plants. Proceedings of the Royal Society B-Biological Sciences, 273, 3011–3019. DOI 10.1098/rspb.2006.3657. [Google Scholar] [CrossRef]
42. Holsinger, K. E., Weir, B. S. (2009). Genetics in geographically structured populations: Defining, estimating and interpreting FST. Nature Reviews Genetics, 10, 639–650. DOI 10.1038/nrg2611. [Google Scholar] [CrossRef]
43. Maruyama, T., Fuerst, P. A. (1985). Population bottlenecks and non equilibrium models in population genetics. II. Number of alleles in a small population that was formed by a recent bottleneck. Genetics, 111, 675–689. PMID 4054612. [Google Scholar]
44. Peng, Y. Q., Fan, L. L., Mao, F. Y., Zhao, Y. S., Xu, R. et al. (2018). Genetic diversity and population structure of a protected species: Polygala tenuifolia willd. Comptes Rendus Biologies, 341, 152–159. DOI 10.1016/j.crvi.2018.01.007. [Google Scholar] [CrossRef]
45. Shen, S., Wang, Y., Wang, B., Ma, H., Shen, G. (2009). Distribution, stand characteristics and habitat of a critically endangered plant Euryodendron excelsum H. T. Chang (TheaceaeImplications for conservation. Plant Species Biology, 24, 133–138. DOI 10.1111/j.1442-1984.2009.00248.x. [Google Scholar] [CrossRef]
46. Jha, P., Chahal, S., Pandey, D. K., Singh, J., Prasad, R. et al. (2020). Conservation strategy for African medicinal species: In vitro biotechnological approach. Phyton-International Journal of Experimental Botany, 89(4), 779–794. DOI 10.32604/phyton.2020.09421. [Google Scholar] [CrossRef]
47. Alonso, M. A., Guilló, A., Pérez-Botella, J., Crespo, M. B., Juan, A. (2014). Genetic assessment of population restorations of the critically endangered Silene hifacensis in the Iberian Peninsula. Journal for Nature Conservation, 22, 532–538. DOI 10.1016/j.jnc.2014.08.007. [Google Scholar] [CrossRef]
48. Olvera-Mendoza, E. I., Lara-Cabrera, S. I., Sáenz-Romero, C., Lindig-Cisneros, R. (2016). AFLP polymorphism in restored provenances of Ceiba aesculifolia within an urban heat island. Phyton-International Journal of Experimental Botany, 85, 169–175. DOI 10.32604/phyton.2016.85.169. [Google Scholar] [CrossRef]
Supplementary Materials

Supplementary Figure 1: The length distribution of the SLAF tags. The abscissa represents the insertion fragment with different length. The ordinate represents the reads percentage

Supplementary Figure 2: Number and depth of SLAFs in wild and progeny populations. Horizontal axes in A and B indicate individual plants represented by different colors: orange, 40 wild population individuals; blue, 40 progeny population individuals. The vertical axes indicate the number and average depth of SLAFs in A and B, respectively

 | This work is licensed under a Creative Commons Attribution 4.0 International License, which permits unrestricted use, distribution, and reproduction in any medium, provided the original work is properly cited. |