| Phyton-International Journal of Experimental Botany |
DOI: 10.32604/phyton.2022.017881
ARTICLE
Effects of High-Temperature Stress on Photosynthetic Characteristics and Antioxidant Enzyme System of Paeonia ostii
1College of Horticulture and Plant Protection, Yangzhou University, Yangzhou, 225009, China
2Joint International Research Laboratory of Agriculture and Agri-Product Safety, The Ministry of Education of China, Yangzhou University, Yangzhou, 225009, China
*Corresponding Author: Jun Tao. Email: taojun@yzu.edu.cn
Received: 14 June 2021; Accepted: 10 August 2021
Abstract: Paeonia ostii is an economically important oil crop, which has been widely cultivated in the middle and lower reaches of the Yangtze River in China in recent years. Although P. ostii is highly adaptable to the environment, the prolonged high summer temperature in this region severely inhibits its growth, which adversely affects seed yield and quality. In this study, P. ostii plants were subjected to 20°C/15°C (day/night) and 40°C/35°C (day/night) temperatures for 15 days. The changes in physiological and biochemical indicators of P. ostii under high-temperature stress were initially investigated. The results showed that with the deepening of leaf etiolation, chlorophyll a and chlorophyll b concentration, carotenoid concentration, Soil Plant Analysis Development (SPAD) values and leaf relative water content decreased significantly, while both relative electrical conductivity (REC) and free proline concentration showed an upward trend. Meanwhile, the continuous accumulation of reactive oxygen species (ROS) in P. ostii plants, led to an increased activity of antioxidant enzymes including superoxide dismutase (SOD), peroxidase (POD), catalase (CAT) and ascorbate peroxidase (APX). Moreover, with the extension of the high-temperature treatment, the anatomical structures of P. ostii were destroyed, resulting in a decreased photochemical efficiency of the photosystem II (PSII) reaction center and photosynthesis was inhibited. Taken together, these results provide reference values for understanding the physiological response of P. ostii to high-temperature stress and establish a foundation for further research on the relevant underlying molecular mechanisms.
Keywords: Antioxidant enzymes; membrane damage; photosynthesis; reactive oxygen species
The continuous progression of modern human civilization is accompanied by the burning of a large number of fossil fuels, which increases the concentration of greenhouse gas and has led to global warming [1]. In 2011, the US Environmental Protection Agency indicated that global temperatures could rise by 2.23–6.63°C by the 21st century [2]. High temperature has been considered a common abiotic stress, that can adversely affect plant growth and development [3]. Plants can rapidly sense changes in environmental temperature and respond quickly [4]. Plants exposed to high temperatures for long periods of time will develop physiological disorders, leading to an impaired growth and development. Similar to other abiotic stresses, high temperature can cause leaf curling, leaf folding, and dehydration of plants [5]. Additionally, the oxidation of proteins, lipids and nucleic acids under high temperatures leads to cellular damage, which is a direct consequence of excessive production of reactive oxygen species (ROS) [6]. ROS includes free radicals, such as singlet oxygen (1O2·), superoxide anion free radical (O2·−) and hydroxyl radicals (OH·), and non-free radicals, mainly hydrogen peroxide (H2O2), which lead to wilting and scorching of leaves, decreased photosynthesis, reduced biomass, damage to the cell membrane system and, in severe cases, plant death [7,8]. Therefore, high temperature has been the strongest constraint of crop production worldwide [9].
Paeonia ostii, with Yangshan peony as the original cultivar, is a perennial deciduous shrub native to China [10]. As a traditional medicinal plant, P. ostii has been cultivated for more than 1500 years [11]. Paeonol is not only widely used as a nutritional supplement in traditional Chinese medicine, but also effectively reduces neuroinflammation and has antioxidant effects [12]. Additionally, P. ostii has high oil value and was selected as one of the designated important woody oil crop cultivars by the Ministry of Health in 2011. P. ostii seeds yield more than 27% oil, comprising more than 90% unsaturated fatty acids (UFAs), in which the concentration of alpha-linolenic acid (ALA) is more than 40% [13]. These data indicate that peony oil is a nutritious edible oil. P. ostii is heliophilous but thermolabile and suitable for both dry-cold and wet-warm climate conditions [14]. In the middle and lower reaches of the Yangtze River in China, the high light and high temperature in the summer hinder the growth and development of P. ostii and severely reduce the yield of P. ostii seed oil.
Most P. ostii research is devoted only to cultivation techniques and the production of seed oil [12,13,15], while physiological responses of P. ostii to high-temperature stress have rarely been reported. In this experiment, potted seedlings of P. ostii were studied and we evaluated the physiological response of P. ostii to high temperature, including the plant phenotype, chloroplast pigment concentrations, leaf relative water content, accumulation of ROS, relative electrical conductivity (REC), free proline concentration, antioxidant enzyme activities, photosynthetic characteristics, chlorophyll fluorescence parameters and leaf ultrastructure. The aim was to elucidate the physiological response of P. ostii to high-temperature stress and to provide a theoretical basis for P. ostii cultivation and management under high temperatures.
2.1 Plant Materials and Treatments
In this study, three-year-old potted P. ostii with robust and consistent growth were used as materials, and the cultivation substrate was a mixture of loam, peat and perlite at a ratio of 1:1:1. The P. ostii plants were divided into two groups of 6 pots each and put in growth chambers. As the control, one group was placed in a chamber with a daytime temperature of 20°C and a nighttime temperature of 15°C. The other group was placed in a chamber with a daytime temperature of 40°C and a nighttime temperature of 35°C. The relative humidity in both groups was 60%. The light intensity was 30,000 lx for 14 h (5:00–19:00) during the day, and it was 0 lx for 10 h (19:00–5:00) at night. Water was supplied adequately during treatment. Data measurement and sample collection were carried out at 0, 5, 10 and 15 days after treatment, and three P. ostii plants were randomly selected for each treatment as replicates. After the photosynthetic characteristics and chlorophyll fluorescence parameters were measured, the leaves were frozen immediately in liquid nitrogen, after which the samples were stored at −80°C for measurements of other relevant indicators.
2.2 Chloroplast Pigment Concentrations and SPAD Values
The chloroplast pigment concentrations were measured according to Zou [16]. First, 0.2 g (W) fresh leaves were weighed and 12 mL of 95% ethanol was then added, and the leaves were ground until the tissue turned white. The solution was then filtered through filter paper into a 25 mL brown volumetric flask. The filter paper and residue were rinsed several times until no residue remained. Finally, ethanol was added to stabilize the volume and shaken well. The absorbance values of chloroplast pigment extracts (A665, A649 and A470, corresponding to wavelengths of 665, 649 and 470 nm, respectively) were determined. The concentrations of chlorophyll a (Ca), chlorophyll b (Cb) and carotenoids (CX·c) (mg·L−1) were calculated according to the following formulas: Ca = 13.95A665-6.88A649, Cb = 24.96A649-7.32A665, and CX·c = (1000A470-2.05 Ca-114.8 Cb)/245. Then, the concentration of each pigment in the tissue was expressed as mg·g−1 of fresh weight (FW) and calculated according to the following formulas: chlorophyll a concentration = Ca × V/FW, chlorophyll b concentration = Cb × V/FW, chlorophyll (a + b) concentration = C(a+b) × V/FW, and carotenoid concentration = CX·c × V/FW.
Three P. ostii plants were randomly selected, and the Soil Plant Analysis Development (SPAD) values of the three top leaves were obtained using a SPAD-502 portable chlorophyll sensing instrument (Koinca Minolia Sensing, Japan). Three parts of each leaf were selected to avoid the main vein for measurement. The average value was considered one replicate.
2.3 Leaf Relative Water Content
First, fresh leaves were weighed on an analytical balance (Gandg Testing Instrument Factory, Changshou, China), the results of which were denoted as the fresh weight (FW). Then, the leaves were then placed in an oven (Jinghong Laboratory Instrument Co., Ltd., Shanghai, China) at 105°C for 5 min followed by 65°C until a constant weight was reached. Finally, the leaves were weighed, which was recorded as the dry weight (DW). The leaf relative water content (%) was then calculated as (FW-DW)/FW × 100% [17].
The accumulation of H2O2 was observed by diaminobenzidine (DAB) staining [18]. A 0.1 mg/mL pH 5.0 DAB staining solution was prepared with 50 mM Tris-acetate buffer. Fresh leaves were immersed in the dye solution in the dark for 24 h. Then, the leaves were put into 95% alcohol in a boiling water bath for 15 min, after which, the leaves were removed for imaging.
The accumulation of O2·− was observed by a reagent kit (Shanghai Haling Biotechnology Co., Ltd., China). First, fresh leaves were cut quickly with a double-sided blade, avoiding the main veins, after which the samples were cleaned with distilled water on a slide. Then, 10 μL of dihydroethidium (DHE) fluorescent dye was added. The samples were subsequently incubated at 37°C in the dark for 20 min. Finally, a fluorescence microscope (Axio Imager D2, ZEISS, Germany) was used to observe and image the samples.
REC was determined according to the methods reported by Xu et al. [19]. Fresh leaves were cleaned with deionized water, and then a hole puncher with a diameter of 1 cm was used to punch holes in the leaves to obtain small leaf discs. The discs (0.1 g) were weighed and placed into a syringe containing deionized water. After vacuuming, the leaves and 20 mL of deionized water were added to a glass tube. The glass tube was incubated for 4 h at room temperature, and thoroughly shaken, and the initial solution conductivity (C1) was measured by using a conductivity meter (DDS–307-A, Ray Magnetic Instrument Co., Ltd., Shanghai, China). Then, the glass tube was heated in a boiling water bath for 30 min to measure the conductivity (C2). The REC (%) was calculated as C1/C2 × 100%. Each treatment was replicated 3 times.
2.6 Free Proline Concentration and Antioxidant Enzyme Activities
The free proline concentration and the activity of 4 antioxidant enzymes, superoxide dismutase (SOD), peroxidase (POD), catalase (CAT) and ascorbate peroxidase (APX) were measured using reagent kits (Suzhou Comin Biotechnology Co., Ltd., China).
2.7 Photosynthetic Characteristics and Chlorophyll Fluorescence Parameters
Photosynthetic characteristics were determined using a portable photosynthesis system (LI-6400, Li-Cor, Lincoln, USA). Three healthy, actively growing leaves were selected for measurements and marked, and the measurements were performed between 8:00 and 9:00 am local time. The net photosynthetic rate (Pn), stomatal conductance (Gs), intercellular CO2 concentration (Ci) and transpiration rate (Tr) were recorded separately.
A chlorophyll fluorescence spectrometer (Heinz Walz GmbH, Germany) was used to measure chlorophyll fluorescence parameters after the plants were subjected to darkness for more than 2 h. The data processing software PAM Win was used to measure and calculate the maximum quantum yield of photosystem II (PSII) photochemistry (variable fluorescence from dark-adapted leaf (Fv)/maximum fluorescence from dark-adapted leaf (Fm)), the effective quantum yield of PSII photochemistry (Y (II)), the nonphotochemical quenching coefficient (qN) and the quantum yield of nonregulated energy dissipation (Y(NO)) [20,21].
Anatomical observation referred to our previous studies [17,22]. Fresh leaves were cut into sections of 3 × 3 cm with a blade and then fixed in 2.5% glutaraldehyde solution at 4°C for at least 4 h. Then, the fixed leaves were washed three times with 0.1 mol/L phosphate buffer for 15 min each and were then sequentially dehydrated in a gradient of ethanol solutions (30%, 50%, 70%, 80%, 90%, 95%, and 100% solutions) for 15 min each. The cells were then transferred to ethanol that included anhydrous sodium sulfate. After drying (CPD-300, Leica, Germany) and spraying gold (SCD 500, Leica, Germany), the epidermis and stomata were observed and imaged via environmental scanning electron microscopy (SEM) (Philips XL-30 ESEM, Holland).
Additionally, fresh leaves were cut into sections of 1 × 1 cm with a blade and fixed in 2.5% glutaraldehyde solution at 4°C for at least 4 h. Then the fixed leaves were washed three times with 0.1 mol/L phosphate buffer for 15 min each and fixed with 1% osmium tetroxide for 4 h. Afterwards, the leaves were washed three times with 0.1 mol/L phosphate buffer for 15 min each and dehydrated sequentially in a gradient of ethanol solutions (30%, 50%, 70%, 80%, 90%, 95%, and 100% ethanol solutions) for 15 min each. Afterwards, the leaves were transferred to 100% acetone for 15 min and then transferred to acetone that included anhydrous sodium sulfate for 15 min. After the samples were embedded in Spurr resin, sections were cut and double-stained with uranyl acetate and lead citrate. Finally, the mesophyll cells and chloroplasts were observed and imaged via transmission electron microscopy (TEM) (Tecnai 12, Philips, Holland).
All the data are the averages of 3 replications. Analysis of variance was performed with the SAS/STAT statistical analysis package (version 6.12, SAS Institute, Cary, NC, USA), and figures were constructed with SigmaPlot14.0 software.
3.1 Effect of High-Temperature Stress on the Plant Phenotype
The phenotype of P. ostii was affected by high-temperature stress (Fig. 1). After 5 days, the high-temperature-treated leaves sagged slightly, the colour of the leaves became lighter, the tips of the leaves lost their green colour, and the colour of the leaves changed from green to yellow, and a few leaves even displayed scorched spots on day 15. However, the leaves of the control plants remained dark green after 15 days of treatment.
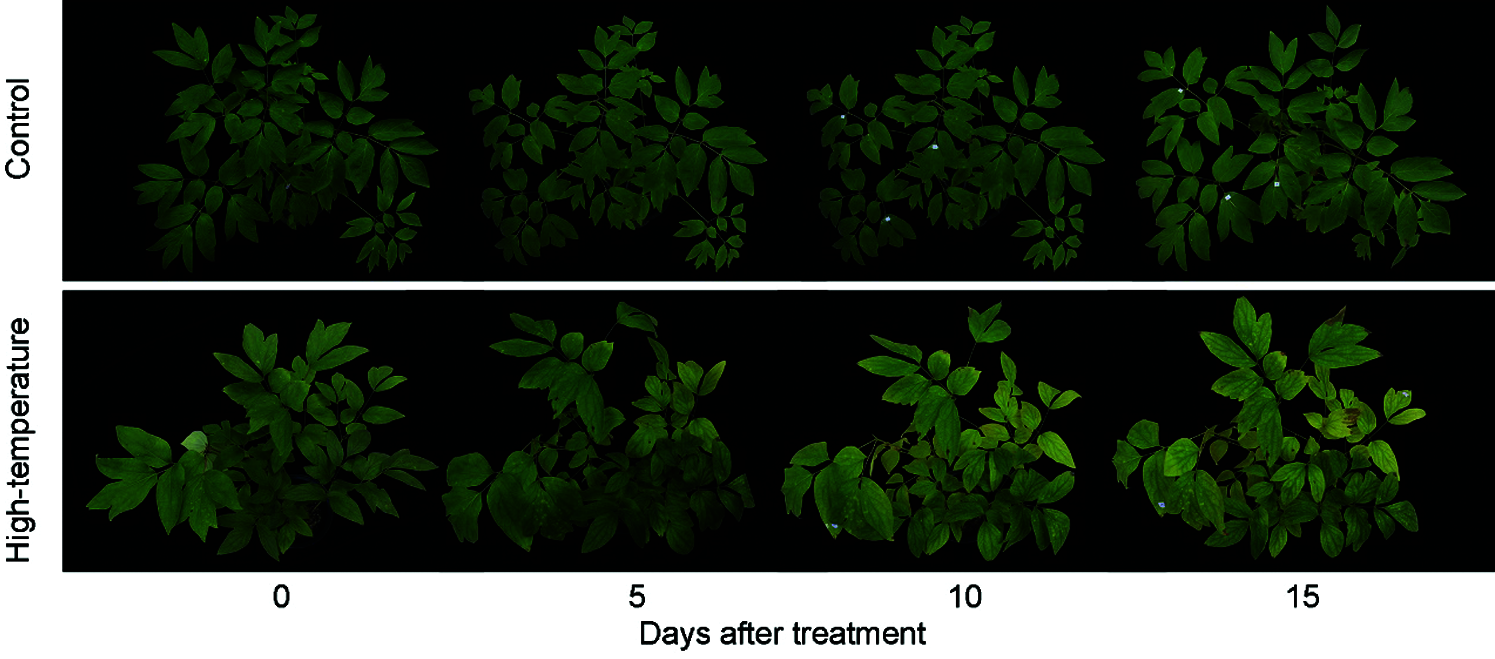
Figure 1: Phenotypic changes of High-temperature-treated P. ostii and control
3.2 Effect of High-Temperature Stress on Chloroplast Pigment Concentrations and Leaf Relative Water Content
The chloroplast pigment concentrations and leaf relative water content caused a significant reduction at either duration of high temperature (Fig. 2). The chlorophyll (a + b) concentration of the high-temperature-treated leaves decreased to 34.50% on day 15; specifically, the chlorophyll a and chlorophyll b concentrations decreased to 32.05% and 39.91%, respectively, and showed significant differences in each period. Correspondingly, the SPAD values also decreased significantly with the development of high-temperature stress, and the values decreased to 72.02% and 42.47% of the initial value on day 5 and day 15, respectively. A similar tendency was observed for carotenoids; in comparison with those of the control, the carotenoid concentration in the high-temperature-treated leaves was 46.05% lower on day 15. Additionally, the leaf relative water content decreased during the high-temperature treatment; the results were significantly different from those of the control, especially on day 15, the value of which was only 39.53% that of the control.
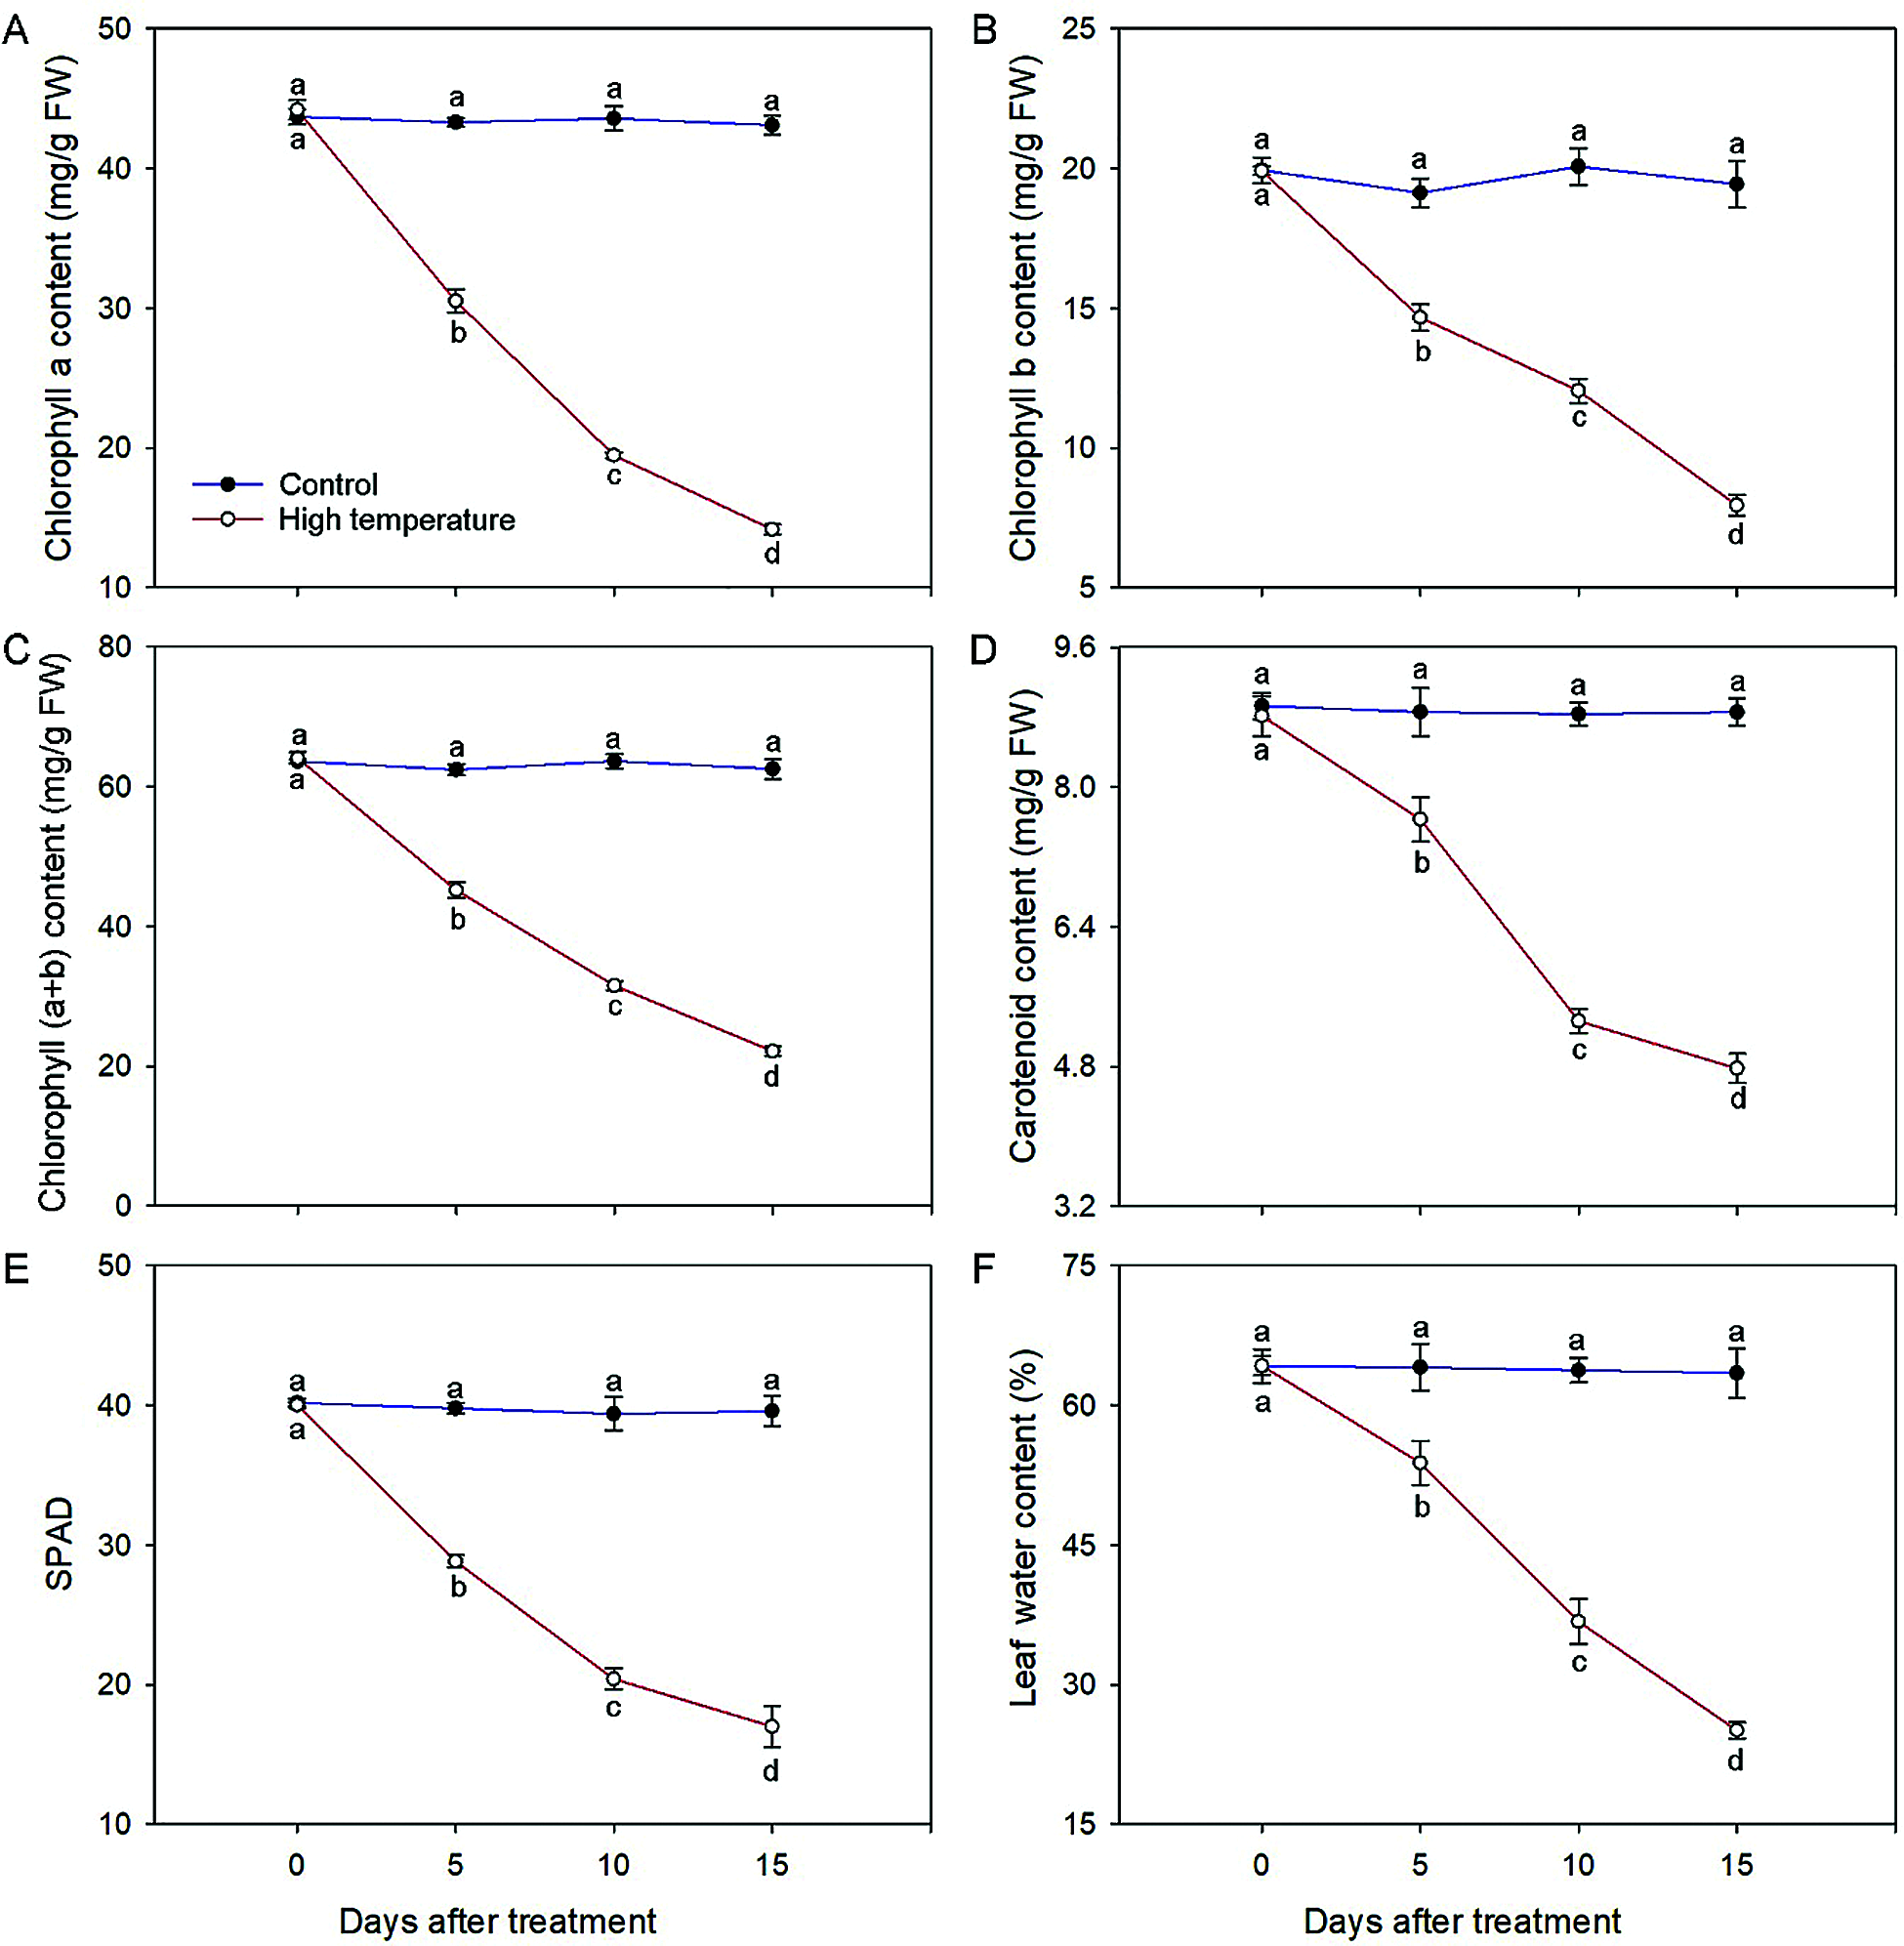
Figure 2: Physiological changes of high-temperature-treated P. ostii and control. (A) Chlorophyll a concentration; (B) Chlorophyll b concentration; (C) Chlorophyll (a + b) concentration; (D) Carotenoid concentration; (E) SPAD values; (F) Leaf water content. Values represent mean ± standard deviation (SD), and different letters indicate significant differences at each sampling date between the control and the high-temperature stress according to Duncan’s multiple range test (p < 0.05)
3.3 Effect of High-Temperature Stress on ROS Concentrations
High-temperature stress can cause oxidative damage to plants, and H2O2 and O2·− are important indicators that reflect the accumulation of ROS. First, the accumulation of H2O2 was determined by DAB staining. The colour of leaves can reflect the degree of membrane lipid peroxidation. The darker the leaf colour, the more severe the high-temperature damage of leaves is, and the greater the degree of membrane lipid peroxidation or plasma membrane damage. H2O2 accumulated dramatically in high temperature treated leaves, especially on day 15, as the leaf staining was significantly more intense than it was on other days after treatment (Fig. 3). Thereafter, the accumulation of O2·− was determined by DHE fluorescent probes. The stronger the red fluorescence signal is, the more O2·− in mesophyll cells. We found that the change trend of O2·− accumulation in leaves was consistent with that of H2O2. On day 5, the fluorescence signal began to become stronger, and the signal peaked on day 15, while the fluorescence intensity of the control was still weak. These results indicated that high-temperature stress significantly increased the accumulation of ROS in the leaves of P. ostii.
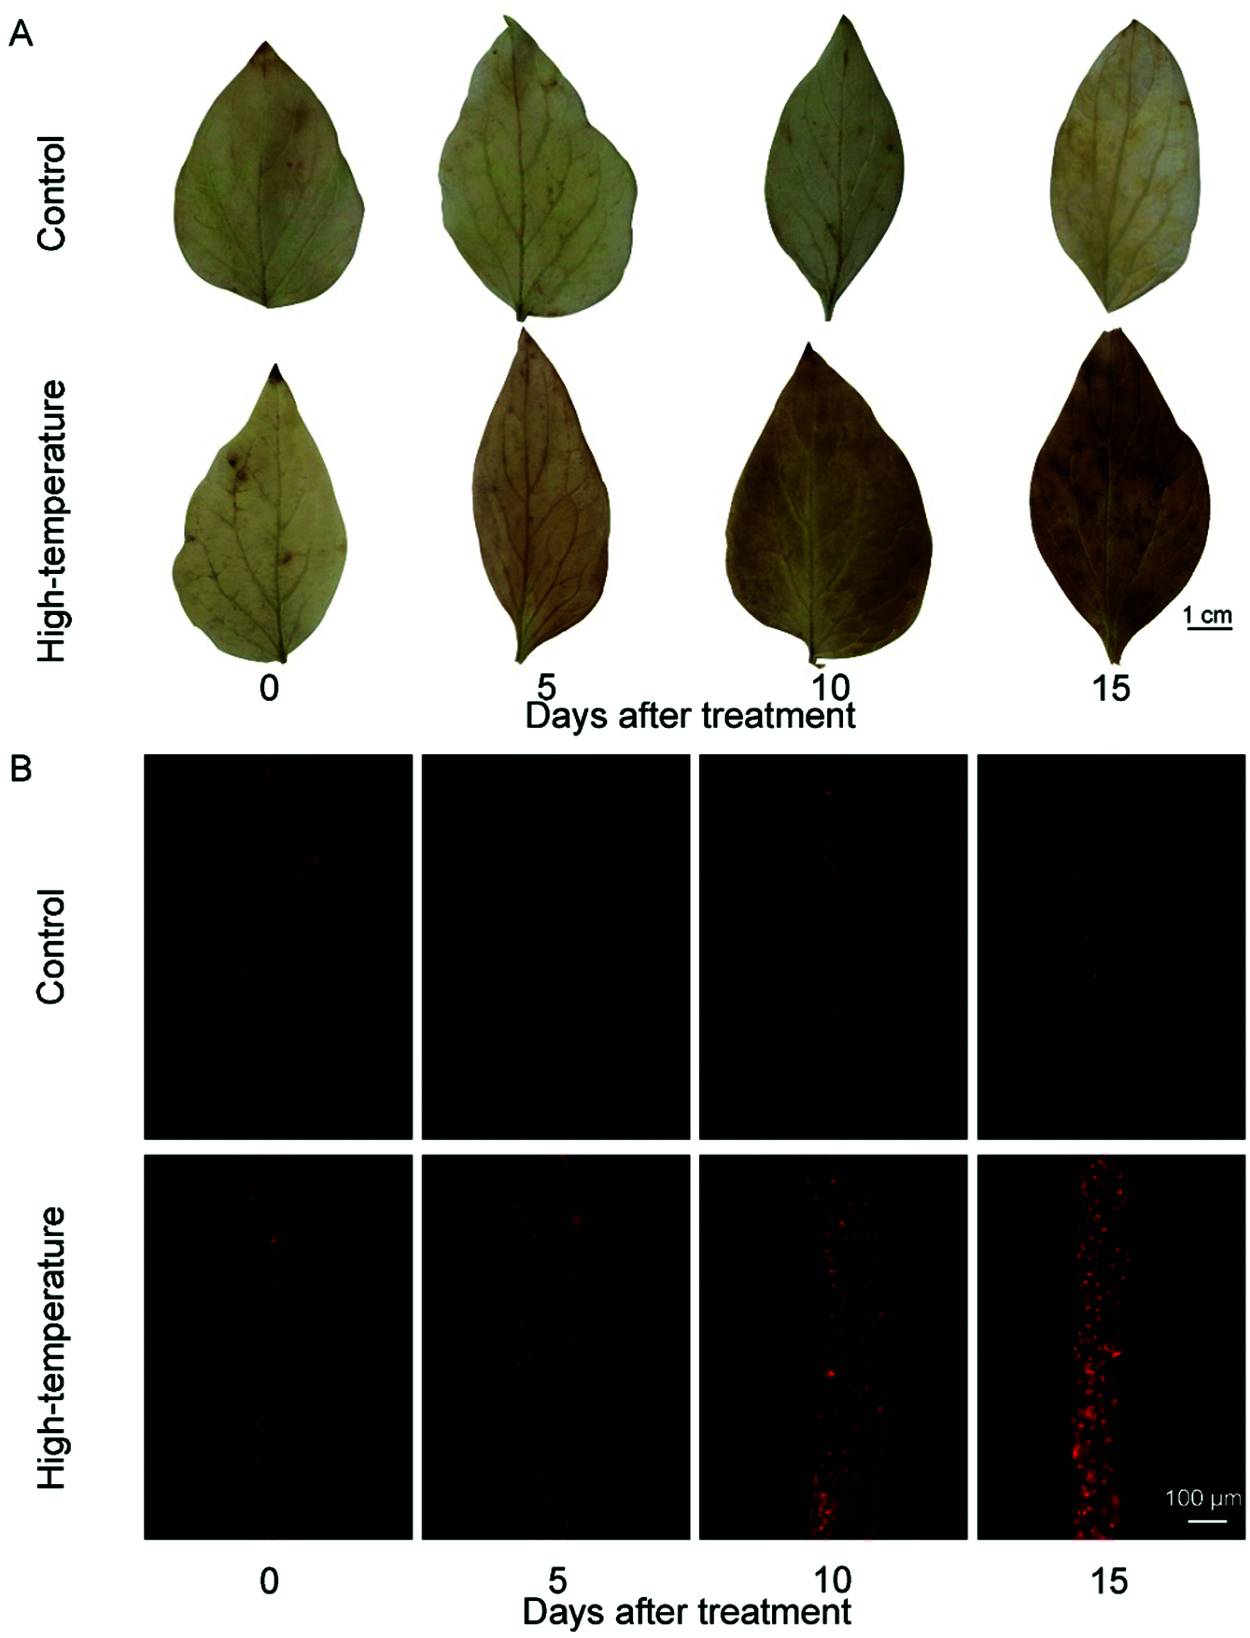
Figure 3: ROS concentrations change of high-temperature-treated P. ostii and control. (A) H2O2 accumulation was detected by diaminobenzidine (DAB) staining; (B) O2·− accumulation was detected by fluorescence prob
3.4 Effect of High-Temperature Stress on REC and Free Proline Concentration
REC can reflect membrane lipid peroxidation. On day 0, the REC remained at a low level, and increased with the development of high-temperature stress until the maximum value was reached on day 15, which was 2.47 times that of the control (Fig. 4). The accumulation of proline in leaves can effectively reflect the stress resistance level of plants. The proline concentration of high-temperature-treated leaves significantly increased, and was always higher than that of the control, especially on day 15, and the proline concentration of the high-temperature-treated leaves was 3.13 times that of the control. In contrast, the REC and proline concentration in the control did not change much in each period.
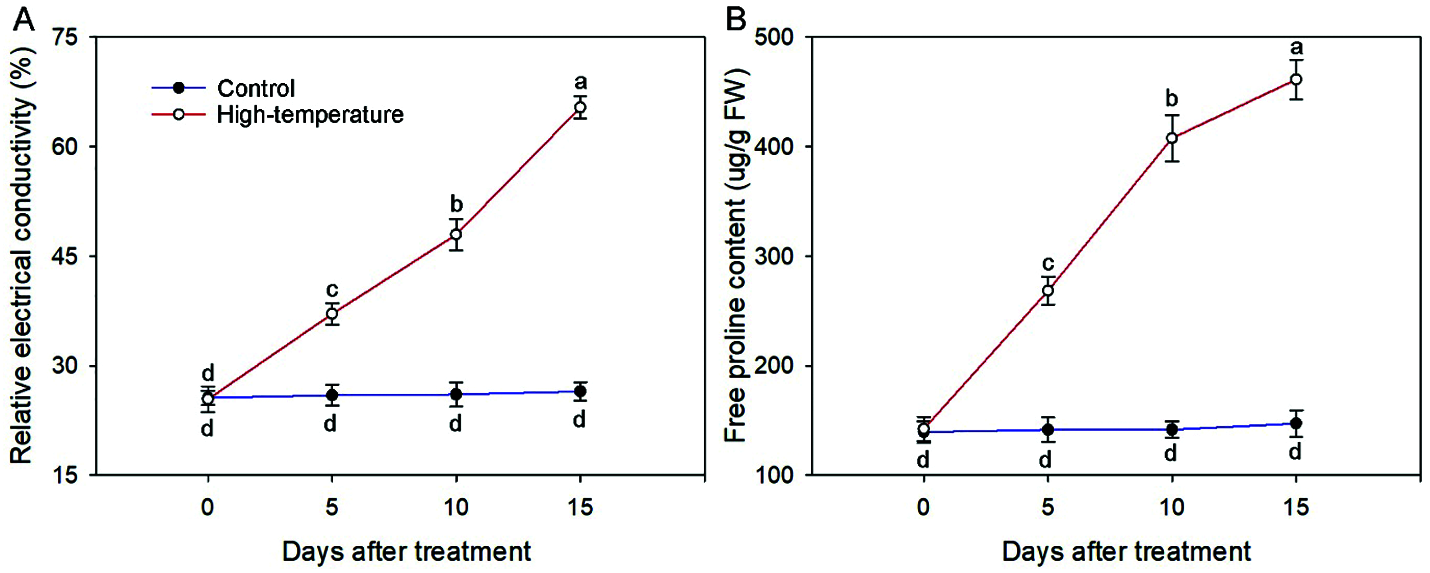
Figure 4: Relative electrical conductivity (A) And free proline concentration (B) Change of high-temperature-treated P. ostii and control. Values represent mean ± standard deviation (SD), and different letters indicate significant differences at each sampling date between the control and the high-temperature stress according to Duncan’s multiple range test (p < 0.05)
3.5 Effect of High-Temperature Stress on Antioxidant Enzyme Activities
Owing to high temperature stress, the activities of major antioxidant enzymes changed including SOD, POD, CAT and APX (Fig. 5).
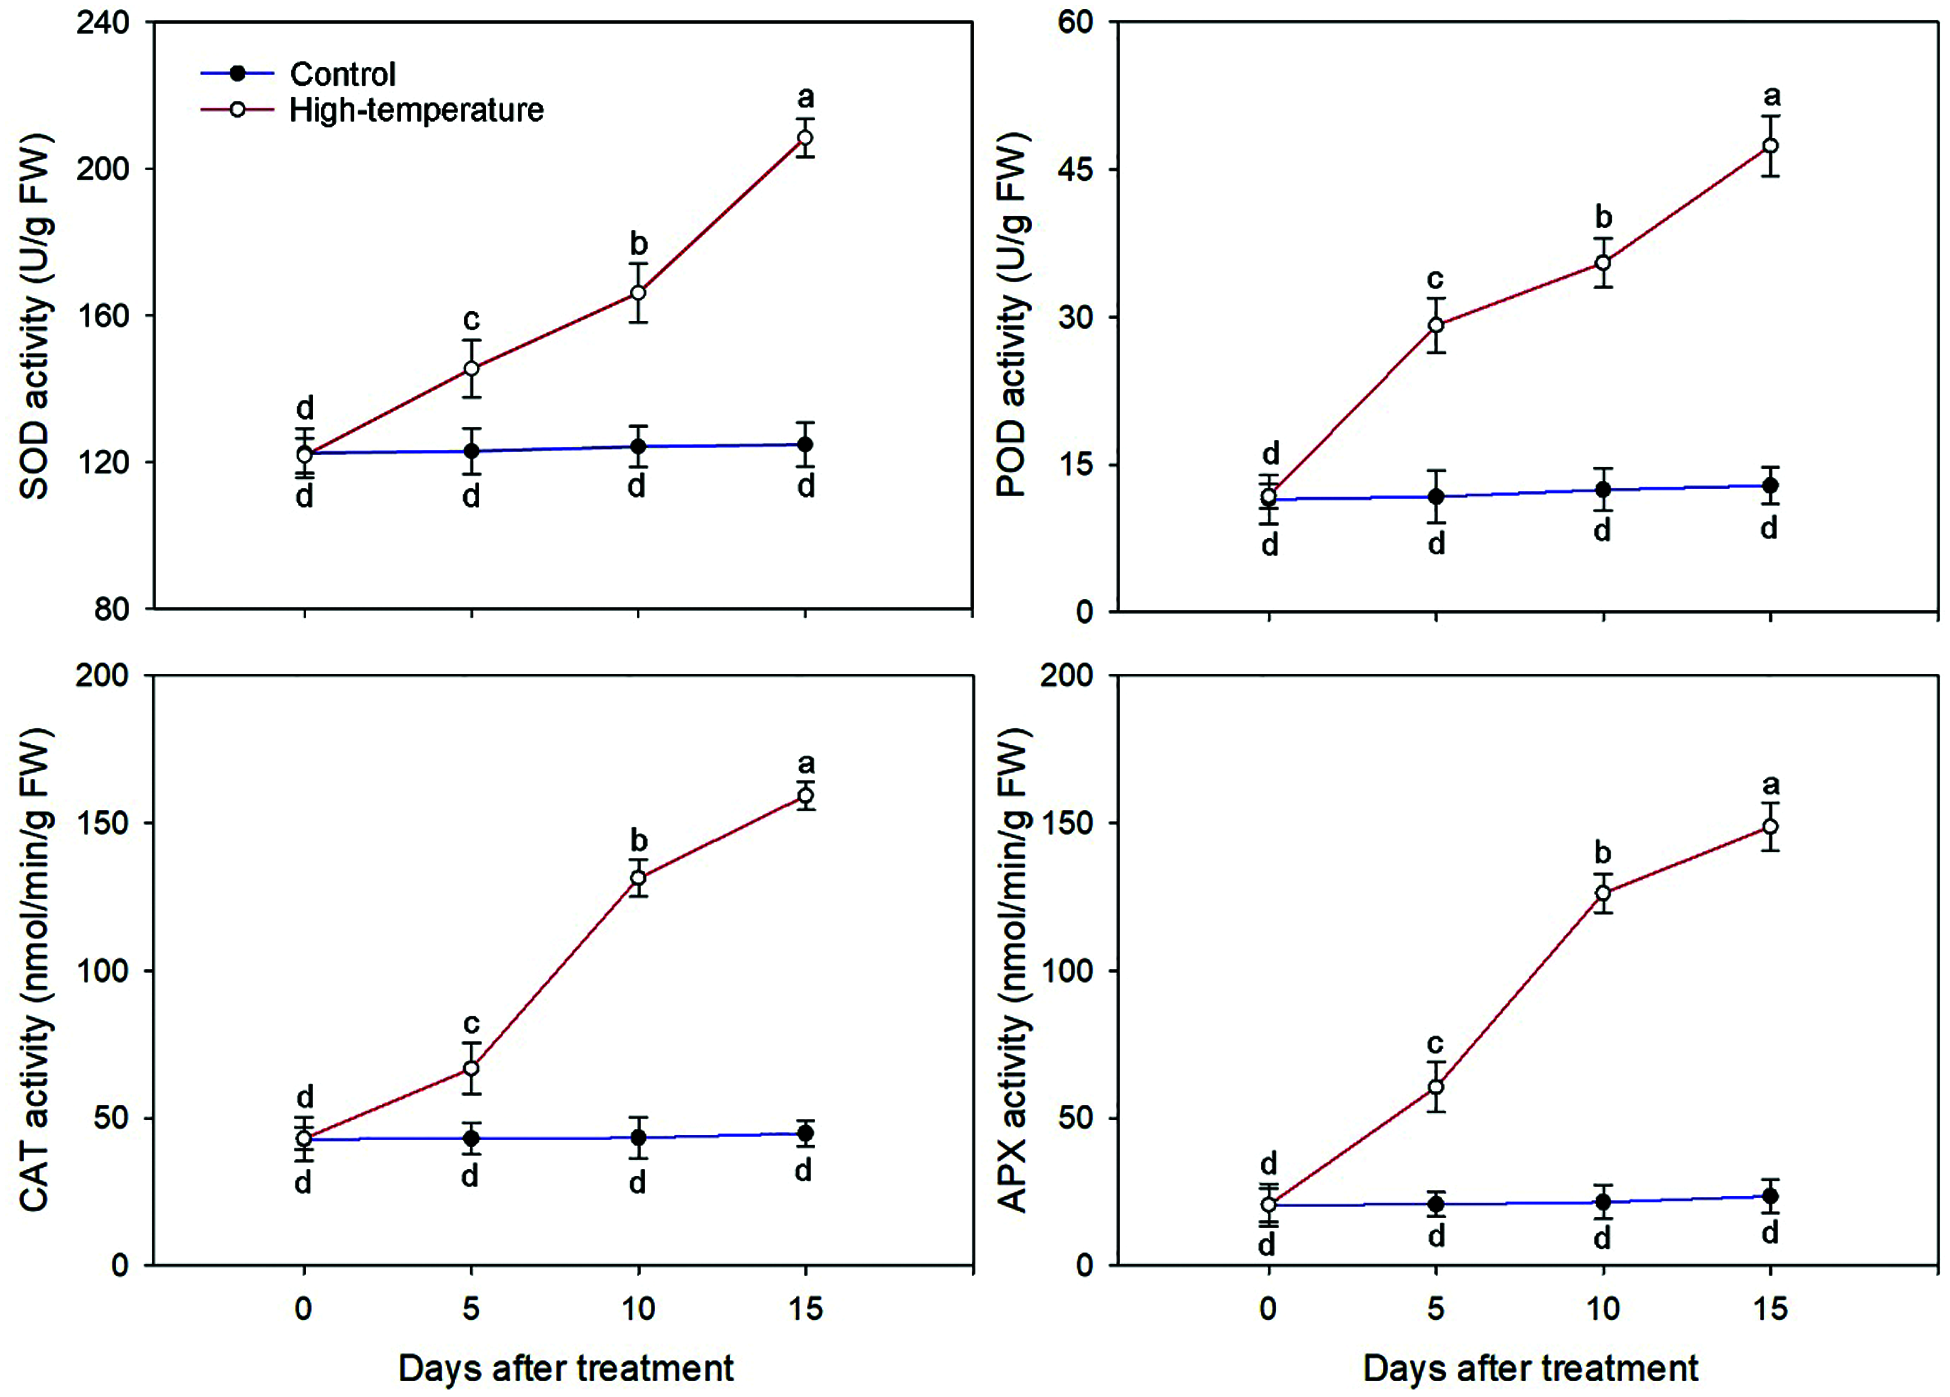
Figure 5: Antioxidant enzyme activities change of high-temperature-treated P. ostii and control. Values represent mean ± standard deviation (SD), and different letters indicate significant differences at each sampling date between the control and the high-temperature stress according to Duncan’s multiple range test (p < 0.05)
The activity of antioxidant enzymes increased significantly when P. ostii was subjected to continuous high temperature. The largest variation occurred for APX activity; the APX activity of the treated leaves was 2.92 and 6.32 times that of the control on day 5 and day 15, respectively. Correspondingly, the smallest variation occurred for SOD activity, which was 1.18 and 1.67 times that of the control on day 5 and day 15, respectively. Similarly, the POD and CAT activities were 3.69 and 3.56 times that of the control on day 15, respectively. Additionally, the SOD and POD activities increased the most from day 10 to day 15, while the CAT and APX activities increased the most from day 5 to day 10.
3.6 Effect of High-Temperature Stress on Photosynthetic Characteristics
The photosynthetic characteristics of P. ostii leaves were significantly affected by high-temperature stress (Fig. 6). The Pn, Gs, Ci and Tr decreased with the development of high temperature stress, but the magnitude of the decrease varied for each parameter. The Pn and Ci decreased significantly at the beginning of the stress treatment and were 66.37% and 84.96%, respectively, of the control on day 5. However, the Gs and Tr decreased slightly at the initial stage of stress. On day 15, they were significantly lower than those of the control and decreased to 41.67% and 12.80%, respectively, compared to day 0. Correspondingly, there were no significant changes on the control for Pn, Gs, Ci or Tr.
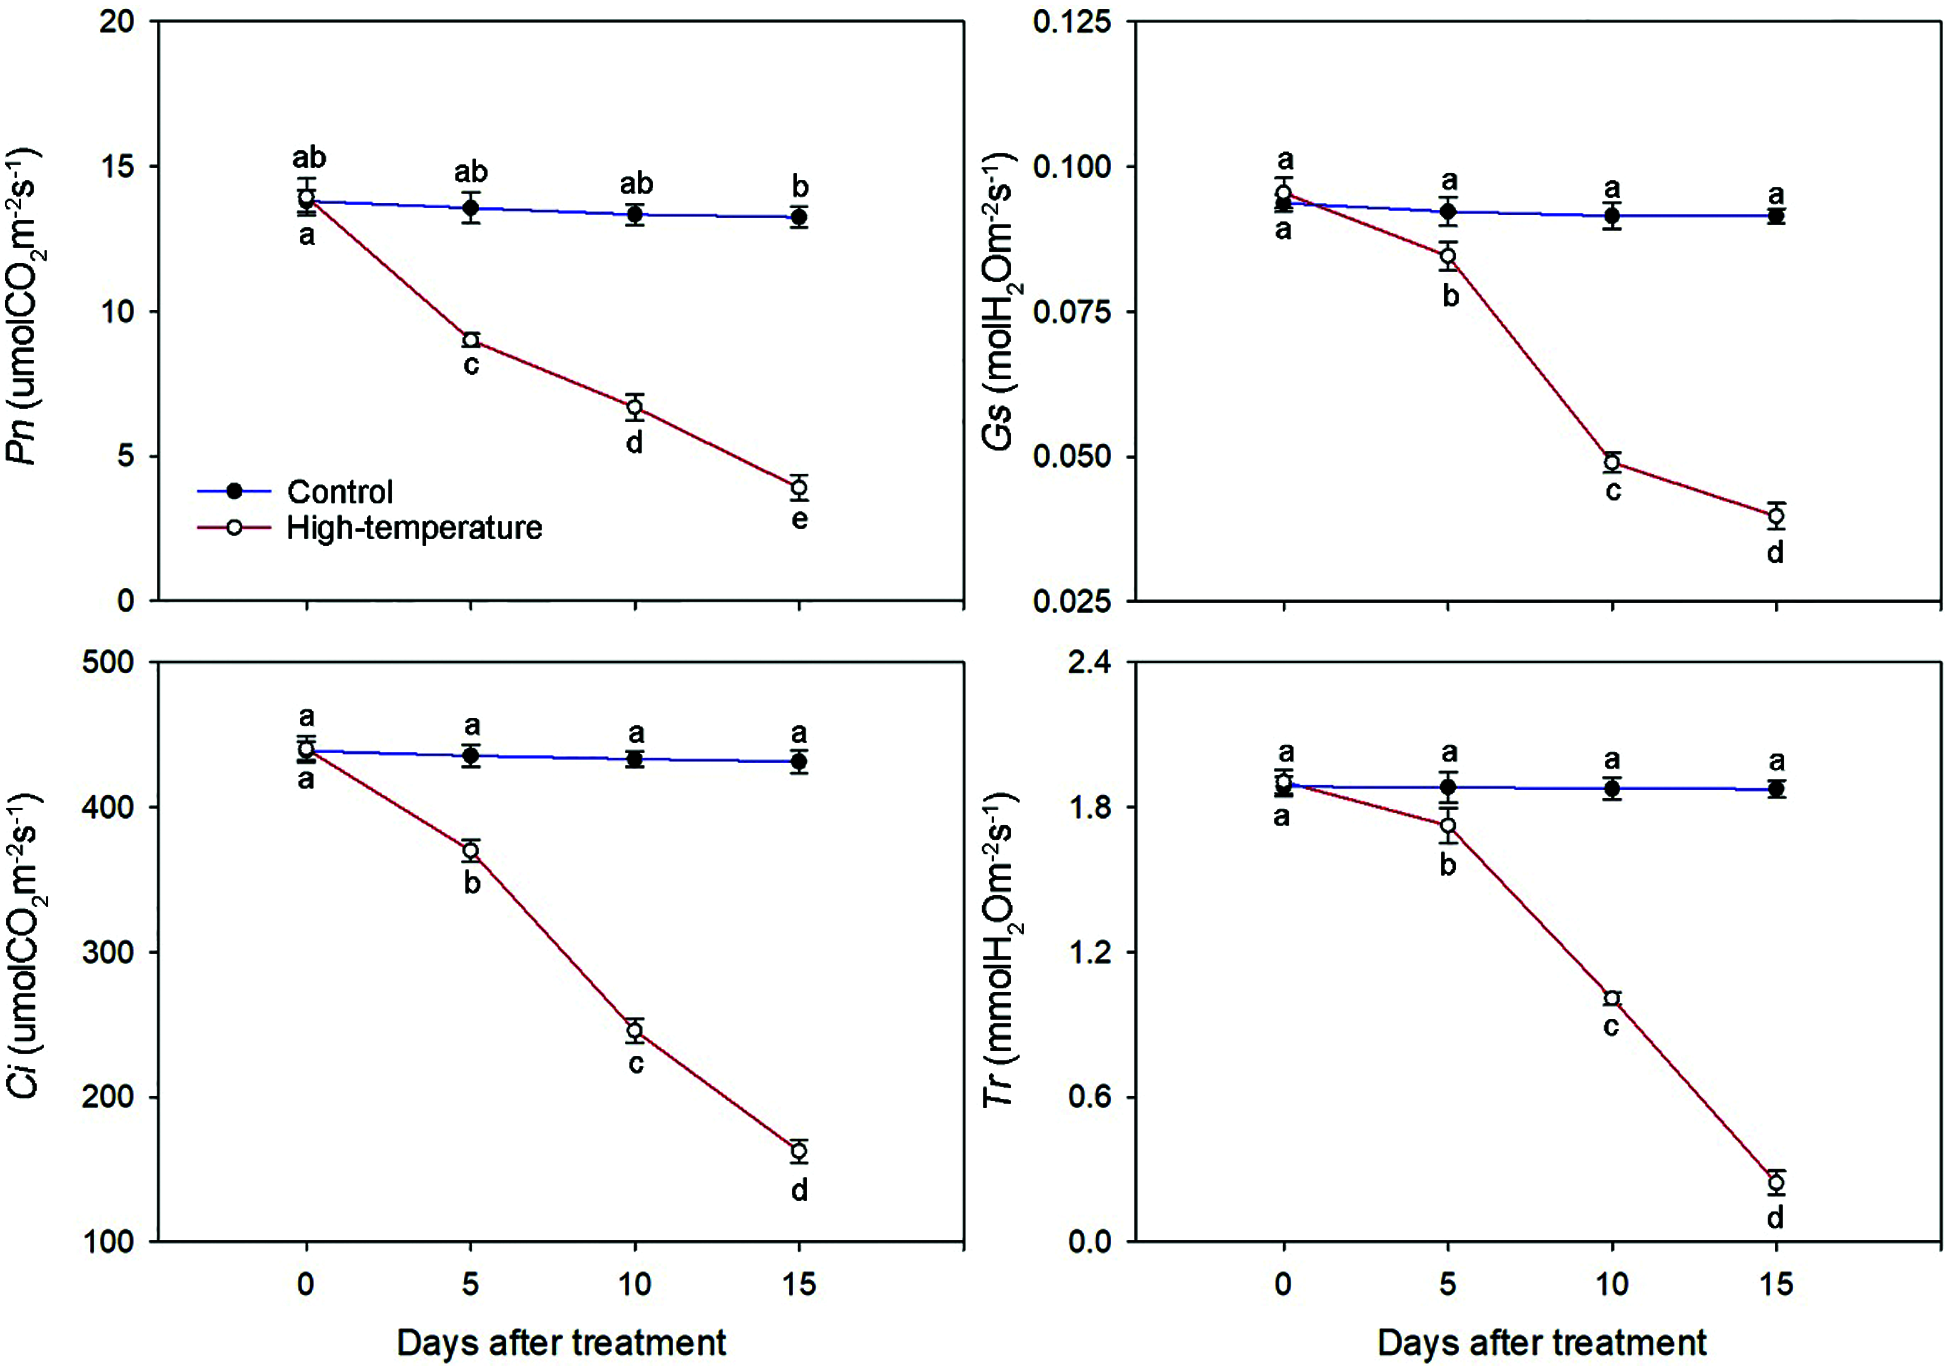
Figure 6: Photosynthetic characteristics change of high-temperature-treated P. ostii and control. Values represent mean ± standard deviation (SD), and different letters indicate significant differences at each sampling date between the control and the high-temperature stress according to Duncan’s multiple range test (p < 0.05)
3.7 Effect of High-Temperature Stress on Chlorophyll Fluorescence Parameters
The chlorophyll fluorescence parameters also changed significantly under high-temperature stress (Fig. 7). Both Fv/Fm and Y(II) decreased significantly under high-temperature stress. Compared to the control, the Fv/Fm and Y(II) of high-temperature-treated leaves decreased to 55.82% and 25.65% on day 15, respectively. However, the qN and Y(NO) showed the exact opposite trend. With the development of high-temperature stress, both qN and Y(NO) increased significantly. On day 15, they were 1.68 and 1.73 times of day 0, respectively. In short, the Fv/Fm and Y(II) were significantly lower than the control, whereas the qN and Y(NO) were significantly higher than the control under high temperature stress.
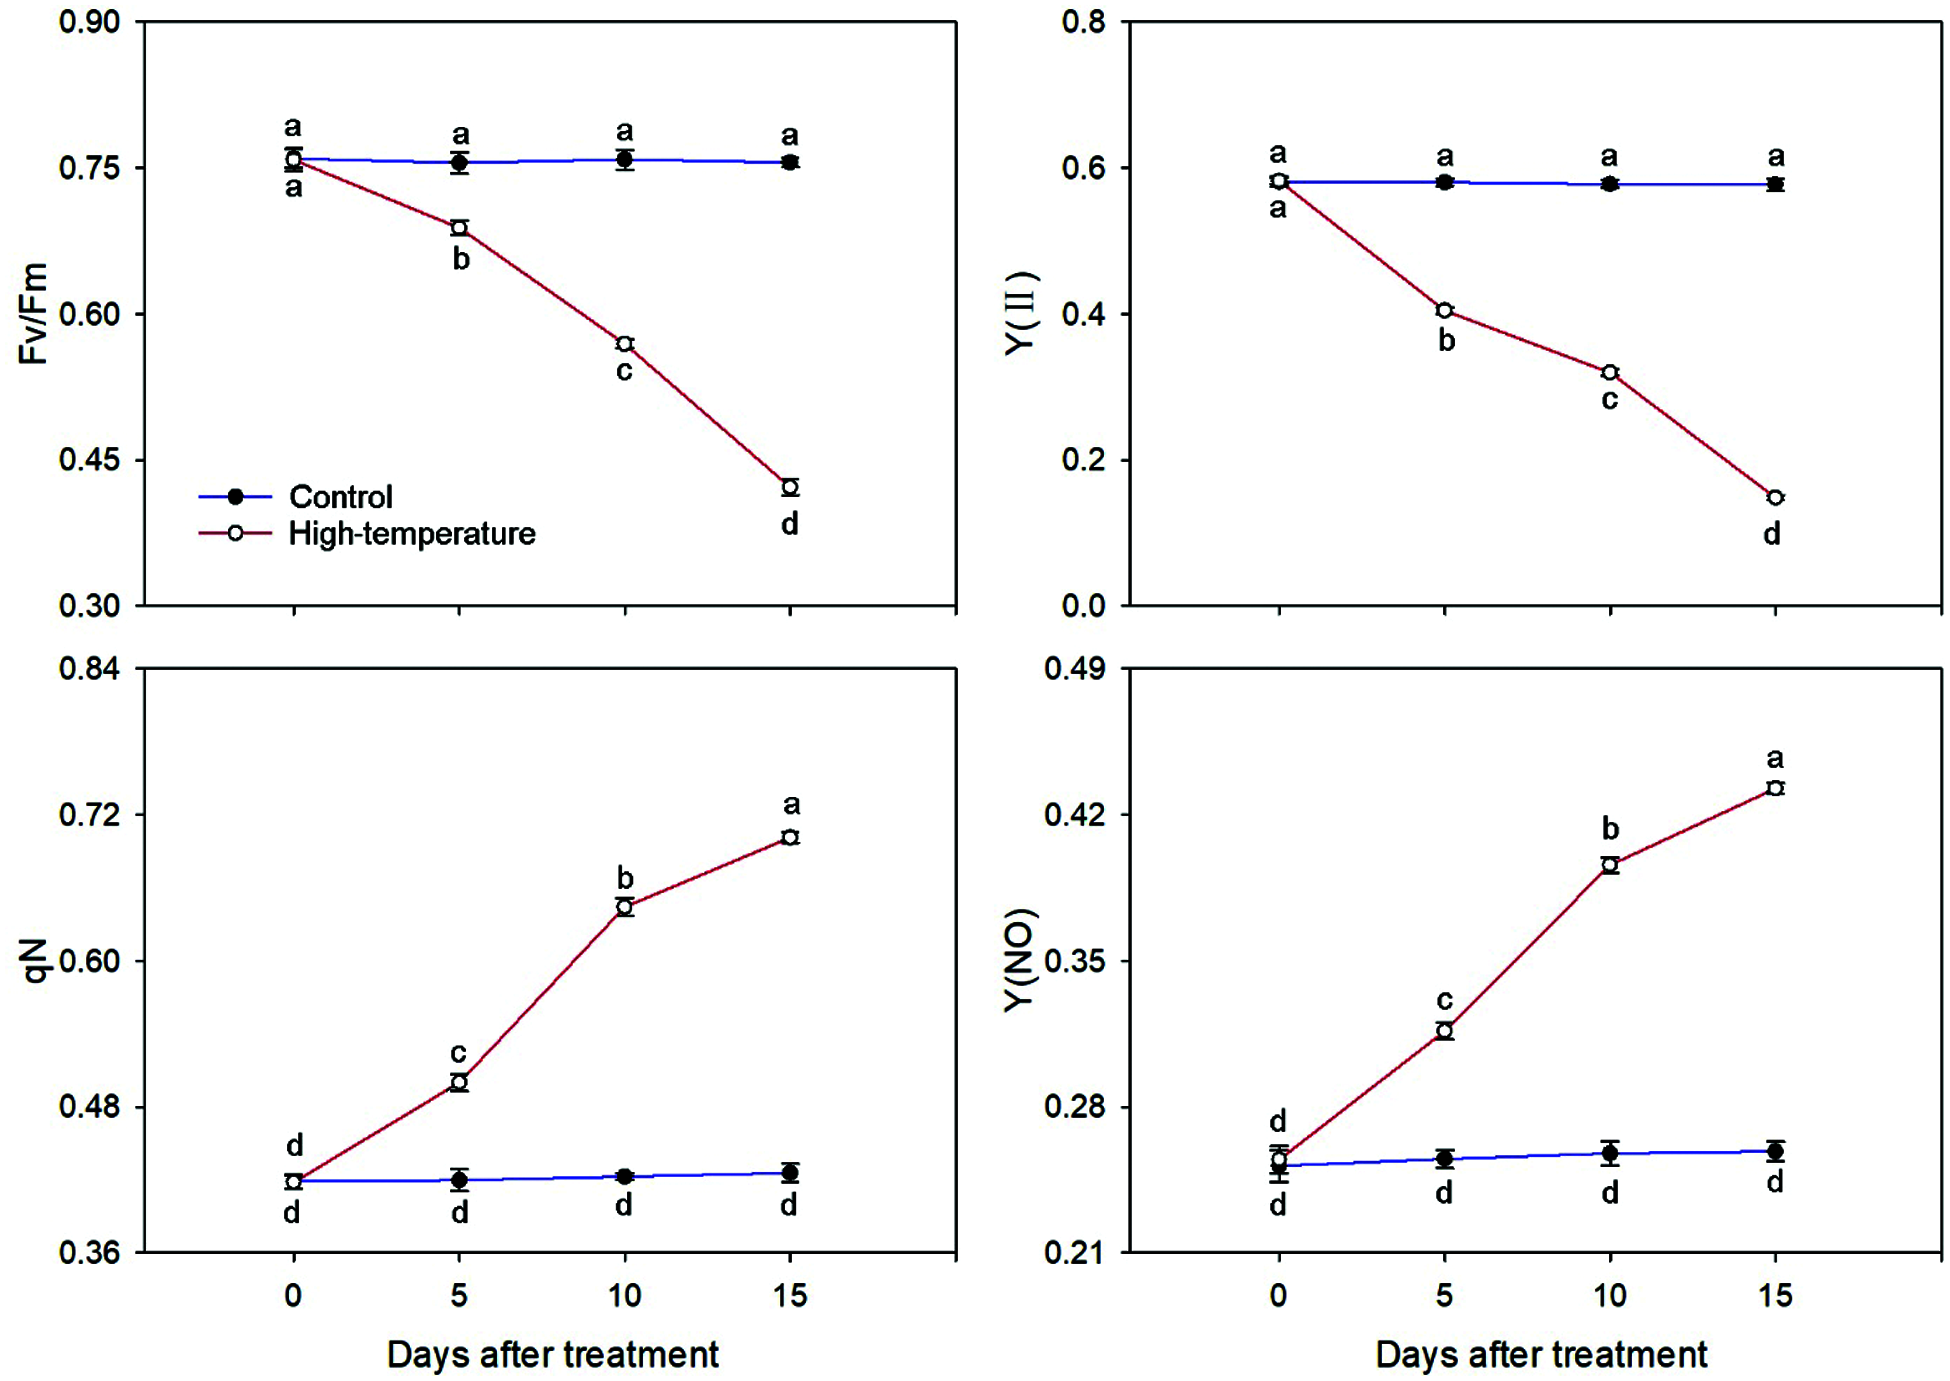
Figure 7: Chlorophyll fluorescence parameters change of High-temperature-treated P. ostii and control. Values represent mean ± standard deviation (SD), and different letters indicate significant differences at each sampling date between the control and the high-temperature stress according to Duncan’s multiple range test (p < 0.05)
3.8 Effect of High-Temperature Stress on Leaf Ultrastructure
First, we observed the lower epidermis of leaves via SEM (Fig. 8). The surface of the leaves was smooth, and stomata were open under both the control and high-temperature treatments on day 0. With the development of high-temperature stress, the degree of leaf shrinkage increased and stomata opening decreased. On day 15, 22 stomata were observed in the field of view of both sets of leaves. More than half of the stomata in the control remained completely open, while 54.5% of the stomata in the high-temperature-treated leaves were fully closed, and the opening degree of the remaining stomata was less than 30%.
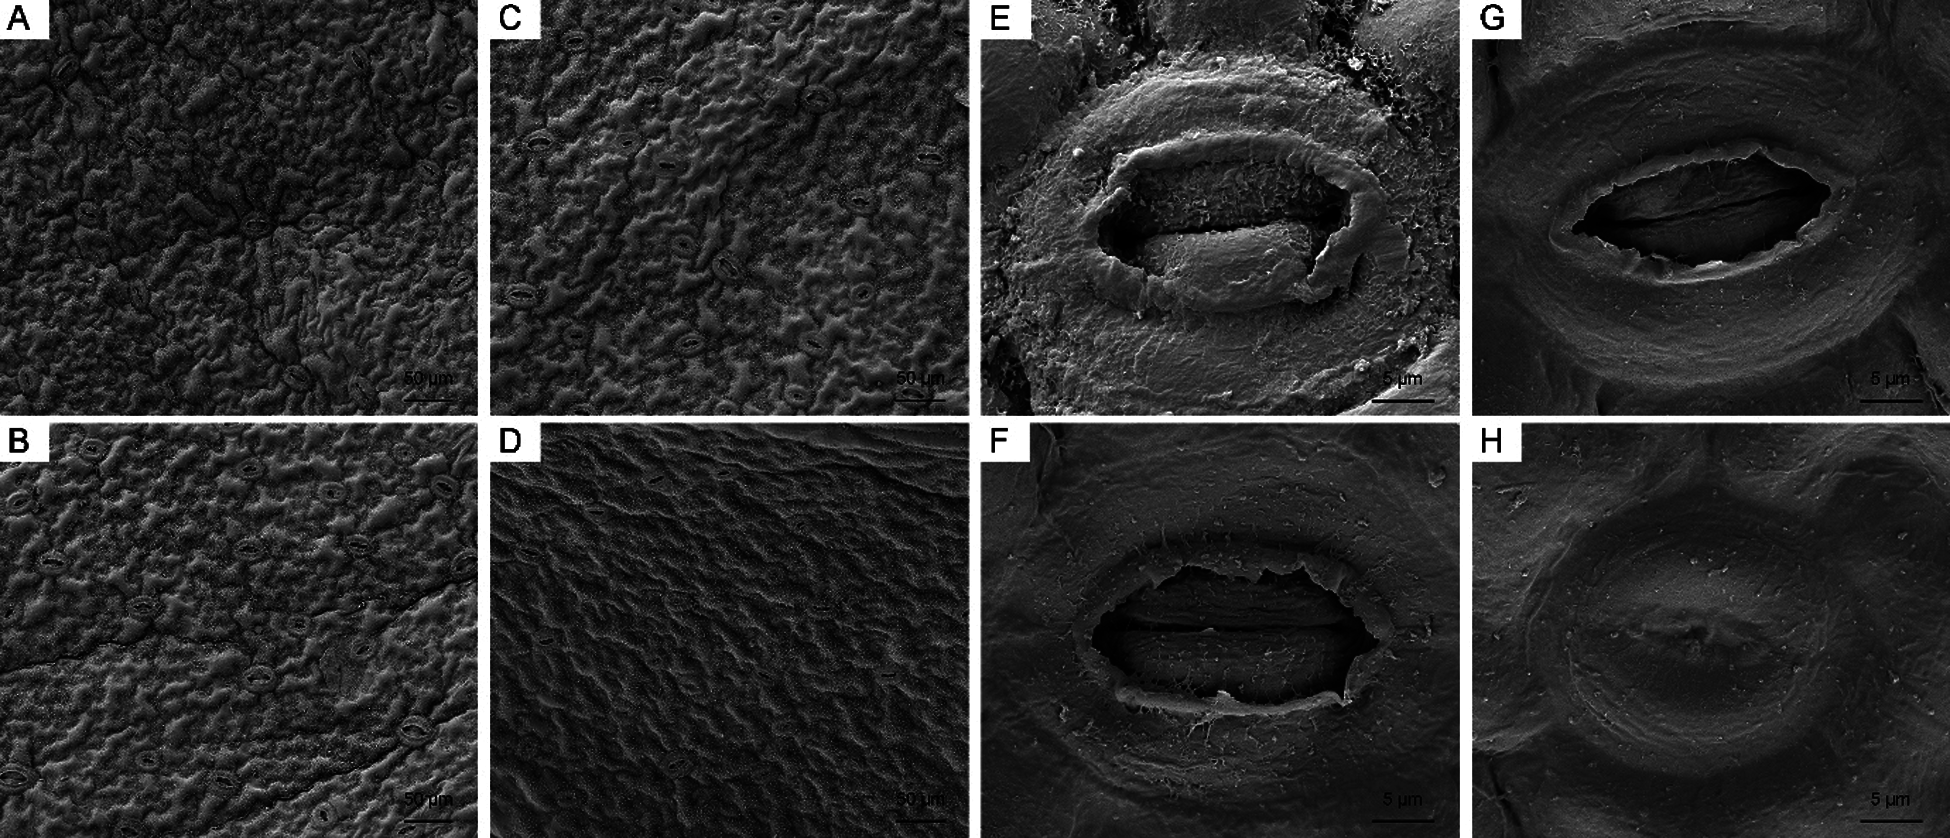
Figure 8: Leaf surface and stomata changes of high-temperature-treated P. ostii and the control. (A) SEM image of the leaf surface of Control on day 0. (B) SEM image of the leaf surface of high-temperature-treated on day 0. (C) SEM image of the leaf surface of Control on day 15. (D) SEM image of the leaf surface of high-temperature-treated on day15. (E) Stomata of control on day 0. (F) Stomata of high-temperature-treated leaf on day 0. (G) Stomata of control on day 15. (H) Stomata of high-temperature-treated on day 15
Then, we observed mesophyll cells and chloroplasts of P. ostii leaves via TEM (Fig. 9). There was no difference between the control and high-temperature-treated leaves on day 0; the cells were in an intact state, and most of the chloroplasts were arranged in a long oval shape close to the cell membrane. On day 15, the cells were compressed and deformed, and the chloroplasts expanded and disintegrated gradually, while the mesophyll cells in the control remained essentially unchanged.
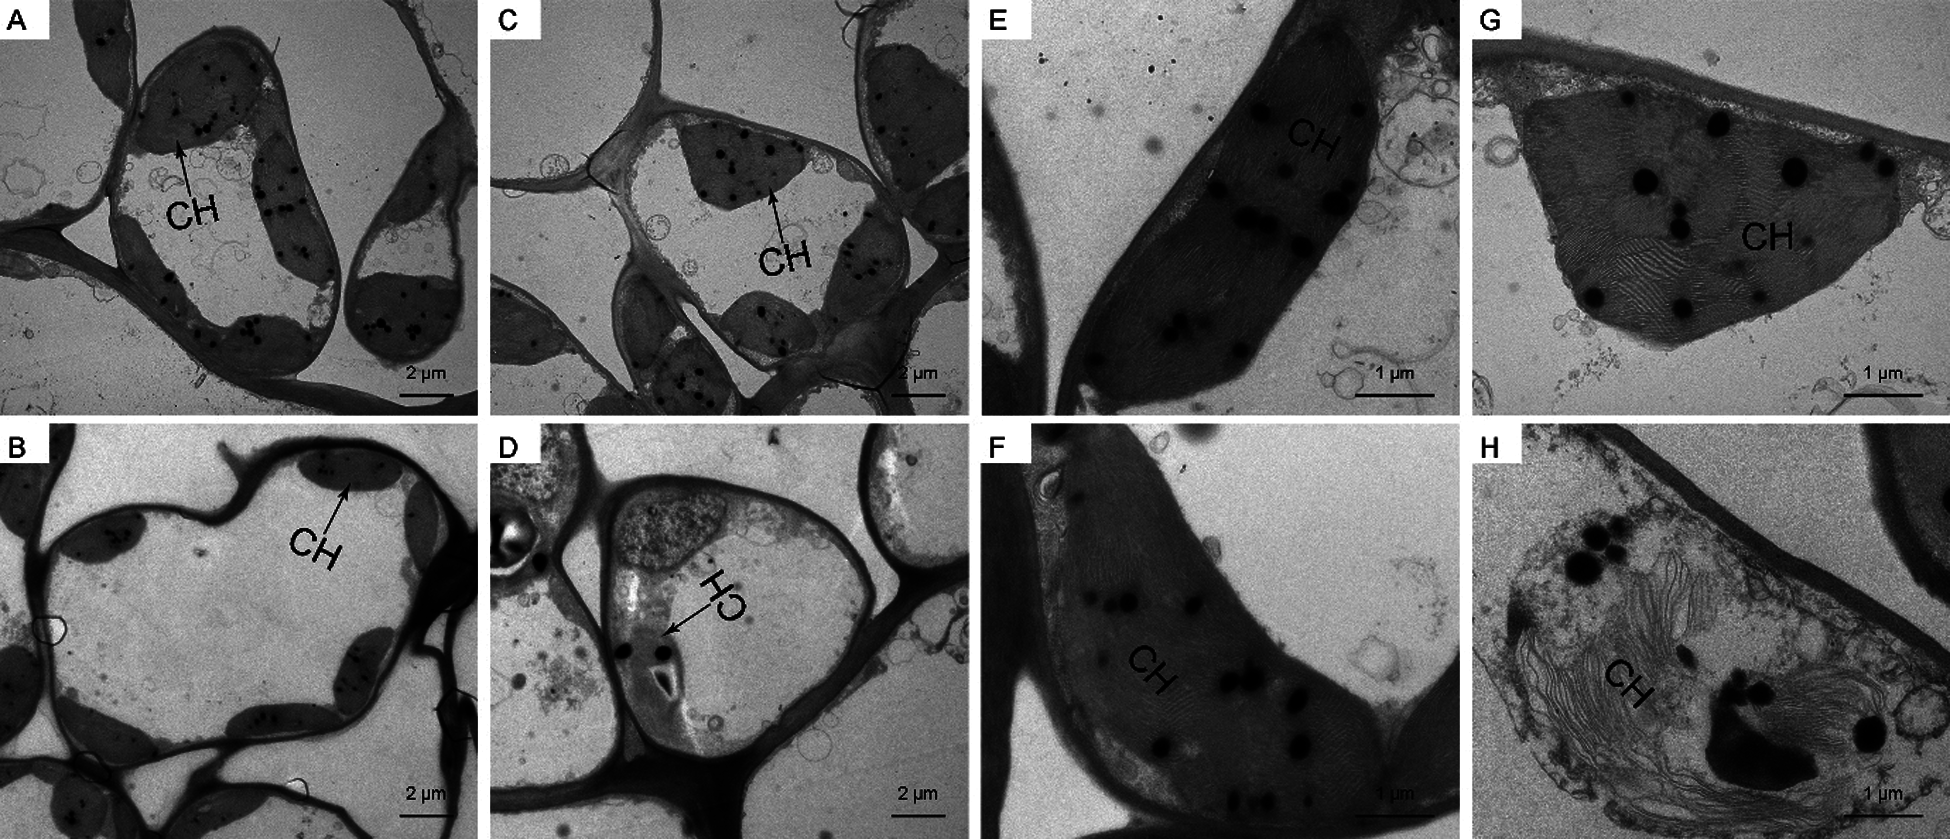
Figure 9: Mesophyll cells and chloroplasts changes of high-temperature-treated P. ostii and the control. A: TEM image of mesophyll cells of Control on day 0. B: TEM image of mesophyll cells of high-temperature-treated on day 0. C: TEM image of mesophyll cells of Control on day 15. D: TEM image of mesophyll cells of High-temperature-treated on day 15. E: Chloroplasts of control on day 0. F: Chloroplasts of high-temperature-treated on day 0. G: Chloroplasts of control on day 15. H: Chloroplasts of High-temperature-treated on day 15
High-temperature stress is a phenomenon that inhibits plant growth and development under exposure to temperatures above the optimum for a long time [23]. The damage to plants caused by high temperature is irreversible and is exacerbated as the duration increases. Leaves play an important role in the physiological activities of plants, and their morphological structural changes are closely related to plant growth and development [24]. In this study, we subjected P. ostii to high-temperature treatment and found that the leaves wilted and turned yellow, and their tips were scorched on day 15. Moreover, the water content of high-temperature-treated leaves gradually decreased from day 0 to day 15. This may be because plant evaporative demand and water consumption increase following an increase with temperature, leading to a severe leaf water loss. Water content reflects the vigour of plant biological activity. Reduction in leaf water content represents a loss of turgor with limited water availability for cell expansion [25]. These phenomena are described in depth in studies on lentil [26] and grapevine [27]. Taken together, the findings suggest that, on the basis of leaf water content, P. ostii can respond to different degrees of stress, similar to other plant species.
High-temperature stress causes plants to produce excess excitation energy, which induces the accumulation of ROS such as H2O2 and O2·−, leading to membrane peroxidation and cell membrane damage, thus inhibiting plant growth and development [28–30]. In this study, we found that the concentrations of H2O2 and O2·− increased with the development of high-temperature stress, which is consistent with previous results for peony [31] and wheat [32]. The fluidity of the plasma membrane is closely related to temperature stress, and high-temperature stress can enhance such fluidity [33,34]. ROS damage cell membranes by degrading phospholipids, while REC can reflect the degree of cell membrane damage [35]. The more severe is the damage to the cell membrane, the higher the REC value. The results of the present study showed that the REC of P. ostii gradually increased under high-temperature stress. This confirms that high-temperature stress caused lipid membrane peroxidation and increased membrane permeability, which resulted in lipid membrane damage. These results are the same as those of Zhao et al. [36]. Free proline in plants can serve as a cytoplasmic osmotic regulator [31]. Under high temperature, the proline content of strawberry leaves was shown to be significantly higher than that of the control [25], and this result was also observed in P. ostii. Taken together, these results indicated that P. ostii could maintain a proper balance of cell osmosis by increasing the concentration of proline, so as to resist stress injury.
The antioxidant enzyme system is one of the important mechanisms through which plants scavenge excess ROS under adverse stress conditions [37]. SOD, POD, CAT and APX are the key enzymes that make up the antioxidant enzyme system. Under high temperature, plants increase the activity of antioxidant enzymes to resist environmental stress to maintain the stability of the cell membrane [38]. Talbi et al. [39] found that SOD can break down O2·− to H2O2, which reduces excess H2O2 to H2O by increasing the activity of POD and CAT. At the same time, APX also scavenges ROS under the synergistic action of other antioxidants [40]. Previous studies have shown that under high-temperature stress, the increased amplitude of antioxidant enzyme activities in heat-resistant mulberry leaves is higher than that in heat-sensitive varieties [41]. In the present study, we found that high-temperature stress significantly increased the activities of SOD, POD, CAT and APX, which was consistent with the trend in the accumulation of ROS such as H2O2 and O2·−. Similar results were also found in lily [42] and cucumber [43]; as such, P. ostii can remove ROS produced under high-temperature stress by inducing the activity of antioxidant enzymes and reducing damage to the structure of the cell membrane, thus becoming better adapted to the external environment. However, studies on lettuce [44] showed that the peroxidase activity decreased with the development of high-temperature stress to varying degrees. This phenomenon may be due to inconsistent changes in antioxidant enzyme activities caused by the use of different plant materials, temperatures and durations of the high-temperature treatment.
Photosynthesis is the source of energy for the growth and development of plants. The photosynthetic rate of leaves decreases to different degrees under different stresses, but previous studies on the mechanism underlying the decrease in photosynthetic rate revealed different findings. Crafts-Brandner [45] suggested that the decline in the photosynthetic rate was caused by a decrease in stomatal conductance. Under high temperature, some stomata of plants were closed, resulting in a decrease in the intercellular CO2 concentration in chloroplasts. Monneveux et al. [46], on the other hand, suggested that the photosynthetic rate was the result of the combined effect of stomatal conductance and mesophyll conductance. We found that the Pn and Gs of P. ostii decreased significantly at 5 days after high-temperature stress and continued to decrease thereafter. It is possible that the decrease in Gs caused a decrease in the Tr and Ci. Moreover, the results of SEM on P. ostii leaves showed that prolonged high-temperature stress increased leaf shrinkage and reduced the length and width of stomata, and most stomata were closed. It suggests that the stomata of P. ostii rapidly closed under high-temperature conditions to reduce water dissipation throughout the plant, preventing the absorption of CO2 by mesophyll cells and further decreasing the Pn. Additionally, compared with the control, the P. ostii chloroplast pigment concentrations and SPAD values significantly decreased under high-temperature stress. In addition, the results of TEM showed that the chloroplasts expanded and disintegrated. Therefore, high-temperature stress disrupts the integrity of the chloroplast structure and causes irreversible damage to the photosynthetic mechanism, which severely affected the photosynthesis of the plants, and is another reason for the decrease of Pn. These phenomena were consistent with findings in cherry radish [47].
High-temperature stress not only affects photosynthetic electron transfer and photophosphorylation but also damages the thylakoid lamellae and chloroplast matrix housing the photosynthetic apparatus [48]. PSII is considered to be the main site experiencing high-temperature damage, and high-temperature stress drastically affects the absorption efficiency of light energy by PSII and even inactivates the PSII reaction centre [49]. Fv/Fm is an important indicator of the photochemical efficiency of PSII, and is the most commonly used chlorophyll fluorescence kinetics parameter; changes in fluorescence are effective responses of the photochemical activity of the photosynthetic apparatus [50]. Measurements of chlorophyll fluorescence dissipation include the photochemical quenching coefficient (qP) and nonphotochemical quenching coefficient (qN), and qN can protect the photosynthetic apparatus from damage by high light. The higher the qN, the higher the capacity of plants to consume excess light energy, which can better protect the photosynthetic system. Y(NO) reflects the degree of light damage, and an increase in Y(NO) indicates that the accumulation of excess light energy in plants increases [51]. Zhao et al. [36] found that damage to the PSII reaction centre under high-temperature stress led to an increase in excess light energy, which further caused a decrease in photochemical efficiency, as evidenced by a decrease in Fv/Fm, a decrease in Y(II), and an increase in Y(NO). In the present study, Fv/Fm and Y(II) decreased with the development of high temperature stress, while qN and Y(NO) increased, which is consistent with the results of previous studies [31,52]. This shows that PSII damage in P. ostii increases under high-temperature stress, while the plant mobilizes photoprotection mechanisms to reduce high-temperature damage.
Overall, this study revealed the relationship between heat tolerance of P. ostii and changes of physiological indicators before and after high-temperature stress. On the one hand, phenotypic changes directly reflected the effect of high-temperature on the leaves of P. ostii. On the other hand, physiological experiments and leaf ultrastructure had further elucidated the growth status of P. ostii, including increased ROS accumulation and osmotic adjustment substances, damage chloroplast structure and PSII activity and decreased photosynthesis. At the same time, P. ostii reduced oxidative damage and osmotic stress by increasing the activity of antioxidant enzymes and the accumulation of proline, thus providing some protection. In the middle and lower reaches of the Yangtze River, the temperature rises rapidly after the plum rain season. In order to prevent P. ostii plants from withering and death, reasonable and effective measures should be taken as soon as possible, such as covering shading nets and interacting with economic trees to effectively reduce the stimulation of strong light, or applying some exogenous substances to improve the heat tolerance of P. ostii, so as to ensure the yield and quality of P. ostii seeds.
Acknowledgement: The authors wish to thank three anonymous reviewers for their input and constructive criticism received.
Author Contributious: J.T. and D.Z. conceived and designed the experiments. X.W. and Z.F. performed the experiments. X.W. and D.Z. analyzed the data. X.W. wrote the paper.
Funding Statement: This work was supported by the National Key Research and Development Project of China [2019YFD1001502], Forestry Science and Technology Prossmotion Project of Jiangsu Province [LYKJ [2018] 26], Qing Lan Project of Jiangsu Province and High-Level Talent Support Program of Yangzhou University.
Conflicts of Interest: The authors declare that they have no conflicts of interest to report regarding the present study.
1. Hassan, M. U., Chattha, M. U., Khan, I., Chattha, M. B., Barbanti, L. et al. (2021). Heat stress in cultivated plants: Nature, impact, mechanisms, and mitigation strategies–A review. Plant Biosystems, 155(2), 211–234. DOI 10.1080/11263504.2020.1727987. [Google Scholar] [CrossRef]
2. Epa, O. U. (2011). A student’s guide to global climate change. http://www.epa.gov/climatechange/kids/. [Google Scholar]
3. Hasanuzzaman, M., Nahar, K., Alam, M. M., Roychowdhury, R., Fujita, M. (2013). Physiological, biochemical, and molecular mechanisms of heat stress tolerance in plants. International Journal of Molecular Sciences, 14(5), 9643–9684. DOI 10.3390/ijms14059643. [Google Scholar] [CrossRef]
4. Nievola, C. C., Carvalho, C. P., Carvalho, V., Rodrigues, E. (2017). Rapid responses of plants to temperature changes. Temperature, 4(4), 371–405. DOI 10.1080/23328940.2017.1377812. [Google Scholar] [CrossRef]
5. Sharma, L., Priya, M., Bindumadhava, H., Nair, R. M., Nayyar, H. (2016). Influence of high temperature stress on growth, phenology and yield performance of mungbean Vigna radiata (L.) Wilczek under managed growth conditions. Scientia Horticulturae, 213(6), 379–391. DOI 10.1016/j.scienta.2016.10.033. [Google Scholar] [CrossRef]
6. Suriyasak, C., Harano, K., Tanamachi, K., Matsuo, K., Tamada, A. et al. (2017). Reactive oxygen species induced by heat stress during grain filling of rice (Oryza sativa L.) are involved in occurrence of grain chalkiness. Journal of Plant Physiology, 216, 52–57. DOI 10.1016/j.jplph.2017.05.015. [Google Scholar] [CrossRef]
7. Locato, V., de Pinto, M. C., de Gara, L. (2009). Different involvement of the mitochondrial, plastidial and cytosolic ascorbate-glutathione redox enzymes in heat shock responses. Physiologia Plantarum, 135(3), 296–306. DOI 10.1111/j.1399-3054.2008.01195.x. [Google Scholar] [CrossRef]
8. Tiwari, Y. K., Yadav, S. K. (2019). High temperature stress tolerance in maize (Zea mays L.Physiological and molecular mechanisms. Journal of Plant Biology, 62(2), 93–102. DOI 10.1007/s12374-018-0350-x. [Google Scholar] [CrossRef]
9. Bita, C. E., Gerats, T. (2013). Plant tolerance to high temperature in a changing environment: Scientific fundamentals and production of heat stress-tolerant crops. Frontiers in Plant Science, 4, 273. DOI 10.3389/fpls.2013.00273. [Google Scholar] [CrossRef]
10. Liu, P., Zhang, L. N., Wang, X. S., Gao, J. Y., Yi, J. P. et al. (2019). Characterization of Paeonia ostii seed and oil sourced from different cultivation areas in China. Industrial Crops and Products, 133, 63–71. DOI 10.1016/j.indcrop.2019.01.054. [Google Scholar] [CrossRef]
11. Yang, Y., Sun, M., Li, S. S., Chen, Q. H.,Teixeira da Silva J. A. et al. (2020). Germplasm resources and genetic breeding of Paeonia: A systematic review. Horticulture Research, 7, 107. DOI 10.1038/s41438-020-0332-2. [Google Scholar] [CrossRef]
12. Lin, C., Lin, H. Y., Chen, J. H., Tseng, W. P., Ko, P. Y. et al. (2015). Effects of paeonol on anti-neuroinflammatory responses in microglial cells. International Journal of Molecular Sciences, 16(4), 8844–8860. DOI 10.3390/ijms16048844. [Google Scholar] [CrossRef]
13. Wang, X. J., Liang, H. Y., Guo, D. L., Guo, L., Duan, X. et al. (2019). Integrated analysis of transcriptomic and proteomic data from tree peony (P. ostii) seeds reveals key developmental stages and candidate genes related to oil biosynthesis and fatty acid metabolism. Horticulture Research-England, 6(1), 1–19. DOI 10.1038/s41438-019-0194-7. [Google Scholar] [CrossRef]
14. Peng, L. P., Cheng, F. Y., Hu, X. G., Mao, J. F., Xu, X. X. et al. (2019). Modelling environmentally suitable areas for the potential introduction and cultivation of the emerging oil crop Paeonia ostii in China. Scientific Reports, 9(1), 3213. DOI 10.1038/s41598-019-39449-y. [Google Scholar] [CrossRef]
15. Liu, P., Zhang, L. N., Wang, X. S., Gao, J. Y., Yi, J. P. et al. (2019). Characterization of Paeonia ostii seed and oil sourced from different cultivation areas in China. Industrial Crops and Products, 133, 63–71. DOI 10.1016/j.indcrop.2019.01.054. [Google Scholar] [CrossRef]
16. Zou, Q. (2000). Plant physiology experimental guidance. Beijing, Chinese: China Agricultural Press. [Google Scholar]
17. Fang, Z. W., Wang, X. X., Zhang, X. Y., Zhao, D. Q., Tao, J. (2020). Effects of fulvic acid on the photosynthetic and physiological characteristics of Paeonia ostii under drought stress. Plant Signaling & Behavior, 15(7), e1774714. DOI 10.1080/15592324.2020.1774714. [Google Scholar] [CrossRef]
18. Tian, F. X., Gong, J. F., Zhang, J., Zhang, M., Wang, G. K. et al. (2013). Enhanced stability of thylakoid membrane proteins and antioxidant competence contribute to drought stress resistance in the tasg1 wheat stay-green mutant. Journal of Experimental Botany, 64(6), 1509–1520. DOI 10.1093/jxb/ert004. [Google Scholar] [CrossRef]
19. Xu, J. Q., Jin, J. J., Zhao, H., Li, K. L. (2019). Drought stress tolerance analysis of Populus ussuriensis clones with different ploidies. Journal of Forestry Research, 30(4), 1267–1275. DOI 10.1007/s11676-018-0729-z. [Google Scholar] [CrossRef]
20. Genty, B., Briantais, J. M., Baker, N. R. (1989). The relationship between the quantum yield of photosynthetic electron transport and quenching of chlorophyll fluorescence. Biochimica et Biophysica Acta, 990(1), 87–92. DOI 10.1016/S0304-4165(89)80016-9. [Google Scholar] [CrossRef]
21. van Kooten, O., Snel, J. F. (1990). The use of chlorophyll fluorescence nomenclature in plant stress physiology. Photosynthesis Research, 25(3), 147–150. DOI 10.1007/bf00033156. [Google Scholar] [CrossRef]
22. Zhao, D. Q., Fang, Z. W., Tang, Y. H., Tao, J. (2020). Graphene oxide as an effective soil water retention agent can confer drought stress tolerance to Paeonia ostii without toxicity. Environmental Science & Technology, 54(13), 8269–8279. DOI 10.1021/acs.est.0c02040. [Google Scholar] [CrossRef]
23. Kotak, S., Larkindale, J., Lee, U., von Koskull-Doring, P., Vierling, E. et al. (2007). Complexity of the heat stress response in plants. Current Opinion in Plant Biology, 10(3), 310–316. DOI 10.1016/j.pbi.2007.04.011. [Google Scholar] [CrossRef]
24. Sharif, P., Seyedsalehi, M., Paladino, O., Van Damme, P., Sillanpaa, M. et al. (2018). Effect of drought and salinity stresses on morphological and physiological characteristics of canola. International Journal of Environmental Science and Technology, 15(9), 1859–1866. DOI 10.1007/s13762-017-1508-7. [Google Scholar] [CrossRef]
25. Manafi, H., Baninasab, B., Gholami, M., Talebi, M., Khanizadeh, S. (2021). Exogenous melatonin alleviates heat-induced oxidative damage in strawberry (Fragaria × ananassa Duch. cv. Ventana) Plant. Journal of Plant Growth Regulation, 161, 1–13. DOI 10.1007/s00344-020-10279-x. [Google Scholar] [CrossRef]
26. Bhandari, K., Siddique, K. H. M., Turner, N. C., Kaur, J., Singh, S. et al. (2016). Heat stress at reproductive stage disrupts leaf carbohydrate metabolism, impairs reproductive function, and severely reduces seed yield in lentil. Journal of Crop Improvement, 30(2), 118–151. DOI 10.1080/15427528.2015.1134744. [Google Scholar] [CrossRef]
27. Karami, L., Ghaderi, N., Javadi, T. (2017). Morphological and physiological esponses of rapevine (Vitis vinifera L.) to drought tress and dust pollution. Folia Hortic, 29(2), 231–240. DOI 10.1515/fhort-2017-0021. [Google Scholar] [CrossRef]
28. Farooq, M., Wahid, A., Kobayashi, N., Fujita, D., Basra, S. M. A. (2009). Plant drought stress: Effects, mechanisms and management. Agronomy for Sustainable Development, 29(1), 185–212. DOI 10.1051/agro:2008021. [Google Scholar] [CrossRef]
29. Sarker, U., Oba, S. (2018). Drought stress effects on growth, ROS markers, compatible solutes, phenolics, flavonoids, and antioxidant activity in Amaranthus tricolor. Applied Biochemistry and Biotechnology, 186(4), 999–1016. DOI 10.1007/s12010-018-2784-5. [Google Scholar] [CrossRef]
30. Tyystjarvi, E. (2013). Photoinhibition of photosystem II. Intenational Review of Cell and Molecular Biology, 300, 243–303. DOI 10.1016/b978-0-12-405210-9.00007-2. [Google Scholar] [CrossRef]
31. Zhao, D. Q., Zhang, X. Y., Fang, Z. W., Wu, Y. Q., Tao, J. (2019). Physiological and transcriptomic analysis of tree peony (Paeonia section Moutan DC.) in response to drought stress. Forests, 10(2), 135. DOI 10.3390/f10020135. [Google Scholar] [CrossRef]
32. Luo, Y., Li, F., Wang, G. P., Yang, X. H., Wang, W. (2010). Exogenously-supplied trehalose protects thylakoid membranes of winter wheat from heat-induced damage. Biologia Plantarum, 54(3), 495–501. DOI 10.1007/s10535-010-0087-y. [Google Scholar] [CrossRef]
33. Sangwan, V., Foulds, I., Singh, J., Dhindsa, R. S. (2001). Cold-activation of Brassica napus BN115 promoter is mediated by structural changes in membranes and cytoskeleton, and requires Ca2+ influx. Plant Journal, 27(1), 1–12. DOI 10.1046/j.1365-313x.2001.01052.x. [Google Scholar] [CrossRef]
34. Sangwan, V., Orvar, B. L., Beyerly, J., Hirt, H., Dhindsa, R. S. (2002). Opposite changes in membrane fluidity mimic cold and heat stress activation of distinct plant MAP kinase pathways. Plant Journal, 31(5), 629–638. DOI 10.1046/j.1365-313X.2002.01384.x. [Google Scholar] [CrossRef]
35. Chen, X. M., Qiu, L. L., Guo, H. P., Wang, Y., Yuan, H. W. et al. (2017). Spermidine induces physiological and biochemical changes in southern highbush blueberry under drought stress. Brazilian Journal of Botany, 40(4), 841–851. DOI 10.1007/s40415-017-0401-4. [Google Scholar] [CrossRef]
36. Zhao, D. Q., Li, T. T., Hao, Z. J., Cheng, M. L., Tao, J. (2019). Exogenous trehalose confers high temperature stress tolerance to herbaceous peony by enhancing antioxidant systems, activating photosynthesis, and protecting cell structure. Cell Stress and Chaperones, 24(1), 247–257. DOI 10.1007/s12192-018-00961-1. [Google Scholar] [CrossRef]
37. Suleman, P., Redha, A., Afzal, M., Al-Hasan, R. (2013). Temperature-induced changes of malondialdehyde, heat-shock proteins in relation to chlorophyll fluorescence and photosynthesis in Conocarpus lancifolius (Engl.). Acta Physiologiae Plantarum, 35(4), 1223–1231. DOI 10.1007/s11738-012-1161-1. [Google Scholar] [CrossRef]
38. Gadelha, C. G., Miranda, R. D., Alencar, N. L. M., Costa, J. H., Prisco, J. T. et al. (2017). Exogenous nitric oxide improves salt tolerance during establishment of Jatropha curcas seedlings by ameliorating oxidative damage and toxic ion accumulation. Journal of Plant Physiology, 212, 69–79. DOI 10.1016/j.jplph.2017.02.005. [Google Scholar] [CrossRef]
39. Talbi, S., Romero-Puertas, M. C., Hernandez, A., Terron, L., Ferchichi, A. et al. (2015). Drought tolerance in a Saharian plant Oudneya africana: Role of antioxidant defences. Environmental and Experimental Botany, 111(15), 114–126. DOI 10.1016/j.envexpbot.2014.11.004. [Google Scholar] [CrossRef]
40. Wu, S. W., Hu, C. X., Tan, Q. L., Li, L., Shi, K. L. et al. (2015). Drought stress tolerance mediated by zinc-induced antioxidative defense and osmotic adjustment in cotton (Gossypium Hirsutum). Acta Physiologiae Plantarum, 37(8), 167. DOI 10.1007/s11738-015-1919-3. [Google Scholar] [CrossRef]
41. Chaitanya, K. V., Sundar, D., Masilamani, S., Reddy, A. R. (2002). Variation in heat stress-induced antioxidant enzyme activities among three mulberry cultivars. Plant Growth Regulation, 36(2), 175–180. DOI 10.1023/a:1015092628374. [Google Scholar] [CrossRef]
42. Hui, Y., Chen, Q., Yi, M. (2008). Effects of short-term heat stress on oxidative damage and responses of antioxidant system in Lilium longiflorum. Plant Growth Regulation, 54(1), 45–54. DOI 10.1007/s10725-007-9227-6. [Google Scholar] [CrossRef]
43. Amin, B., Atif, M. J., Wang, X., Meng, H., Ghani, M. I. et al. (2021). Effect of low temperature and high humidity stress on physiology of cucumber at different leaf stages. Plant Biology, 23(5), 785–796. DOI 10.1111/plb.13276. [Google Scholar] [CrossRef]
44. Li, C. J., Han, Y. Y., Hao, J. H., Qin, X. X., Liu, C. J. et al. (2020). Effects of exogenous spermidine on antioxidants and glyoxalase system of lettuce seedlings under high temperature. Plant Signaling & Behavior, 15(12), 1824697. DOI 10.1080/15592324.2020.1824697. [Google Scholar] [CrossRef]
45. Crafts-Brandner, S. J., Law, R. D. (2000). Effect of heat stress on the inhibition and recovery of the ribulose-1, 5-bisphosphate carboxylase/oxygenase activation state. Planta, 212(1), 67–74. DOI 10.1007/s004250000364. [Google Scholar] [CrossRef]
46. Monneveux, P., Rekika, D., Acevedo, E., Merah, O. (2006). Effect of drought on leaf gas exchange, carbon isotope discrimination, transpiration efficiency and productivity in field grown durum wheat genotypes. Plant Science, 170(4), 867–872. DOI 10.1016/j.plantsci.2005.12.008. [Google Scholar] [CrossRef]
47. Jia, C. H., Yu, X. J., Zhang, M., Liu, Z. G., Zou, P. et al. (2020). Application of melatonin-enhanced tolerance to high-temperature stress in cherry radish (Raphanus sativus L. var. radculus pers). Journal of Plant Growth Regulation, 39(2), 631–640. DOI 10.1007/s00344-019-10006-1. [Google Scholar] [CrossRef]
48. Wise, R. R., Olson, A. J., Schrader, S. M., Sharkey, T. D. (2004). Electron transport is the functional limitation of photosynthesis in field-grown Pima cotton plants at high temperature. Plant Cell and Environment, 27(6), 717–724. DOI 10.1111/j.1365-3040.2004.01171.x. [Google Scholar] [CrossRef]
49. Demmig-Adams, B., Adams, W. W. (1992). Photoprotection and other responses of plants to high light stress. Annual Review of Plant Biology, 43(1), 599–626. DOI 10.1146/annurev.pp.43.060192.003123. [Google Scholar] [CrossRef]
50. Krause, G. H., Weis, E. (1991). Chlorophyll fluorescence and photosynthesis: The basics. Annual Review of Plant Physiology, 42(1), 313–349. DOI 10.1146/annurev.pp.42.060191.001525. [Google Scholar] [CrossRef]
51. Kramer, D. M., Johnson, G., Kiirats, O., Edwards, G. E. (2004). New fluorescence parameters for the determination of QA redox state and excitation energy fluxes. Photosynthesis Research, 79(2), 209–218. DOI 10.1023/B:PRES.0000015391.99477.0d. [Google Scholar] [CrossRef]
52. Evensen, N. R., Fine, M., Perna, G., Voolstra, C. R., Barshis, D. J. (2021). Remarkably high and consistent tolerance of a red sea coral to acute and chronic thermal stress exposures. Limnology and Oceanography, 66(5), 1718–1729. DOI 10.1002/lno.11715. [Google Scholar] [CrossRef]
 | This work is licensed under a Creative Commons Attribution 4.0 International License, which permits unrestricted use, distribution, and reproduction in any medium, provided the original work is properly cited. |