| Phyton-International Journal of Experimental Botany |
DOI: 10.32604/phyton.2022.018707
ARTICLE
Multi-Environmental Genetic Analysis of Grain Size Traits Based on Chromosome Segment Substitution Line in Rice (Oryza sativa L.)
1Jiangsu Key Laboratory of Crop Genomics and Molecular Breeding, Key Laboratory of Plant Functional Genomics of the Ministry of Education, Jiangsu Key Laboratory of Crop Genetics and Physiology, Jiangsu Co-Innovation Center for Modern Production Technology of Grain Crops, College of Agriculture, Yangzhou University, Yangzhou, 225009, China
2National Key Laboratory of Plant Molecular Genetics, CAS Center for Excellence in Molecular Plant Sciences, Shanghai Institute of Plant Physiology and Ecology, Chinese Academy of Sciences, Shanghai, 200032, China
3University of Chinese Academy of Sciences, Beijing, 100049, China
4Innovation Academy for Seed Design, Chinese Academy of Sciences, Beijing, 100101, China
*Corresponding Authors: Jiping Gao. Email: jpgao@yzu.edu.cn; Sukui Jin. Email: skjin@yzu.edu.cn
#These authors contributed equally to this work
Received: 30 September 2021; Accepted: 10 November 2021
Abstract: Grain size traits are critical agronomic traits which directly determine grain yield, but the genetic bases of these traits are still not well understood. In this study, a total of 154 chromosome segment substitution lines (CSSLs) population derived from a cross between a japonica variety Koshihikari and an indica variety Nona Bokra was used to investigate grain length (GL), grain width (GW), length-width ratio (LWR), grain perimeter (GP), grain area (GA), and thousand grain weight (TGW) under four environments. QTL mapping analysis of six grain size traits was performed by QTL IciMapping 4.2 with an inclusive composite interval mapping (ICIM) model. A total of 64 QTLs were identified for these traits, which mapped to chromosomes 1, 2, 3, 4, 6, 7, 8, 10, 11, and 12 and accounted for 1.6%–27.1% of the total phenotypic variations. Among these QTLs, thirty-six loci were novel and seven QTLs were identified under four environments. One locus containing the known grain size gene, qGL3/GL3.1/OsPPKL1, also have been found. Moreover, five pairs of digenic epistatic interactions were identified except for GL and GP. These findings will facilitate fine mapping of the candidate gene and QTL pyramiding to genetically improve grain yield in rice.
Keywords: Rice; grain size; quantitative trait loci; epistatic; chromosome segment substitution lines
Rice (Oryza sativa L.) is an important staple food feeding more than half of the world’s population. To meet the demand for food for the rapid growth of the population, continuous improvements of the rice yield will be necessary [1]. Rice grain yield is major determined by the number of panicles per plant or effective tillers per plant, the number of grains per panicle, and the grain weight [2,3]. Grain size, which is closely associated with grain weight, is made up of grain length, grain width, grain thickness, and length-to-width ratio, etc., which are key determinants of grain yield and grain quality [4,5]. Therefore, the improvement of grain size traits is one of the most important tasks for rice breeders to increase rice production.
Rice grain size traits are genetically controlled by numerous quantitative trait loci (QTLs) [6]. To date, QTL mapping for rice grain size traits using different populations, which derived from various biparental crosses, has been reported in many previous studies [7–17]. Some of QTLs identified in these populations have been cloned, such as GS3 [18], GW2 [19], GW5/qSW5/GSE5 [20–23], GS5 [24], qGL3/GL3.1/OsPPKL1 [25–27], GW8/OsSPL16 [28], TGW6 [29], GW6a [30], GW7/GL7/SLG7 [31–33], GS2/GL2/GLW2/PT2 [34–38], GLW7 [39], GS9 [40], qLGY3/OsLG3b [41,42], TGW3/qTGW3/GL3.3/OsSK41 [43–45], TGW2 [46], OsAUX3 [47]. Although a large number of QTLs for grain size traits have been mapped or cloned, and these results have facilitated a better understanding of the genetic basis of the grain size, it still needs to identify new QTL or genes to understand the complex mechanisms of grain size traits.
Using chromosome segment substitution lines (CSSLs) is a good strategy for QTL mapping. The substitution lines are the complete integration of the substituted segments with the stability of a certain character, which could reduce the interference of background noise and improve the accuracy of QTL mapping [48]. A large number of CSSLs sets have been developed to identify the QTLs for rice agronomic traits, including the grain size traits [47,49–53].
Koshihikari is a well-known japonica rice variety in Japan, which exhibits a good eating quality, cold tolerance at the booting stage, and high resistance to pre-harvest germination [54]. Nona Bokra is a typical indica variety from India with high tolerance to salt stress [55,56]. Utilization of Koshihikari and Nona Bokra to identify QTLs for salt tolerance and rice grain quality have been reported [54,55], but there is no report on grain size traits. In this study, a CSSLs population containing 154 lines, which is derived from a cross between Koshihikari and Nona Bokra, was used to analyze the QTLs for grain size traits in rice under four environments. The results could provide valuable information to further elucidate the genetic basis of rice grain size as well as for marker-assisted selection in rice breeding.
The CSSLs population consisting of 154 lines was derived from the cross of a japonica cultivar Koshihikari (recipient parent) and an indica rice cultivar Nona Bokra (donor parent). The construction of the CSSLs population was described by Hao et al. [54]. In brief, the F1 plants were obtained from the cross of Koshihikari and Nona Bokra, and then backcrossed to Nona Bokra three times to produce 680 BC3F1 seed. Based on 102 polymorphisms CAPS and SSR markers covering the whole rice genome, 71 individuals which have a single, relatively long heterozygous chromosome segment were selected [57,58]. a total of 3266 BC3F2 plants were produced from the self-pollinated of 71 individuals. Based on the marker-assisted selection (MAS), 154 BC3F2 plants were finally selected as the CSSLs population. The field trials were conducted in Shanghai (SH, 121°24′ E, 31°00′ N) and Lingshui (LS, 110°00′ E, 18°31′ N) during the 2015 and 2016 rice-growing seasons, respectively. Trials in each environment were laid out in a completely randomized block design, with a planting density of 20 cm × 20 cm. Three replicates were growth and each line was planted in four rows with six plants. The management of field experiments including irrigation, fertilizer application and pest control, was in line with normal agricultural standard practices.
2.2 Evaluation of Grain Size Related Traits
Approximately 40 days after flowering, rice grains were harvested. Freshly harvested paddy was air-dried and stored at room temperature for 3 months before testing. Six grain size traits were measured in this study, such as grain length (GL), grain width (GW), length-width ratio (LWR), grain perimeter (GP), grain area (GA), and thousand grain weight (TGW). The GL, GW, GP, GA, and TGW traits were evaluated using WSeen SC-G automatic seed testing system and thousand grain weight analysis system (Hangzhou WSeen Detection Technology Co., Ltd., China). About 100–200 grains for each entry were evaluated. LWR was calculated as the ratio of GL and GW.
The phenotypic data of the two parents and the CSSLs population was analyzed using Microsoft Excel 2016. The density plot was analyzed using the ggplot2 package in R. Trait correlations were calculated and plotted using the corrplot package in R.
A total of 126 polymorphism markers between Koshihikari and Nona Bokra was selected to screen the CSSLs population. QTLs for each trait were detected using QTL IciMapping 4.2 with inclusive composite interval mapping (ICIM) model, and a threshold LOD of 2.5 was applied [59,60]. The additive effects, genetic parameters and variation percentages of the QTLs were also estimated. The QTL named followed the method of McCouch et al. [61]. The genetic map was drawn using MapChart version 2.32 software [62].
2.5 DNA Extraction and Gene Sequencing
Genomic DNA was extracted from fresh leaves using CTAB method [63]. The coding region of qGL3/GL3.1/OsPPKL1 was amplified from genomic DNA using 2 × Phanta Max Master Mix (Vazyme, Nanjing, China). PCRs were conducted using standard PCR protocols. The primers used for sequencing are listed in Table S1.
3.1 Phenotypic Variation in Parents and the CSSLs Population
The grain size traits of the parents and 154 CSSLs population, such as grain length (GL), grain width (GW), length-width ratio (LWR), grain perimeter (GP), grain area (GA), and thousand grain weight (TGW), were list in Table 1. Because of the insensitivity to photoperiod, the indica variety Nona Bokra could not harvest the seeds in Shanghai. Therefore, we can only compare the grain size traits of the parental in Lingshui. All traits exhibited significant differences between parents in Lingshui 2015 and 2016. The value of grain size traits in Nona
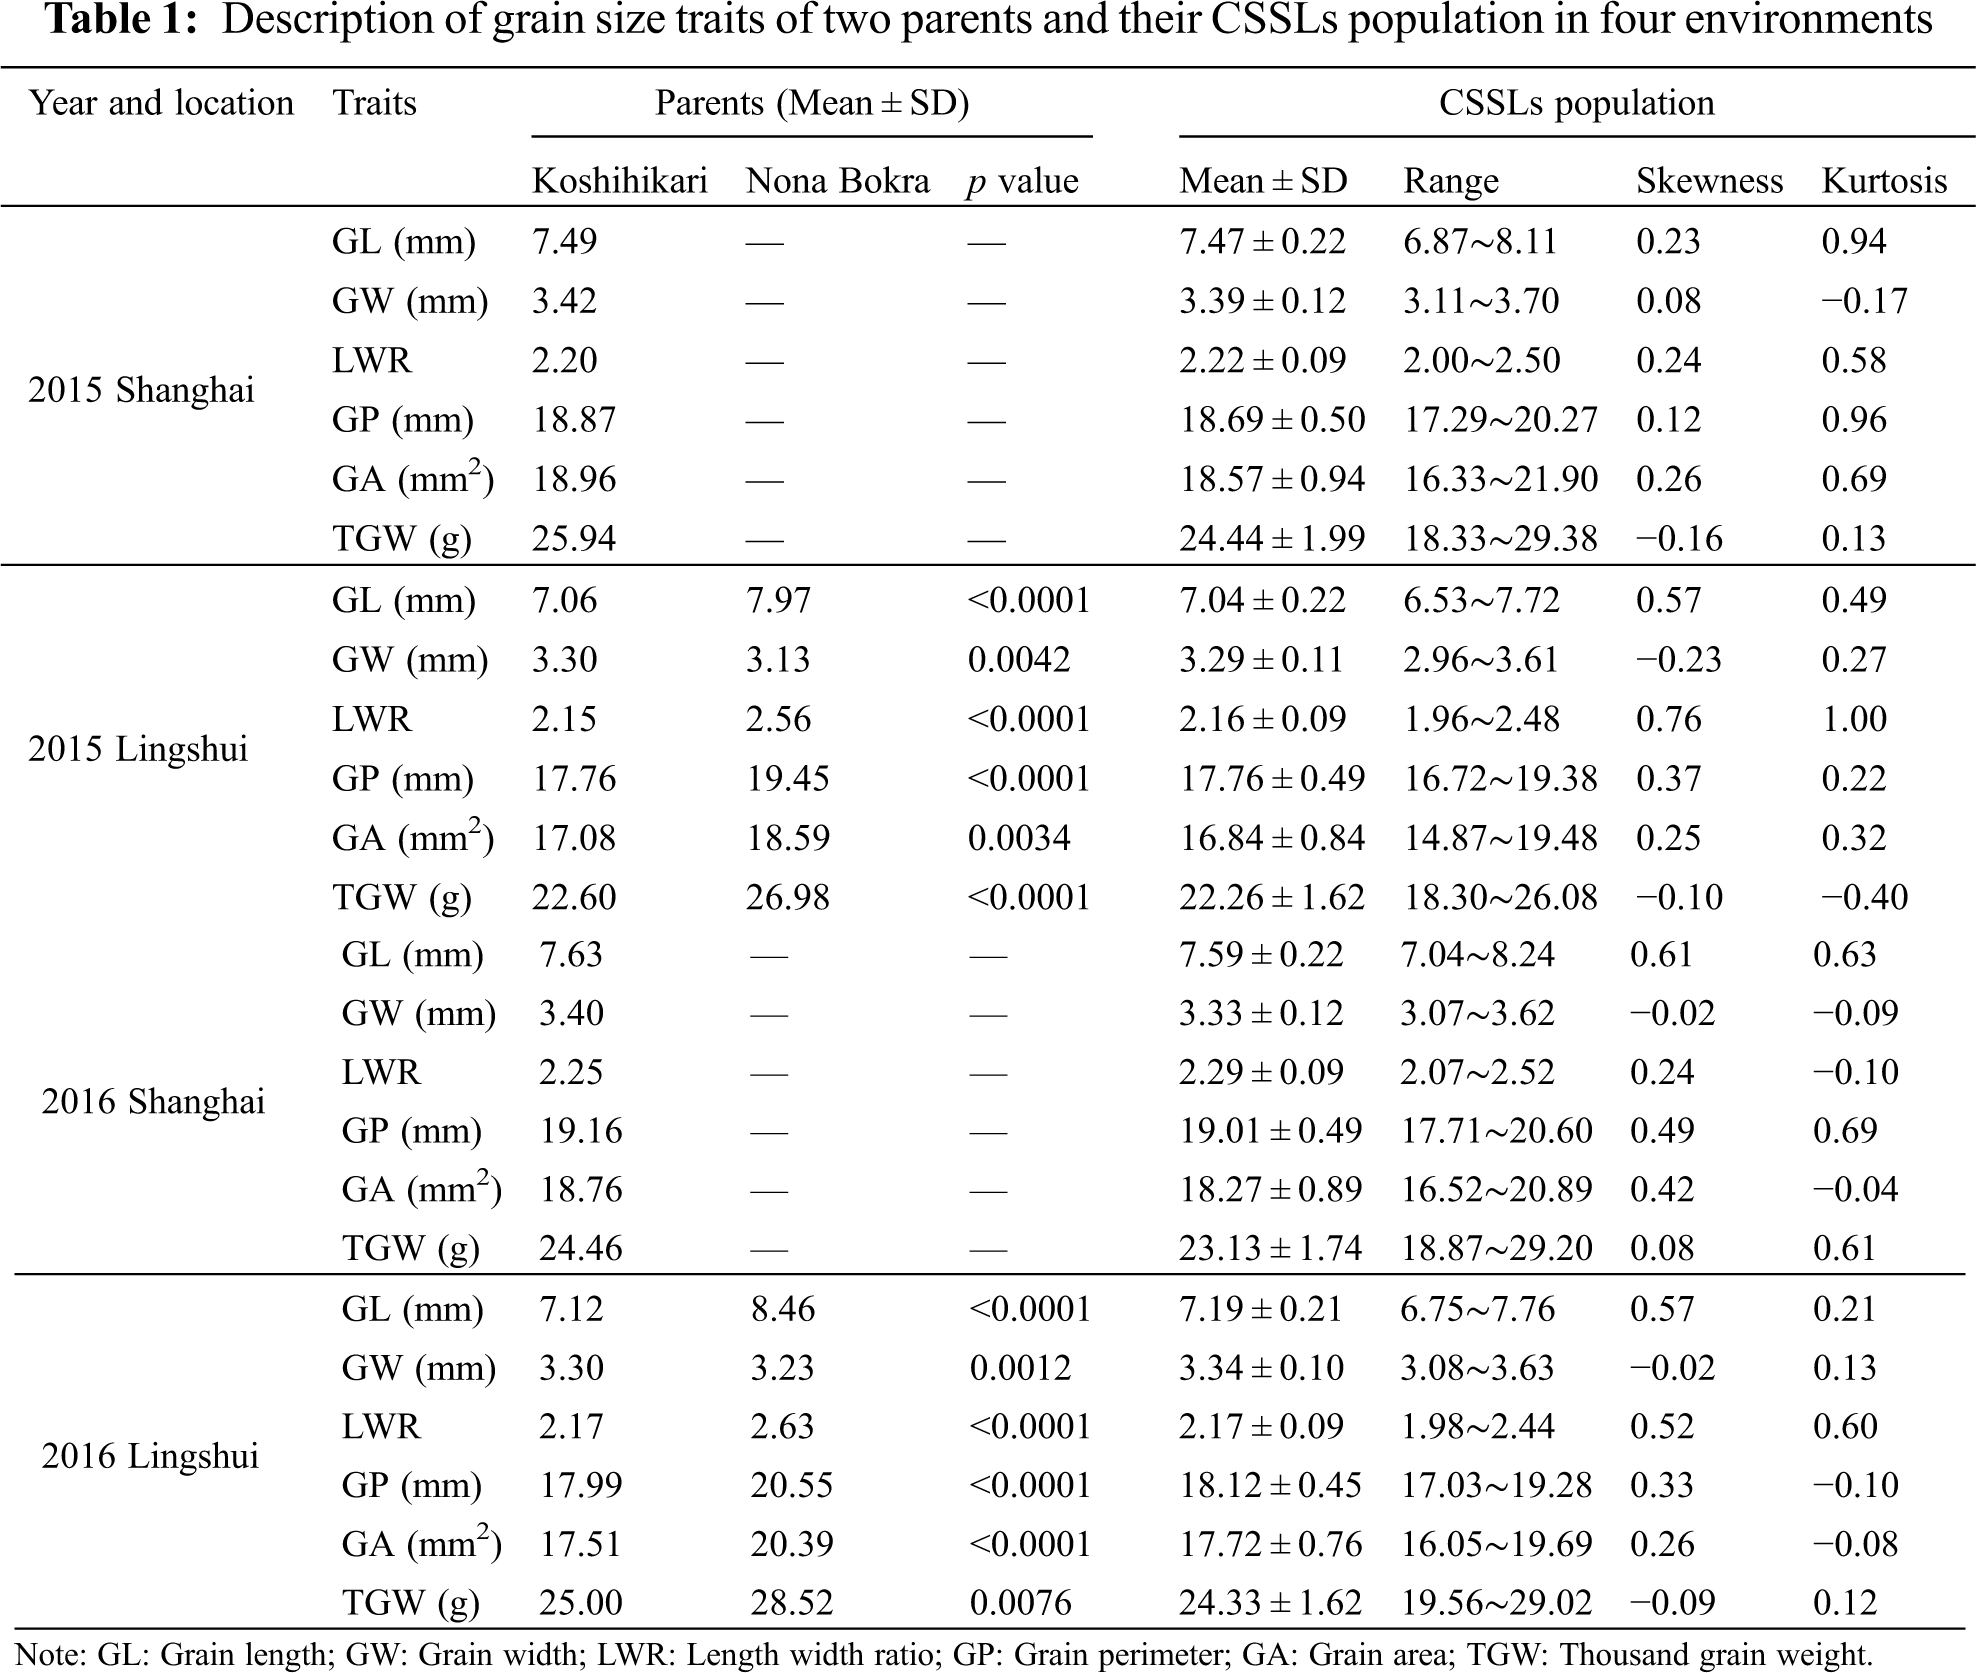
Bokra was significantly higher than that of Koshihikari except for GW in Lingshui 2015 and 2016. A wide range of values for all the grain size traits was observed in CSSLs population (Table 1). The frequency distribution of each trait displayed a continuous variation under four environments, and the absolute values of skewness and kurtosis were less than 1, suggesting these traits followed a normal distribution and were suitable for QTL analysis (Fig. 1, Table 1).
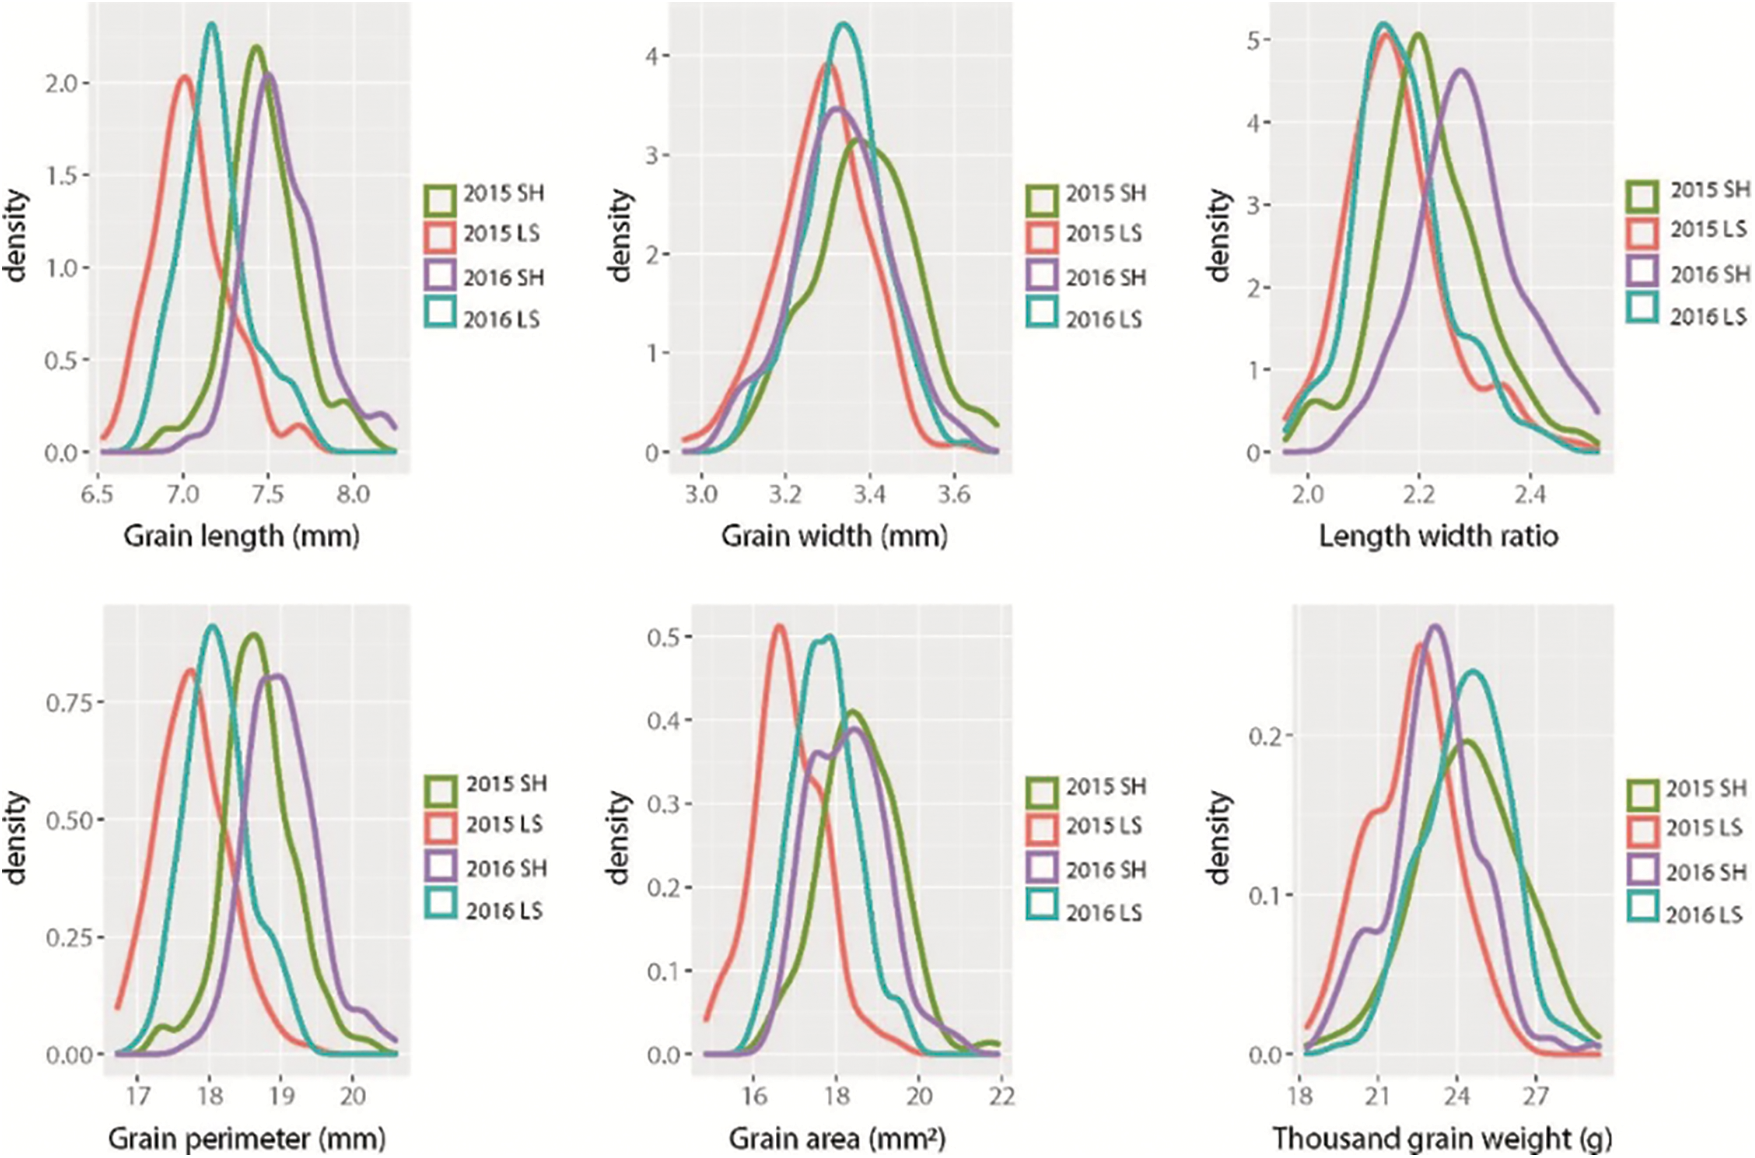
Figure 1: Frequency distributions of six grain size traits in CSSLs population in four environments. SH: Shanghai; LS: Lingshui
3.2 Correlation Analysis of Grain Size Traits
The correlation analyses of GW, GL, LWR, GP, GA, and TGW under four environments were performed as shown in Fig. 2. GL and GP showed positive correlations with the other five traits. GL exhibited the highest significant positive correlation with GP, with correlation coefficients reaching up to 0.95 in Shanghai 2015, 0.95 in Lingshui 2015, 0.96 in Shanghai 2016, and 0.95 in Lingshui 2016, indicating that GL was the most important contributor to GP. Similarly, GP exhibited the highest significant positive correlation with GA, the correlations coefficients were 0.88 in Shanghai 2015, 0.87 in Lingshui 2015, 0.89 in Shanghai 2016, and 0.89 in Lingshui 2016. GW showed the highest significant negative correlation with LWR, the correlations coefficients were −0.74, −0.68, −0.72, and −0.68, respectively.
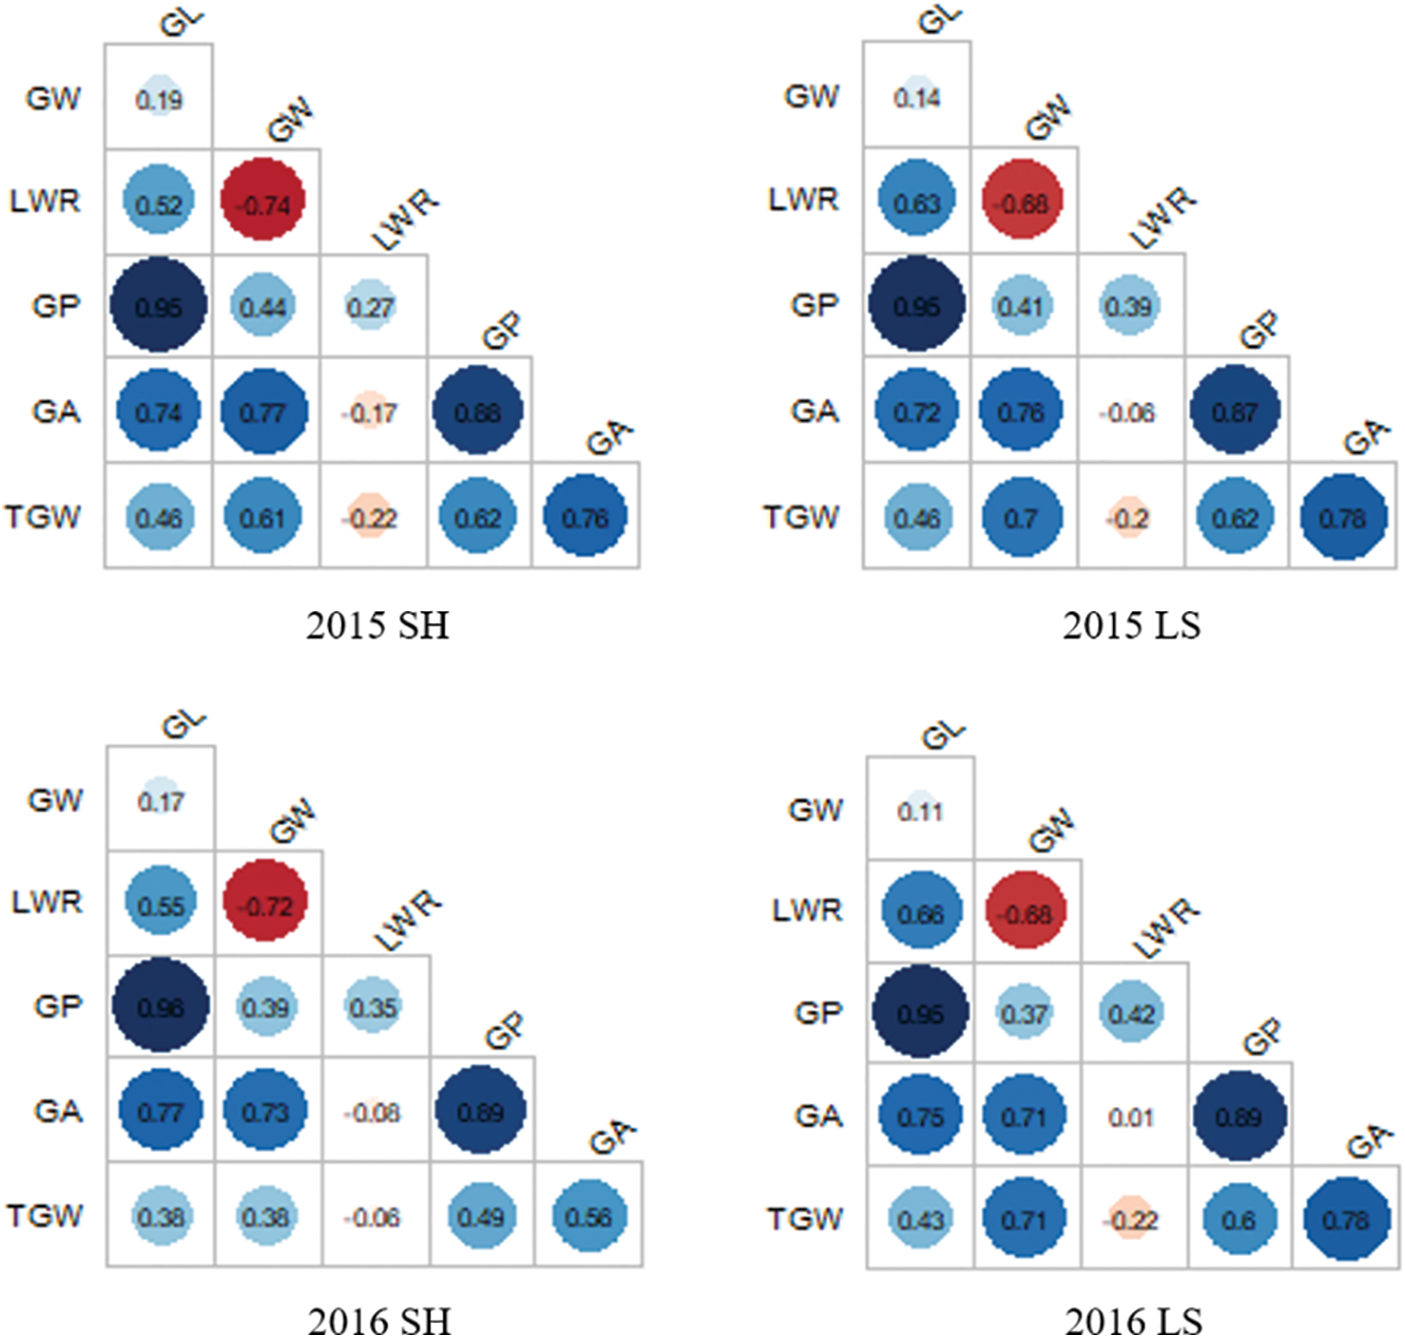
Figure 2: Trait correlations for six grain size traits in CSSLs populations in four environments. SH: Shanghai; LS: Lingshui; GL: Grain length; GW: Grain width; LWR: Length width ratio; GP: Grain perimeter; GA: Grain area; TGW: Thousand grain weight
3.3 Identification QTLs for Grain Size Traits
A total of 64 QTLs were identified for six grain size traits on chromosomes 1, 2, 3, 4, 6, 7, 8, 10, 11, and 12 in Shanghai 2015, Lingshui 2015, Shanghai 2016, and Lingshui 2016. The LOD score values of these QTLs ranged from 2.53 to 29.34, with individually accounted for 1.6% to 27.1% of the phenotypic variation (Fig. 3, Table 2).
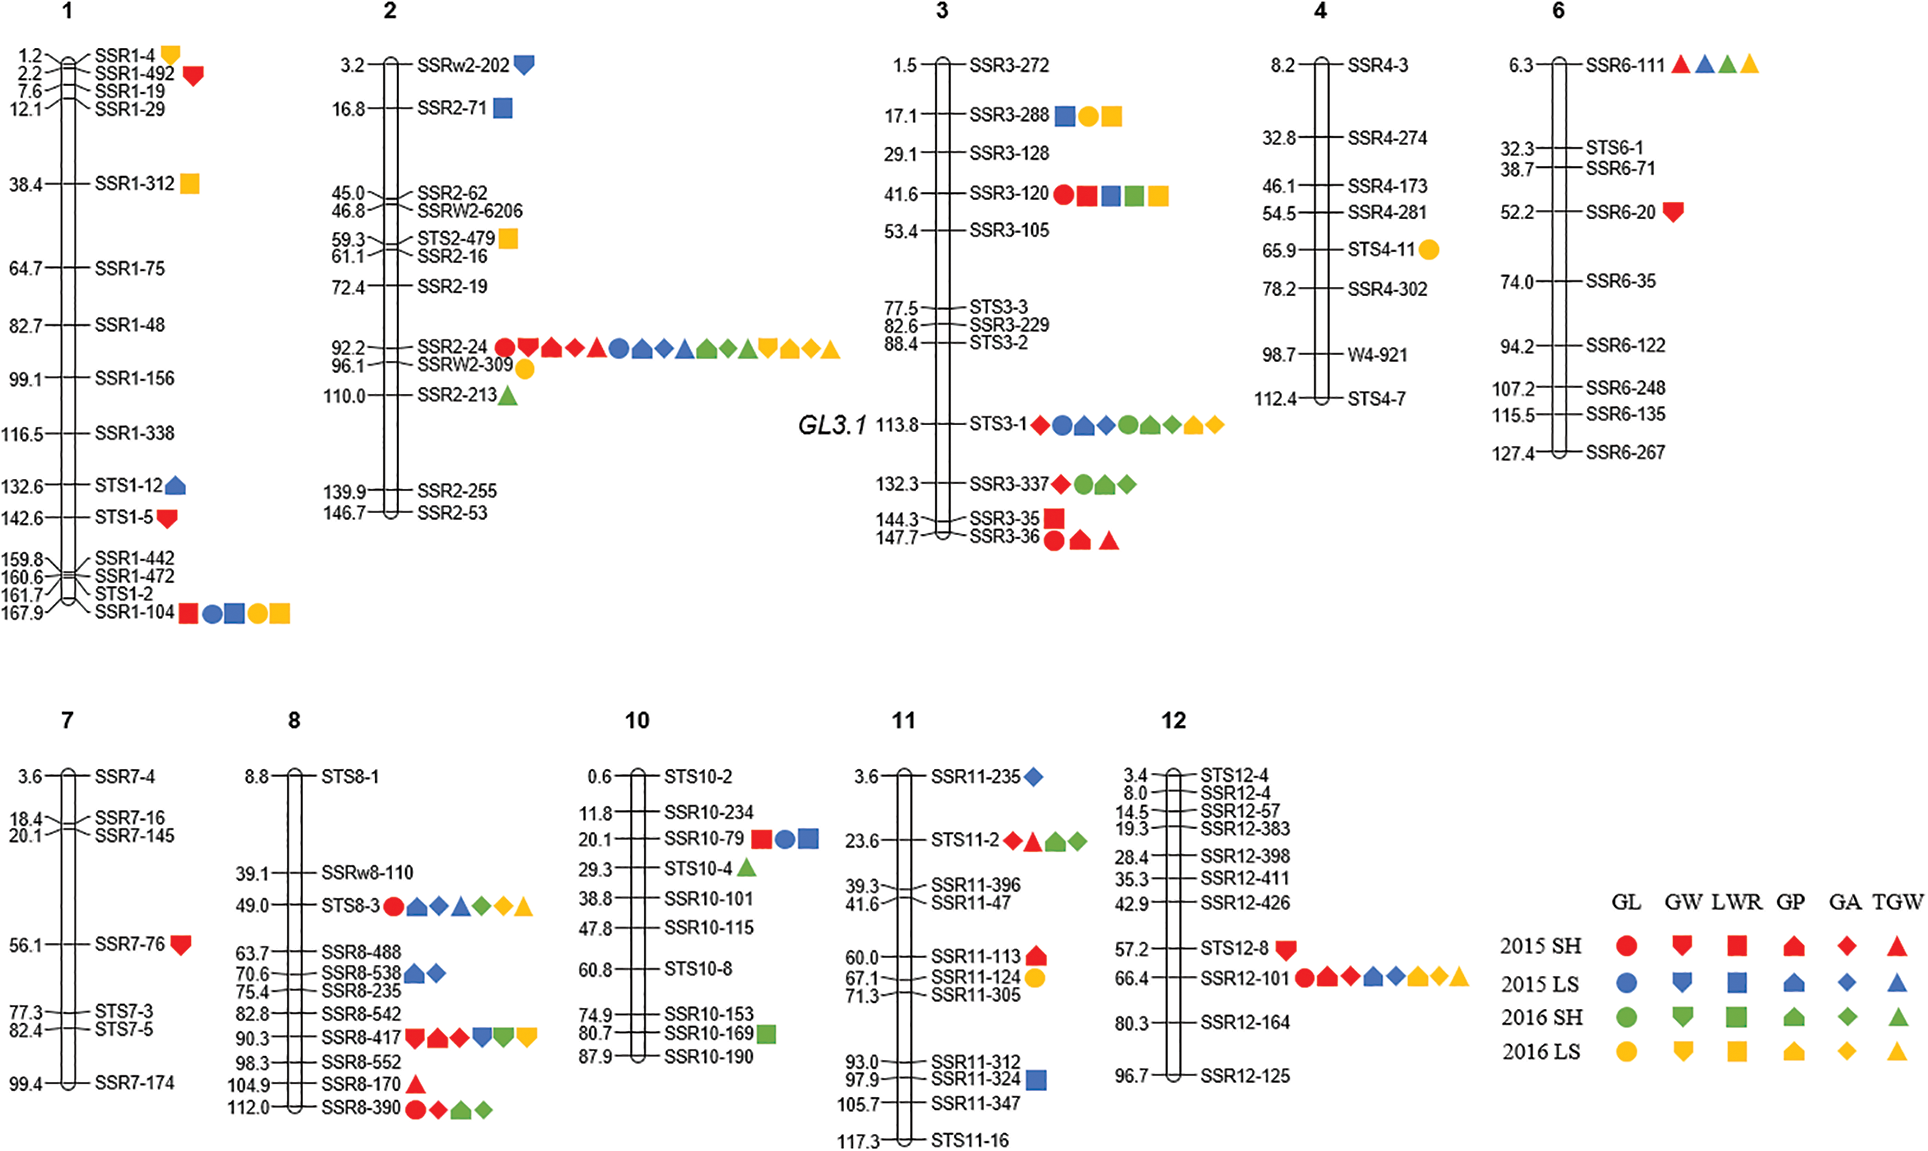
Figure 3: Locations of QTLs for six grain size traits in CSSLs population in four environments. DNA markers are shown on the right side of each chromosome and the genetic distance are shown on the left side of each chromosome. SH: Shanghai; LS: Lingshui; GL: Grain length; GW: Grain width; LWR: Length width ratio; GP: Grain perimeter; GA: Grain area; TGW: Thousand grain weight
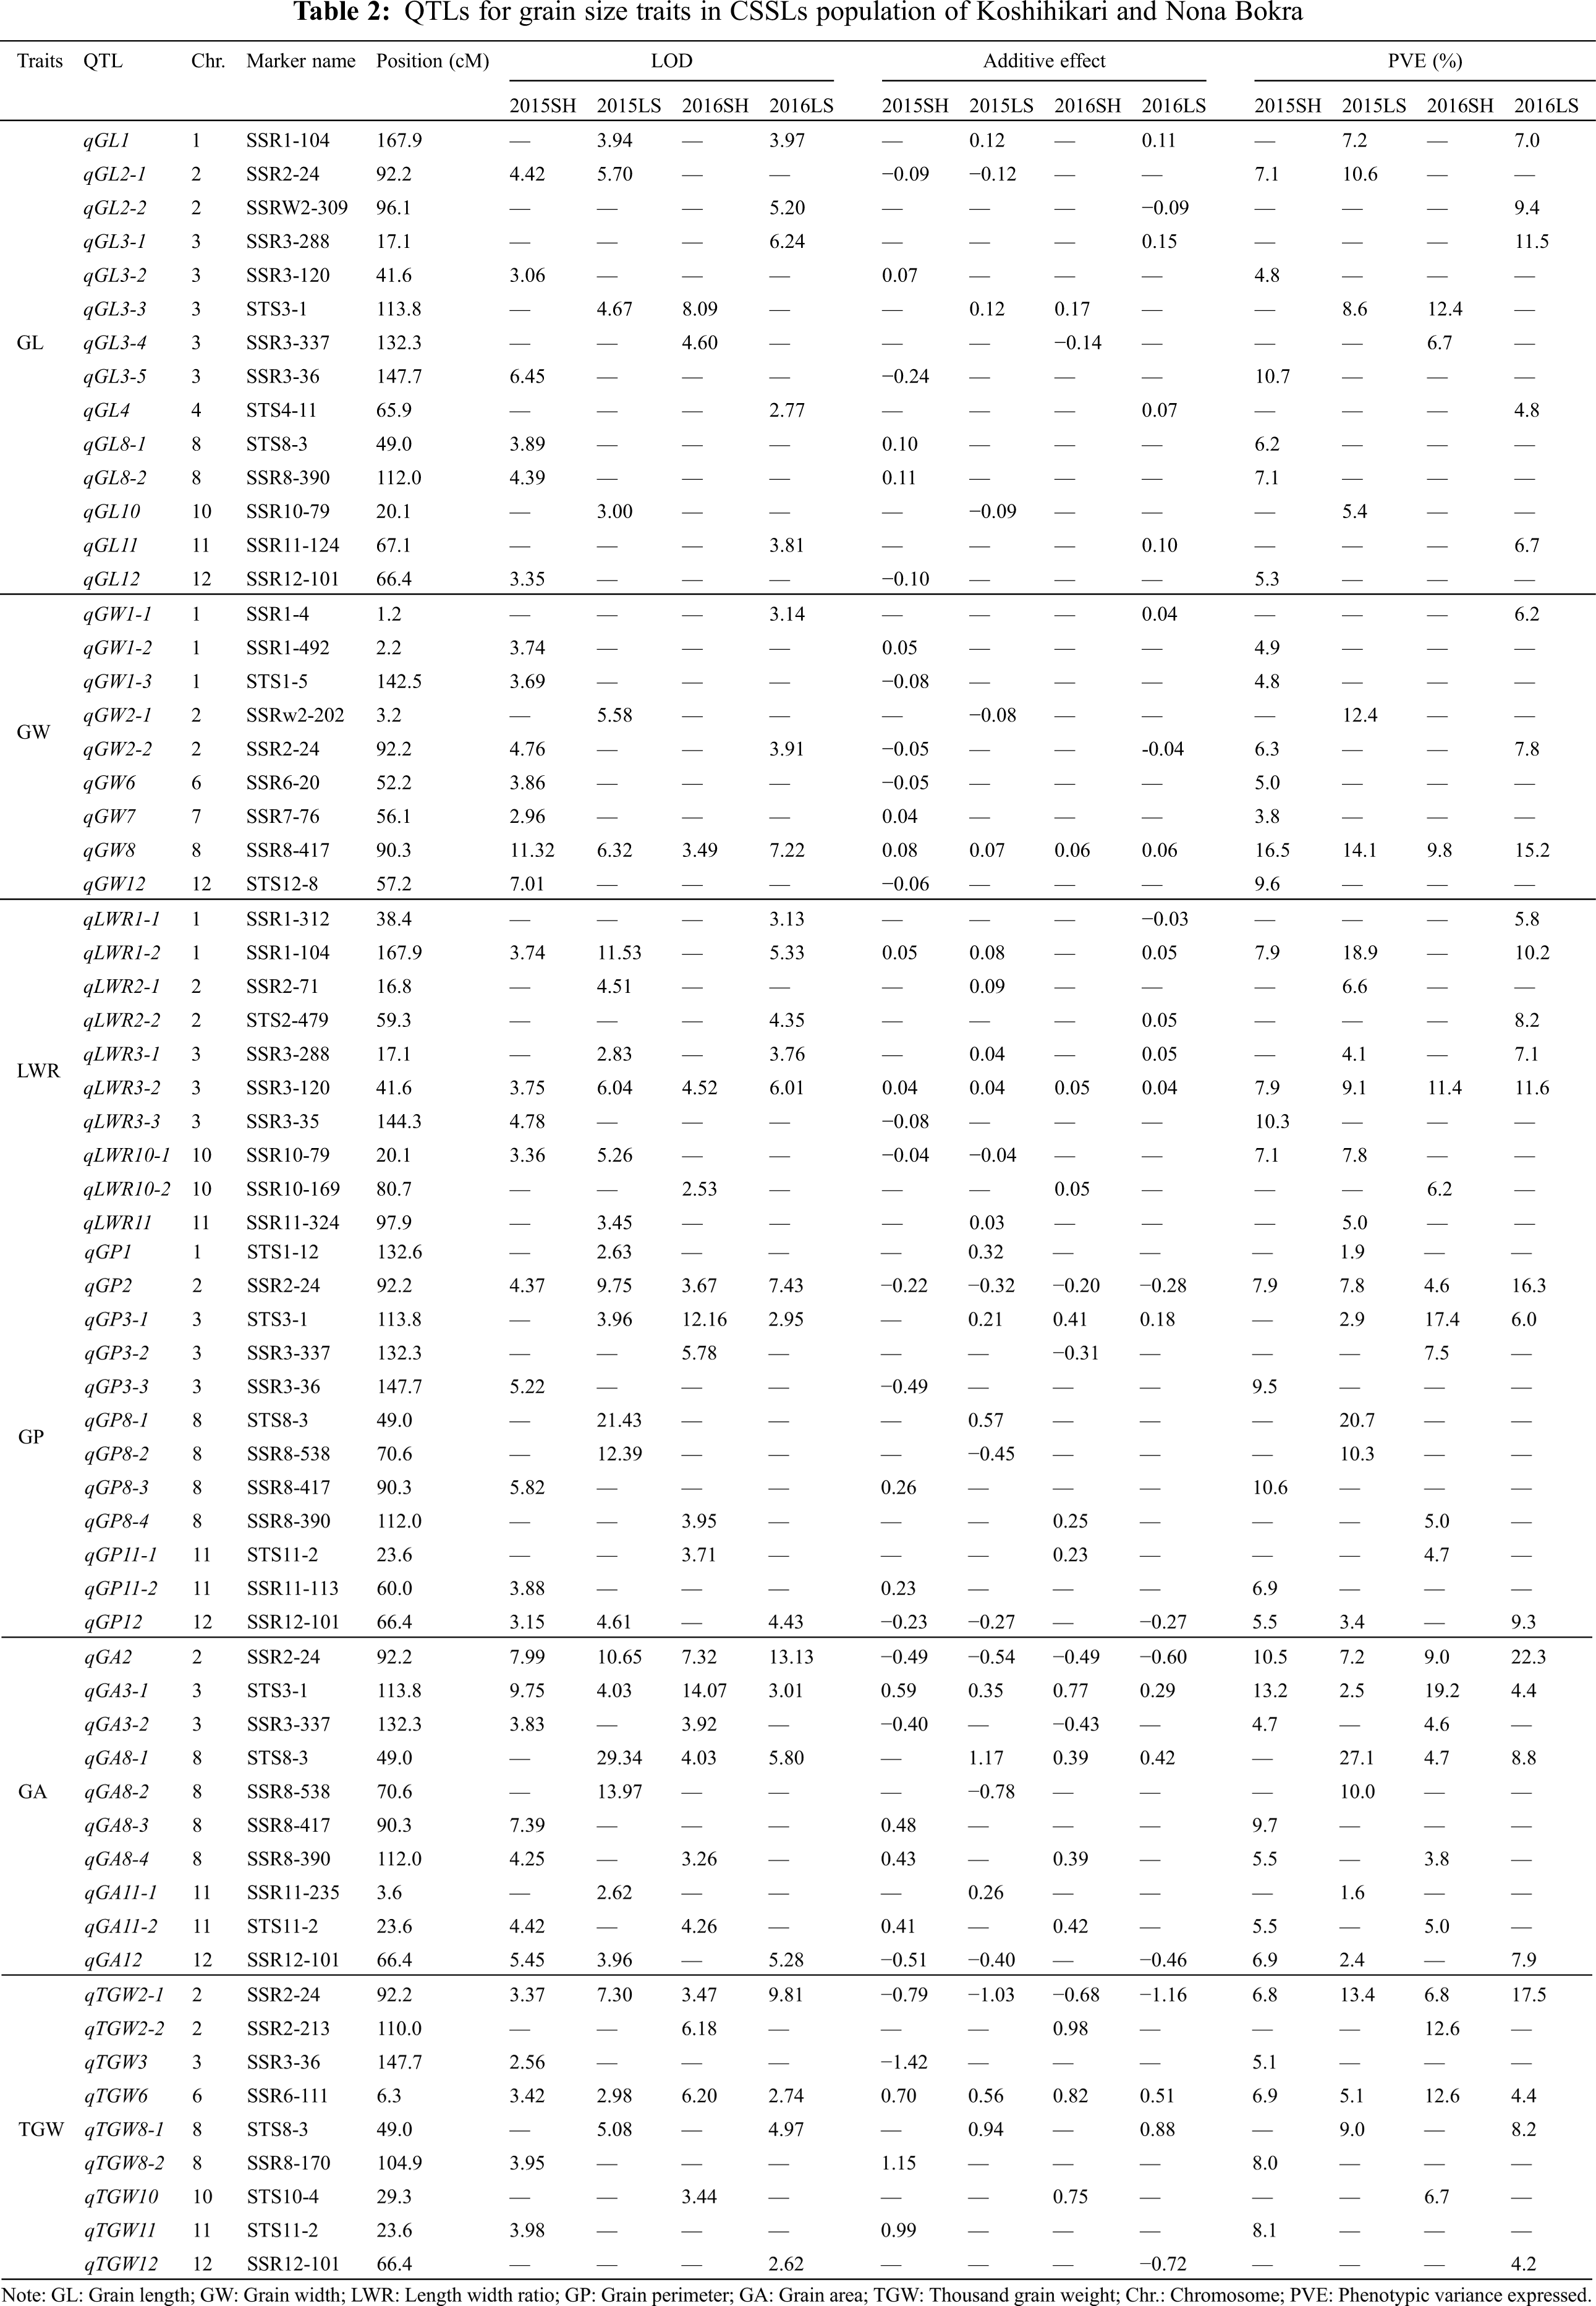
For GL, a total of fourteen QTLs, including six in Shanghai 2015, four in Shanghai 2016, two in Lingshui 2015, and five in Lingshui 2016, were detected on chromosomes 1, 2, 3, 4, 8, 10, 11, and 12 (Table 2). qGL1, qGL2-1, and qGL3-3 were detected in two environments, respectively, with additive effects ranging from −0.12 to 0.17 and explaining from 7.0% to 12.4% of phenotypic variance. Other eleven QTLs for GL were only detected in one environment, with the explained variation of 4.8% to 11.5%.
A total of nine QTLs were detected on chromosomes 1, 2, 6, 7, 8, and 12 for GW (Table 2). The QTL, qGW8, was identified on chromosome 8 under four environments, and the highest phenotypic variation of qGW8 was detected in Shanghai 2015, reaching 16.5%. Another QTL for GW, qGW2-2, was detected in Shanghai 2015 and Lingshui 2016. It explained the variation of 6.3% and 7.8%, respectively. Other 7 QTLs for GW were only detected in one environment, with the explained variation of 3.8% to 12.4%. qGW2-1 explained the highest phenotypic variation in those 7 QTLs, which reach 12.4%. The allele of qGW2-1 from Nona Bokra decreased GW by about 0.08% in Lingshui in 2015.
Ten QTLs located on chromosomes 1, 2, 3, 10, and 11 were identified for LWR. qLWR3-2 was detected under four environments, and explained 7.9%, 9.1%, 11.4%, and 11.6% of the total phenotypic variance under four environments, respectively. The allele of qLWR3-2 from Nona Bokra increased LWR by about 0.04% in Lingshui in 2015 and 2016. qLWR1-2 was detected on chromosomes 1 under three environments, and the alleles increasing LWR were contributed by Nona Bokra. qLWR3-1 was detected in Lingshui 2015, and Lingshui 2016, and qLWR10-1 was detected in Shanghai 2015 and Lingshui 2015, which explained the variation of 4.1%, 7.1% and 7.1%, 7.8%, respectively. The other six QTLs for LWR were only detected in one environment, and qLWR3-3 showed the highest phenotypic variation in Shanghai 2015.
For GP, a total of twelve QTLs located on chromosomes 1, 2, 3, 8, 11, and 12 were detected (Table 2). qGP2 was identified on chromosome 2 under four environments, and the highest phenotypic variation of qGP2 was detected in Lingshui 2016, reaching 16.3%. The alleles decreased GP were contributed by Koshihikari. qGP3-1 and qGP12 were both detected under three environments, and explained 2.9%, 17.4%, 6.0% and 5.5%, 3.4%, 9.3% of the phenotypic variance in Lingshui 2015, Shanghai 2016, Lingshui 2016 and Shanghai 2015, Lingshui 2015, Lingshui 2016, respectively. Another QTL, qGP8-1, was only detected in Lingshui 2015, which showed the highest phenotypic variation for GP, reaching to 20.7%.
Ten QTLs located on chromosomes 2, 3, 8, 11, and 12 were detected for GA. Those QTL carried the LOD score values from 2.62 to 29.34, with explained phenotypic variation in the range of 1.6% to 27.1% (Table 2). qGA2 and qGA3-1 were detected under four environments, with individually accounted for 10.5%, 7.2%, 9.0%, 22.3% and 13.2%, 2.5%, 19.2%, 4.4% of the phenotypic variation, respectively. qGA8-1 and qGA12 were both detected under three environments, and the highest phenotypic variation of those two QTLs was detected in Lingshui 2015 and Lingshui 2016, which reached 27.1% and 7.9%, respectively. In the remaining six QTLs, three QTLs were detected under two environments, and others were detected in one environment.
A total of nine QTLs were detected on chromosomes 2, 3, 6, 8, 10, 11, and 12 for TGW (Table 2). The QTLs, qTGW2-1 and qTGW6, were detected under four environments, with individually accounted for 6.8%, 13.4%, 6.8%, 17.5% and 6.9%, 5.1%, 12.6%, 4.4% of the phenotypic variation, respectively. The highest phenotypic variation of those two QTLs was detected in Lingshui 2016 and Shanghai 2016, which reaching to 17.5% and 12.6%, respectively. The allele of qTGW2-1 from Koshihikari decreased TGW by about 1.03% in Lingshui 2015 and 1.16% in Lingshui 2016, and the allele of qTGW6 from Nona Bokra increased TGW about 0.56% in Lingshui 2015 and 0.51% in Lingshui 2016. Other seven QTLs for TGW, one was detected under two environments, and the other six were detected in one environment. The LOD score values of those QTLs ranged from 2.56 to 6.18, with individually accounted for 4.2% to 12.6% of the phenotypic variation.
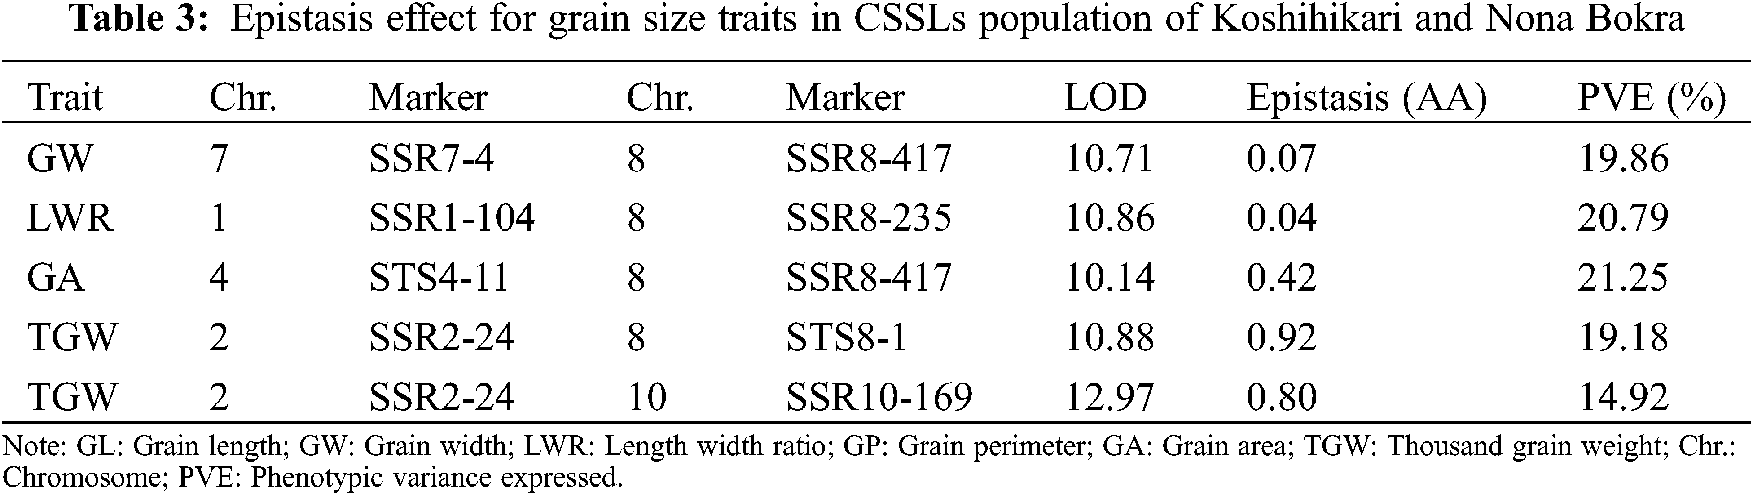
3.4 Digenic Epistasis QTLs for Grain Size Traits
To further understand the genetic components of grain size traits, the digenic epistatic QTL of GL, GW, LWR, GP, GA, and TGW was estimated. A total of five pairs of digenic epistatic QTLs were detected except for GL and GP (Table 3). There is no significant digenic epistatic QTL was detected for GL and GP, which indicated that the main effect of QTL is the primary genetic basis for GL and GP. One pair of digenic epistasis QTL was detected for GW, LWR, and GA, which explained 19.86%, 20.79%, and 21.25% of the phenotypic variation, respectively. Two pairs of digenic epistatic loci for TGW were estimated and accounted for 19.18% and 14.92% of the phenotypic variation, respectively.
3.5 Potential Candidate Gene for QTL Mapping
According to the results of QTL mapping, we further integrated the known grain size genes and QTL mapping in this study. One known grain size gene, qGL3/GL3.1/OsPPKL1 is located near to the marker STS3-1 on chromosome 3 (Fig. 3). qGL3/GL3.1/OsPPKL1 encodes a type 2A phosphatase and function as a negative regulator for regulating rice grain length [25–27]. We further compare the sequence of qGL3/GL3.1/OsPPKL1 between the two parents, a T/C non-synonymous change in the 11th exon was identified (Fig. S1). According to previous studies, this C/T non-synonymous change can influence the function of GL3.1, thereby affecting grain length [26].
4.1 Compared with Previously Identified QTLs or Genes
In the present study, we identified sixty-four QTLs for six grain size traits, including fourteen QTLs for GL, nine QTLs for GW, ten QTLs for LWR, twelve QTLs for GP, ten QTLs for GA, and nine QTLs for TGW (Table 2). Of these, thirty-eight QTLs caused an increase and twenty-six QTLs caused a decrease in the corresponding grain traits in the CSSLs. This suggests that grain size traits are controlled by complex genetic mechanisms. A number of QTLs affecting grain size traits have been mapped previously. For GL, eleven of the fourteen QTLs (qGL2-1, qGL2-2, qGL3-2, qGL3-3, qGL3-4, qGL3-5, qGL4, qGL8-1, qGL8-2, qGL10, and qGL12) were located in the same regions or close to previously reported [12,64–68]. The known grain size gene, qGL3/GL3.1/OsPPKL1, was located in the region of qGL3-3 [25–27]. The sequence analysis of qGL3/GL3.1/OsPPKL1 revealed that a single base-pair substitution between Koshihikari and Nona Bokra was found (Fig. S1). For GW, seven of the nine QTLs (qGW1-1, qGW1-2, qGW2-1, qGW2-2, qGW6, qGW7, and qGW8) were located in the same regions or close to previously reported [49,64,65,67–69]. But no known grain size gene was located in those QTLs regions. The QTL, qGW8, located on chromosome 8 was detected under four environments and the phenotypic variation was range from 9.8%–16.5%, suggesting a potential gene controlling grain width may exist in this region. Four of the ten QTLs for LWR (qLWR1-1, qLWR2-2, qLWR3-1, and qLWR3-3) were located in the same regions with previously reported [65,67,69]. The remaining six QTLs have not been reported before, especially for qLWR1-2 and qLWR3-2, which were detected at least under three environments, suggesting a potential gene controlling length-width ratio may exist in those two regions (Table 2). Similarly, for TGW, six of the nine QTLs (qTGW2-2, qTGW3, qTGW8-1, qTGW8-2, qTGW10, and qTGW11) were located in the same regions to previously reported [49,64,70]. Of the remaining three QTLs, qTGW2-1 and qTGW6 were detected under four environments, but previous studies have not detected these two QTLs, suggesting a potential gene controlling thousand grain weight may exist in those two regions (Table 2). A total of forty-two QTLs were detected in the above four traits, of which fourteen QTLs were not previously reported, indicating that QTL mapping using CSSLs population can reduce the interference of background noise and make some minor QTLs could be detected. In addition, we found that some known grain size genes, such as GS3, GW5, GL7, etc., were not detected in this population, one possible reason is that the two parents harbor the same allele.
GP and GA are also important agronomic traits associated with grain size, but no studies on QTL mapping of rice GP and GA have been conducted. In our study, a total of twelve and ten QTLs were detected for GP and GA, respectably (Table 2). Especially for qGP2, qGA2, and qGA3-1, these three QTLs were detected under four environments, which suggests that these QTLs were stable and worth further fine mapping and cloning in the future.
4.2 Multi-trait QTLs and Digenic Epistatic QTLs Contributing to Grain Size Traits
It had been common in rice to find QTLs for different traits located in the same regions [68]. Multi-trait QTLs is contributing to the complex correlations of grain size traits. In this study, thirteen multi-trait QTLs were found on chromosomes 1, 2, 3, 8, 10, 11, and 12 (Table 2, Fig. 3). We found that 16, 4, 3, 3, and 8 QTLs mapped on marker SSR2-4, SSR3-337, SSR3-36, SSR10-79, and SSR12-101, respectively, and their additive effect all caused a decrease in the corresponding grain traits. Similarly, 5, 3, 5, 9, 7, 6, 4, and 4 QTLs mapped on marker SSR1-104, SSR3-288, SSR3-120, STS3-1, STS8-3, SSR8-417, SSR8-390, and STS11-2, respectively, but their additive effect all caused an increase in the corresponding grain traits.
The digenic epistatic QTL for six grain size traits also have been estimated, and digenic epistatic QTLs for four traits were identified except for GL and GP (Table 3). Although only five digenic epistatic QTLs were detected, the phenotypic variation was in the range of 14.92% to 21.25%, which indicated that epistatic QTLs were also played an important role for grain size traits. Especially for the QTLs located on three markers SSR1-104, SSR2-24, and SSR8-417, they are both epistatic QTL and the multi-trait QTL, which reminds us to consider the epistatic effects and multiple effects during gene pyramiding in rice breeding.
4.3 Potential Utilization of CSSLs and QTLs in Rice Breeding
In our study, the CSSLs population showed a wide phenotypic variation and exhibited transgressive segregants in all tested environments (Table 1, Fig. 1). Therefore, it may be the best breeding material for breeders to improve grain size traits. The thirteen multi-trait QTLs identified in this study can be targeted for the improvement of rice grain yield and appearance quality. In addition, seven QTLs stably expressed in four conditions detected in this study lay the foundation for further validation, fine mapping and positional cloning.
In this study, the grain size traits including GL, GW, LWR, GP, GA, and TGW were investigated using a CSSLs population. We identified 64 QTLs for 6 grain size traits, of which 36 QTLs were novel and 7 QTLs were identified under four environments. The known grain size gene, qGL3/GL3.1/OsPPKL1 is located near the marker STS3-1 on chromosome 3, showed a non-synonymous change between two parents. Moreover, five pairs of digenic epistatic QTL were identified except GL and GP. A highly phenotypic variation of digenic epistatic QTL indicated that the epistatic effects should be considered during rice breeding.
Acknowledgement: We thank Dr. Kimberly S. Ponce (China National Rice Research Institute) and Dr. Sang He (Agricultural Genomics Institute in Shenzhen, Chinese Academy of Agricultural Sciences, China) for helping data analysis.
Author’s Contributions: JPG, SKJ and YJL proposed the concept; SLW, RAW, TT, SWJ, TS, LNX, XLC and SKJ collected the phenotypic data; YJL, SKJ, SLW and RAW analyzed the data; YJL drafted the manuscript; YJL and JPG revised and finalized the manuscript. All authors have read and agreed to the published version of the manuscript.
Funding Statement: This work was supported by grants from Guangdong Province Key Research and Development Program (2018B020202012), National Key Research and Development Program of China (2016YFD0100902), National Natural Science Foundation of China (31771754 and 31971862), Natural Science Foundation of Shanghai (19ZR1466400), China Postdoctoral Science Foundation (Grant No. 2021M692723), and the Priority Academic Program Development of Jiangsu Higher Education Institutions.
Conflicts of Interest: The authors declare that they have no conflicts of interest to report regarding the present study.
1. Tilman, D., Balzer, C., Hill, J., Befort, B. L. (2011). Global food demand and the sustainable intensification of agriculture. Proceedings of the National Academy of Sciences of the United States of America, 108, 20260–20264. DOI 10.1073/pnas.1116437108. [Google Scholar] [CrossRef]
2. Xing, Y. Z., Zhang, Q. F. (2010). Genetic and molecular basis of rice yield. Annual Review of Plant Biology, 61, 1–22. DOI 10.1146/annurev-arplant-042809-112209. [Google Scholar] [CrossRef]
3. Ponce, K. S., Zhang, Y., Guo, L. B., Leng, Y. J., Ye, G. Y. (2020). Genome-wide association study of grain size traits in indica rice multiparent advanced generation intercross (MAGIC) population. Frontiers in Plant Science, 11, 395. DOI 10.3389/fpls.2020.00395. [Google Scholar] [CrossRef]
4. Huang, R. Y., Jiang, L. R., Zheng, J. S., Wang, T. S., Wang, H. C. et al. (2013). Genetic bases of rice grain shape: So many genes, so little known. Trends in Plant Science, 18, 218–226. DOI 10.1016/j.tplants.2012.11.001. [Google Scholar] [CrossRef]
5. Zuo, J. R., Li, J. Y. (2014). Molecular genetic dissection of quantitative trait loci regulating rice grain size. Annual Review of Genetics, 48, 99–118. DOI 10.1146/annurev-genet-120213-092138. [Google Scholar] [CrossRef]
6. Tan, Y. F., Xing, Y. Z., Li, J. X., Yu, S. B., Xu, C. G. et al. (2000). Genetic bases of appearance quality of rice grains in Shanyou 63, an elite rice hybrid. Theoretical and Applied Genetics, 101, 823–829. DOI 10.1007/s001220051549. [Google Scholar] [CrossRef]
7. Li, J. M., Thomsom, M., McCouch, S. R. (2004). Fine mapping of a grain-weight quantitative trait locus in the pericentromeric region of rice chromosome 3. Genetics, 168, 2187–2195. DOI 10.1534/genetics.104.034165. [Google Scholar] [CrossRef]
8. Wan, X. Y., Wan, J. M., Jiang, L., Wang, K., Zhai, H. Q. et al. (2006). QTL analysis for rice grain length and fine mapping of an identified QTL with stable and major effects. Theoretical and Applied Genetics, 112, 1258–1270. DOI 10.1007/s00122-006-0227-0. [Google Scholar] [CrossRef]
9. Wan, X. Y., Weng, J. F., Zhai, H. Q., Wang, J. K., Lei, C. L. et al. (2008). Quantitative trait loci (QTL) analysis for rice grain width and fine mapping of an identified QTL allele gw-5 in a recombination hotspot region on chromosome 5. Genetics, 179, 2239–2252. DOI 10.1534/genetics.108.089862. [Google Scholar] [CrossRef]
10. Xie, X. B., Jin, F., Song, M. H., Suh, J. P., Hwang, H. G. et al. (2008). Fine mapping of a yield-enhancing QTL cluster associated with transgressive variation in an Oryza sativa × O. rufipogon cross. Theoretical and Applied Genetics, 116, 613–622. DOI 10.1007/s00122-007-0695-x. [Google Scholar] [CrossRef]
11. Guo, L. B., Ma, L. L., Jiang, H., Zeng, D. L., Hu, J. et al. (2009). Genetic analysis and fine mapping of two genes for grain shape and weight in rice. Journal of Integrative Plant Biology, 51, 45–51. DOI 10.1111/j.1744-7909.2008.00793 x. [Google Scholar]
12. Kato, T., Segami, S., Toriyama, M., Kono, I., Ando, T. (2011). Detection of QTLs for grain length from large grain rice (Oryza sativa L.). Breeding Science, 61, 269–274. DOI 10.1270/jsbbs.61.269. [Google Scholar] [CrossRef]
13. Oh, J., Balkunde, S., Yang, P., Yoon, D. B., Ahn, S. N. et al. (2011). Fine mapping of grain weight QTL, tgw11 using near isogenic lines from a cross between Oryza sativa and O. grandiglumis. Genes & Genomics, 33, 259–265. DOI 10.1007/s13258-011-0038-9. [Google Scholar] [CrossRef]
14. Qiu, X. J., Rong, G., Tan, Y. B., Yu, S. (2012). Mapping and characterization of the major quantitative trait locus qSS7 associated with increased length and decreased width of rice seeds. Theoretical and Applied Genetics, 125, 1717–1726. DOI 10.1007/s00122-012-1948-x. [Google Scholar] [CrossRef]
15. Shao, G. N., Wei, X. J., Chen, M. L., Tang, S. Q., Luo, J. et al. (2012). Allelic variation for a candidate gene for GS7, responsible for grain shape in rice. Theoretical and Applied Genetics, 125, 1303–1312. DOI 10.1007/s00122-012-1914-7. [Google Scholar] [CrossRef]
16. Singh, R., Singh, A. K., Sharma, T. R., Singh, A., Singh, N. K. (2012). Fine mapping of grain length QTLs on chromosomes 1 and 7 in basmati rice (Oryza sativa L.). Journal of Plant Biochemistry and Biotechnology, 21, 157–166. DOI 10.1007/s13562-011-0080-3. [Google Scholar] [CrossRef]
17. Zhang, W. H., Sun, P. Y., He, Q., Shu, F., Wang, J. et al. (2013). Fine mapping of GS2, a dominant gene for big grain rice. The Crop Journal, 1, 160–165. DOI 10.1016/j.cj.2013.10.003. [Google Scholar] [CrossRef]
18. Fan, C. C., Xing, Y. Z., Mao, H. L., Lu, T. T., Han, B. et al. (2006). GS3, a major QTL for grain length and weight and minor QTL for grain width and thickness in rice, encodes a putative transmembrane protein. Theoretical and Applied Genetics, 112, 1164–1171. DOI 10.1007/s00122-006-0218-1. [Google Scholar] [CrossRef]
19. Song, X. J., Huang, W., Shi, M., Zhu, M. Z., Lin, H. X. (2007). A QTL for rice grain width and weight encodes a previously unknown RING-type E3 ubiquitin ligase. Nature Genetics, 39, 623–630. DOI 10.1038/ng2014. [Google Scholar] [CrossRef]
20. Shomura, A., Izawa, T., Ebana, K., Ebitani, T., Kanegae, H. et al. (2008). Deletion in a gene associated with grain size increased yields during rice domestication. Nature Genetics, 40, 1023–1028. DOI 10.1038/ng.169. [Google Scholar] [CrossRef]
21. Weng, J. F., Gu, S. H., Wan, X. Y., Gao, H., Guo, T. et al. (2008). Isolation and initial characterization of GW5, a major QTL associated with rice grain width and weight. Cell Research, 18, 1199–1209. DOI 10.1038/cr.2008.307. [Google Scholar] [CrossRef]
22. Duan, P. G., Xu, J. S., Zeng, D. L., Zhang, B. L., Geng, M. F. et al. (2017). Natural variation in the promoter of GSE5 contributes to grain size diversity in rice. Molecular Plant, 10, 685–694. DOI 10.1016/j.molp.2017.03.009. [Google Scholar] [CrossRef]
23. Liu, J. F., Chen, J., Zheng, X. M., Wu, F. Q., Lin, Q. B. et al. (2017). GW5 acts in the brassinosteroid signalling pathway to regulate grain width and weight in rice. Nature Plants, 3, 17043. DOI 10.1038/nplants.2017.43. [Google Scholar] [CrossRef]
24. Li, Y. B., Fan, C. C., Xing, Y. Z., Jiang, Y. H., Luo, L. J. et al. (2011). Natural variation in GS5 plays an important role in regulating grain size and yield in rice. Nature Genetics, 43, 1266–1269. DOI 10.1038/ng.977. [Google Scholar] [CrossRef]
25. Hu, Z. J., He, H. H., Zhang, S. Y., Sun, F., Xin, X. Y. et al. (2012). A kelch motif-containing serine/threonine protein phosphatase determines the large grain QTL trait in rice. Journal of Integrative Plant Biology, 54, 979–990. DOI 10.1111/jipb.12008. [Google Scholar] [CrossRef]
26. Qi, P., Lin, Y. S., Song, X. J., Shen, J. B., Huang, W. et al. (2012). The novel quantitative trait locus GL3.1 controls rice grain size and yield by regulating Cyclin-T1;3. Cell Research, 22, 1666–1680. DOI 10.1038/cr.2012.151. [Google Scholar] [CrossRef]
27. Zhang, X. J., Wang, J. F., Huang, J., Lan, H. X., Wang, C. L. et al. (2012). Rare allele of OsPPKL1 associated with grain length causes extra-large grain and a significant yield increase in rice. Proceedings of the National Academy of Sciences of the United States of America, 109, 21534–21539. DOI 10.1073/pnas.1219776110. [Google Scholar] [CrossRef]
28. Wang, S. K., Wu, K., Yuan, Q. B., Liu, X. Y., Liu, Z. B. et al. (2012). Control of grain size, shape and quality by OsSPL16 in rice. Nature Genetics, 44, 950–954. DOI 10.1038/ng.2327. [Google Scholar] [CrossRef]
29. Ishimaru, K., Hirotsu, N., Madoka, Y., Murakami, N., Hara, N. et al. (2013). Loss of function of the IAA-glucose hydrolase gene TGW6 enhances rice grain weight and increases yield. Nature Genetics, 45, 707–711. DOI 10.1038/ng.2612. [Google Scholar] [CrossRef]
30. Song, X. J., Kuroha, T., Ayano, M., Furuta, T., Nagai, K. et al. (2015). Rare allele of a previously unidentified histone H4 acetyltransferase enhances grain weight, yield, and plant biomass in rice. Proceedings of the National Academy of Sciences of the United States of America, 112, 76–81. DOI 10.1073/pnas.1421127112. [Google Scholar] [CrossRef]
31. Wang, S. K., Li, S., Liu, Q., Wu, K., Zhang, J. Q. et al. (2015a). The OsSPL16-GW7 regulatory module determines grain shape and simultaneously improves rice yield and grain quality. Nature Genetics, 47, 949–954. DOI 10.1038/ng.3352. [Google Scholar] [CrossRef]
32. Wang, Y. X., Xiong, G. S., Hu, J., Jiang, L., Yu, H. et al. (2015b). Copy number variation at the GL7 locus contributes to grain size diversity in rice. Nature Genetics, 47, 944–948. DOI 10.1038/ng.3346. [Google Scholar] [CrossRef]
33. Zhou, Y., Miao, J., Gu, H. Y., Peng, X. R., Leburu, M. et al. (2015). Natural variations in SLG7 regulate grain shape in rice. Genetics, 201, 1591–1599. DOI 10.1534/genetics.115.181115. [Google Scholar] [CrossRef]
34. Duan, P. G., Shen, N., Wang, J. M., Zhang, B. L., Xu, R. et al. (2016). Regulation of OsGRF4 by OsmiR396 controls grain size and yield in rice. Nature Plants, 2, 15226. DOI 10.1038/nplants.2015.226. [Google Scholar] [CrossRef]
35. Hu, J., Wang, Y. X., Fang, Y. X., Zeng, L. J., Xu, J. et al. (2015). A rare allele of GS2 enhances grain size and grain yield in rice. Molecular Plant, 8, 1455–1465. DOI 10.1016/j.molp.2015.07.002. [Google Scholar] [CrossRef]
36. Che, R. H., Tong, H. N., Shi, B. H., Liu, Y. Q., Fang, S. R. et al. (2016). Control of grain size and rice yield by GL2-mediated brassinosteroid responses. Nature Plants, 2, 16002. DOI 10.1038/nplants.2016.2. [Google Scholar] [CrossRef]
37. Li, S. C., Gao, F. Y., Xie, K. L., Zeng, X. H., Cao, Y. et al. (2016). The OsmiR396c-OsGRF4-OsGIF1 regulatory module determines grain size and yield in rice. Plant Biotechnology Journal, 14, 2134–46. DOI 10.1111/pbi.12569. [Google Scholar] [CrossRef]
38. Sun, P. Y., Zhang, W. H., Wang, Y. H., He, Q., Shu, F. et al. (2016). OsGRF4 controls grain shape, panicle length and seed shattering in rice. Journal of Integrative Plant Biology, 58, 836–47. DOI 10.1111/jipb.12473. [Google Scholar] [CrossRef]
39. Si, L. Z., Chen, J. Y., Huang, X. H., Gong, H., Luo, J. H. et al. (2016). OsSPL13 controls grain size in cultivated rice. Nature Genetics, 48, 447–457. DOI 10.1038/ng.3518. [Google Scholar] [CrossRef]
40. Zhao, D. S., Li, Q. F., Zhang, C. Q., Zhang, C., Yang, Q. Q. et al. (2018). GS9 acts as a transcriptional activator to regulate rice grain shape and appearance quality. Nature Communications, 9, 1240. DOI 10.1038/s41467-018-03616-y. [Google Scholar] [CrossRef]
41. Liu, Q., Han, R. X., Wu, K., Zhang, J. Q., Ye, Y. F. et al. (2018). G-Protein βγ subunits determine grain size through interaction with MADS-domain transcription factors in rice. Nature Communications, 9, 852. DOI 10.1038/s41467-018-03047-9. [Google Scholar] [CrossRef]
42. Yu, J. P., Miao, J. L., Zhang, Z. Y., Xiong, H. Y., Zhu, X. Y. et al. (2018). Alternative splicing of OsLG3b controls grain length and yield in japonica rice. Plant Biotechnology Journal, 16, 1667–1678. DOI 10.1111/pbi.12903. [Google Scholar] [CrossRef]
43. Hu, Z. J., Lu, S. J., Wang, M. J., He, H. H., Sun, L. et al. (2018). A novel QTL qTGW3 encodes the GSK3/SHAGGY-like kinase OsGSK5/OsSK41 that interacts with OsARF4 to negatively regulate grain size and weight in rice. Molecular Plant, 11, 736–749. DOI 10.1016/j.molp.2018.03.005. [Google Scholar] [CrossRef]
44. Xia, D., Zhou, H., Liu, R. J., Dan, W. H., Li, P. B. et al. (2018). GL3.3, a novel QTL encoding a GSK3/SHAGGY-like kinase, epistatically interacts with GS3 to produce extra-long grains in rice. Molecular Plant, 11, 754–756. DOI 10.1016/j.molp.2018.03.006. [Google Scholar] [CrossRef]
45. Ying, J. Z., Ma, M., Bai, C., Huang, X. H., Liu, J. L. et al. (2018). TGW3, a major QTL that negatively modulates grain length and weight in rice. Molecular Plant, 11, 750–753. DOI 10.1016/j.molp.2018.03.007. [Google Scholar] [CrossRef]
46. Ruan, B. P., Shang, L. G., Zhang, B., Hu, J., Wang, Y. X. et al. (2020). Natural variation in the promoter of TGW2 determines grain width and weight in rice. New Phytologist, 227, 629–640. DOI 10.1111/nph.16540. [Google Scholar] [CrossRef]
47. Qiao, J. Y., Jiang, H. Z., Lin, Y. Q., Shang, L. G., Wang, M. et al. (2021). A novel miR167a-OsARF6-OsAUX3 module regulates grain length and weight in rice. Molecular Plant, 14, 1683–1698. DOI 10.1016/j.molp.2021.06.023. [Google Scholar] [CrossRef]
48. Kubo, T., Nakamura, K., Yoshimura, A. (1999). Development of a series of Indica chromosome segment substitution lines in Japonica background of rice. Rice Genetics Newsletter, 16, 104–106. [Google Scholar]
49. Bian, J. M., Jiang, L., Liu, L. L., Wei, X. J., Xiao, Y. H. et al. (2010). Construction of a new set of rice chromosome segment substitution lines and identification of grain weight and related traits QTLs. Breeding Science, 60, 305–313. DOI 10.1270/jsbbs.60.305. [Google Scholar] [CrossRef]
50. Furuta, T., Uehara, K., Angeles-Shim, R. B., Shim, J., Ashikari, M. et al. (2014). Development and evaluation of chromosome segment substitution lines (CSSLs) carrying chromosome segments derived from Oryza rufipogon in the genetic background of Oryza sativa L. Breeding Science, 63, 468–475. DOI 10.1270/jsbbs.63.468. [Google Scholar] [CrossRef]
51. Okada, S., Onogi, A., Iijima, K., Hori, K., Iwata, H. et al. (2018). Identification of QTLs for rice grain size using a novel set of chromosomal segment substitution lines derived from yamadanishiki in the genetic background of koshihikari. Breeding Science, 68, 210–218. DOI 10.1270/jsbbs.17112. [Google Scholar] [CrossRef]
52. Wang, H., Zhang, J. Y., Naz, F., Li, J., Sun, S. F. et al. (2020). Identification of rice QTLs for important agronomic traits with long-kernel CSSL-Z741 and three SSSLs. Rice Science, 27, 414–422. DOI 10.1016/j.rsci.2020.04.008. [Google Scholar] [CrossRef]
53. Liang, P. Y., Wang, H., Zhang, Q. L., Zhou, K., Li, M. M. et al. (2021). Identification and pyramiding of QTLs for rice grain size based on short-wide grain CSSL-Z563 and fine-mapping of qGL3–2. Rice, 14, 35. DOI 10.1186/s12284-021-00477-w. [Google Scholar] [CrossRef]
54. Hao, W., Zhu, M. Z., Gao, J. P., Sun, S. Y., Lin, H. X. (2009). Identification of quantitative trait loci for rice quality in a population of chromosome segment substitution lines. Journal of Integrative Plant Biology, 51, 500–512. DOI 10.1111/j.1744-7909.2009.00822 x. [Google Scholar]
55. Lin, H. X., Zhu, M. Z., Yano, M., Gao, J. P., Liang, Z. W. et al. (2004). QTLs for Na+ and K+ uptake of shoot and root controlling rice salt tolerance. Theoretical and Applied Genetics, 108, 253–260. DOI 10.1007/s00122-003-1421-y. [Google Scholar] [CrossRef]
56. Ren, Z. H., Gao, J. P., Li, L. G., Cai, X. L., Huang, W. et al. (2005). A rice quantitative trait locus for salt tolerance encodes a sodium transporter. Nature Genetics, 37, 1141–1146. DOI 10.1038/ng1643. [Google Scholar] [CrossRef]
57. Harushima, Y., Yano, M., Shomura, A., Sato, M., Shimano, T. et al. (1998). A high-density rice genetic linkage map with 2275 markers using a single F2 population. Genetics, 148, 479–494. DOI 10.1023/A:1017088321094. [Google Scholar] [CrossRef]
58. McCouch, S. R., Teytelman, L., Xu, Y. B., Lobos, K. B., Clare, K. et al. (2002). Development and mapping of 2240 new SSR markers for rice (Oryza sativa L.). DNA Research, 9, 199–207. DOI 10.1093/dnares/9.6.199. [Google Scholar] [CrossRef]
59. Li, H. H., Ye, G. Y., Wang, J. K. (2007). A modifed algorithm for the improvement of composite interval mapping. Genetics, 175, 361–374. DOI 10.1534/genetics.106.066811. [Google Scholar] [CrossRef]
60. Li, M., Li, H. H., Zhang, L. Y., Wang, J. K. (2015). QTL IciMapping: Integrated software for genetic linkage map construction and quantitative trait locus mapping in biparental populations. The Crop Journal, 3, 269–283. DOI 10.1016/j.cj.2015.01.001. [Google Scholar] [CrossRef]
61. McCouch, S. R., Cho, Y. G., Yano, M., Paul, E., Blinstrub, M. et al. (1997). Report on QTL nomenclature. Rice Genetics Newsletter, 14, 11–13. [Google Scholar]
62. Voorrips, R. (2002). MapChart: Sofware for the graphical presentation of linkage maps and QTLs. Journal of Heredity, 93, 77–78. DOI 10.1093/jhered/93.1.77. [Google Scholar] [CrossRef]
63. Murray, M. G., Thompson, W. F. (1980). Rapid isolation of high molecular weight plant DNA. Nucleic Acids Research, 8, 4321–4325. DOI 10.1093/nar/8.19.4321. [Google Scholar] [CrossRef]
64. Lin, L. H., Wu, W. R. (2003). Mapping of QTLs underlying grain shape and grain weight in rice. Molecular Plant Breeding, 1, 337–342. [Google Scholar]
65. Bai, X. F., Luo, L. J., Yan, W. H., Kovi, M. R., Zhan, W. et al. (2010). Genetic dissection of rice grain shape using a recombinant inbred line population derived from two contrasting parents and fine mapping a pleiotropic quantitative trait locus qGL7. BMC Genetics, 11, 16. DOI 10.1186/1471-2156-11-16. [Google Scholar] [CrossRef]
66. Liu, Q. M., Jiang, J. J., Niu, F. A., He, Y. J., Hong, D. L. (2013). QTL analysis for seven quality traits of RIL population in japonica rice based on three genetic statistical models. Rice Science, 20, 31–38. DOI 10.1016/S1672-6308(13)60105-5. [Google Scholar] [CrossRef]
67. Shanmugavadivel, P. S., Amitha, M. S. V., Dokku, P., Kumar, K. A. R., Rao, G. J. N. et al. (2013). Mapping quantitative trait loci (QTL) for grain size in rice using a RIL population from Basmati × indica cross showing high segregation distortion. Euphytica, 194, 401–416. DOI 10.1007/s10681-013-0964-5. [Google Scholar] [CrossRef]
68. Gao, F. Y., Zeng, L. H., Qiu, L., Lu, X. J., Ren, J. S. et al. (2016). QTL mapping of grain appearance quality traits and grain weight using a recombinant inbred population in rice (Oryza sativa L.). Journal of Integrative Agriculture, 15, 1693–1702. DOI 10.1016/S2095-3119(15)61259-X. [Google Scholar] [CrossRef]
69. Rabiei, B., Valizadeh, M., Ghareyazie, B., Moghaddam, M., Ali, A. J. (2004). Identification of QTLs for rice grain size and shape of Iranian cultivars using SSR markers. Euphytica, 137, 325–332. DOI 10.1023/B:EUPH.0000040452.76276.76. [Google Scholar] [CrossRef]
70. Tang, S. Q., Shao G. N., Wei, X. J., Chen, M. L., Sheng, Z. H. et al. (2013). QTL mapping of grain weight in rice and the validation of the QTL qTGW3.2. Gene, 527, 201–206. DOI 10.1016/j.gene.2013.05.063. [Google Scholar] [CrossRef]
Appendix
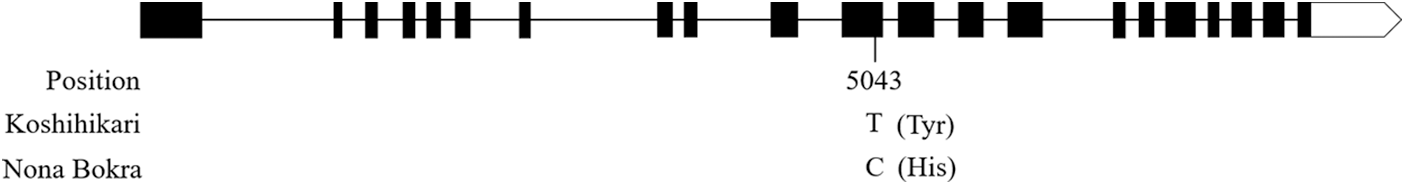
Figure S1: Sequence alignment in qGL3/GL3.1/OsPPKL1 between Koshihikari and Nona Bokra. The number and single letter indicate the base position and difference, respectively. The letters in parentheses indicate amino acids
 | This work is licensed under a Creative Commons Attribution 4.0 International License, which permits unrestricted use, distribution, and reproduction in any medium, provided the original work is properly cited. |