| Phyton-International Journal of Experimental Botany |
DOI: 10.32604/phyton.2022.019399
ARTICLE
Rapid Profiling and Characterization of the Multicomponents from the Root and Rhizome of Salvia miltiorrhiza by Ultra-High Performance Liquid Chromatography/Ion Mobility-Quadrupole Time-of-Flight Mass Spectrometry in Combination with Computational Peak Annotation Workflows
1State Key Laboratory of Component-Based Chinese Medicine & Tianjin Key Laboratory of TCM Chemistry and Analysis, Tianjin University of Traditional Chinese Medicine, Tianjin, 301617, China
2Waters Technology Co., Ltd., Beijing, 101102, China
*Corresponding Author: Wenzhi Yang. Email: wzyang0504@tjutcm.edu.cn
#These two authors contributed equally to this work
Received: 22 September 2021; Accepted: 29 November 2021
Abstract: Herbal components characterization represents a challenging task because of the co-existing of multiple classes of naturally occurring compounds with wide spans of polarity, molecular mass, and the ubiquitous isomerism. The root and rhizome of Salvia miltiorrhiza have been utilized as a reputable traditional Chinese medicine Salviae Miltiorrhizae Radix et Rhizoma (Dan-Shen) in the treatment of cardiovascular disease. Herein, a dimension-enhanced ultra-high performance liquid chromatography/ion mobility/quadrupole time-of-flight mass spectrometry approach in combination with intelligent peak annotation workflows was established aimed to rapidly characterize the multicomponents from S. miltiorrhiza. Due to the sufficient optimization, satisfactory chromatography separation was enabled on an HSS T3 column within 33 min using 0.1% formic acid in water (A) and acetonitrile (B) as the mobile phase, while the data-independent HDMSE in both the negative and positive electrospray ionization modes was utilized for the high-coverage MS2 data acquisition. Streamlined automatic peak annotation by searching an in-house library (recording 198 known compounds) followed by the subsequent confirming steps (e.g., comparison with the reference compounds, fragmentation pathways analysis, and retention behavior comparison, etc.), allowed us to identify or tentatively characterize a total of 86 components (including 50 terpenoids, 21 phenolic acids, and 15 others) from S. miltiorrhiza. Importantly, three-dimensional structure information, such as the retention time, MS1 and MS2 data, and collision cross section (CCS), was provided, which can facilitate the more reliable characterization of herbal components.
Keywords: Ultra-high perform liquid chromatography/ion mobility/quadrupole time-of-flight mass spectrometry; high-definition MSE; automatic peak annotation; Salvia miltiorrhiza; phenolic acid; tanshinone
Traditional Chinese medicine (TCM), mainly derived from herbs, has played an indelible role in thousands of years of clinical practice for the humans [1]. As TCM has shown in previous plagues, “three-drug tripartite” has effectively curbed the prevalence of COVID-19 in China and makes a strong contribution to the treatment and rehabilitation of patients [2]. With the modernization and globalization of TCM, the characterization of the material basis has laid a solid foundation for the research fields of pharmacology, metabolomics, and pharmaceutical preparations, which has become increasingly important. The inherent complexity of metabolites in herbs (symbiosis of the primary and secondary metabolites, large spans of the acid-base properties, polarity, molecular weight, and content, etc.), poses great challenges for quality control on TCM [3,4], which requires to develop powerful analytical strategies to achieve the comprehensive multicomponent characterization.
With the rapid development of cutting-edge analytical technology, more and more instruments with increasing accuracy and sensitivity are dedicated to continuously improving the depth-of-coverage and serving the comprehensive characterization of multiple components from TCM. High-performance liquid chromatography/mass spectrometry (LC-MS), combining data acquisition and post-processing techniques, enables the rapid on-line separation and characterization of TCM components [5]. Powerful chromatographic separation and enhanced mass spectrometry scan are the main feasible means to improve the depth of coverage. LC, especially the ultra-high performance liquid chromatography (UHPLC), possesses superior separation capacity and saves the consumption of organic solvents, which, coupled with MS, can exert excellent sensitivity and selectivity. The separation potential of LC can be theoretically defined by its peak capacity, which has evolved over the past 50 years to an upper limit of approximately 500–1000 for the current UHPLC systems. The increment of peak capacity has been associated with increasingly higher pressure pumps and smaller particles [6]. However, the historical linear growth always suggests that the peak capacity of LC will eventually reach saturation. In this context, multi-dimensional chromatography (MDC) has been covering the ongoing concerns in resolving complex samples (such as the extracts of herbs or TCM compound formulae), for which the peak capacity in theory is the product of the peak capacities of the two or more dimensions [7]. By MDC, the separation of co-eluting components and the enrichment of trace components can be achieved, which thus is particularly effective in the rapid discovery of potentially new natural components. Feng et al. established an off-line three-dimensional liquid chromatography (3D-LC) system coupled with the high-resolution Q-Orbitrap-MS, by integrating ion exchange chromatography, hydrophilic interaction chromatography, and reversed-phase chromatography (IEC-HILIC-RPC), and up to 308 components were separated and characterized from Uncaria sessilifructus [8]. In addition, the innovation of versatile MS scan approaches greatly facilitates the comprehensive herbal components characterization, which can be classified as data-dependent acquisition (DDA) and data-independent acquisition (DIA). As the most preferable scan strategy because of its high interpretability, DDA is mainly achieved based on the top N criteria by which several most intense precursor ions recorded by full scan are automatedly selected for the MS/MS fragmentation [9]. However, when facing the complex matrix, the coverage of DDA can be largely restricted [10]. Post-data acquisition processing, such as the development of different mass defect filtering vehicles [11,12], precursor ion list (PIL) [13], dynamic exclusion [14], or multiple reaction monitoring (MRM) [15], can be utilized to improve the coverage of DDA. DIA strategies recently receive more applications due to its highest coverage without the loss of MS information [16], such as MSE or high-definition MSE (HDMSE) [17,18], sequential window acquisition of all theoretical spectra (SWATH) [19], or all ion fragmentation (AIF) [20]). But matching between the precursor ions and the product ions is inevitable prior to interpreting the DIA-MS2 data [21], which can be performed by developing in-house data processing algorithms (such as MS-DIAL or MS-FINDER [22]) or by using the mature commercial deconvolution software (such as UNIFITM from Waters). Another landmark development in herbal medicine analysis is the innovative application of ion mobility mass spectrometry (IM-MS), which provides an additional dimension of separation on account of the precursor ions with different shapes, charge states, and sizes [23]. According to the Metabolomics Standards Initiative (MSI), confident metabolite identifications are achieved through matching of two or more orthogonal experimental data values with those of the authentic standards [24]. Hybrid ion mobility/quadrupole time-of-flight mass spectrometry (IM/QTOF-MS) coupled to LC can enable 3D separations providing four different information related to the structures (tR, drift time or collision cross section-CCS, MS1, and MS2) [25].
Salvia miltiorrhiza Bge., belonging to the Labiatae family, is a famous medicinal herb mainly scattered in Sichuan, Shanxi, and Shandong provinces of China. Its root and rhizome are utilized as the traditional Chinese medicine Salviae Miltiorrhizae Radix et Rhizoma (Dan-Shen) [26]. The major bioactive ingredients of S. miltiorrhiza are the lipophilic tanshinones and the hydrophilic phenolic acids, which have been used to activate blood circulation, promote menstruation, and remove stasis pain [27]. Up to now, a number of quality control strategies have been developed for S. miltiorrhiza achieving the qualitative and quantitative analyses of multiple bioactive components. For instance, a UHPLC/PDA (photodiode array detector) strategy was established by Luo et al. [28] for simultaneously quantitative determination of five phenolic acids from S. miltiorrhiza. By the report of Cao et al. [29], an on-line comprehensive 2D-LC coupled with hybrid linear ion-trap Orbitrap-MS approach was established to detect the phenolic acids from S. miltiorrhiza, which greatly improved the peak capacity and the resolution, with 51 compounds of phenolic acids characterized.
In this work, to rapidly separate and characterize the multicomponents from S. miltiorrhiza, we introduced an approach by integrating dimension-enhanced UHPLC/IM-QTOF-MS-based data-independent high-definition MSE (HDMSE) and computational peak annotation workflows, with the overall technical roadmap illustrated in Fig. 1. The optimization of both the conditions of UHPLC and key parameters of the VionTM IM-QTOF mass spectrometer (e.g., stationary phase, capillary voltage, and collision energy) was conducted to pursue better performance. Two ESI modes (ESI−/ESI+) of HDMSE were set to obtain the high-quality MS spectra and more fragmentation information for the structural elucidation of tanshinones and salvianolic acids. What’s more, an in-house chemical library was created to aid the automated peak annotation by UNIFITM. As a result, we could identify or tentatively characterize a total of 86 components, including 50 terpenoids, 21 phenolic acids, and 15 others, from S. miltiorrhiza, with the information of tR, CCS, MS1, and MS2 recorded.
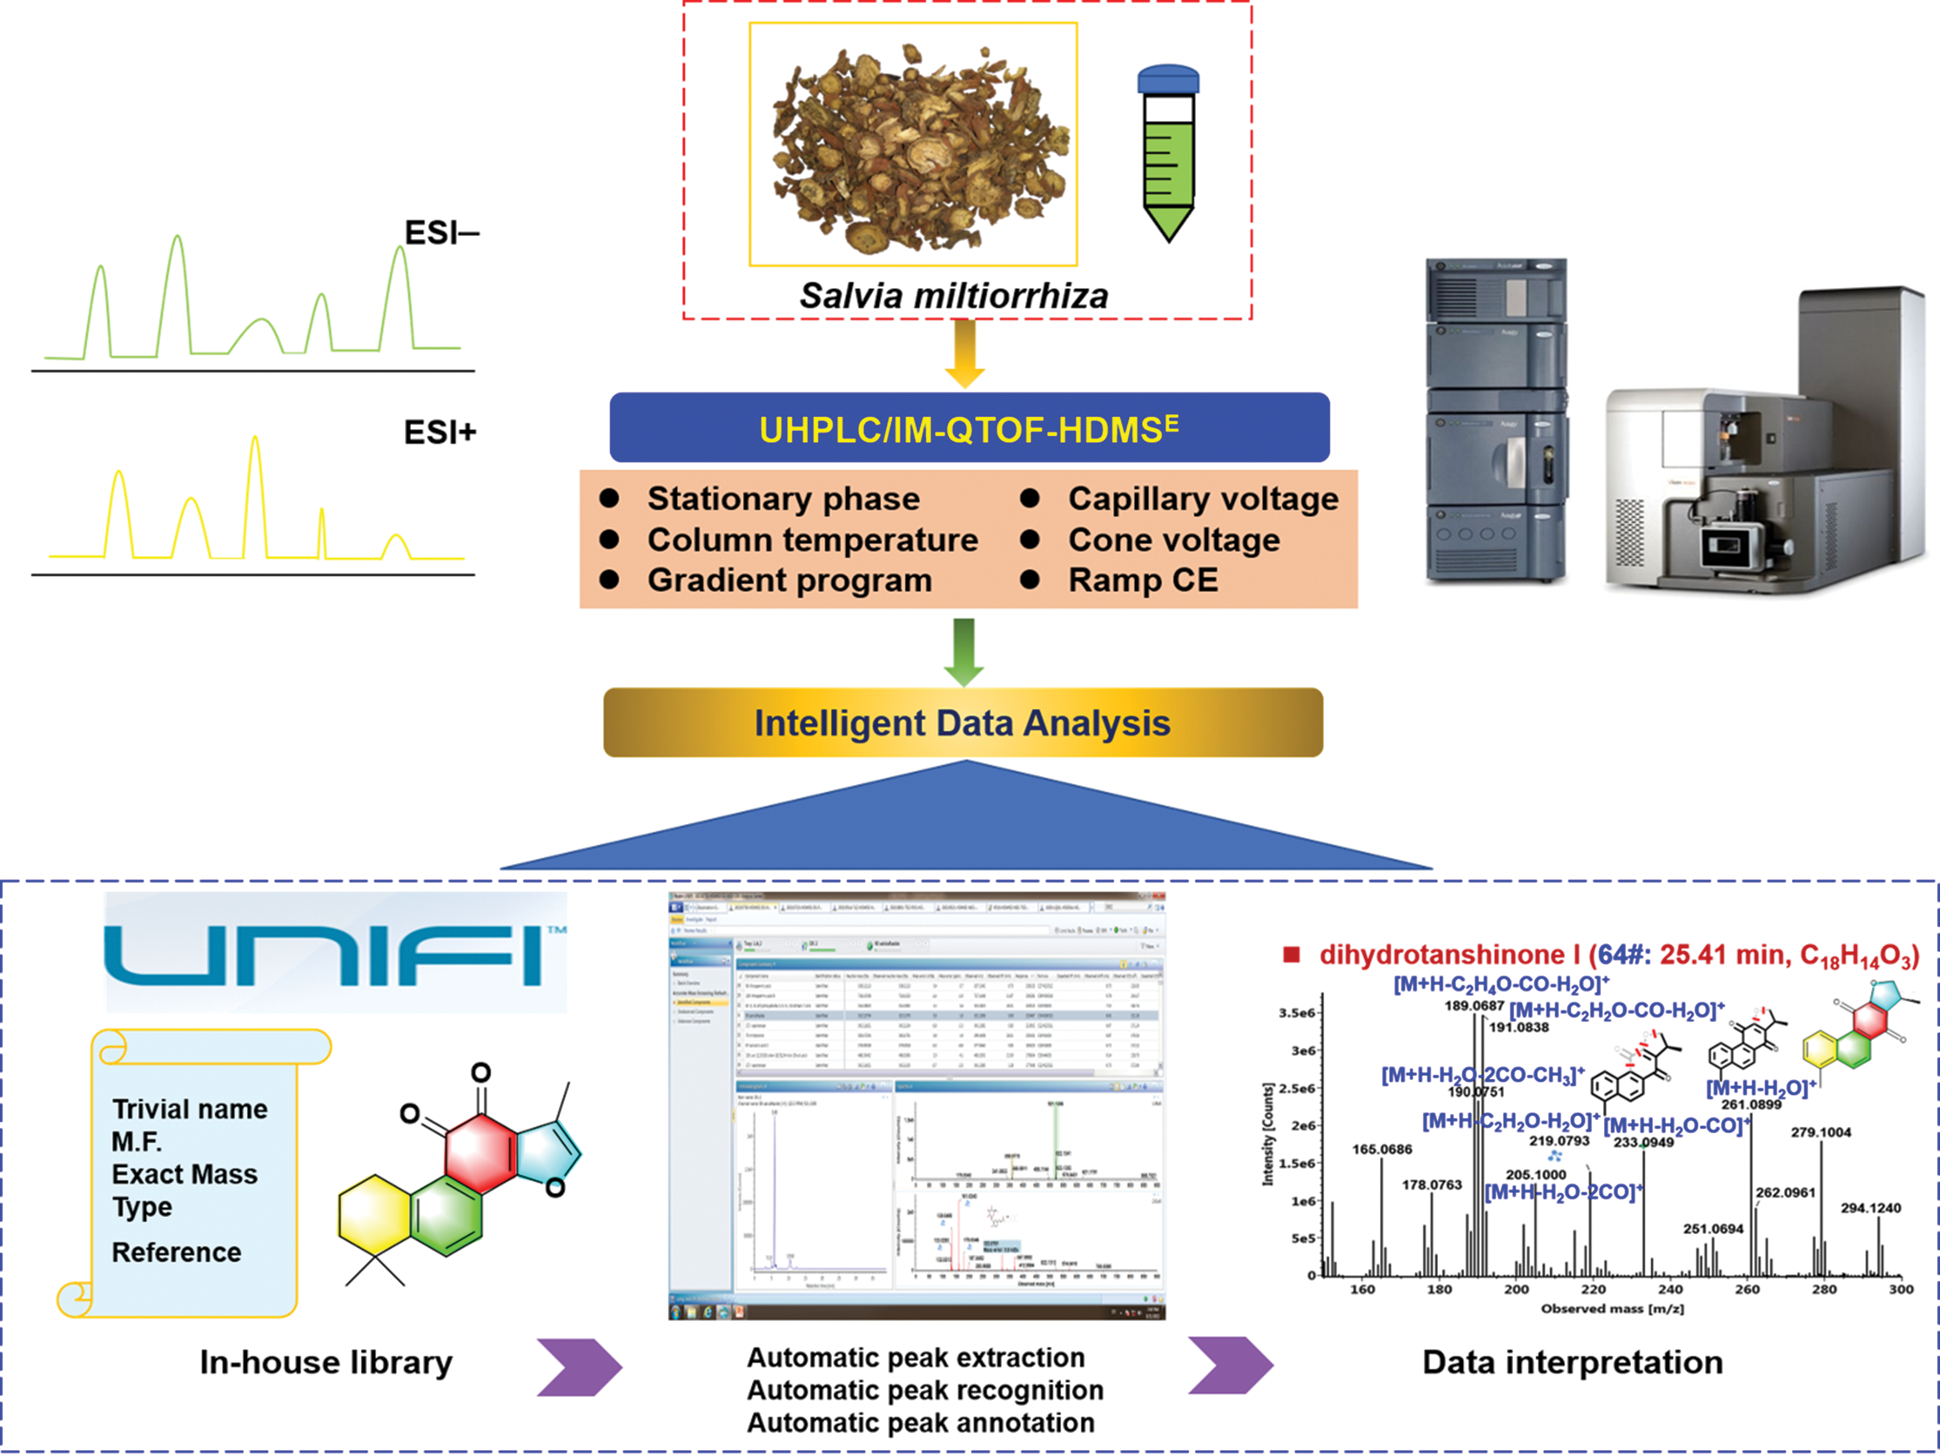
Figure 1: Illustration for the technical roadmap of the reversed-phase UHPLC/IM-QTOF-HDMSE and computational peak annotation workflows enabling the rapid profiling and characterization of the multicomponents from the root and rhizome of Salvia miltiorrhiza
Sixteen compounds (Fig. 2), involving 9′-methyl lithospermate B (1, C37H32O16), salvianolic acid B (2, C36H30O16), dimethyl lithospermate B (3, C38H34O16), lithospermic acid (4, C27H22O12), salvianolic acid C (5, C26H20O10), salvianolic acid A (6, C26H22O10), rosmarinic acid (7, C18H16O8), salvianolic acid F (8, C17H14O6), ferulic acid (9, C10H10O4), danshensu (10, C9H10O5), sodium danshensu (11, C9H9NaO5), dihydrotanshinone I (12, C18H14O3), tanshinone I (13, C18H12O3), cryptotanshinone (14, C19H20O3), tanshinone IIA (15, C19H18O3), and protocatechualdehyde (16, C7H6O3), purchased from Shanghai Standard Biotech. Co., Ltd. (Shanghai, China), were used as the reference compounds. The sample of Salvia miltiorrhiza was purchased from Beijing Tongrentang Co., Ltd. (Tianjin, China), with the voucher specimens deposited at the authors’ lab in Tianjin University of Traditional Chinese Medicine (Tianjin, China). HPLC-grade acetonitrile, methanol (Fisher, Fair Lawn, NJ, USA), formic acid (Sigma-Aldrich, MO, Switzerland), and ultra-pure water in-house prepared using a Milli-Q Integral 5 water purification system (Millipore, Bedford, MA, USA), were used.
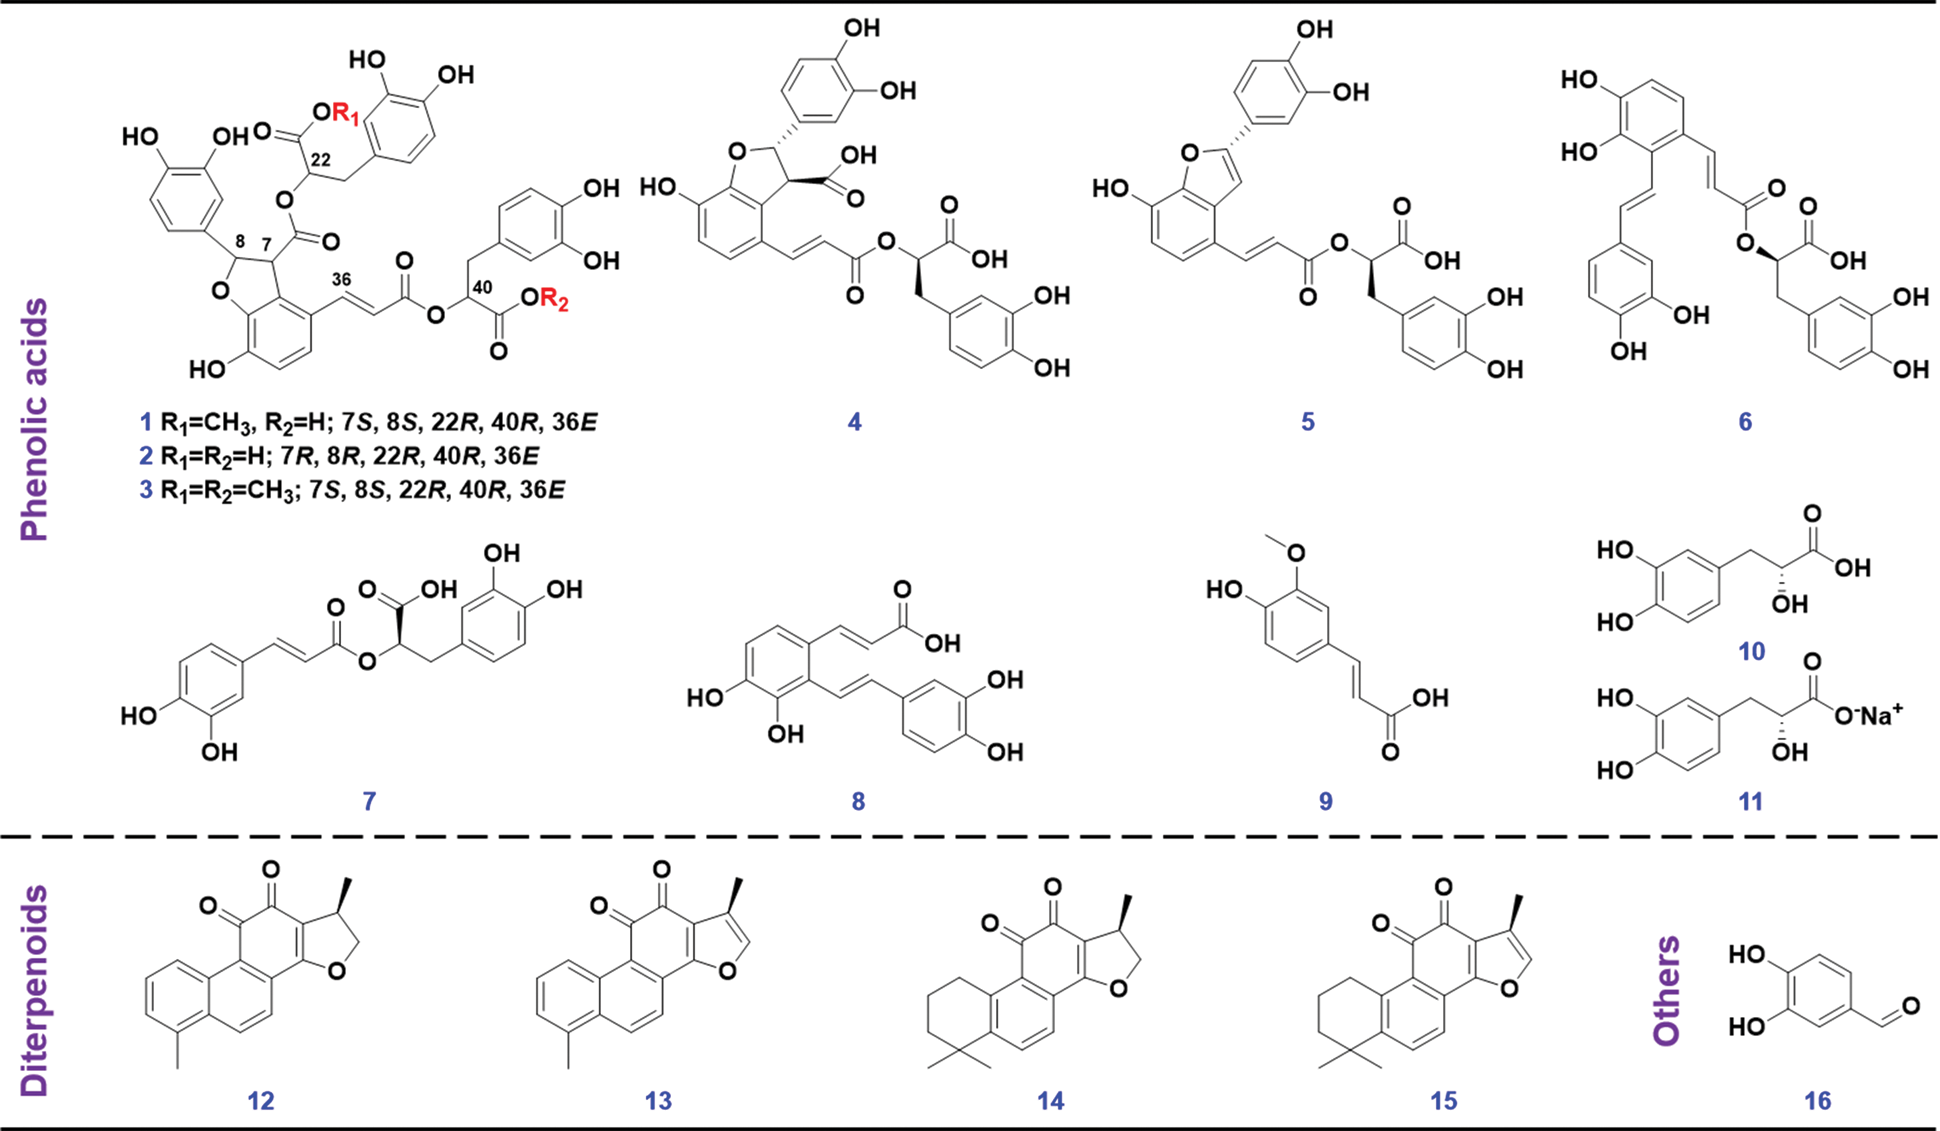
Figure 2: Chemical structures of 16 reference compounds utilize in this work
An easy-to-implement ultrasound-assisted extraction method was utilized. In detail, 0.5 g accurately weighed fine powder of the sample was soaked in a 15-mL centrifuge tube which contained 10 mL of 75% (v/v) methanol. After being vortexed for 2 min, the sample was extracted in a water bath at 40°C with ultrasound assistance for 1 h. The extract was centrifuged for 10 min at a rotate speed of 4,000 (revolutions per minute, rpm), and the supernatant was transferred into a 10-mL volumetric flask, which was further diluted to the constant volume with 75% methanol. The solution was centrifuged at 14,000 rpm for 10 min, and diluted, with the resulting supernatant used as the test solution which was stored at 4°C prior to LC−MS analysis (reaching a final concentration of drug material: 10 mg/mL).
Good chromatographic separation was achieved on an ACQUITY UPLC I-Class/VionTM IM-QTOF system (Waters Corporation, Milford, MA, USA) configured with an HSS T3 (2.1 × 100 mm, 1.8 μm) kept at 30°C. A binary mobile phase, containing 0.1% formic acid in water (A) and acetonitrile (B) ran according to the following gradient program: 0–3 min, 5%–20% (B); 3–9 min, 20%–23% (B); 9–17 min, 23%–35% (B); 17–21 min, 35%–55% (B); 21–27 min, 55%–65% (B); 27–30 min, 65%–95% (B); 30–33 min, 95% (B); 33–34 min, 95%–5% (B); and 34–39 min, 5% (B). A flow rate of 0.3 mL/min was set, and the injection volume was 3 μL.
High-accuracy HDMSE data were acquired on a VionTM IM-TOF mass spectrometer operating in both the negative and positive ESI modes (Waters Corp.). The ion source parameters were set as follows: capillary voltage, 1.0 kV; cone voltage, 20 V; source offset, 80 V; source temperature, 120°C; desolvation gas temperature, 500°C; desolvation gas flow (N2), 800 L/h; and cone gas flow (N2), 50 L/h. Default parameters were defined for the travelling wave IM separation, and CCS calibration was conducted according to the manufacture’s guidelines [30]. The QTOF analyzer scanned over m/z 100–1500 at a low collision energy of 6 eV at 0.3 s per scan (MS1). Ramp collision energy (RCE) of 30–50 eV was set in high-energy channel for HDMSE. MS data calibration was conducted by constantly infusing the leucine enkephalin solution (LE; Sigma-Aldrich; 200 ng/mL) at a flow rate of 10 μL/min.
The uncorrected HDMSE data in Continuum format, were corrected by using the UNIFITM 1.9.3.0 software (Waters Corp.). The multifaced bioinformatics platform UNIFITM was able to efficiently perform the data correction, peak picking, and peak annotation by searching the database [31]. Key parameters of UNIFI for data processing were set as follows. Find 4D Peaks: High-energy intensity threshold, 100.0 counts; low-energy intensity threshold, 50.0 counts. Target by mass: Target match tolerance: 10.0 ppm; screen on all isotopes in a candidate, generate predicted fragments from structure, and look for in-source fragments were enabled; fragment match tolerance, 10.0 ppm. Adducts: Positive adduct was +H. Lock Mass: Combine width, 3 scans; mass window, 0.5 m/z; reference mass, 556.2766; reference charge, +1. Adducts: Negative adduct was −H. Lock Mass: Combine width, 3 scans; mass window, 0.5 m/z; reference mass, 554.2620; reference charge, −1.
3.1 Optimization of the Reversed-Phase UHPLC Condition
Given the complexity in the chemical compositions of herbal medicines, good chromatographic separation is crucial to clarify the chemical substances obtained. Therefore, in the current work, the key parameters that could affect the chromatographic performance were optimized in turn, including the stationary phase, mobile phase, column temperature, and the gradient elution program.
To select the appropriate column enabling sufficient resolution of the multicomponents from S. miltiorrhiza, a total of ten stationary phases (with the information detailed in Table S1) packed with sub-2 μm particles from two major vendors (Waters Corporation: BEH C18, HSS T3, BEH Shield RP18, Atlantis Premier BEH C18AX, CSH C18, and HSS C18 SB; Agilent Technologies: Zorbax Extend C18, Zorbax SB-C18, Zorbax Eclipse Plus C18, and Zorbax SB-Aq) were screened. These UHPLC columns have different silica gel cores and bonding groups. Especially, the Atlantis Premier BEH C18AX column is a mixed-mode stationary phase integrating reversed-phase and anion exchange separations, which can improve the resolution of highly polar components, while the other nine are RP columns. Moreover, the HSS T3, BEH Shield RP18, and Zorbax SB-Aq columns can endure the pure aqueous phase to separate polar molecules. Selection of the stationary phase was based on the observed overall resolution (distribution of major peaks) and the number of MS-resolved peaks (the raw data were processed by UNIFI to extract the peaks that had been separated on different columns). As clearly shown in Fig. 3, on the whole, three columns, BEH C18 (resolved peaks: 3275), HSS T3 (2955), and BEH Shield RP18 (2904), could resolve much more peaks than the others. On the other hand, HSS T3 and Zorbax Eclipse Plus C18 could enable better peak shape. By considering both the peak shape and the selectivity in separation, the HSS T3 column was finally chosen. Furthermore, column temperature was compared from 25°C to 40°C. Obviously, high temperature could enhance the elution power for the mobile phase, which thus shortened the retention of S. miltiorrhiza components. We chose to set the column temperature at 30°C (Fig. S1).
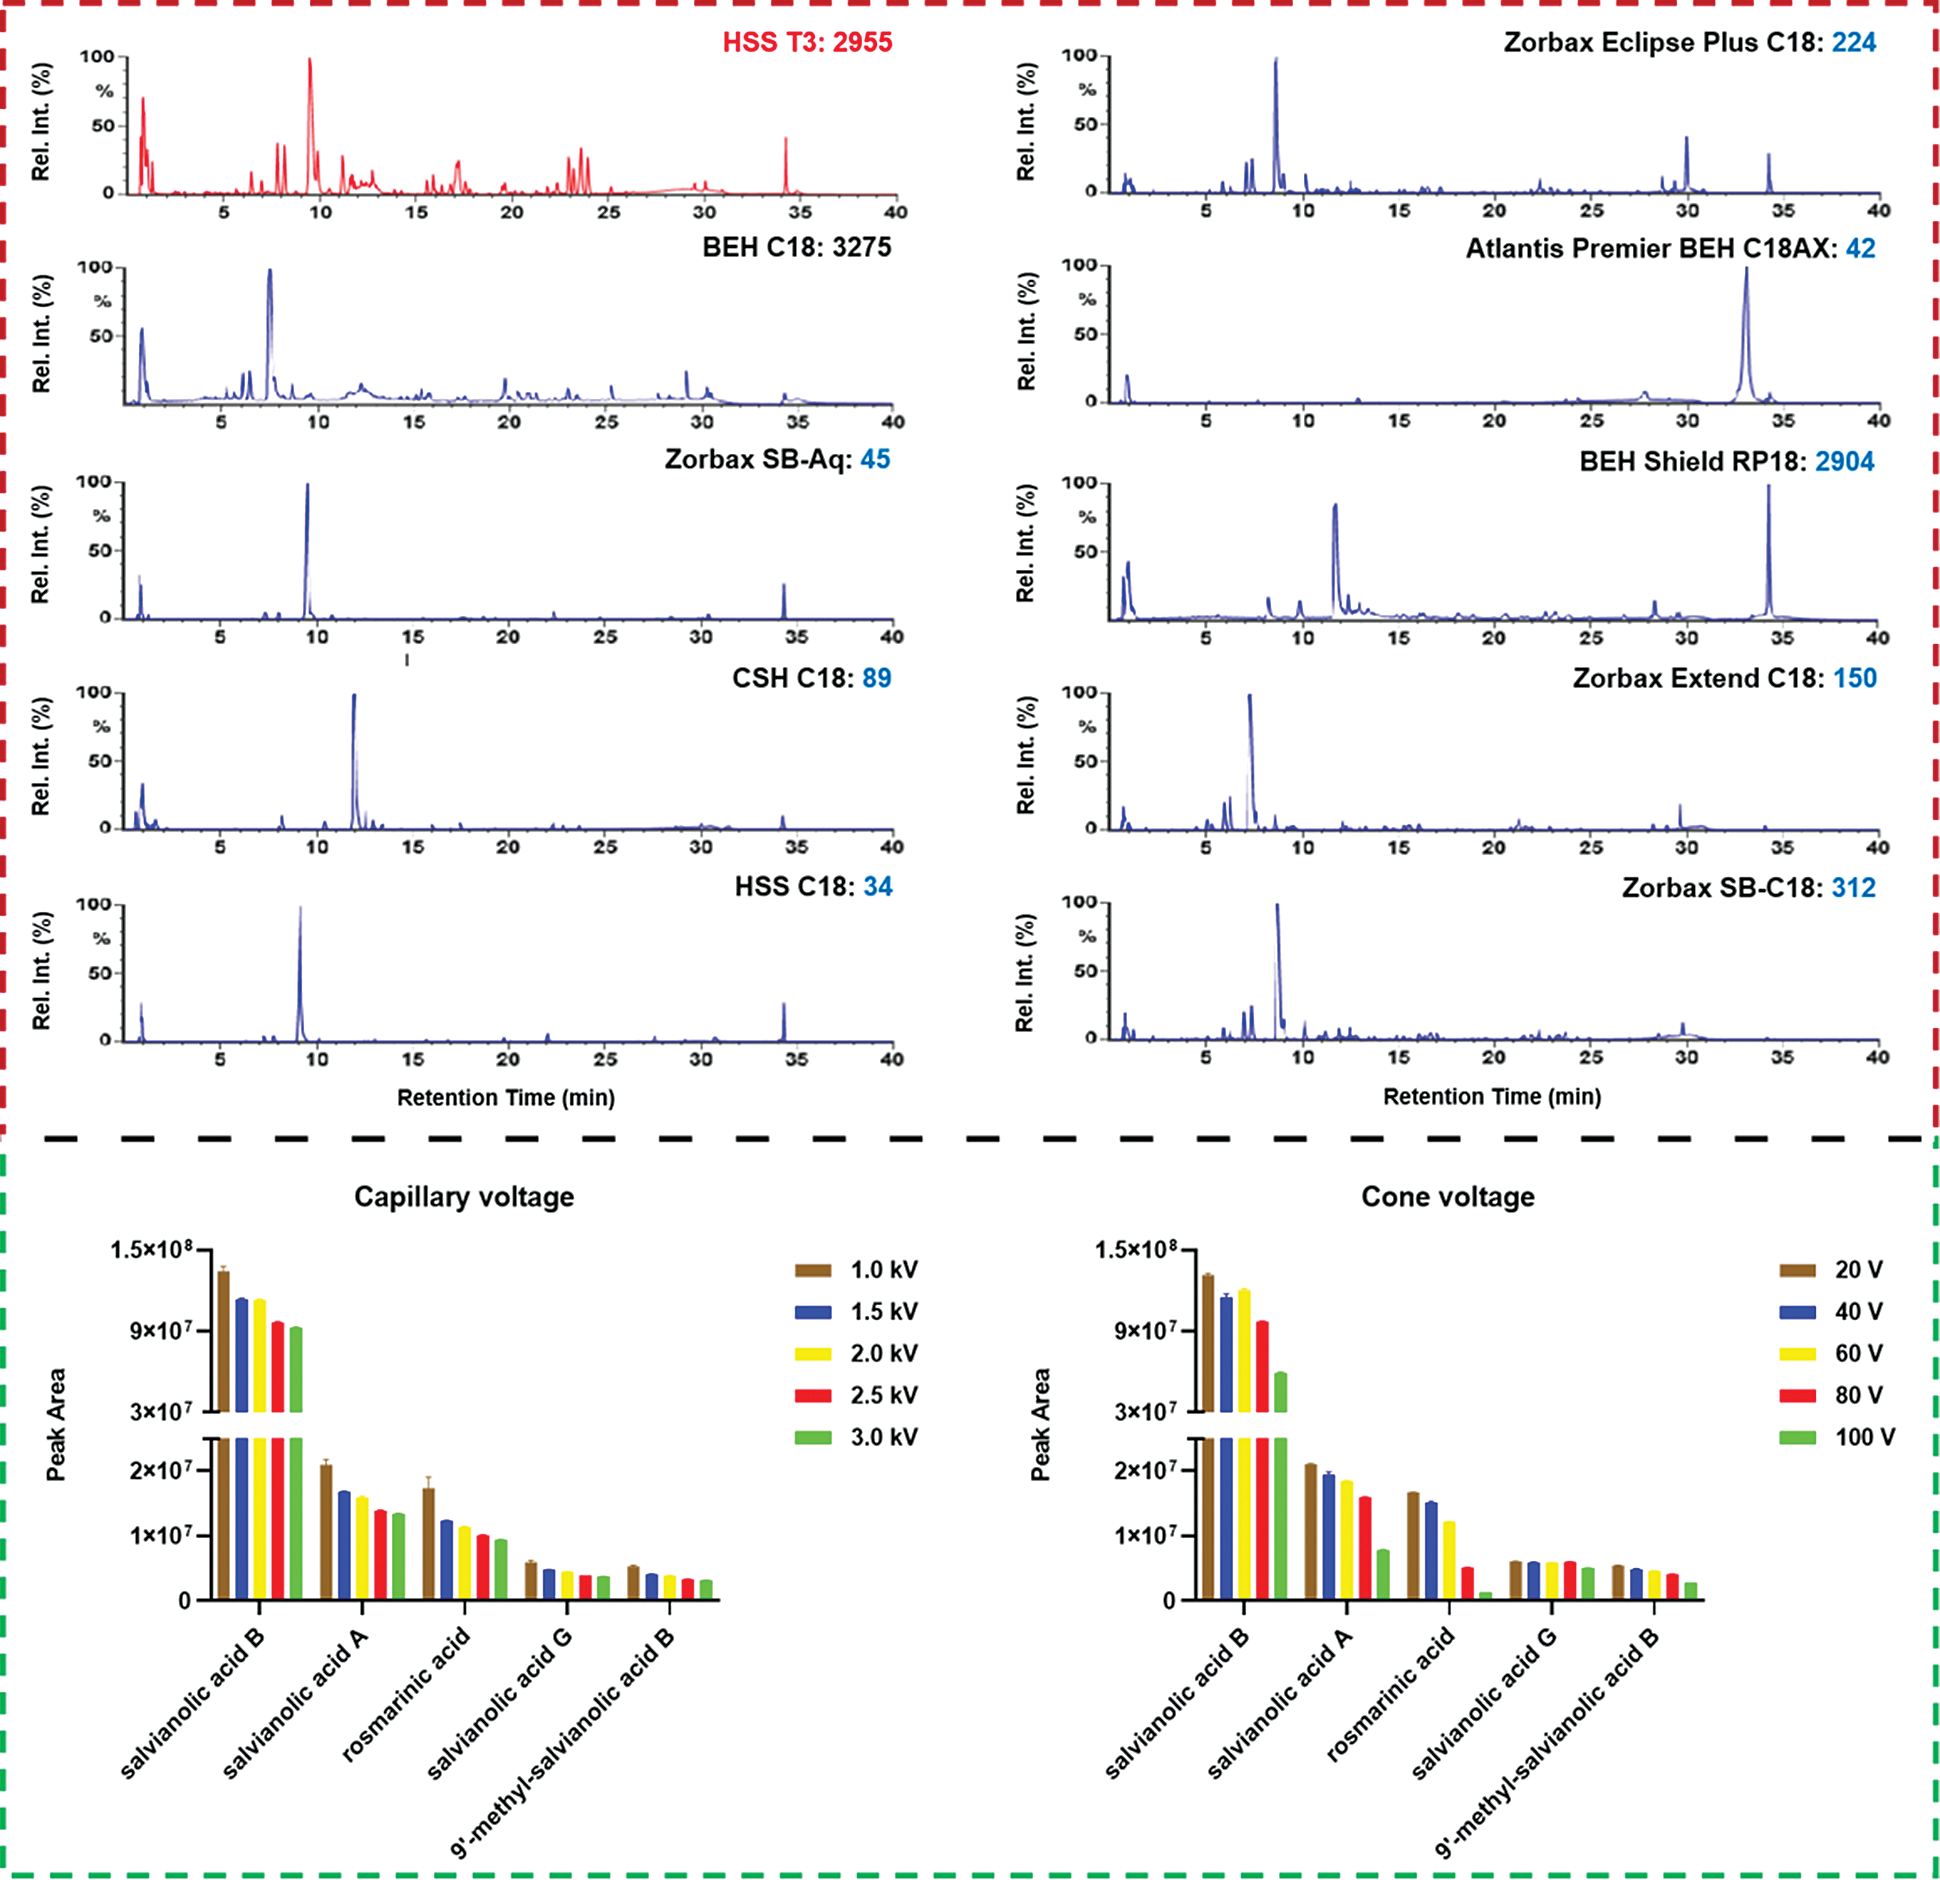
Figure 3: Screening of the candidate chromatographic columns and optimization of two key ion source parameters (capillary voltage and cone voltage) of the VionTM IM-QTOF mass spectrometer for the comprehensive characterization of the multicomponents from Salvia miltiorrhiza
3.2 Optimization of the Parameters on the Vion IM-QTOF Mass Spectrometer
The Vion IM-QTOF platform is a benchtop high-resolution mass spectrometer facilitating the ion mobility separation and convenient determination of the CCS values, by which dimension-enhanced multicomponent characterization can be achieved [17,18,31–34]. Key ion source parameters, including the capillary voltage, cone voltage, and RCE, in the negative mode were optimized in sequence, aimed to improve the sensitivity of Vion IM-QTOF for the multicomponent characterization from S. miltiorrhiza. In this section, we selected five representative components (e.g., salvianolic acid B, salvianolic acid A, rosmarinic acid, salvianolic acid G, and 9′-methyl-salvianolic acid B) as the index components for evaluating the different levels of settings. In detail, capillary voltage ranging 1.0–3.0 kV and cone voltage of 20–100 V were examined by comparing the peak areas in extracted ion chromatogram (EIC). It was exhibited in Fig. 3 that, low level of capillary voltage and cone voltage were beneficial to the high ion response for these five phenolic acid compounds in the negative mode. As a result, we selected 1.0 kV for capillary voltage and 20 V for cone voltage. What’s more, the Vion IM-QTOF high-resolution mass spectrometer enables ramp collision energy, by which more balanced MS2 spectra can be obtained with rich fragments from the high-mass to the low-mass regions [31–34]. We had tested five levels of RCE, including 10–30 eV, 20–40 eV, 30–50 eV, 40–60 eV, and 50–70 eV, to examine the differentiated fragmentations for four components, including 4-methylenemiltirone, salmiltiorin A, salvianolic acid A, and 8"‘-epi-9’-methyl-salvianolic acid B (Fig. 4). Obviously, higher level of RCE was able to induce more fragmentations. At 30–50 eV of RCE, the neutral loss of CH4 (16.03 Da) and the elimination of 2CH3 + CO (58.04 Da) were detected for 4-methylenemiltirone; the loss of 2CH3 (30.05 Da) and CH4 + CO2 (60.02 Da) for salmiltiorin A; the loss of danshensu (C9H10O5, 198.05 Da) and danshensu + C6H6O2 (308.09 Da) for salvianolic acid A, and the eliminations of danshensu (198.05 Da), danshensu + C9H8O4 (378.10 Da), and danshensu + C9H8O4 + H2O (396.11 Da) for 8"‘-epi-9’-methyl-salvianolic acid B, which were the characteristic fragments at relatively medium intensity. Thereby, RCE of 30–50 eV was finally selected. By these efforts, the good separation and sensitive detection of the multicomponents from S. miltiorrhiza were achieved.
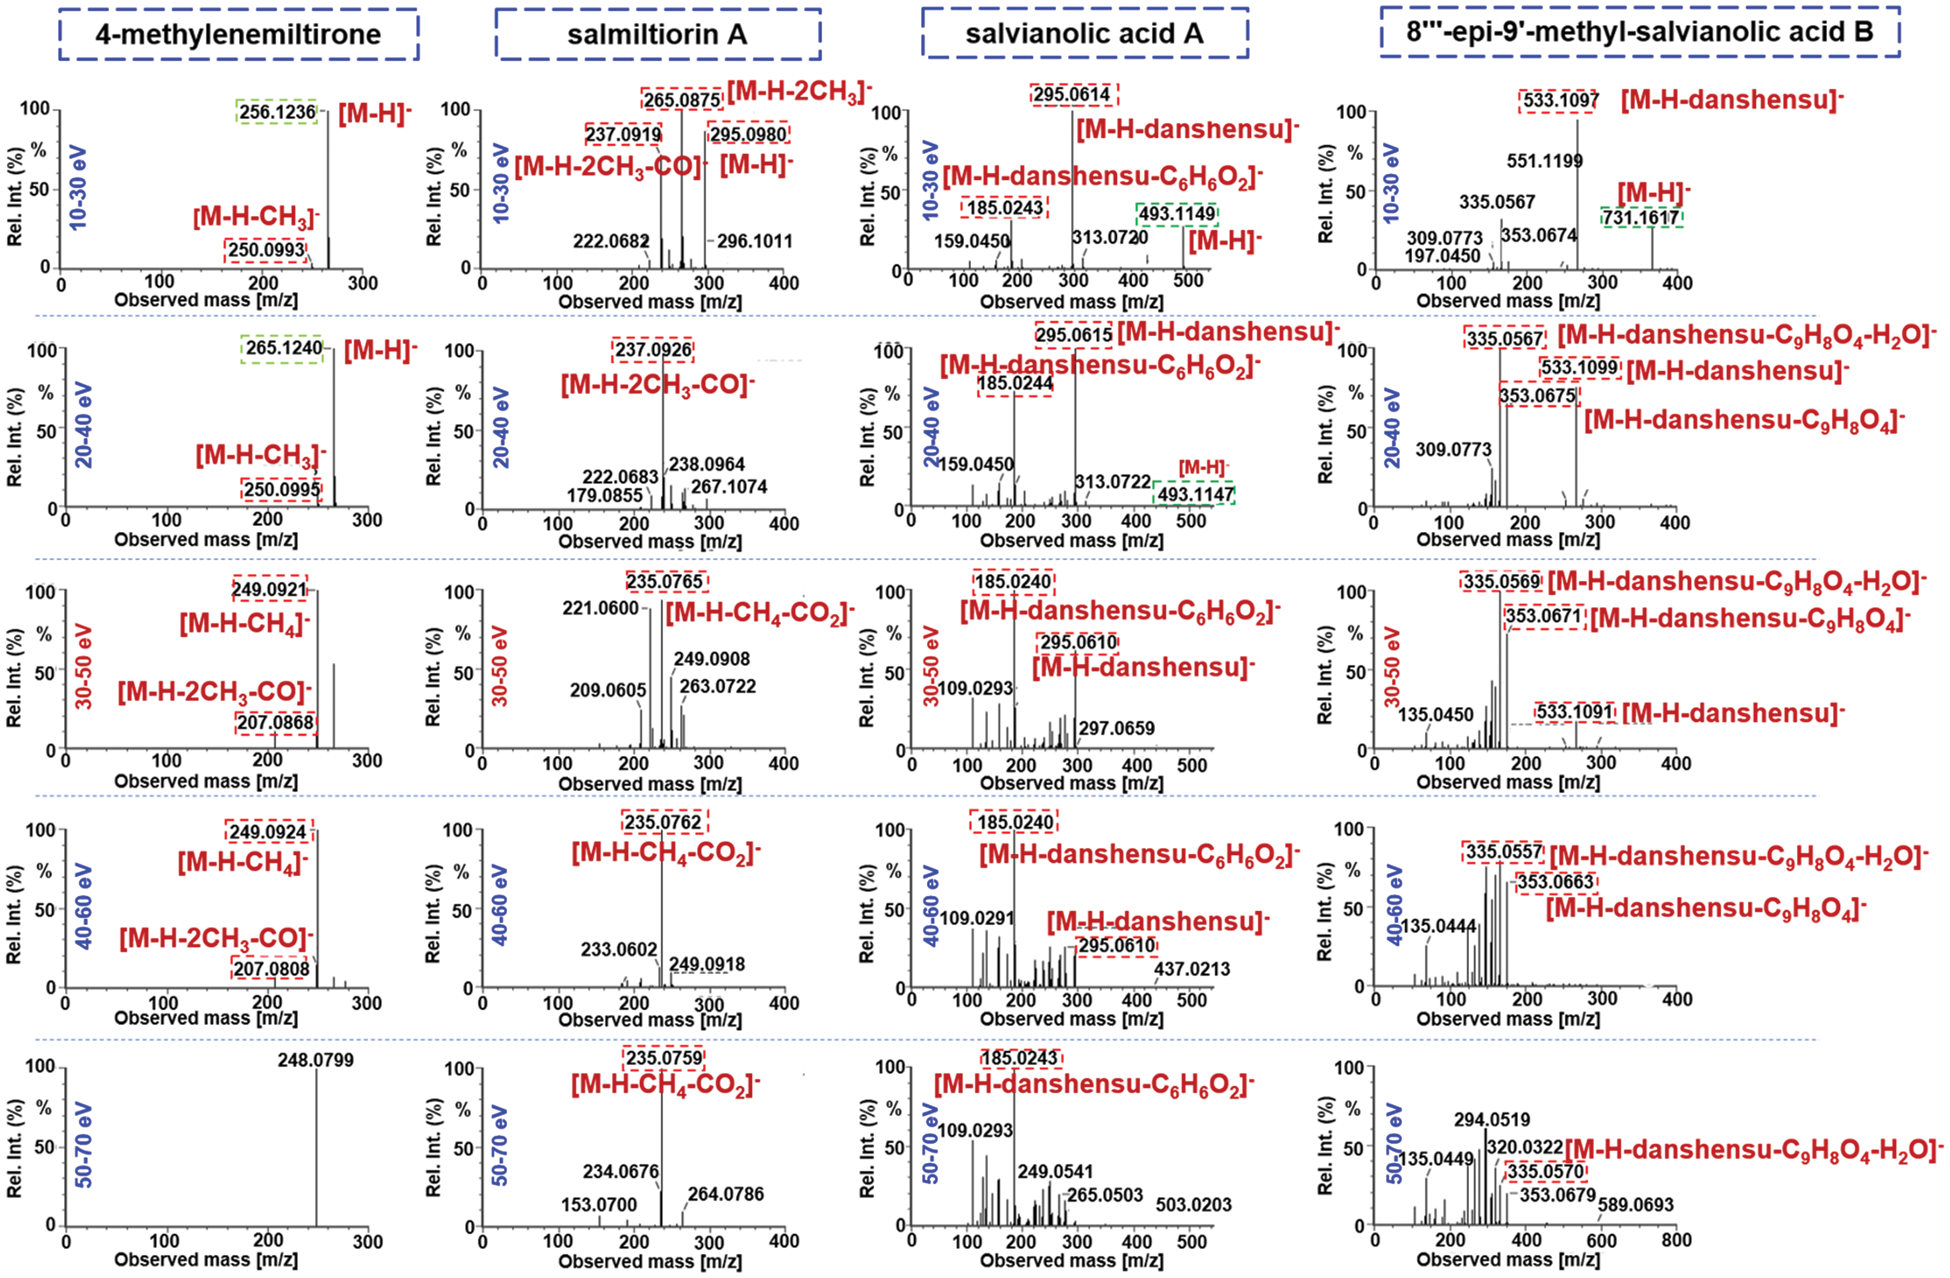
Figure 4: Comparison of five different levels of ramp collision energy (RCE) using four representative compounds
3.3 Comprehensive Characterization of the Multicomponents from S. miltiorrhiza by Analyzing the HDMSE Data Obtained in Both the Negative and Positive ESI Modes
Intelligent workflows by efficiently processing the HDMSE data using UNIFI and searching the database were well established. Very importantly, to overcome the lack of specific database for the multicomponent characterization from S. miltiorrhiza, an in-house library was created. Firstly, the literature regarding the phytochemical investigations of S. miltiorrhiza were retrieved by the databases like Web of Science (https://www.webofknowledge.com), CNKI (https://www.cnki.net), ChemSpider (https://www.chemspider.com), PubChem (pubchem.ncbi.nlm.nih), and Chemicalbook (https://www.chemicalbook.com), etc. A total of 198 components, involving terpenes, phenolic acids, and flavonoids, were outlined. Secondly, the structure of each known compound was prepared on the ChemDraw software and saved as a mol. file with the filename of the trivial name. Then the trivial name, chemical structure, exact mass number, and the structure category of this compound, were recorded in an Excel table. Finally, the structural formulae of all compounds and the EXCEL table containing detailed information of these structures were imported into the UNIFI software, generating the chemical library of S. miltiorrhiza.
The obtained negative and positive HDMSE data were processed by the established data processing workflows using UNIFI, by which the components that well matched the library (high-accuracy MS1 data and the theoretical MS2 fragments) were listed in the table of “Identified Components”. Various data information, such as the observed m/z, observed time, formula, mass error, and CCS, etc., was included. What’s more, the characterized components should be further confirmed in order to discriminate false positives (removed) and render the final identities. This was made based on multiple efforts like the extracted ion chromatogram (EIC) analysis to exactly identify the genuine precursor ions from the adducts and the in-source fragmentation ions, MS/MS-based fragmentation pathways analysis, and comparison of the retention behavior to discriminate possible isomers by analyzing the available data in the literature [31–34]. In addition, some abundant ions with response >10,000 but listed as “Unknown Components” were analyzed manually based on the high-accuracy MS1 and MS2 data to enrich the possible identifications with the masses not included in the in-house database. As a result, we could identify or tentatively characterize a total of 86 components from S. miltiorrhiza, and 13 thereof were identified by comparison with the reference compounds (Fig. 2). These 86 components were marked in the negative and positive MS1 spectra as exhibited in Fig. 5, with the information detailed in Table S2. These components characterized involved 51 terpenoids, 23 phenolic acids, and 12 other components.
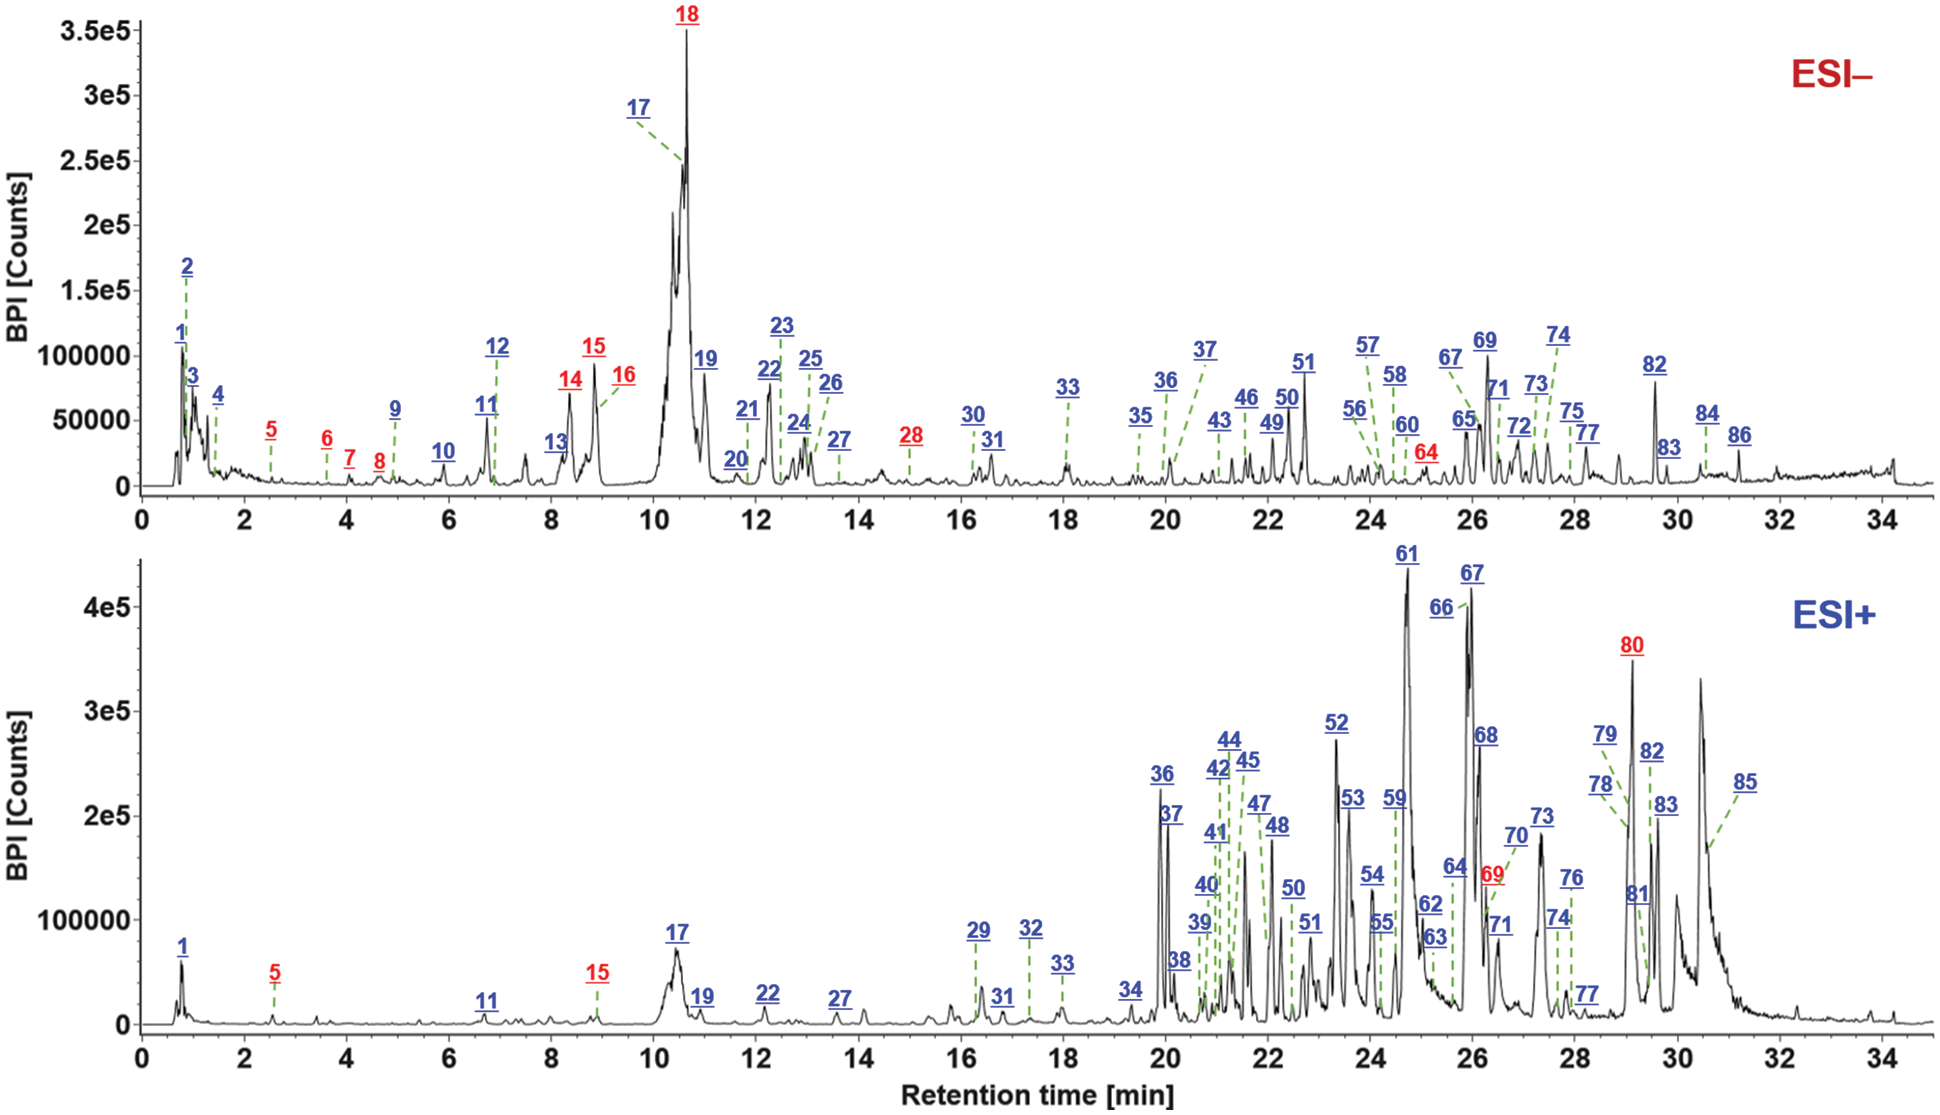
Figure 5: Base peak ion chromatograms of S. miltiorrhiza in both the ESI− and ESI+ modes, with all the 86 components marked. The numbers in red indicate the components identified by comparison with the reference compounds. Green lines indicate the number of the marked component
3.3.1 Characterization of Terpenoids
Terpenoids, especially diterpenoid quinones (such as tanshinone IIA, cryptotanshinone, and isotanshinone IIA, etc.) are usually selected as the markers for the quality evaluation of S. miltiorrhiza, which have shown significant pharmacological functions [35]. According to the parent frameworks of diterpenoid quinones, the terpenoids isolated from S. miltiorrhiza can be divided into the ortho-quinone and para-quinone diterpenoids, which usually consist of four rings (Rings A and B: tetrahydronaphthalene/naphthalene; Ring C: lactone/para-or ortho-naphthoquinone; and Ring D: dihydrofuran/furan) [36]. In the current work, 51 terpenoids were characterized, of which 64# (25.41 min; C18H14O3; CCS 160.75 Ǻ2), 69# (26.24 min; C19H20O3; CCS 169.03 Ǻ2), and 80# (29.18 min; C19H18O3; CCS 164.43 Ǻ2), were unambiguously identified as dihydrotanshinone I, cryptotanshinone, and tanshinone IIA, because of the comparison with the reference compounds. The characteristic eliminations of CO, H2O, and methyl (•CH3), were the main fragmentation features for the collision-induced dissociation (CID) of tanshinones [36], which could be demonstrated in detail by two terpenoids reference compounds, tanshinone IIA (80#) and cryptotanshinone (64#) in Fig. 6. In the case of tanshinone IIA (a classic ortho-quinone diterpenoid), the protonated precursor ion ([M + H]+) at m/z 295.1324 was observed in the full-scan MS1 spectrum, and upon CID-MS2, several rich product ions were dissociated from the precursor ions. Amongst them, the high-mass fragment at m/z 265.0855 was obtained after eliminating two methyl groups (30 Da), and the second most intense fragment of m/z 219.0792 could be regarded as its secondary product ion with CO + H2O eliminated. Furthermore, the ion of m/z 206.1074 at low intensity and m/z 191.0839 as the base peak ion could be assigned as the loss of H2O + 2CO + CH3 and H2O + 2CO + 2CH3 from the precursor ion. Aside from these fragments, the characteristic fragmentation by losing rings C and D (C7H6O3), combined with the elimination of CH3, could also be detected at m/z 142.0756 [36]. For the other reference compound 64#, dihydrotanshinone I (a classic para-quinone diterpenoid), the protonated molecule was observed in the positive mode at m/z 279.1000, which was able to eliminate a molecule of H2O producing the fragment at m/z 261.0899 upon CID-MS2 fragmentation. In addition, two fragments at m/z 233.0950 and 205.1000 could be further dissociated from m/z 261 by losing CO and 2 × CO, respectively. Two most intense product ions were observed at m/z 191.0838 and 189.0687, which could be obtained from m/z 233 after losing C2H2O (42 Da) and C2H4O (44 Da), respectively. The fragment at m/z 190.0751 should result from the dissociation of m/z 205 by further elimination of CH3. These typical fragmentation behaviors could assist to characterize those unknown diterpenoids from S. miltiorrhiza, such as compounds 32# and 61#.
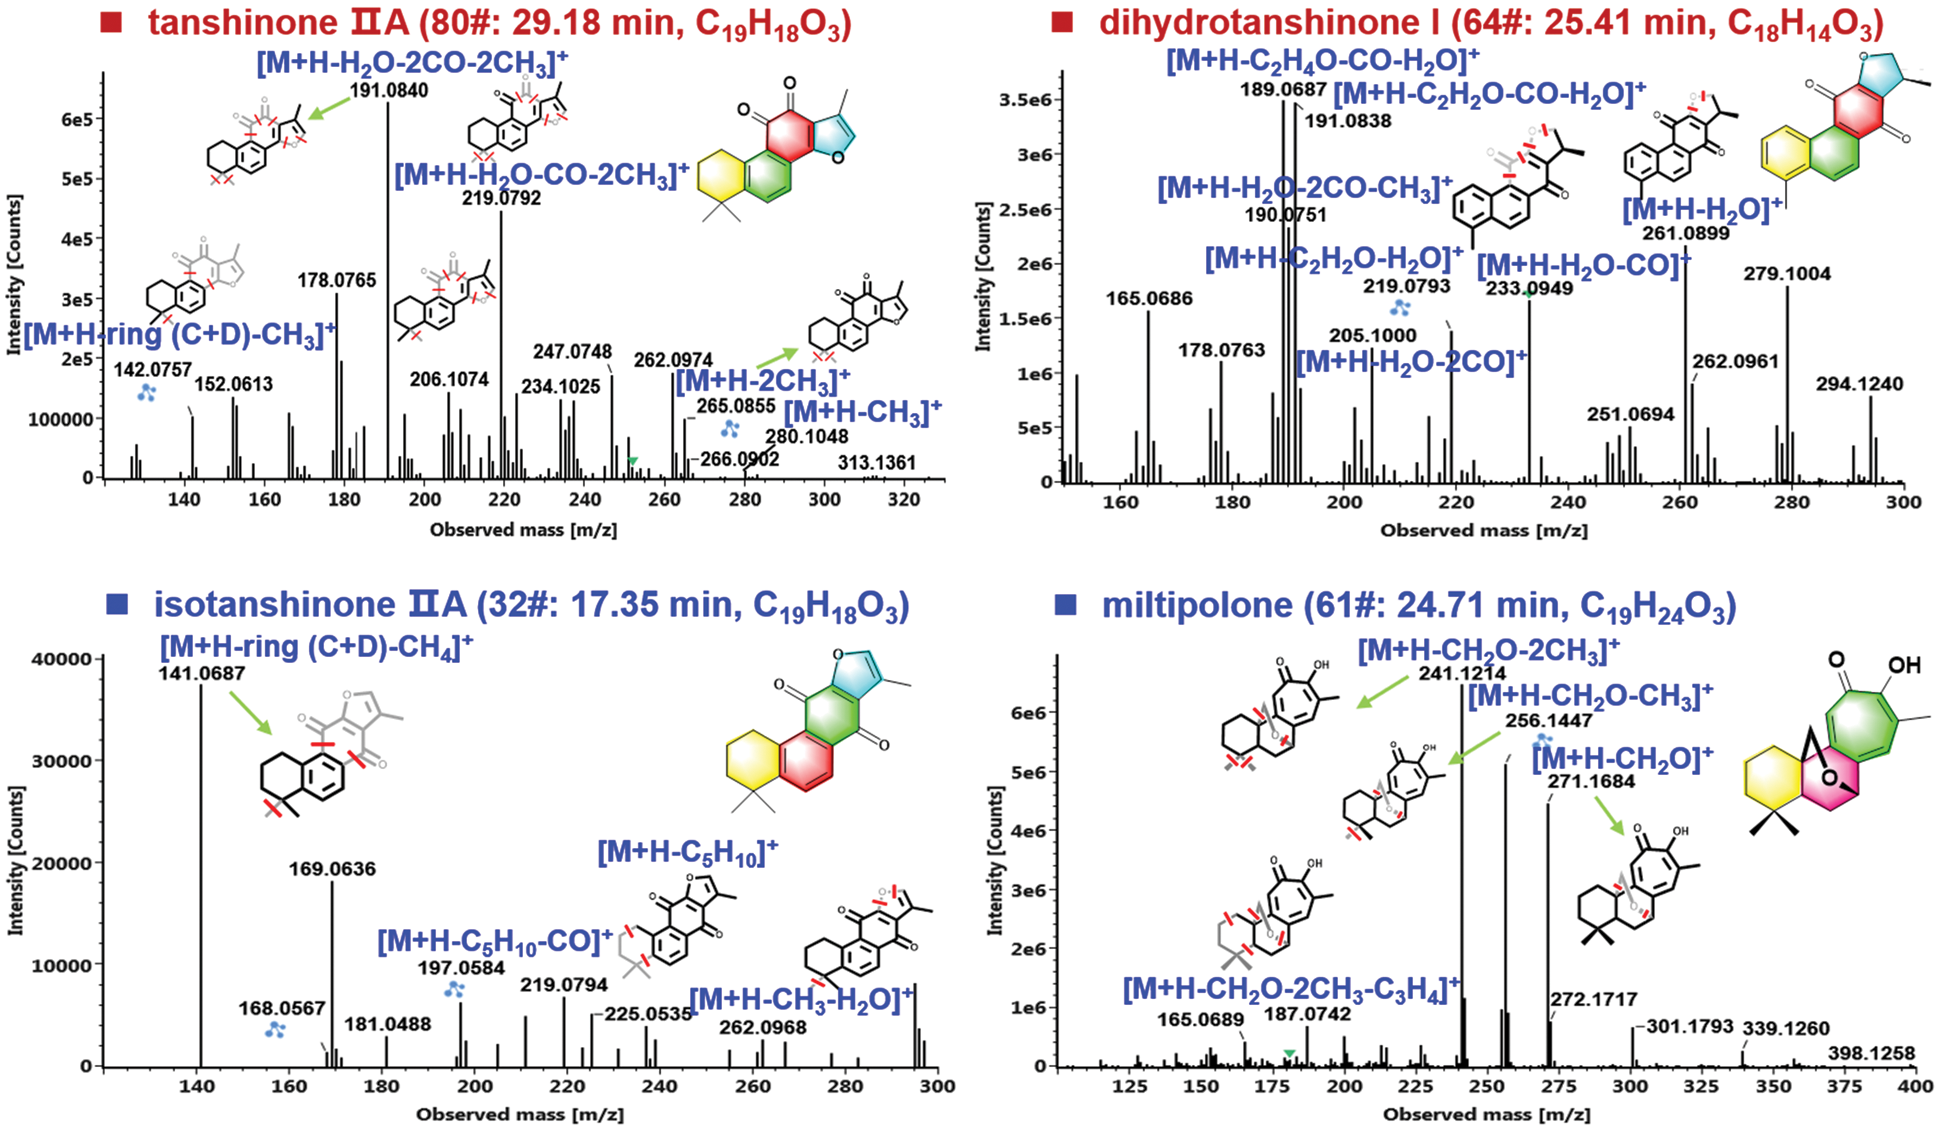
Figure 6: Illustration for the characterization of terpenoids from S. miltiorrhiza by analyzing the CID-MS2 data obtained in the positive ESI mode
Compound 32# (tR 17.35 min), giving an abundant protonated precursor ion at m/z 295.1320 (CCS 168.34 Ǻ2), was identified as an isomer of tanshinone IIA with the chemical formula C19H18O3 (2.0 ppm). In its CID-MS2 spectrum, the fragments of m/z 262.0968 ([M + H − •CH3 − H2O]+), 225.0535 due to cleavage of Ring A ([M + H − C5H10]+), and 197.0584 because of combined fragmentations of Ring A plus CO ([M + H − C5H10 − CO]+), were readily detected (Fig. 5). What’s more, the base peak ion at m/z 141.0687 could be assigned the eliminations of rings C/D plus CH4 from the precursors. Based on these characteristic fragmentation pathways, the structure of compound 32# could be tentatively identified as isotanshinone IIA [37]. Another unknown compound 61# (with protonated precursor ion observed at m/z 301.1796 for C19H25O3, −0.8 ppm; CCS 171.76 Ǻ2) was characterized possessing O-bridge decahydronaphthalene ring [38]. In the MS2 spectrum, the product ion at m/z 271.1684 obtained from the precursor ion by losing CH2O (30.0106 Da) could be related to the cleavage of the O-bridge structure, which was not observed for the other three triterpenoid structures mentioned above. The transition of m/z 271.1684→256.1447 was the result of the further loss of methyl combined with the O-bridge fragmentation. What’s more, the base peak product ion at m/z 241.1214 was obtained from the fragment of m/z 256.1447 by eliminating methyl. According to these MS evidences and searching of the in-house library of S. miltiorrhiza, we provisionally identify this compound as miltipolone [38]. Detailed information for the other terpenoid compounds characterized from S. miltiorrhiza is offered in Table S2.
3.3.2 Characterization of Phenolic Acids
The phenolic acids, commonly known as salvianolic acids, are another class of bioactive ingredients in S. miltiorrhiza [36]. Generally, salvianolic acids are composed by caffeic acid derivatives with different degrees of polymerization and the linkage types [39]. In this research, 23 phenolic acids were characterized from S. miltiorrhiza mainly based on the negative CID-MS2 data gained by HDMSE, of which 5# (tR 2.51 min; C9H10O5; CCS 179.41 Ǻ2), 7# (tR 4.24 min; C10H10O4; CCS 139.40 Ǻ2), 8# (tR 4.63 min; C27H22O12; CCS 212.79 Ǻ2), 14# (tR 8.34 min; C18H16O8; CCS 245.24 Ǻ2), 15# (tR 8.82 min; C26H22O10; CCS 210.34 Ǻ2), 16# (8.86 min, C17H14O16; CCS 209.05 Ǻ2), 18# (tR 10.62 min, C36H30O16; CCS 247.02 Ǻ2), 28# (tR 15.08 min, C37H32O16; CCS 253.95 Ǻ2), and 30# (tR 16.23 min, C26H20O10; CCS 209.82 Ǻ2), were identified as danshensu, ferulic acid, lithospermic acid, rosmarinic acid, salvianolic acid A, salvianolic acid F, salvianolic acid B, 9’-methyl lithospermate B, and salvianolic acid C, with the aid of the reference compounds. The fragmentation pathways of salvianolic acids were outlined and illustrated by compounds 15# (8.82 min, C26H22O10) and 18# (10.62 min, C36H30O16) as shown in Fig. 7. For compound 15#, the deprotonated molecule ([M − H]−) was detected at m/z 493.1135 in the MS1 spectrum, which could readily eliminate a danshensu unit (C9H10O5) to produce the product ion at m/z 295.0616. A medium intensity of fragment at m/z 267.0661 was obtained from m/z 295 due to the cleavage of CO. The base peak product ion in the MS2 spectrum was observed at m/z 185.0243, which should result from the dissociation of danshensu + catechol (C6H6O2) from the deprotonated molecule. Moreover, a deprotonated catechol fragment was also detected at m/z 109.0292. The CID-MS2 features in the negative mode for compound 18# ([M − H]− at m/z 717.1754), consistent with salvianolic acid B, were analyzed. A molecule of formic acid (HCOOH) could be dissociated generating a weak fragment at m/z 671.1384. More importantly, two diagnostic product ions because of the successive eliminations of danshensu and 2 × danshensu at m/z 519.0952 and 321.0413 (the base peak product ion) were observed. Apart from these, the fragments at m/z 295.0619 and 277.0511 were assigned as [M − H − 2danshensu − CO + H2]− and [M − H − 2danshensu − CO + H2 − H2O]−, respectively. These regular fragmentation behaviors are useful to characterize those unknown phenolic acids from S. miltiorrhiza like compounds 10# and 24#.
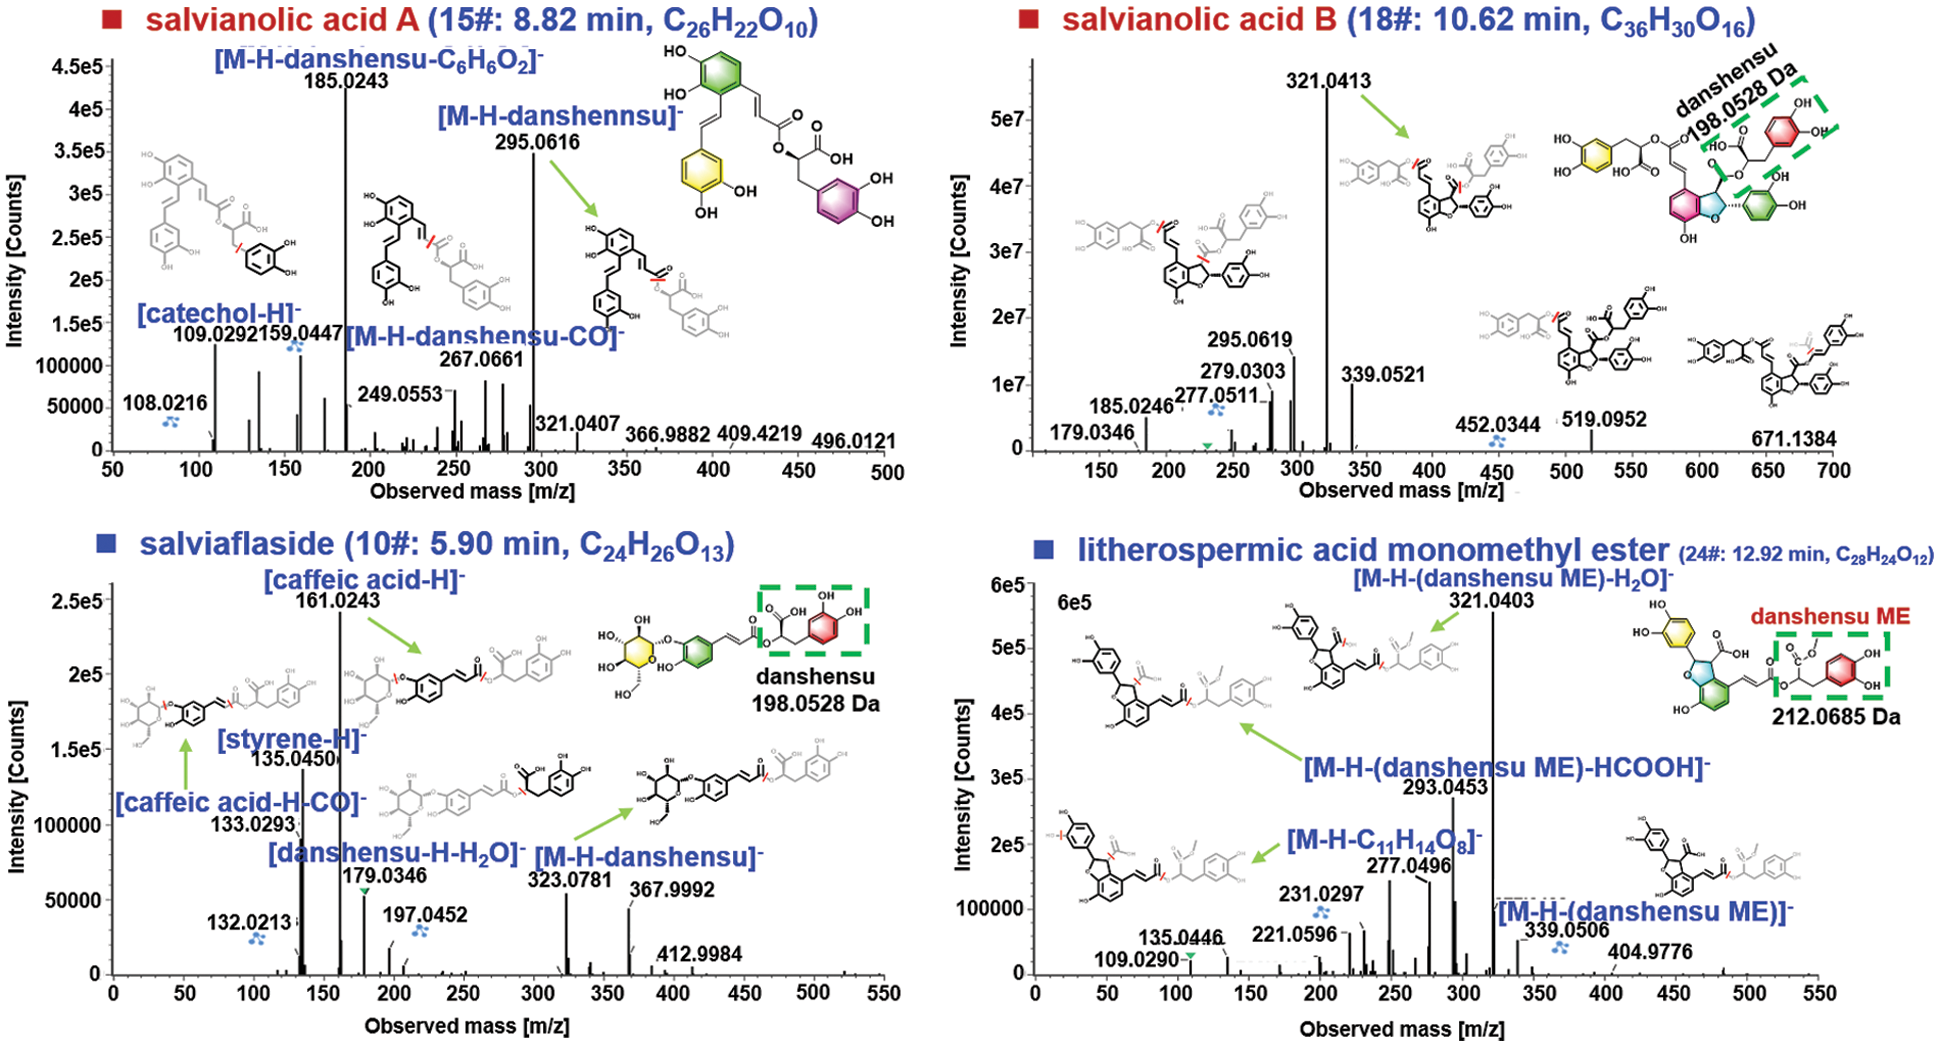
Figure 7: Illustration for the characterization of phenolic acids from S. miltiorrhiza by analyzing the CID-MS2 data obtained in the negative ESI mode.
The MS1 spectrum exhibited the rich [M − H]− ion at m/z 521.1306 for compound 10# (5.90 min; CCS 211.26 Ǻ2), which could suggest the chemical formula C24H26O13 (1.0 ppm). Under further cracking, the fragment at m/z 323.0781, because of the elimination of danshensu, was observed, which corresponded to the deprotonated fragment of danshensu and its secondary fragment appearing at m/z 197.0452 and 179.0346, respectively. The base peak ion at m/z 161.0243 (C9H5O3−) could be characterized as a fragment of caffeic acid. In addition, the fragment of m/z 133.0293 resulted from the deprotonated caffeic acid by the neutral loss of CO, while the concomitant ion at m/z 135.0450 (C8H7O2−) could be assigned as a fragment of styrene for the danshensu moiety. Relying on the CID-MS2 information and the searching of the in-house library of S. miltiorrhiza, compound 10# was thus tentatively identified as salviaflaside [40]. The compound 24# (12.92 min; CCS 219.60 Ǻ2) gave the deprotonated precursor ion at m/z 551.1211 in the MS1 spectrum, based on which the molecular formula was C28H24O12 (3.0 ppm). Upon CID-MS2, a weak fragment in the high-mass region was observed at m/z 339.0506, which could be identified as the loss of danshensu monomethyl ester (C10H12O5, 212.0685 Da) [41]. The base peak ion at m/z 321.0403 together with two medium-intensity fragments at m/z 295.0596 and 277.0496, were generally consistent with those for salvianolic acid B. Additionally, another rich fragment at m/z 293.0453 should result from the ion of m/z 321 by eliminating HCOOH. Accordingly, compound 24# was tentatively characterized as litherospermic acid monomethyl ester [42]. Apart from these two types of major components, we could also tentatively characterize 12 others, such as carbohydrates (e.g., raffitrinose, saccharose, and stachyose), fatty acid (linoleic acid), and aromatic aldehydes (protocatechualdehyde), etc., for which the detailed information is provided in Table S2.
Compared with the literature [29,43], we could rapidly characterize 86 compounds with one-dimensional chromatographic separation and get more reliable and reproducible structural information due to the utilization of IM-QTOF-MS. Notably, we have to highlight that the isomerism is very common for the secondary metabolites in S. miltiorrhiza. Literature has demonstrated that CCS can provide the supplementary information in characterizing and differentiating isomeric metabolites [44]. We have searched an open access CCS database (http://allccs.zhulab.cn/), reported by Prof. Zhu’s team [45], which gave the results for seven compounds we characterized from S. miltiorrhiza (80#, 64#, 32#, 61#, 15#, 18#, and 10#; Table S3). Evidently, aside from dihydrotanshinone I (64#: tR 25.41 min, m/z 277.0853 [M – H]–), the CCS value difference for the other six generally was minor between the experimental and the database. In the case of the isomer pair of tanshinone IIA (80#: tR 29.18 min, m/z 295.1321 [M + H]+; CCS 164.43 Ǻ2) and isotanshinone IIA (32#: tR 17.35 min, m/z 295.1320 [M + H]+; CCS 168.34 Ǻ2), their determined CCS showed a difference of 3.91 Ǻ2, which corelated to their structure differentiations. However, due to the lack of specific natural product CCS database, the role of CCS in isomers discrimination needs to be further explored.
In the current work, a UHPLC/IM-QTOF-MS method combined with computational peak annotation was established, and its application to S. miltiorrhiza could identify or tentatively characterize 86 components. Compared with the conventional LC-MS approach, the data-independent HDMSE harvests high coverage and offers high-definition MS spectra because of the additional dimension of IM separation. Moreover, intelligent data processing could yield reproducible characterization results with high efficiency. The methodology elaborated can be popularized to other medicinal herbs, and the results obtained will benefit the quality control of the TCM Dan-Shen.
Author Contribution: Boxue Chen, Hongda Wang, and Jiali Wang performed the experiment. Boxue Chen, Meiyu Liu, Wandi Hu, and Yuexin Qian analyzed the experimental data. Boxue Chen and Wenzhi Yang drafted the manuscript. Jie Liu, Xue Li, and Jing Wang polished the manuscript. Wenzhi Yang designed the research.
Acknowledgement: We thank the anonymous reviewers for their helpful comments.
Funding Statement: This work was financially supported by the National Key Research and Development Program of China (Grant No. 2018YFC1704500), Tianjin Committee of Science and Technology of China (Grant No. 21ZYJDJC00080), and National Natural Science Foundation of China (Grant No. 81872996).
Conflicts of Interest: The authors declare that they have no conflicts of interest to report regarding this article.
1. Liu, Z. Y., Guo, F. F., Luo, Y. W., Li, C., Zhang, X. L. et al. (2016). Batman-TCM: A bioinformatics analysis tool for molecular mechanism of traditional Chinese medicine. Scientific Reports, 6, 21146. DOI 10.1038/srep21146. [Google Scholar] [CrossRef]
2. Zhang, D., Zhang, B., Lv, J. T., Sa, R. N., Zhang, X. M. et al. (2020). The clinical benefits of Chinese patent medicines against COVID-19 based on current evidence. Pharmacological Research, 157, 104882. DOI 10.1016/j.phrs.2020.104882. [Google Scholar] [CrossRef]
3. Yang, W. Z., Zhang, Y. B., Wu, W. Y., Huang, L. Q., Guo, D. A. et al. (2017). Approaches to establish Q-markers for the quality standards of traditional Chinese medicines. Acta Pharmaceutica Sinica B, 7(4), 439–446. DOI 10.1016/j.apsb.2017.04.012. [Google Scholar] [CrossRef]
4. Wu, C. S., Zhang, H. Y., Wang, C. H., Qin, H. L., Zhu, M. S. et al. (2016). An integrated approach for studying exposure, metabolism, and disposition of multiple component herbal medicines using high-resolution mass spectrometry and multiple data processing tools. Drug Metabolism and Disposition, 44(6), 800–808. DOI 10.1124/dmd.115.068189. [Google Scholar] [CrossRef]
5. Yang, Y., Yao, C. L., Guo, D. A. (2021). Insight into chemical basis of traditional Chinese medicine based on the state-of-the-art techniques of liquid chromatography-mass spectrometry. Acta Pharmaceutica Sinica B, 11(6), 1469–1492. DOI 10.1016/j.apsb.2021.02.017. [Google Scholar] [CrossRef]
6. Plumb, R., Castro-Perez, J., Granger, J., Beattie, I., Joncour, K. et al. (2004). Ultra-performance liquid chromatography coupled to quadrupole-orthogonal time-of-flight mass spectrometry. Rapid Communications in Mass Spectrometry, 18(19), 2331–2337. DOI 10.1002/rcm.1627. [Google Scholar] [CrossRef]
7. Camenzuli, M., Schoenmakers, P. J. (2014). A new measure of orthogonality for multidimensional chromatography. Analytica Chimica Acta, 838, 93–101. DOI 10.1016/j.aca.2014.05.048. [Google Scholar] [CrossRef]
8. Feng, K. Y., Wang, S. M., Han, L. F., Qian, Y. X., Li, H. F. et al. (2021). Configuration of the ion exchange chromatography, hydrophilic interaction chromatography, and reversed-phase chromatography as off-line three-dimensional chromatography coupled with high-resolution quadrupole-orbitrap mass spectrometry for the multicomponent characterization of Uncaria sessilifructus. Journal of Chromatography A, 1649, 462237. DOI 10.1016/j.chroma.2021.462237. [Google Scholar] [CrossRef]
9. Wang, H. D., Wang, S. M., Zhao, D. X., Xie, H. M., Wang, H. M. et al. (2021). A novel ion mobility separation-enabled and precursor ions list-included high-definition data-dependent acquisition (HDDDA) approach: Method development and its application to the comprehensive multicomponent characterization of Fangji Huangqi decoction. Arabian Journal of Chemistry, 14(4), 103087. DOI 10.1016/j.arabjc.2021.103087. [Google Scholar] [CrossRef]
10. Wang, H. D., Zhang, C. X., Zuo, T. T., Li, W. W., Jia, L. et al. (2019). In-depth profiling, characterization, and comparison of the ginsenosides among three different parts (the root, stem leaf, and flower bud) of Panax quinquefolius L. by ultra-high performance liquid chromatography/quadrupole-orbitrap mass spectrometry. Analytical and Bioanalytical Chemistry, 411(29), 7817–7829. DOI 10.1007/s00216-019-02180-8. [Google Scholar] [CrossRef]
11. Lai, C. J. S., Tan, T., Zeng, S. L., Qi, L. W., Liu, X. G. et al. (2015). An integrated high resolution mass spectrometric data acquisition method for rapid screening of saponins in Panax notoginseng (Sanqi). Journal of Pharmaceutical and Biomedical Analysis, 109, 184–191. DOI 10.1016/j.jpba.2015.02.028. [Google Scholar] [CrossRef]
12. Pan, H. Q., Yang, W. Z., Yao, C. L., Shen, Y., Zhang, Y. B. et al. (2017). Mass defect filtering-oriented classification and precursor ions list-triggered high-resolution mass spectrometry analysis for the discovery of indole alkaloids from Uncaria sinensis. Journal of Chromatography A, 1516, 102–113. DOI 10.1016/j.chroma.2017.08.035. [Google Scholar] [CrossRef]
13. Wang, H. P., Chen, C., Liu, Y., Yang, H. J., Wu, H. W. et al. (2015). Identification of the chemical constituents of Chinese medicine Yi-Xin-Shu capsule by molecular feature orientated precursor ion selection and tandem mass spectrometry structure elucidation. Journal of Separation Science, 38(21), 3687–3695. DOI 10.1002/jssc.201500698. [Google Scholar] [CrossRef]
14. Pan, H. Q., Zhou, H., Miao, S., Cao, J. Y., Liu, J. M. et al. (2020). An integrated approach for global profiling of multi-type constituents: Comprehensive chemical characterization of Lonicerae Japonicae Flos as a case study. Journal of Chromatography A, 1613, 460674. DOI 10.1016/j.chroma.2019.460674. [Google Scholar] [CrossRef]
15. Li, S., Jin, S. N., Song, C. W., Jia, S. L., Zhang, Y. et al. (2017). The strategy for establishment of the multiple reaction monitoring based characteristic chemical profile of triterpenes in Alismatis Rhizoma using two combined tandem mass spectrometers. Journal of Chromatography A, 1524, 121–134. DOI 10.1016/j.chroma.2017.09.057. [Google Scholar] [CrossRef]
16. Doerr, A. (2015). DIA mass spectrometry. Nature Methods, 12(3), 35–35. DOI 10.1038/nmeth.3234. [Google Scholar] [CrossRef]
17. Zuo, T. T., Zhang, C. X., Li, W. W., Wang, H. D., Hu, Y. et al. (2020). Offline two-dimensional liquid chromatography coupled with ion mobility-quadrupole time-of-flight mass spectrometry enabling four dimensional separation and characterization of the multicomponents from white ginseng and red ginseng. Journal of Pharmaceutical Analysis, 10(6), 597–609. DOI 10.1016/j.jpha.2019.11.001. [Google Scholar] [CrossRef]
18. Wang, S. M., Li, X., Chen, B. X., Li, S. T., Wang, J. L. et al. (2022). Dimension-enhanced ultra-high performance liquid chromatography/ion mobility-quadrupole time-of-flight mass spectrometry combined with intelligent peak annotation for the rapid characterization of the multiple components from seeds of Descurainia sophia. Phyton-International Journal of Experimental Botany, 91(3), 541–566. DOI 10.32604/phyton.2022.018571. [Google Scholar] [CrossRef]
19. Xia, Y. G., Gong, F. Q., Guo, X. D., Song, Y., Li, C. X. et al. (2019). Rapid screening and characterization of triterpene saponins in Acanthopanax senticosus leaves via untargeted MSAll and SWATH techniques on a quadrupole time of flight mass spectrometry. Journal of Pharmaceutical and Biomedical Analysis, 170, 68–82. DOI 10.1016/j.jpba.2019.02.032. [Google Scholar] [CrossRef]
20. Naz, S., Gallert-Ayala, H., Reinke, S. N., Mathon, C., Blankley, R. et al. (2017). Development of a liquid chromatography high resolution mass spectrometry metabolomics method with high specificity for metabolite identification using all ion fragmentation acquisition. Analytical Chemistry, 89(15), 7933–7942. DOI 10.1021/acs.analchem.7b00925. [Google Scholar] [CrossRef]
21. Zhou, J. T., Li, Y. H., Chen, X., Zhong, L. J., Yin, Y. X. (2017). Development of data-independent acquisition workflows for metabolomic analysis on a quadrupole-orbitrap platform. Talanta, 164, 128–136. DOI 10.1016/j.talanta.2016.11.048. [Google Scholar] [CrossRef]
22. Lai, Z. J., Tsugawa, H., Wohlgemuth, G., Mehta, S., Mueller, M. et al. (2018). Identifying metabolites by integrating metabolome databases with mass spectrometry cheminformatics. Nature Methods, 15(1), 53–56. DOI 10.1038/NMETH.4512. [Google Scholar] [CrossRef]
23. Kaufmann, A., Butcher, P., Maden, K., Walker, S., Widmer, M. (2017). Practical application of in silico fragmentation based residue screening with ion mobility high-resolution mass spectrometry. Rapid Communications in Mass Spectrometry, 31(17), 1147–1157. DOI 10.1002/rcm.7890. [Google Scholar] [CrossRef]
24. Sumner, L. W., Amberg, A., Barrett, D., Beale, M. H., Beger, R. et al. (2007). Proposed minimum reporting standards for chemical analysis Chemical Analysis Working Group (CAWG) Metabolomics Standards Initiative (MSI). Metabolomics, 3(3), 211–221. DOI 10.1007/s11306-007-0082-2. [Google Scholar] [CrossRef]
25. Zhang, C. X., Zuo, T. T., Wang, X. Y., Wang, H. D., Hu, Y. et al. (2019). Integration of data-dependent acquisition (DDA) and data-independent high-definition MSE (HDMSE) for the comprehensive profiling and characterization of multicomponents from Panax japonicus by UHPLC/IM-QTOF-MS. Molecules, 24(15), 2708. DOI 10.3390/molecules24152708. [Google Scholar] [CrossRef]
26. Li, M. H., Chen, J. M., Peng, Y., Wu, Q. L., Xiao, P. G. (2008). Investigation of Danshen and related medicinal plants in China. Journal of Ethnopharmacology, 120(3), 419–426. DOI 10.1016/j.jep.2008.09.013. [Google Scholar] [CrossRef]
27. Chinese Pharmacopoeia Commission (2020). Pharmacopoeia of the People’s Republic of China, vol. 1. Beijing: Chinese Medical Science and Technology Press. [Google Scholar]
28. Luo, H. L., Kong, W. J., Hu, Y. C., Chen, P., Wu, X. R. et al. (2015). Quality evaluation of Salvia miltiorrhiza Bge. by ultra high performance liquid chromatography with photodiode array detection and chemical fingerprinting coupled with chemometric analysis. Journal of Separation Science, 38(9), 1544–1551. DOI 10.1002/jssc.201401430. [Google Scholar] [CrossRef]
29. Cao, J. L., Wang, S. S., Hu, H., He, C. W., Wan, J. B. et al. (2018). Online comprehensive two-dimensional hydrophilic interaction chromatography × reversed-phase liquid chromatography coupled with hybrid linear ion trap orbitrap mass spectrometry for the analysis of phenolic acids in Salvia miltiorrhiza. Journal of Chromatography A, 1536, 216–277. DOI 10.1016/j.chroma.2017.09.041. [Google Scholar] [CrossRef]
30. Paglia, G., Angel, P., Williams, J. P., Richardson, K., Olivos, H. J. et al. (2015). Ion mobility-derived collision cross section as an additional measure for lipid fingerprinting and identification. Analytical Chemistry, 87(2), 1137–1144. DOI 10.1021/ac503715v. [Google Scholar] [CrossRef]
31. Zuo, T. T., Qian, Y. X., Zhang, C. X., Wei, Y. X., Wang, X. Y. et al. (2019). Data-dependent acquisition and database-driven efficient peak annotation for the comprehensive profiling and characterization of the multicomponents from compound Xueshuantong capsule by UHPLC/IM-QTOF-MS. Molecules, 24(19), 3431. DOI 10.3390/molecules24193431. [Google Scholar] [CrossRef]
32. Zhang, C. X., Wang, X. Y., Lin, Z. Z., Wang, H. D., Qian, Y. X. et al. (2020). Highly selective monitoring of in-source fragmentation sapogenin product ions in positive mode enabling group-target ginsenosides profiling and simultaneous identification of seven Panax herbal medicines. Journal of Chromatography A, 1618, 460850. DOI 10.1016/j.chroma.2020.460850. [Google Scholar] [CrossRef]
33. Wang, S. M., Qian, Y. X., Sun, M. X., Jia, L., Hu, Y. et al. (2020). Holistic quality evaluation of Saposhnikoviae radix (Saposhnikovia divaricata) by reversed-phase ultra-high performance liquid chromatography and hydrophilic interaction chromatography coupled with ion mobility quadrupole time-of-flight mass spectrometry-based untargeted metabolomics. Arabian Journal of Chemistry, 13(12), 8835–8847. DOI 10.1016/j.arabjc.2020.10.013. [Google Scholar] [CrossRef]
34. Li, W. W., Yang, X. N., Chen, B. X., Zhao, D. X., Wang, H. D. et al. (2021). Ultra-high performance liquid chromatography/ion mobility time-of-flight mass spectrometry-based untargeted metabolomics combined with quantitative assay unveiled the metabolic difference among the root, leaf, and flower bud of Panax notoginseng. Arabian Journal of Chemistry, 14(11), 103409. DOI 10.1016/j.arabjc.2021.103409. [Google Scholar] [CrossRef]
35. Gao, S., Liu, Z., Li, H., Little, P. J., Liu, P. Q. et al. (2012). Cardiovascular actions and therapeutic potential of tanshinone IIA. Atherosclerosis, 221(2), 3–10. DOI 10.1016/j.atherosclerosis.2012.01.014. [Google Scholar] [CrossRef]
36. Pang, H. Q., Wu, L., Tang, Y. P., Zhou, G. S., Qu, C. et al. (2016). Chemical analysis of the herbal medicine Salviae miltiorrhizae Radix et Rhizoma (Danshen). Molecules, 21(1), 51. DOI 10.3390/molecules21010051. [Google Scholar] [CrossRef]
37. Marrero, J. G., San Andres, L., Luis, J. G. (2005). Quinone derivatives by chemical transformations of 16-hydroxycarnosolfrom Salvia species. Chemical & Pharmaceutical Bulletin, 53(12), 1524–1529. DOI 10.1002/chin.200619173. [Google Scholar] [CrossRef]
38. Ginda, H., Masahito, M., Midori, O. I., Takenori, K., Yoshinobu, I. et al. (1991). Structures of diterpenoid tropolones, salviolone and miltipolone, from the root of Salvia miltiorrhiza Bunge. Bulletin of the Chemical Society of Japan, 64, 3422–3426. DOI 10.1002/chin.199208283. [Google Scholar] [CrossRef]
39. Su, C. Y., Ming, Q. L., Rahman, K., Han, T. (2015). Salvia miltiorrhiza: Traditional medicinal uses, chemistry, and pharmacology. Chinese Journal of Natural Medicines, 13(3), 163–182. DOI 10.1016/S1875-5364(15)30002-9. [Google Scholar] [CrossRef]
40. Tezuka, Y., Kasimu, R., Li, J. X., Basnet, P., Tanaka, K. et al. (1998). Constituents of roots of Salvia deserta Schang (Xinjiang-Danshen). Chemical & Pharmaceutical Bulletin, 46(1), 107–112. DOI 10.1248/cpb.46.107. [Google Scholar] [CrossRef]
41. Kou, X. L., Yang, D. H., Su, Y. Y., Liu, F. (2015). ESI-MS/MS analysis of salvianolic acid A and salvianolic B from Salvia miltiorrhiza. Modern Chinese Medicine, 17(10), 1026–1029. DOI 10.13313/j.issn.1673-4890.2015.10.007. [Google Scholar] [CrossRef]
42. Xu, L. L., Shang, Z. P., Bo, T., Sun, L., Guo, Q. L. et al. (2019). Rapid quantitation and identification of the chemical constituents in Danhong injection by liquid chromatography coupled with orbitrap mass spectrometry. Journal of Chromatography A, 1606, 460378. DOI 10.1016/j.chroma.2019.460378. [Google Scholar] [CrossRef]
43. Cao, J. L., Wei, J. C., Hu, Y. J., He, C. W., Chen, M. W. et al. (2016). Qualitative and quantitative characterization of phenolic and diterpenoid constituents in Danshen (Salvia miltiorrhiza) by comprehensive two-dimensional liquid chromatography coupled with hybrid linear ion trap orbitrap mass. Journal of Chromatography A, 1427, 79–89. DOI 10.1016/j.chroma.2015.11.078. [Google Scholar] [CrossRef]
44. Tu, J., Zhou, Z. W., Li, T. Z., Zhu, Z. J. (2019). The emerging role of ion mobility-mass spectrometry in lipidomics to facilitate lipid separation and identification. Trends in Analytical Chemistry, 116, 332–339. DOI 10.1016/j.trac.2019.03.017. [Google Scholar] [CrossRef]
45. Zhou, Z. W., Luo, M. D., Chen, X., Yin, Y. D., Xiong, X. et al. (2020). Ion mobility collision cross-section atlas for known and unknown metabolite annotation in untargeted metabolomics. Nature Communications, 11, 4334. DOI 10.1038/s41467-020-18171-8. [Google Scholar] [CrossRef]
Appendix
Additional data associated with this article are provided as Supporting Information.
 | This work is licensed under a Creative Commons Attribution 4.0 International License, which permits unrestricted use, distribution, and reproduction in any medium, provided the original work is properly cited. |