| Phyton-International Journal of Experimental Botany |
DOI: 10.32604/phyton.2022.019130
ARTICLE
Transcriptome Analysis of Soybean in Response to Different Sulfur Concentrations
1Northeast Agricultural University, Harbin, 150030, China
2Harbin Academy of Agricultural Science, Harbin, 150029, China
*Corresponding Author: Shoukun Dong. Email: shoukundong@163.com
Received: 04 September 2021; Accepted: 11 November 2021
Abstract: Sulfur is an indispensable nutrient for plant growth and development, and is important in the synthesis of sulfur-containing amino acids. Although several studies on the effects of some macronutrients, including nitrogen and phosphorus, have been conducted on the performance of several crops at the genomic level, studies on the effect of sulfur on crop performance are limited. Therefore, this study aimed to examine the effect of different sulfur concentration on the transcriptome of soybean. Additionally, soybean yield parameters were also examined. Two soybean varieties, DND252 and HN84, were exposed to low and high concentrations of sulfur, and differentially expressed genes (DEGs) were identified using transcriptome analysis. The study results showed that the DEGs identified in the DND252 variety were involved in stimuli response, DNA binding and cell periphery under low sulfur concentrations. Also, the DEGs identified under high sulfur concentration were involved in membrane and membrane parts. Additionally, DEGs identified in the HN84 variety under low sulfur concentrations had similar functions as those identified in DND252 under high sulfur concentrations, indicating that HN84 was more sensitive to sulfur concentration changes than DND252. However, under higher sulfur concentrations, the DEGs identified in HN84 were primarily involved in membrane and membrane parts, indicating that high sulfur can cause cell membrane damage. Furthermore, soybean grown using 2.0 mmol/L sulfur had the best yield. The findings of this study identified candidate genes for the breeding and development of sulfur-efficient soybean varieties.
Keywords: Soybean; sulfur; transcriptome
Sulfur (S) is an indispensable nutrient for several plant metabolic processes, including the biosynthesis of sulfur-containing amino acids, however, there has been a decline in available sulfur for plant metabolic processes in the last 30 years [1]. Plants must assimilate this nutrient from the environment and convert it into metabolically useful forms for the biosynthesis of a wide range of compounds, including cysteine and glutathione [2]. Sulfur-containing amino acids and metabolites maintain plant cell mechanisms to improve stress tolerance. Sulfur interacts with several biomolecules, such as phytohormones, polyamines, and nitric oxide (NO), which can produce derivatives that are essential for abiotic stress tolerance [3]. Moreover, sulfur is an essential element determining the productivity and quality of agricultural crops [4]. Plants undergo a series of altered morphological and physiological processes under sulfur deficiency conditions [5], which can affect productivity. Plants adapt to sulfur deficiency by activating the assimilation and catabolism of stored sulfur compounds, and repressing the synthesis of secondary sulfur metabolites, such as glucosinolates [6]. More than 30% of agrochemicals today, including fungicides, herbicides, and pesticides, contain at least one sulfur compound [7]. Plant sulfur nutrition is particularly important because plant proteins are the primary source of methionine, an essential amino acid [8]. One such protein-rich crop is a soybean that is highly used in livestock and human diets as a protein source.
Soybean (Glycine max L. Merr.) was domesticated approximately 3,000–5,000 years ago in China [9]. It is one of the most widely cultivated economic legume crops for its oil, mineral, and protein resources [10–12]. Soybean seed contains 20% oil, 30%–40% protein, 30% carbohydrate, and considerable quantities of dietary fiber, minerals, and vitamins [13]. Protein- and oil-rich beans contribute to approximately 69% of the protein and 30% of the oil consumed by humans and livestock [14]. The cultivation of soybean has shown a constant increase over the years [15]. In 2018, the United States (35%), Brazil (34%) and Argentina (11%) produced approximately 80% of the world’s soybean, which is equivalent to approximately 350 Mt [16]. Although soybean is rich in protein, its sulfur amino acid content is relatively low. Therefore, owing to the low sulfur amino acid content of soybean compared with animal proteins, some studies have been performed on possible approaches to improve the amino acid profile of soybean. One of such approaches involves the manipulation of enzymes involved in sulfur assimilatory pathways. Moreover, owing to the decrease in the availability of sulfur for plant growth, it is necessary to examine the response of soybean to different soil sulfur levels. However, such studies are often genomic and involve the use of transcriptomic technologies.
Transcriptome analysis is a useful tool for determining transcriptional changes in cells under different conditions [17]. The whole genome sequence of soybean has been published. Transcriptomic technologies have been applied in various aspects of soybean research, including seed coat color research, material synthesis pathway, identification of transcription factors (TFs), and determination of stress, disease, and insect resistances [18–22]. However, studies on the direct effects of sulfur on soybean transcriptome are limited, moreover, compared with nitrogen and phosphate nutrition, plant sulfur nutrition has not been extensively studied [23]. Therefore, this study aimed to examine the effects of sulfur concentrations on soybean transcriptome. Additionally, differentially expressed genes (DEGs) were annotated using the gene ontology (GO) and Kyoto Encyclopedia of Genes and Genomes (KEGG) databases.
2.1 Materials and Experimental Procedures
Two major soybean varieties were used for this study: Heinong 84 (HN84) and Dongnong Dou 252 (DND252). The protein content of variety DND252 was about 42.47%, and that of variety HN84 was about 40.82%. The difference in protein content between the two varieties was 1.65%, which also led to a certain difference in amino acid content between the two varieties. The study was conducted at the Northeast Agricultural University, China. Soybean plants were grown in plastic barrels (28 cm in diameter and 30 cm in height) for easy observation and sampling. A screen was laid at the bottom of the barrels; thereafter, the barrels were filled with pure sand. High-quality seeds of the two varieties (HN84 and DND252) were selected for planting, and ensure the survival of four seedlings in each pot.
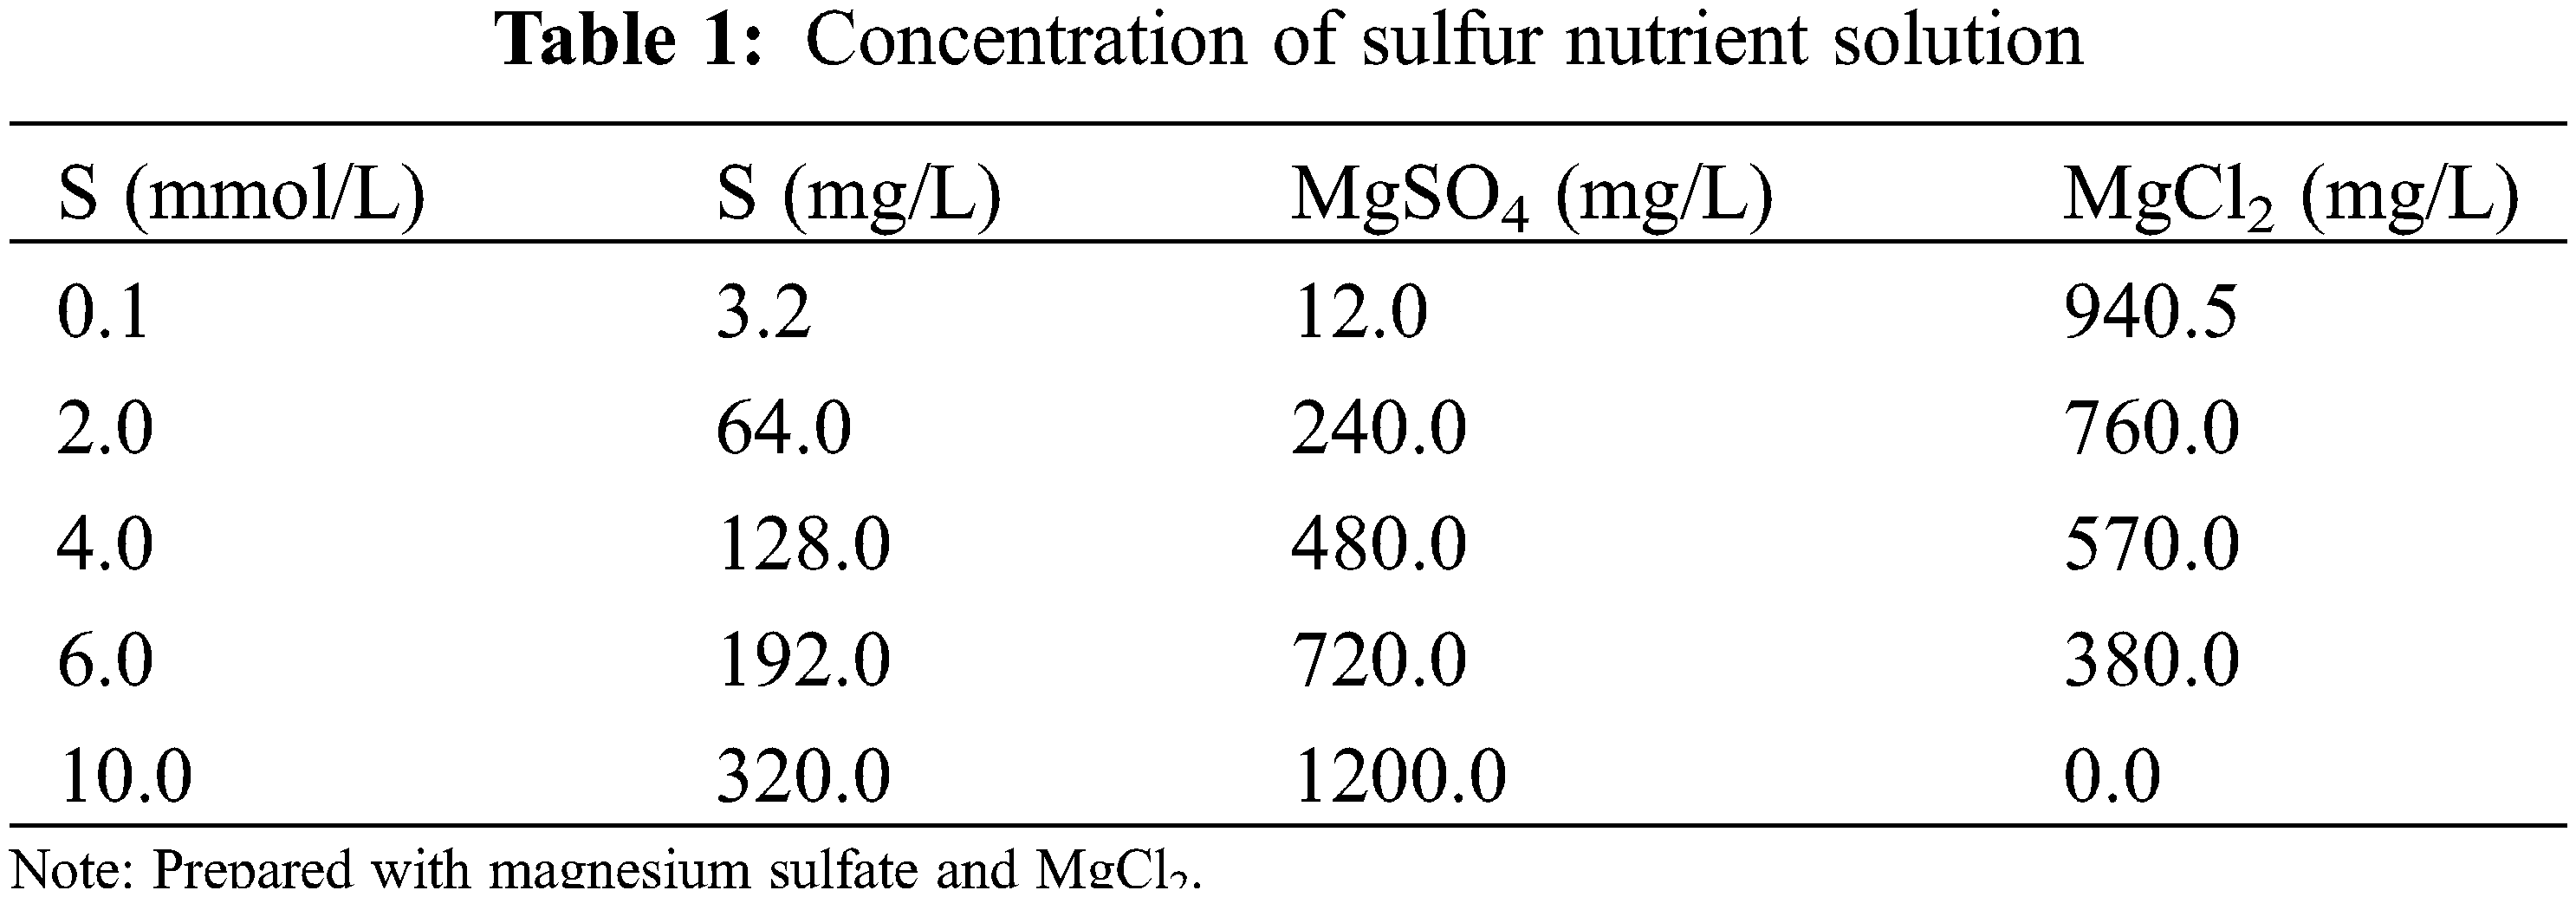
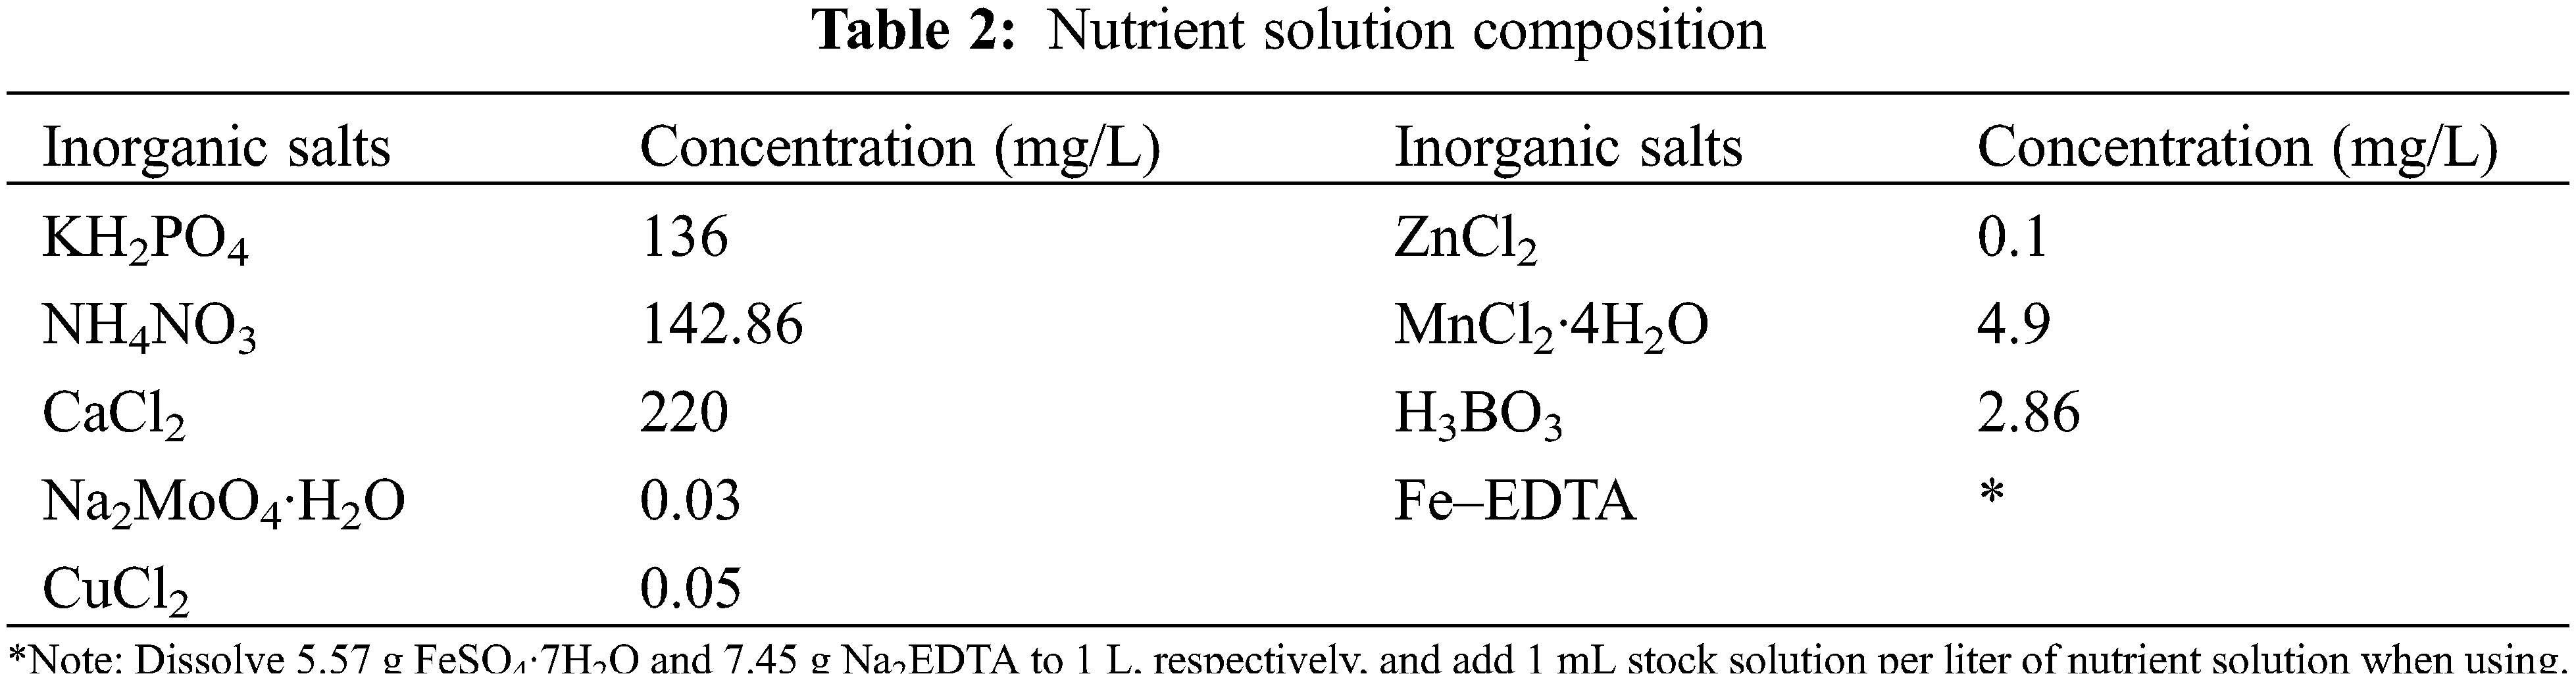
The effect of sulfur on the transcriptome of soybean was examined using three sulfur treatments: low (0.1 mmol/L), normal (2.0 mmol/L; control), and high sulfur (10.0 mmol/L) levels. Soybean plants of both varieties were exposed to the three sulfur levels (HN84_01, HN84_2, HN84_10, DND252_01, DND252_2, and DND252_10). However, the effect of sulfur concentrations on yield was examined using five sulfur treatments: 0.1, 2.0, 4.0, 6.0, and 10.0 mmol/L (Table 1). The different sulfur concentrations were prepared using MgSO4 and MgCl2; these were dissolved in distilled water to prepare the sulfur nutrient solution. The plants were watered with 500 mL distilled water before the uncurling of the leaves; however, after the leaves uncurled, the sulfur solution and mineral nutrient solution were applied to the seedlings in the morning and night, respectively, during the study period. The composition of the mineral nutrient solution is shown in Table 2. Fe-EDTA solution was prepared by dissolving 7.45 g Na2EDTA and 5.57 g FeSO4·7H2O in 900 mL distilled water, which was then adjusted to 1 L. Each liter of nutrient solution required 1 mL Fe-EDTA solution. The nutrient solution was prepared with distilled water, and 500 mL were supplied to the plants daily. Distilled water was added once every three days to prevent salt accumulation in the soil. Each treatment was biologically repeated three times, and the mixed samples of the second and third leaves were selected. Sulfur content = concentration × biomass.
At the 4th vegetative (V4) stage, two to three-leaf blades were collected in the morning. The samples were washed with sterile deionized water, frozen in liquid nitrogen, and stored at −80°C in an ultra-low temperature refrigerator (Haier, China) for further analysis.
The leaf tissues were ground using a TissueLyser (Qiagen) and homogenized. Total RNA was extracted from the homogenized tissue using RNeasy Plant Mini Kit (Qiagen, China), following the manufacturer’s instructions. Contaminating DNA was removed using a TURBO DNA-free kit (Ambion), and RNA was purified and concentrated using RNeasy MiniElute Cleanup Kit (Qiagen). RNA quality and quantity of the 18 samples were determined using a NanoDrop ND-1000 Spectrophotometer (Thermo Fisher Scientific) and a QIAxcel Advanced System (Qiagen).
Total RNA was subjected to mRNA enrichment and rRNA removal. For mRNA enrichment, mRNAs with polyA tails were purified using oligo-dT magnetic beads. For rRNA removal, rRNA was hybridized with DNA probes, RNaseH selective digestion of DNA/RNA hybrid strands was performed, and the DNA probes were then digested with DNase I, yielding the required RNA after purification. Shearing buffer was used to fragment the obtained RNA, the reverse strand was obtained with random N6 primers, and two strands of cDNA were then synthesized to form double-stranded DNA. The synthesized two-stranded DNA was uncoiled and phosphorylated at the 5’ end to form a sticky end with an “A” overhang, which was then ligated with a protruding “T” at the 3’ end. PCR amplification was performed using specific primers. PCR products were converted into single strands, and a single strand of cyclic DNA library was obtained using a bridge primer, and sequencing was performed on the DNBSEQ-T7 machine (The Beijing Genomics Institute, China).
To obtain high-quality reads, the raw reads were first preprocessed to remove paired-end (PE) reads with ambiguous base calls (N) > 5%, long homopolymer regions (>10 bp), and low-quality bases (bases with quality score < 10) using Trimmomatic 0.39 (The Usadel Lab, USA). Huada independent research and development filtering software SOAPnuke (The Beijing Genomics Institute, China) was used for statistics. The clean reads were saved in the FASTQ format and aligned against NCBI reference genome (GCF_000004515.4_Glycine_max_v2.0) using HISAT [24]. We used StringTie v1.0.4 (Johns Hopkins University, USA) to reconstruct the transcripts of each sample, and then used Cuffmerge to integrate the reconstructed information of all samples. Thereafter, we used Cuffcompare to compare the integrated transcripts with the reference annotation information. DEGseq package in R software [25] was used to detect DEGs between the two varieties under the treatment conditions and to calculate the fold changes for each gene. Genes with fold changes > 2, q values < 0.01, and FDR < 0.01 were defined as DEGs and used for further analysis. Finally, GO function annotation and KEGG pathway enrichment analyses were carried out for the DEGs to identify genes involved in sulfur absorption and metabolism in soybean.
A one-way ANOVA was used to determine the effects of the various sulfur concentrations on soybean yield within each variety. The R software was used to make such ANOVA.
3.1 Effect of Sulfur Concentration on Soybean Yield
The highest yield on the DND252 variety was obtained at a concentration of 2.0 mmol/L (Fig. 1). Similarly, the highest yield on the HN84 variety was obtained at a concentration of 2.0 mmol/L, although this value did not differ from that at 4 mmol/L (Fig. 1). This result was the rationale behind selecting the sulfur concentration of 2.0 mmol/L as the control in the transcriptome experiment.
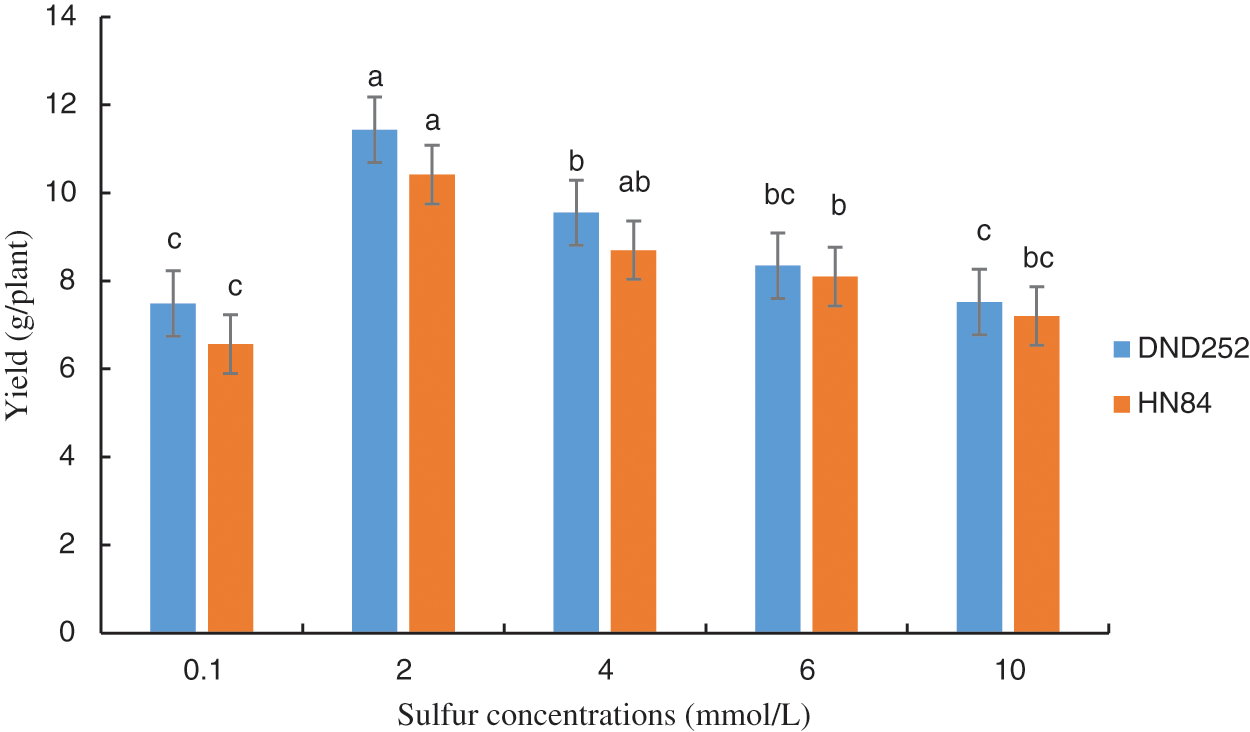
Figure 1: Effect of sulfur concentrations on soybean yield. Note: Each histogram is the mean of n = … Vertical bars are ± 1 S.E. Within each variety, different letters indicate significant differences at P < 0.05
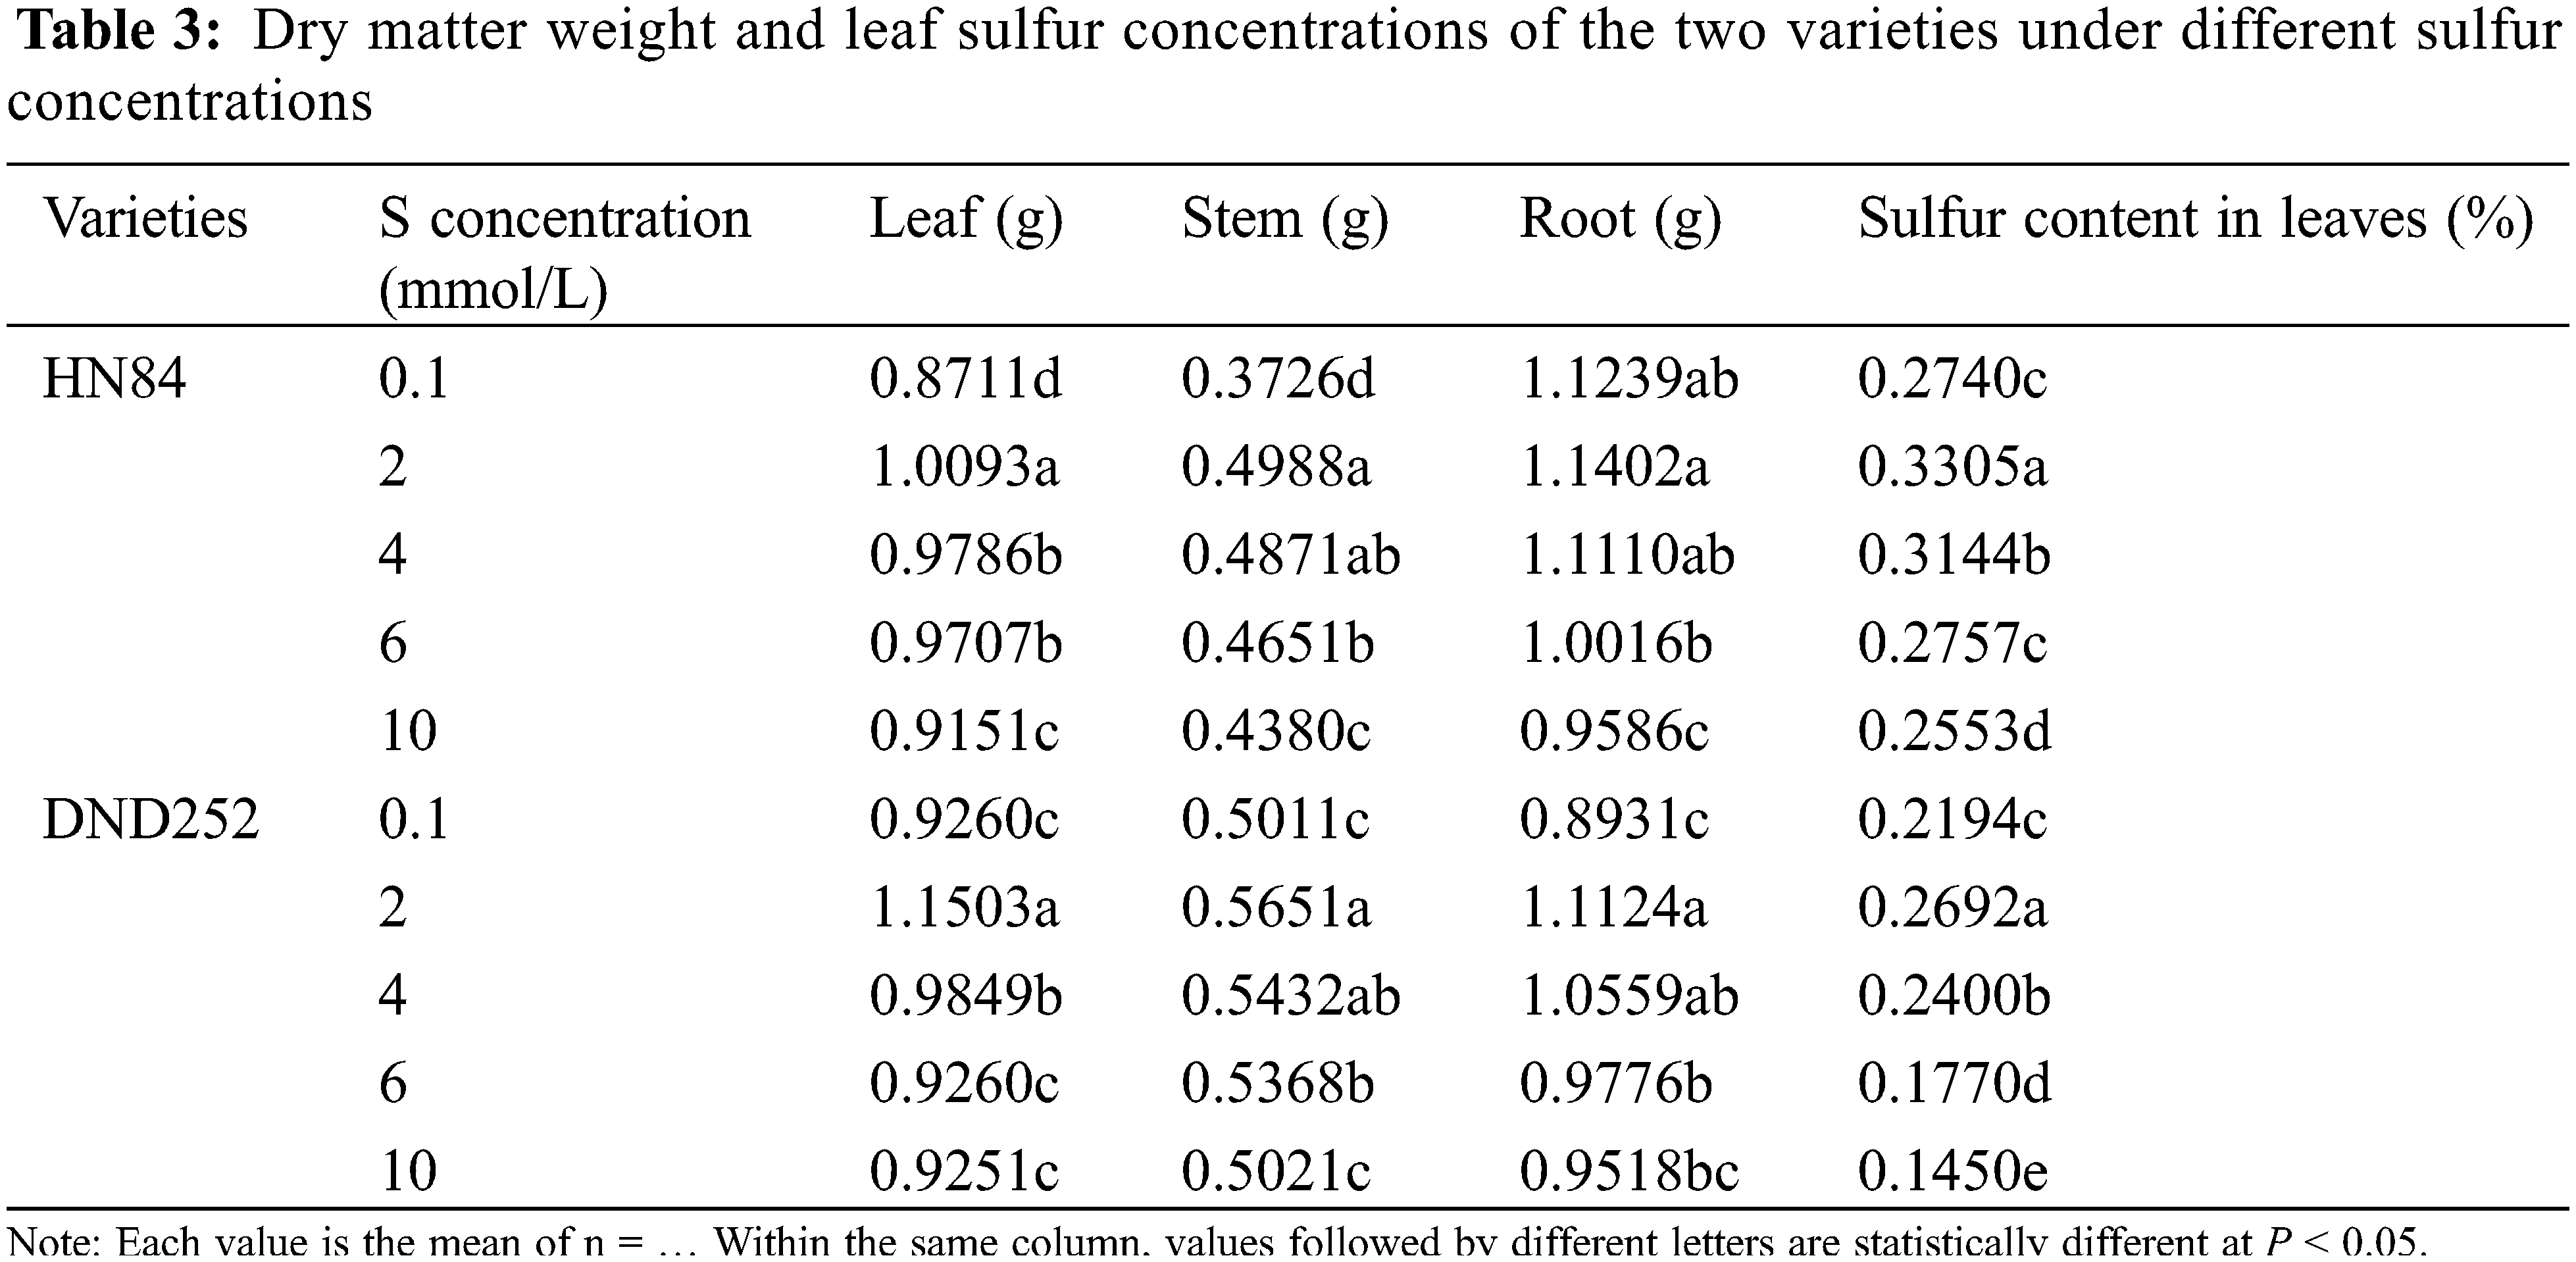
With the increase of sulfur concentration, the leaf sulfur concentrations in the two varieties first increased significantly and then decreased (Table 3). The dry matter weight of different tissues in the two varieties first increased significantly and then decreased, but the root dry weight in HN84. The dry matter weight was greatest under 2 mmol/L sulfur concentration. In the variety HN84, the dry matter weight of leaves and stems were greater under the highest than lowest concentrations, and the dry matter weight of roots was the lowest under the highest than lower sulfur concentrations. In the variety DND252, there was no significant difference in the dry matter weight of leaves, stems and roots between the highest and lowest sulfur concentrations. The results showed that too high or too low sulfur concentrations affected the dry matter weight of aboveground and underground plant parts depending on the soybean variety.
3.2 Statistics and Gene Expression
Eighteen cDNA libraries were established in the experiment, with a total of four treatment groups (HN84_01, HN84_10, DND252_01, DND252_10) and two control groups (HN84_2 and DND252_2). Each test sample had an average of 6.58 Gb data. The original library sequencing data (raw reads) ranged from 49.08 to 52.59 million regions. Through a series of processing, 789.69 million clean data were obtained, with HN84_01, HN84_2, HN84_10, DND252_01, DND252_2, and DND252_10 having an average of 43.26, 44.93, 44.31, 43.57, 43.33, and 43.84 million clean data, respectively. HISAT software was used to compare clean data with reference genomes (GCF_000004515.4_Glycine_max_v2.0 from NCBI, sent by US DOE Joint Genome Institute, https://www.ncbi.nlm.nih.gov/assembly/GCF_000004515.4) of cultivated soybeans. The average ratio of reference genes and clean data for the two varieties were 82.17% and 92.12%, respectively.
We used Bowtie2 to align the clean reads sequences, and then RSEM was used to calculate gene expression levels for each sample. There were 41,063 genes expressed in HN84 under low sulfur conditions, 40,991 under normal sulfur conditions, and 41,858 under high sulfur conditions. However, only 38,418 genes were expressed under low, normal, and high sulfur conditions, 962 genes were specifically expressed under low sulfur conditions, 696 genes were specifically expressed under normal conditions, and 1,096 genes were specifically expressed under high sulfur conditions (Fig. 2A). A total of 42,035 genes were expressed in DND252 under low sulfur conditions, 40,610 under normal conditions, and 41,151 under high sulfur conditions. However, only 38,754 genes were expressed under low, normal, and high sulfur conditions, with 1,238 genes specifically expressed under low sulfur conditions, 506 genes specifically expressed under normal conditions, and 758 genes specifically expressed under high sulfur conditions (Fig. 2B). The difference in gene expression may represent the differences between varieties.
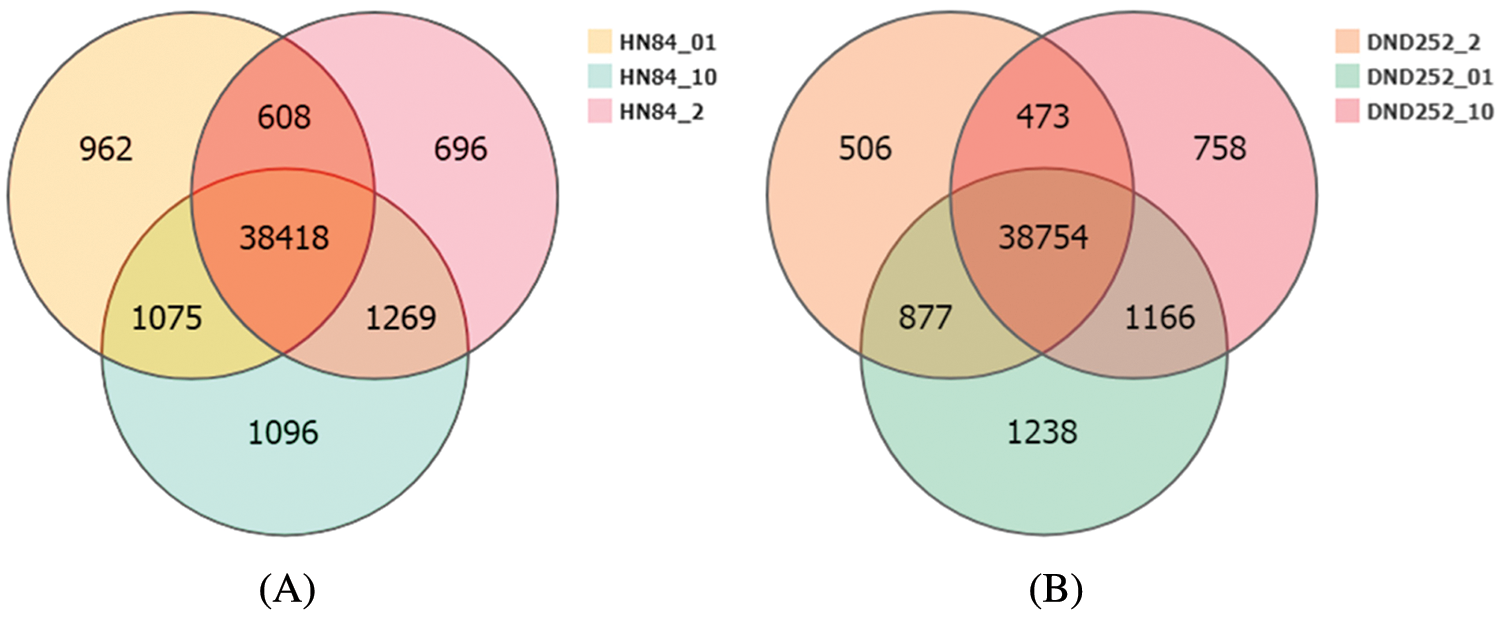
Figure 2: (A) HN84 gene expression Venn map (B) DND252 gene expression Venn map
According to the gene expression level of each sample, DEGseq was used to examine the DEGs between four comparison groups: DND252-2 vs. DND252-01, DND252-2 vs. DND252-10, HN84-2 vs. HN84-01, and HN84-2 vs. HN84-10 groups. A total of 34,278 DEGs were identified among the groups, including 7,867 (6,772 up- and 1,095 downregulated), 8,078 (5,992 up- and 2,086 downregulated), 13,517 (9,855 up- and 3,662 downregulated), and 4,816 (3,536 up- and 1,280 downregulated) in DND252-2 vs. DND252-01, DND252-2 vs. DND252-10, HN84-2 vs. HN84-01, and HN84-2 vs. HN84-10 comparison groups, respectively, which were presented in volcano plots (Fig. 3). Fig. 4 showed the Venn map of DEGs in the four comparison groups. A total of 3,936 DEGs were common to the DND252-01 and DND252-10 groups, and 3,120 were common to the HN84-01 and HN84-10 groups. Overall, 963 DEGs were common to the four groups (DND252-01, DND252-10, HN84-01, and HN84-10), which may be related to the change in sulfur concentration.
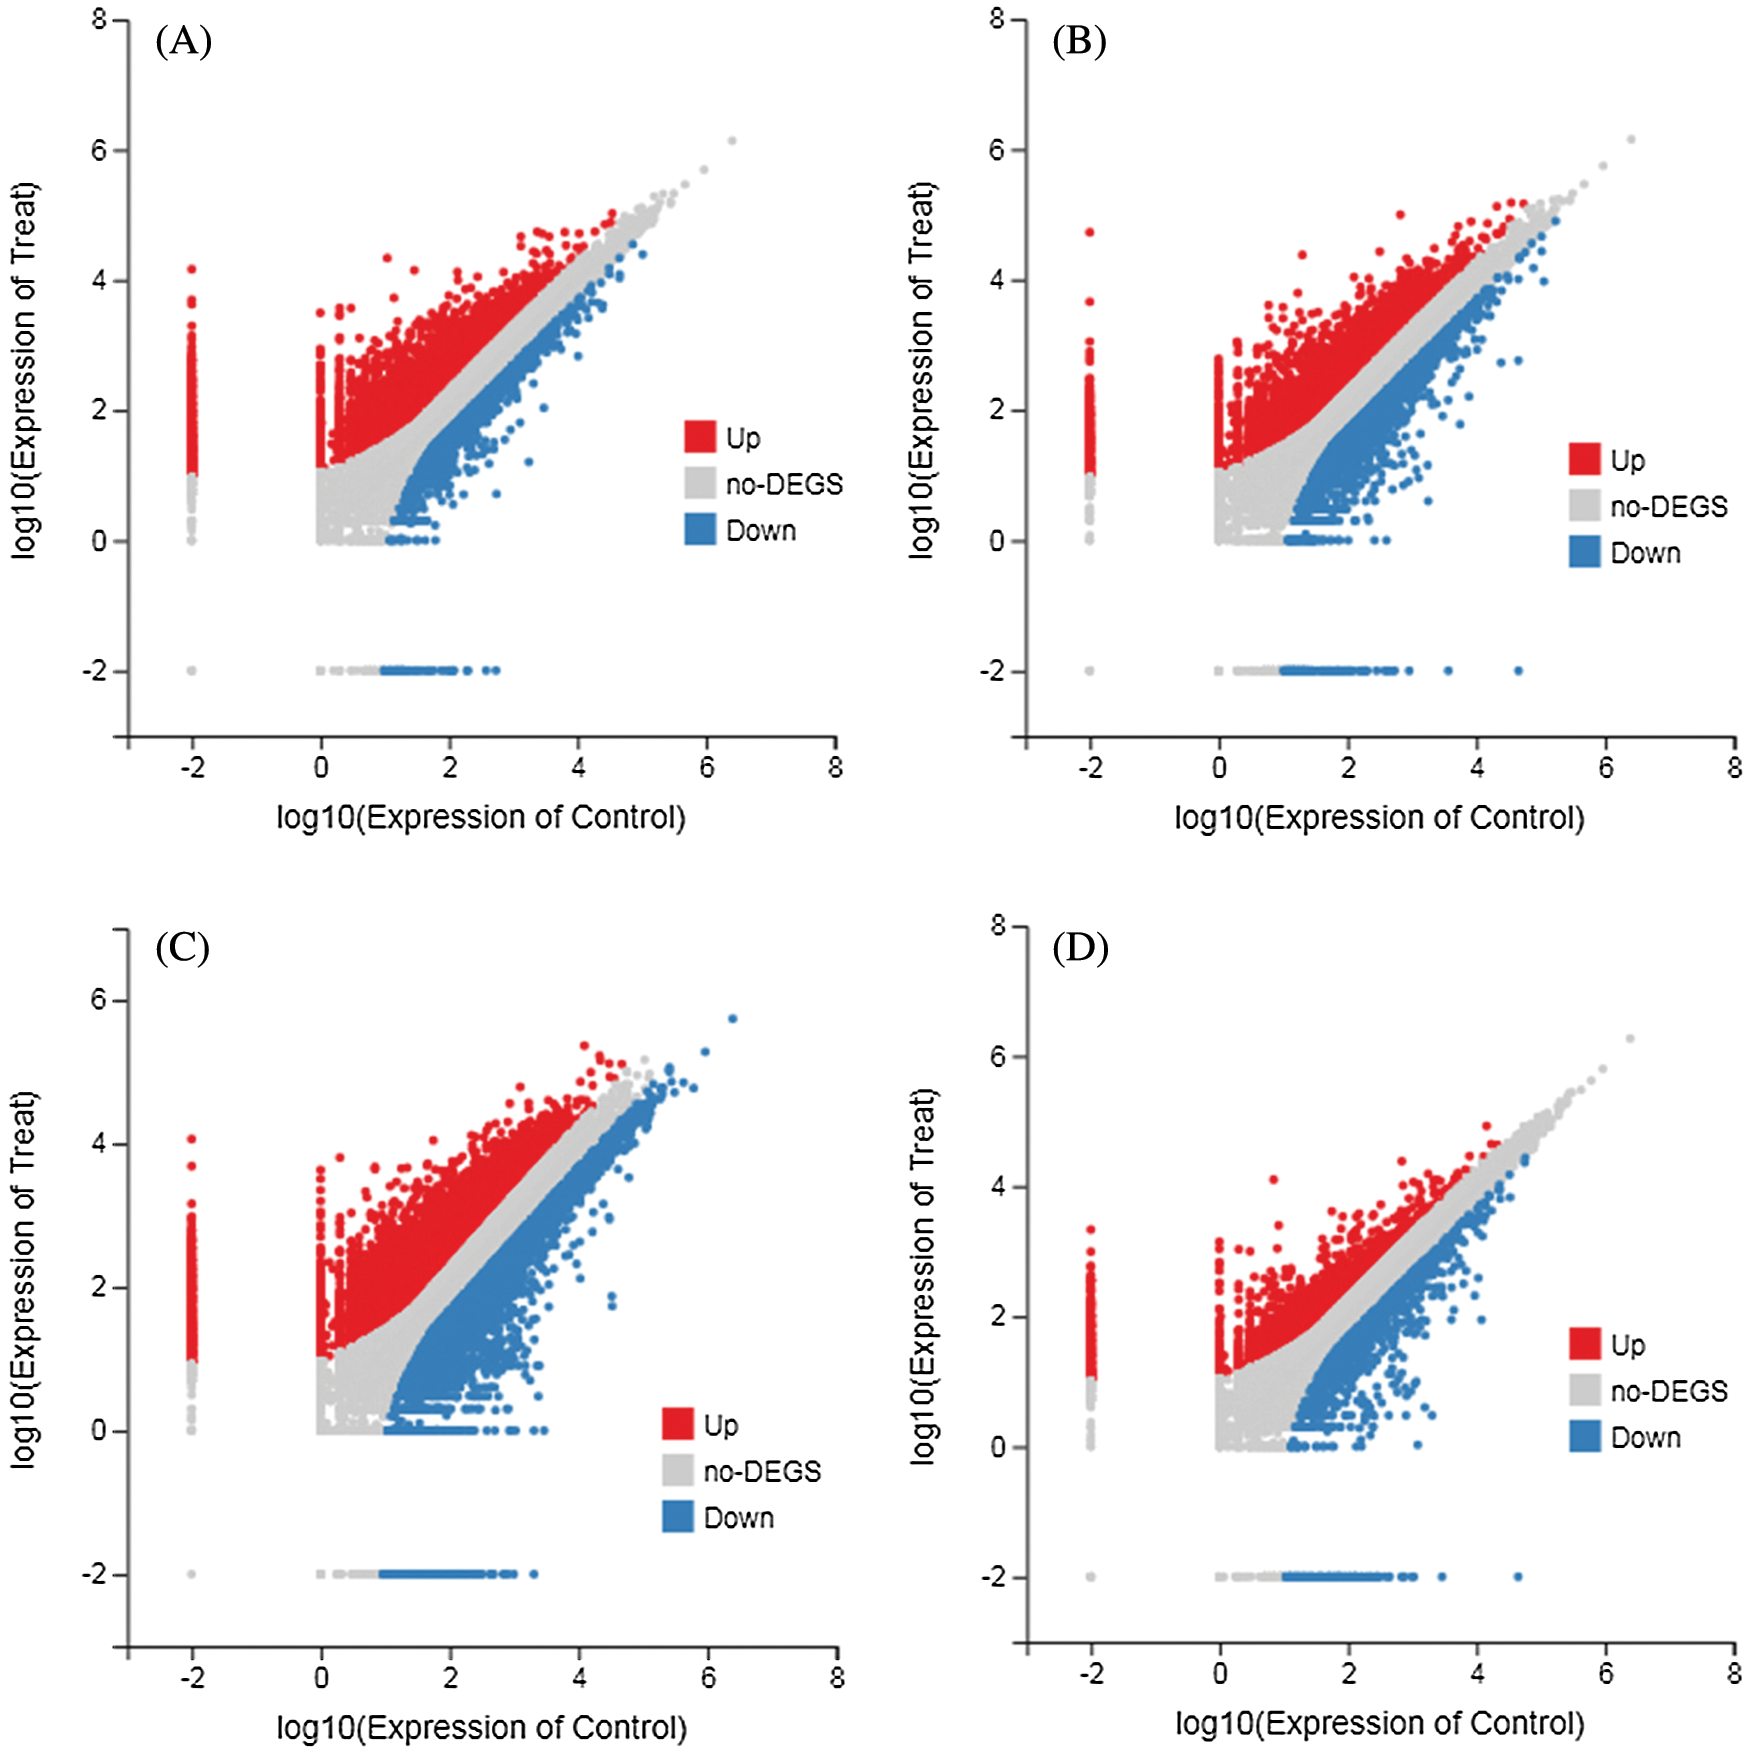
Figure 3: Volcano plots of DEGs. (A) DND252-2 vs. DND252-01 (B) DND252-2 vs. DND252-10 (C) HN84-2 vs. HN84-01 (D) HN84-2 vs. HN84-10. Note: Red represents up-regulation, blue represents down-regulation, and gray represents non-DEGs
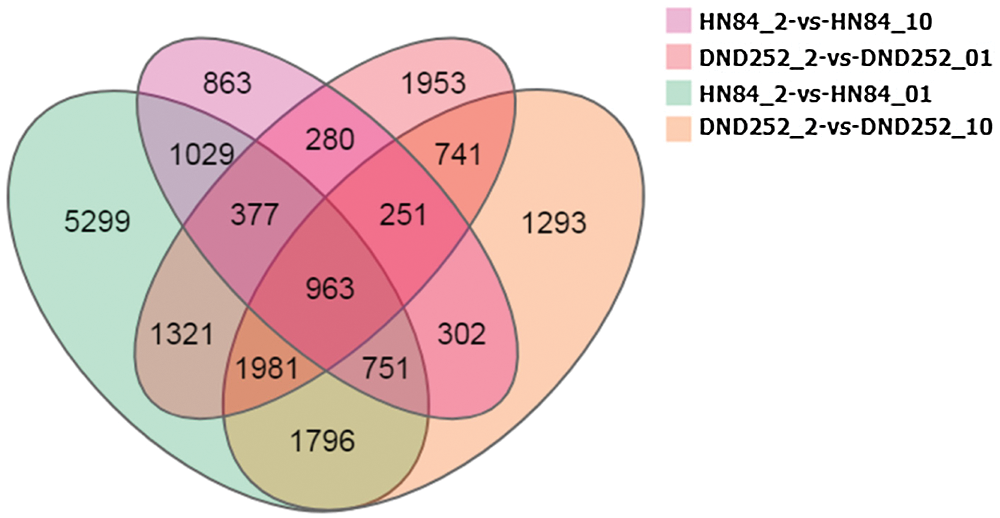
Figure 4: Venn map of DEGs in all groups
3.4 Gene Ontology Enrichment of DEGs
GO terms can be classified into three categories: biological processes (BP), molecular functions (MF), and cellular components (CC). GO enrichment analysis showed that in DND252, the number of DEGs increased with the increase of sulfur concentrations, but the increase was not obvious (Figs. 5A and 5B). In the biological process (GO: 0008150) classification, the number of DEG enriched in the cellular process (GO: 0009987), metabolic process (GO: 0008152), biological regulation (GO: 0065007) and response to stimulus (GO: 0050896) were significantly higher than those in the other classifications. In the cellular component (GO: 0005575) classification, cell part (GO: 0044464) and super-resolution complex (GO: 0099080) were the least classified genes. In the molecular function (GO: 0003874) classification, binding (GO: 0005488) and catalytic activity (GO: 0003824) enriched more genes.
Figs. 5C and 5D showed the GO analysis of variety HN84 at different sulfur concentrations. In the biological process classification, the number of DEG enriched in cellular processes (GO: 0009987), metabolic processes (GO: 0008152), biological regulation (GO: 0065007) and response to stimulus (GO: 0050896) which were significantly greater than that in other classifications. In cellular components, the supramolecular complex (GO: 0099080) and symplast (GO: 0055044) were the least classified genes. In the molecular function classification, binding (GO: 0005488) and catalytic activity (GO: 0003824) enriched more genes.
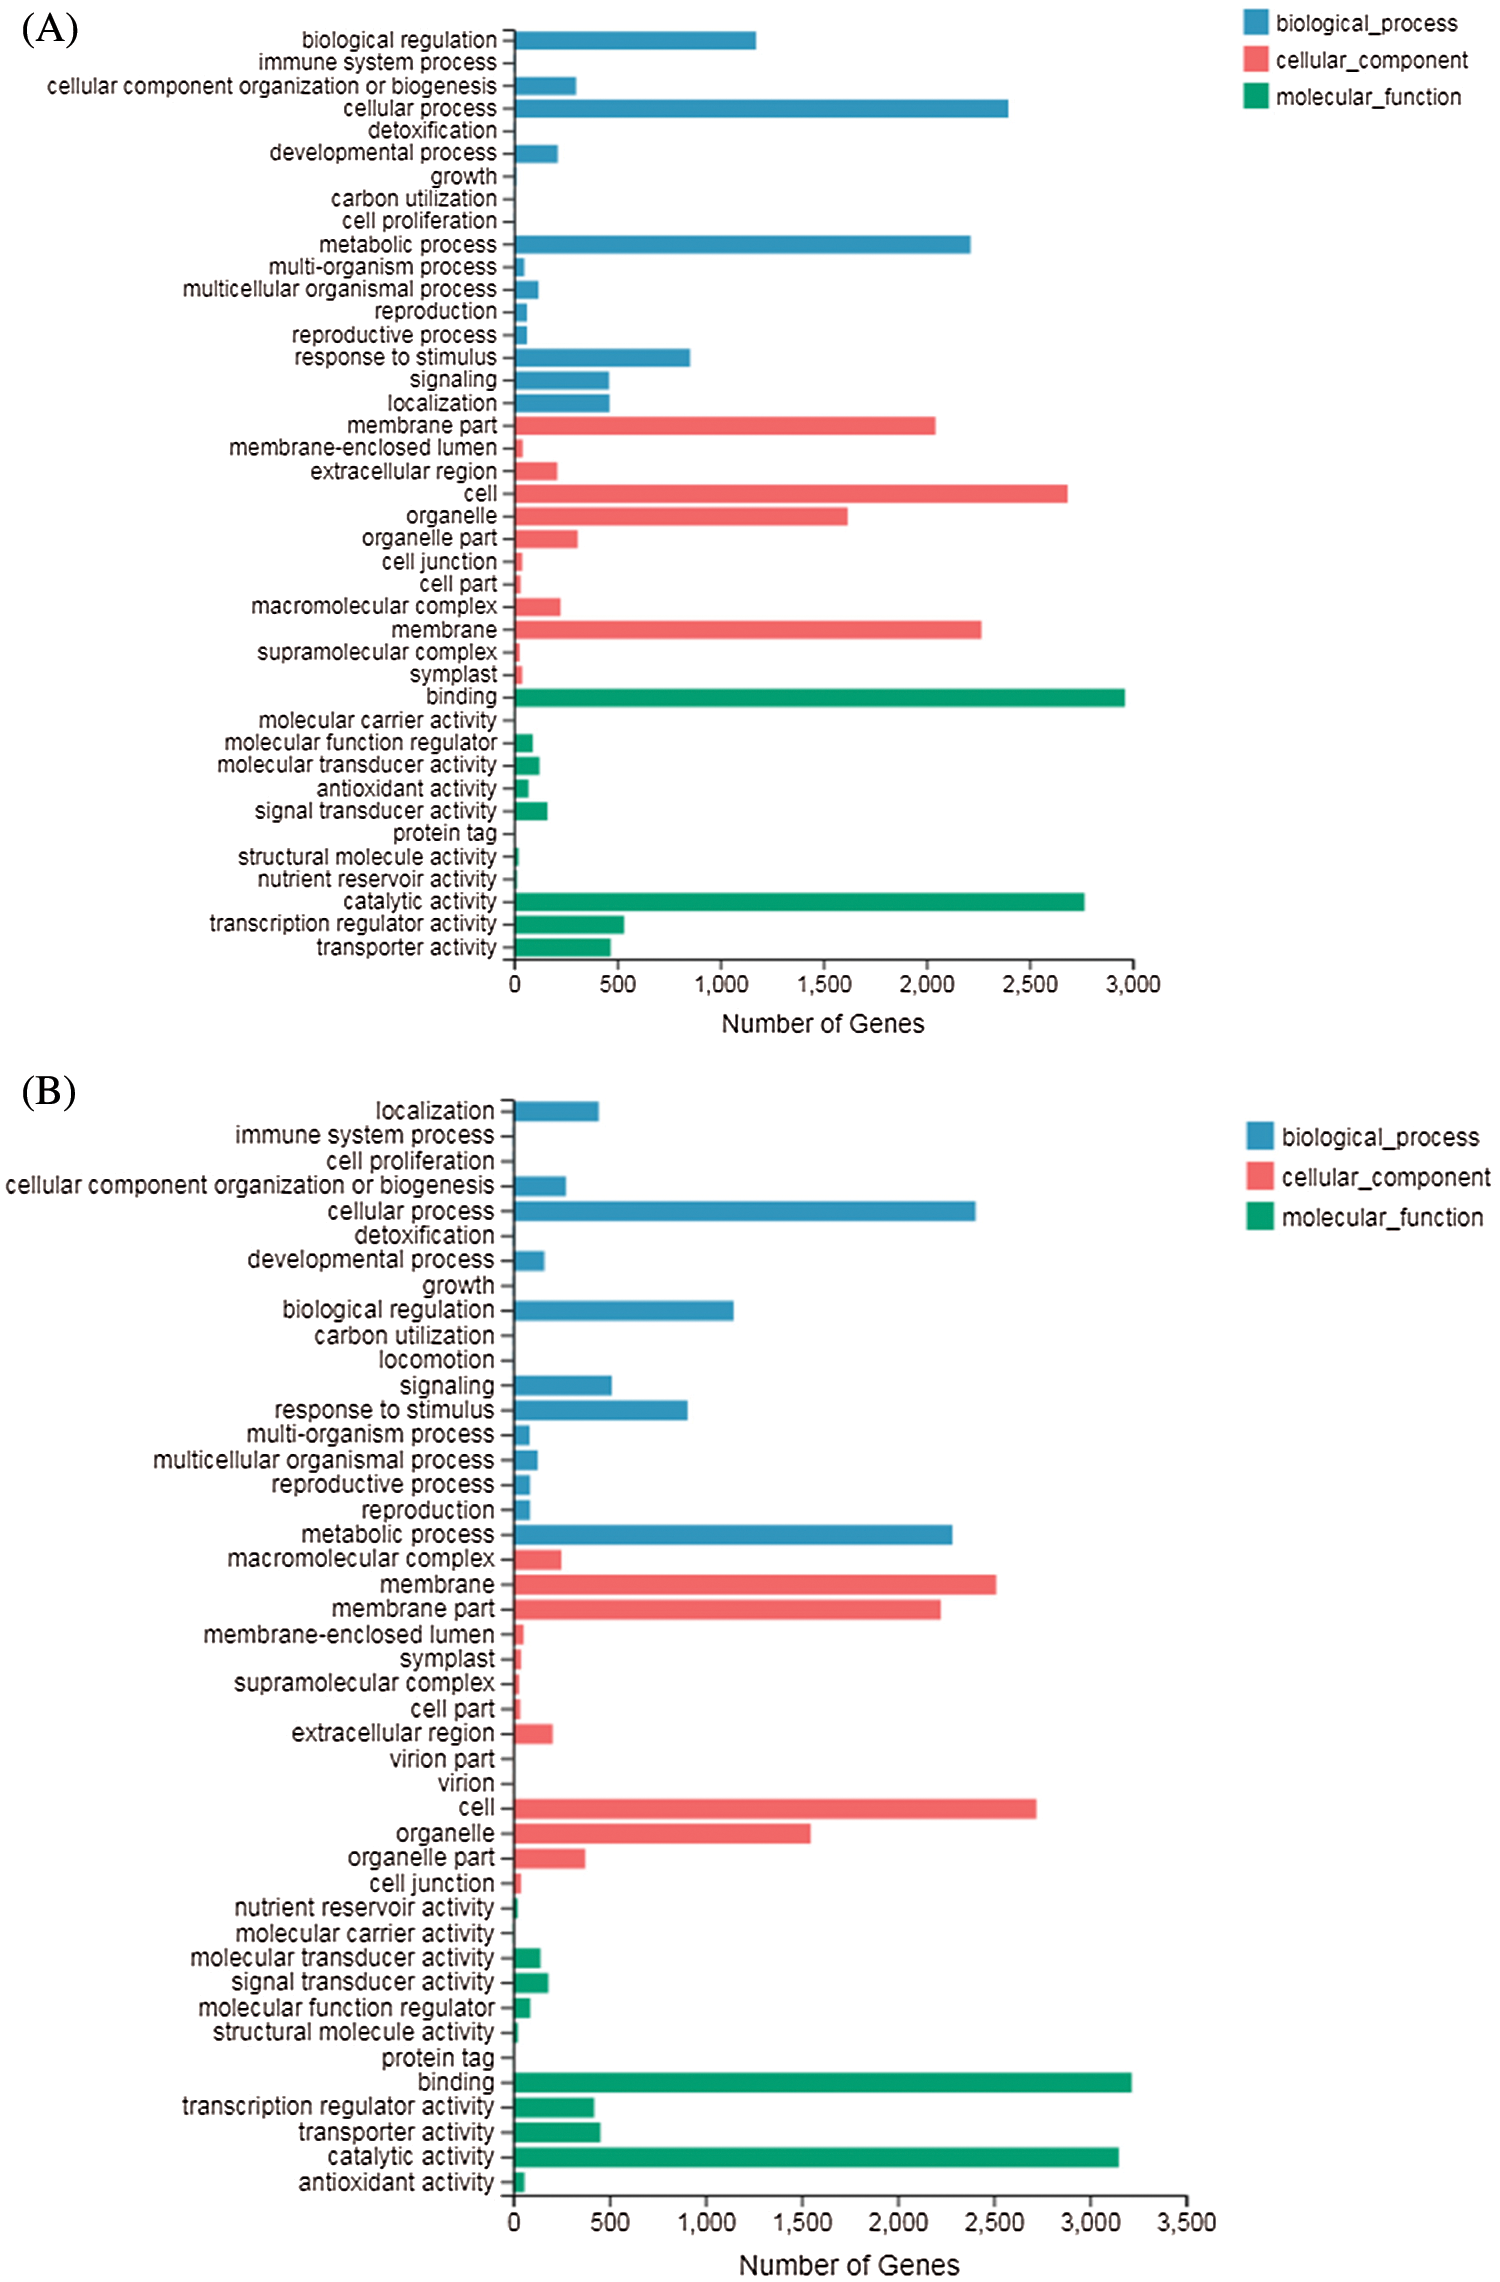
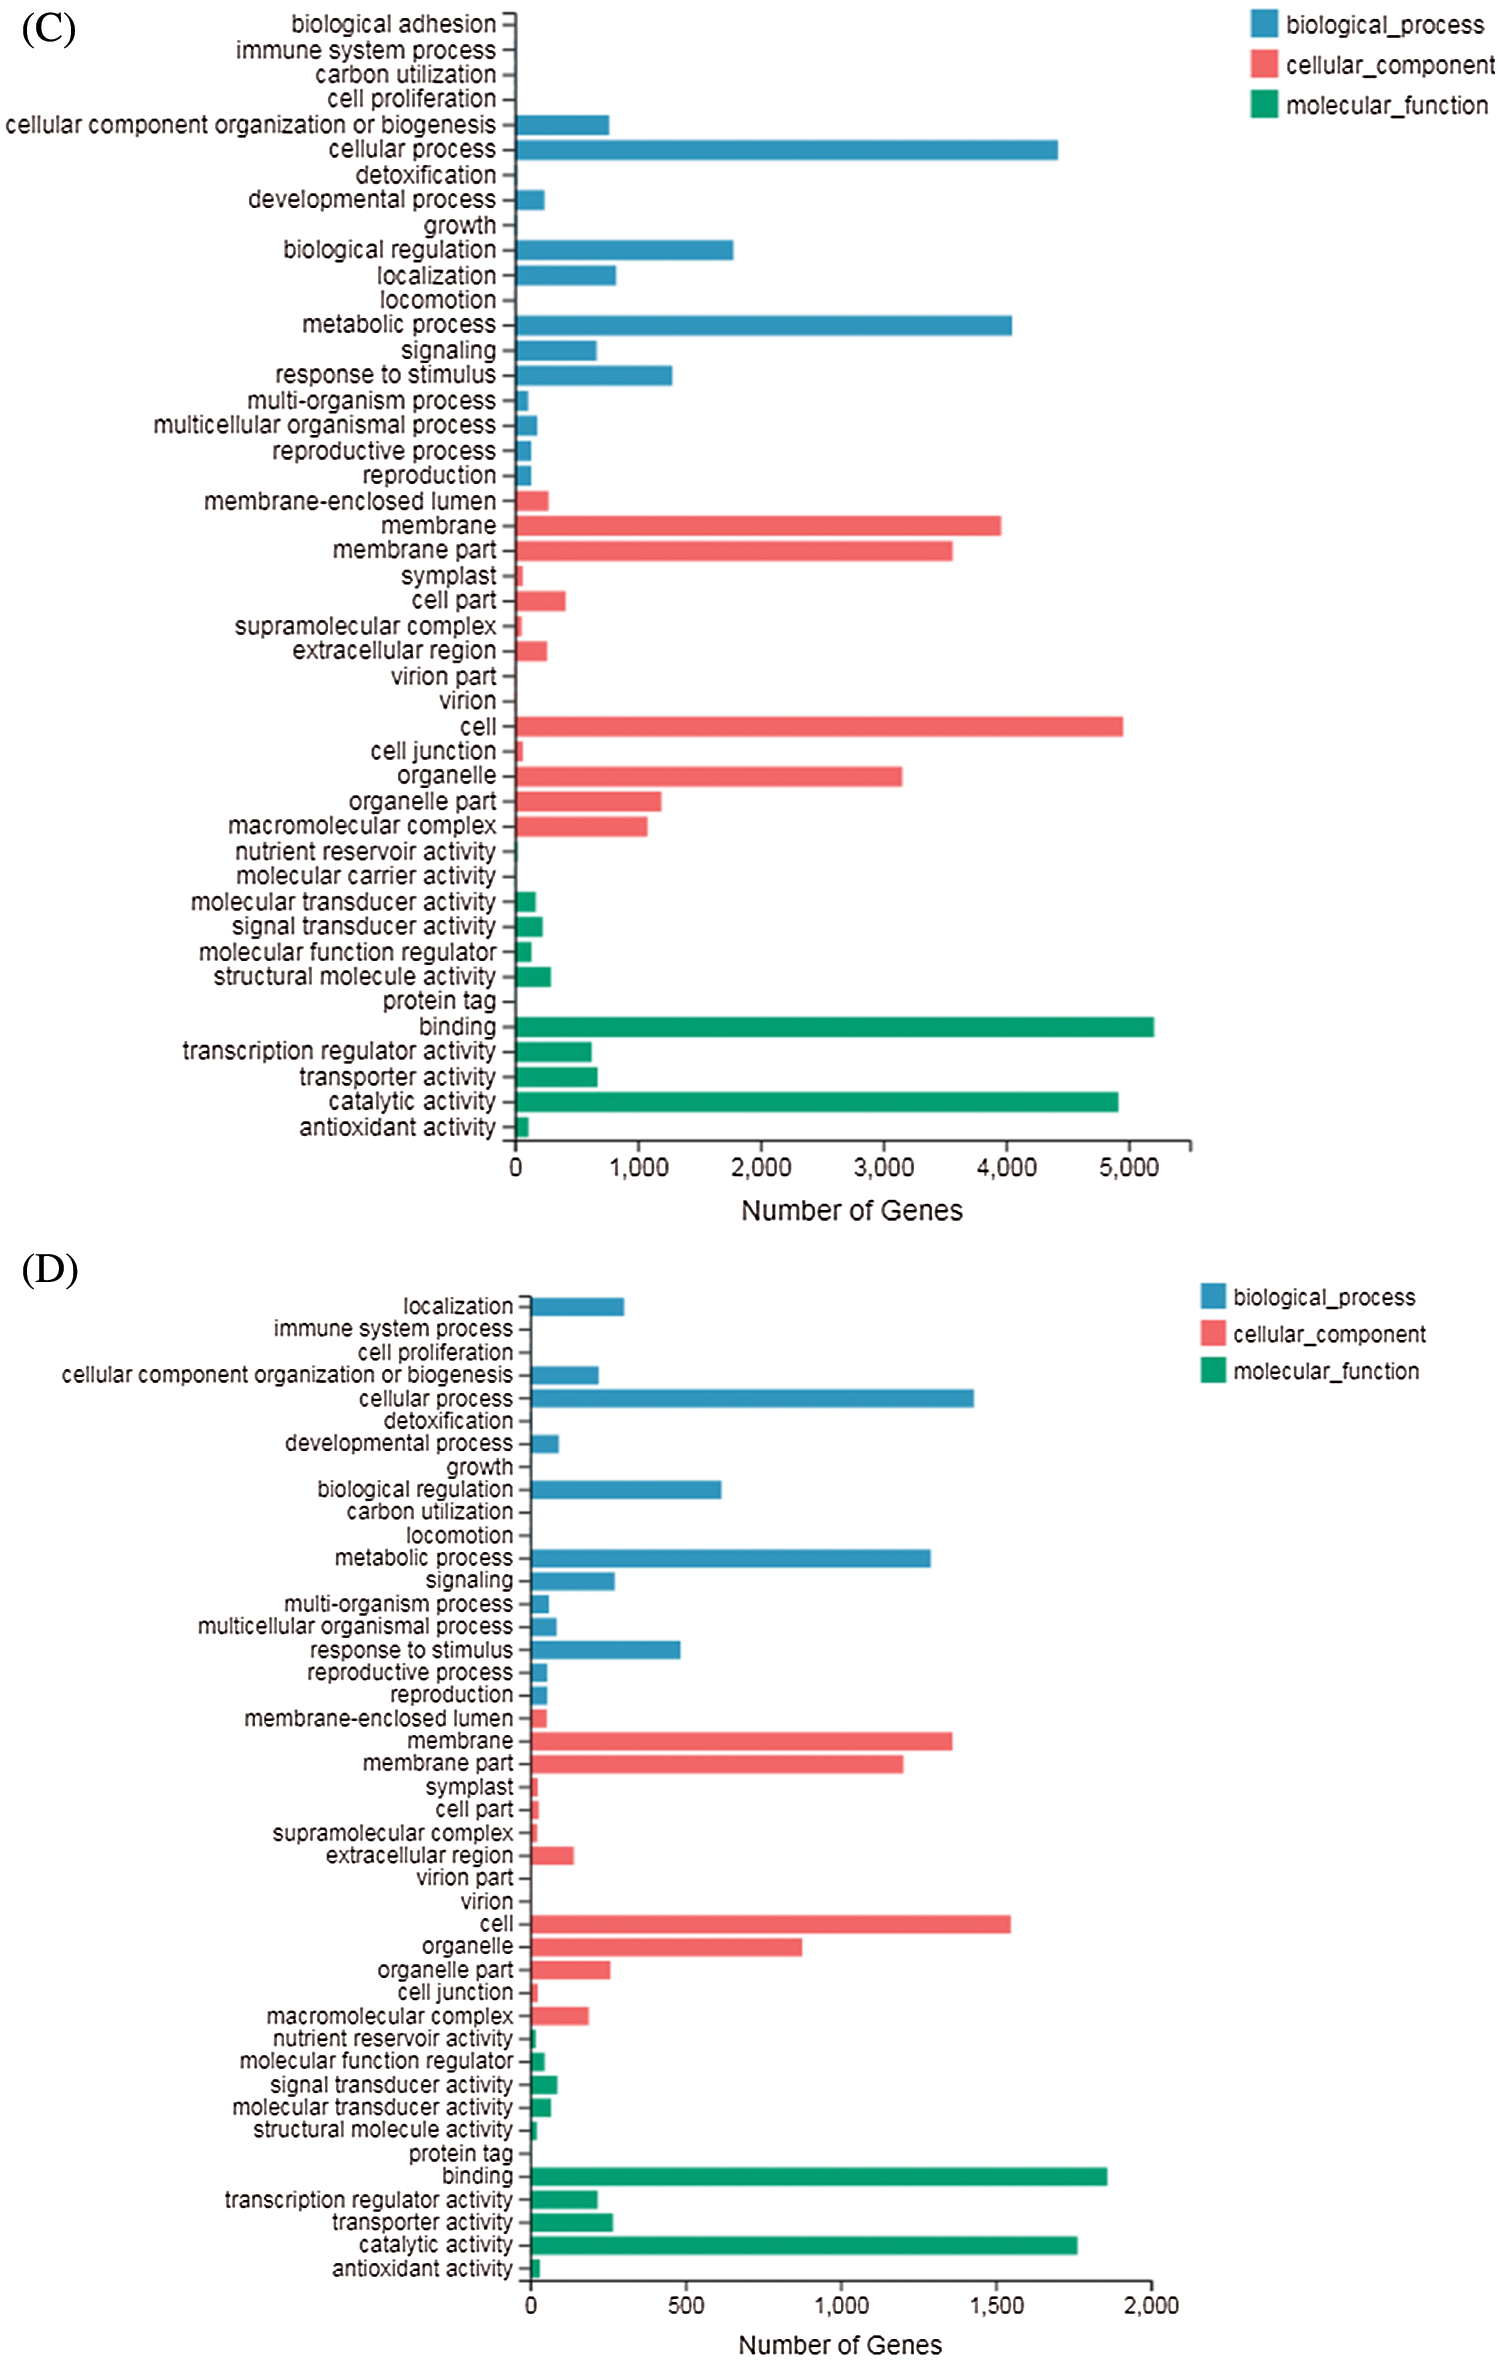
Figure 5: GO classification of DEGs identified in the treatments (A) DND252-2 vs. DND252-01 (B) DND252-2 vs. DND252-10 (C) HN84-2 vs. HN84-01 (D) HN84-2 vs. HN84-10
3.5 Kyoto Encyclopedia of Genes and Genomes (KEGG) Pathway Analysis
The KEGG metabolic pathway classifies genes into seven pathways: cellular processes, environmental information processing, genetic information processing, human disease (animals only), metabolism, organismal systems, and drug development. The KEGG enrichment showed that DEGs responding to sulfur concentrations involved a large number of pathways (Fig. 6). Similar to GO enrichment, the three most significantly enriched pathways in DND252 were Plant-pathogen interaction, MAPK signaling pathway-plant and Plant hormone signal transduction. With the increase of sulfur concentration, the number of DEGs increased slightly. At the same time, some amino acid metabolic pathways were enriched, such as Valine, leucine and isoleucine degradation and beta-Alanine metabolism. In HN84, the three pathways with the most significant enrichment at low sulfur concentrations were MAPK signaling pathway-plant, Plant-pathogen interaction and Photosynthesis-antenna proteins. With the increase of sulfur concentrations, the number of DEGs related to photosynthesis decreased, and the number of DEGs enriched in secondary metabolite biosynthesis pathways such as Isoflavonoid biosynthesis, and Flavonoid biosynthesis decreased. MAPK signaling pathway-plant, Plant-pathogen interaction and Isoflavonoid biosynthesis were the three most significant pathways under high sulfur concentrations.
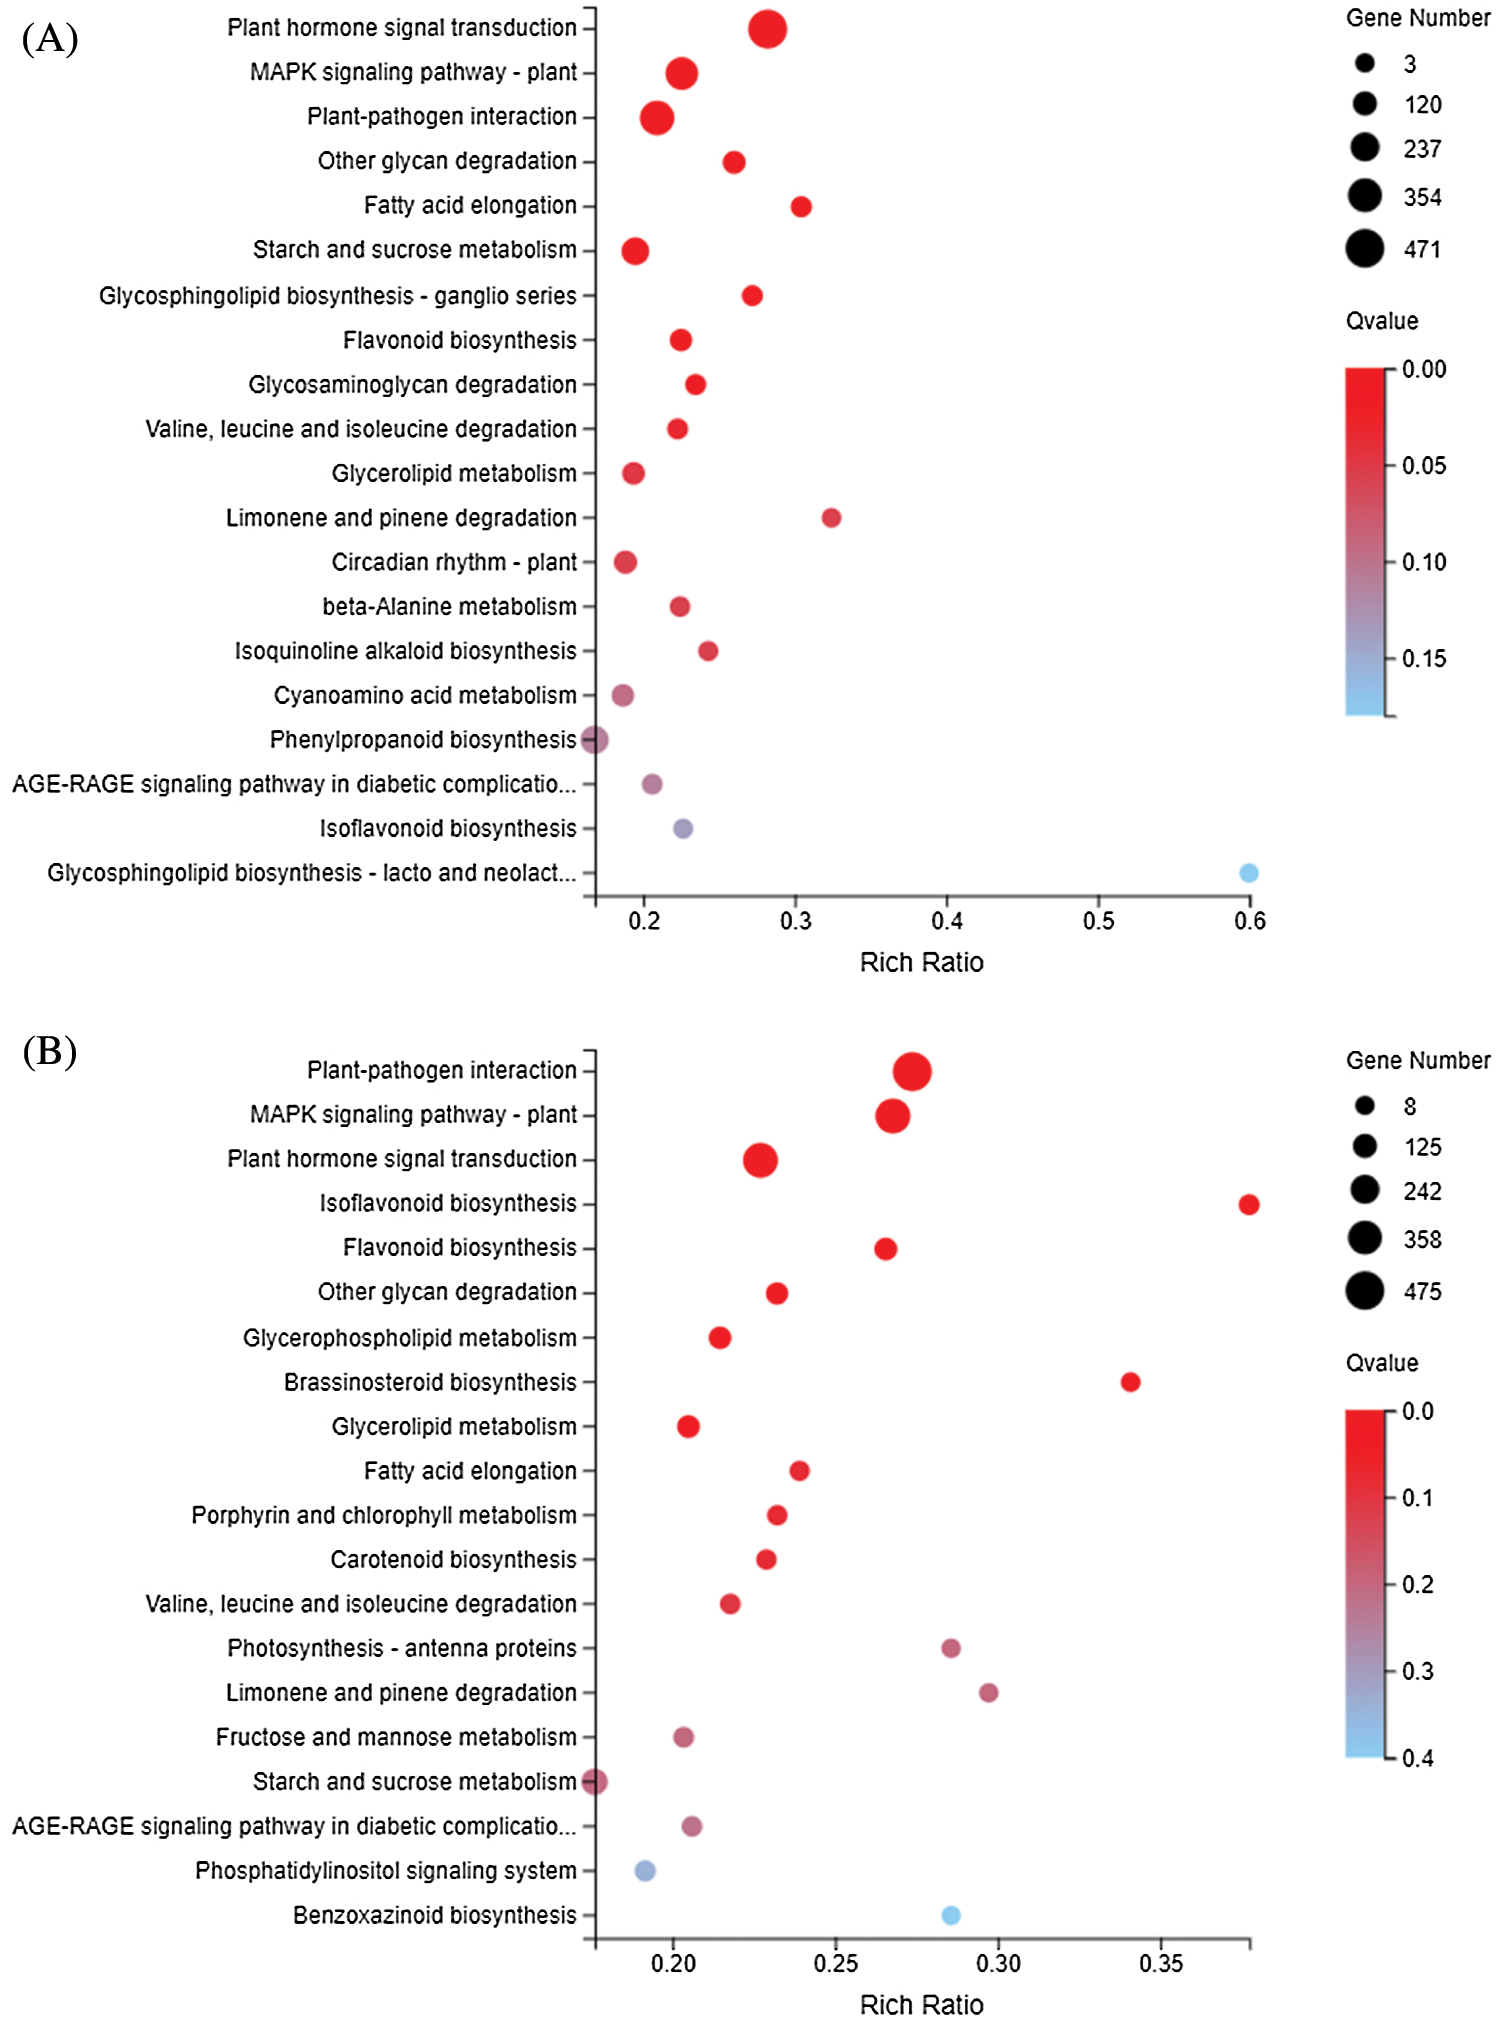
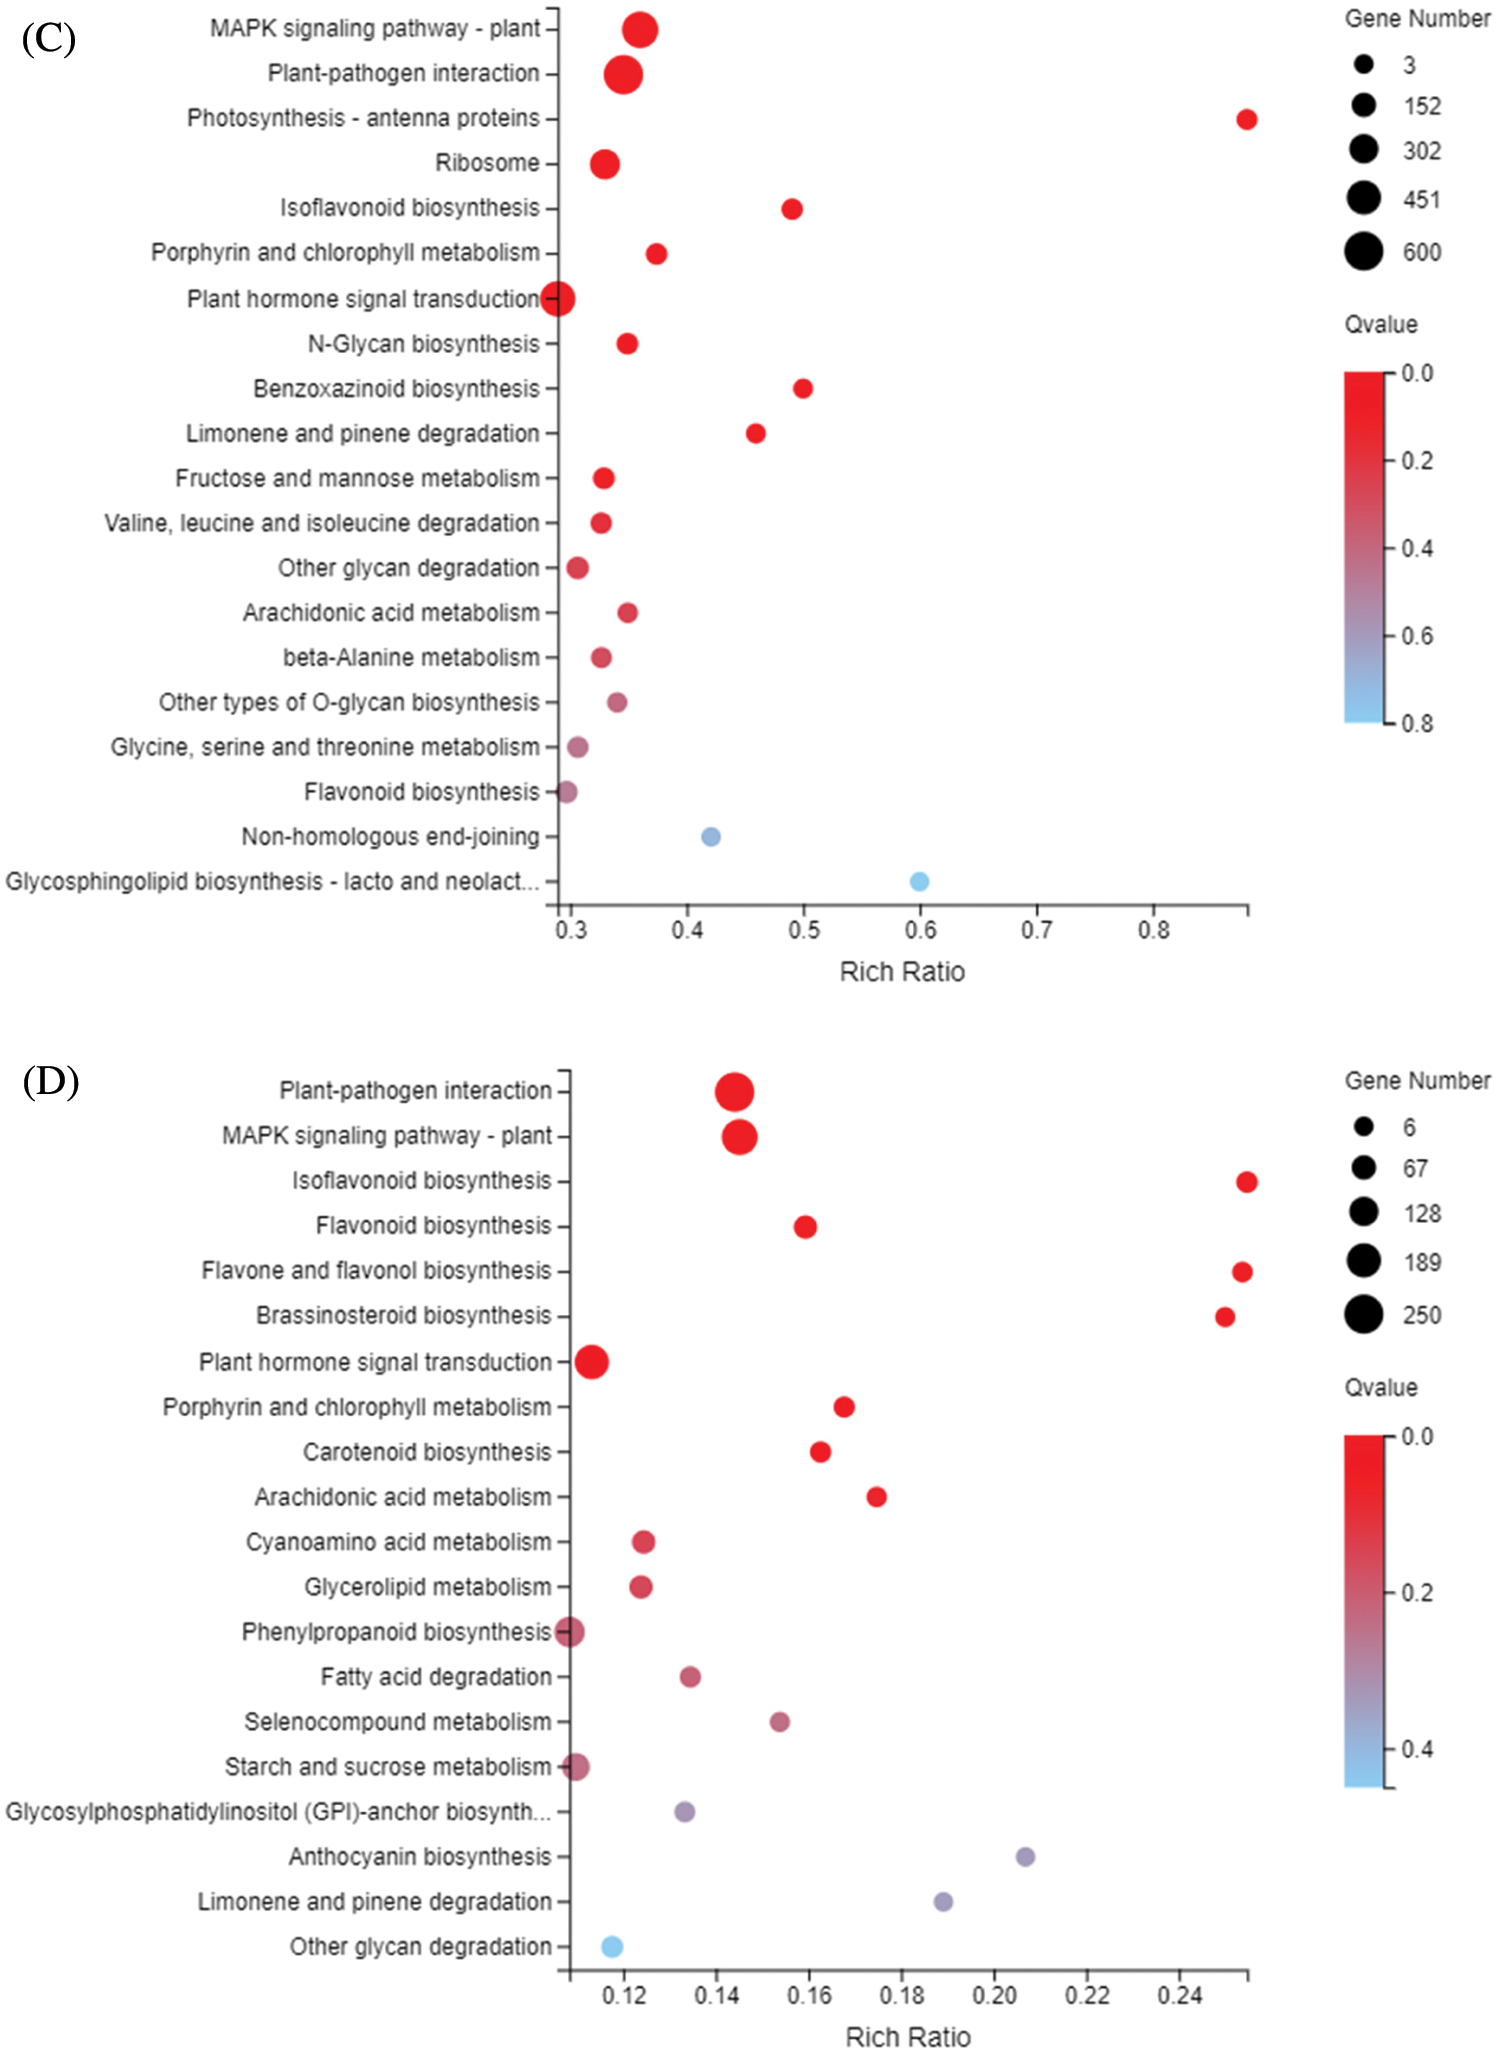
Figure 6: KEGG enrichment of DEGs identified in the treatments (A) DND252-2 vs. DND252-01 (B) DND252-2 vs. DND252-10 (C) HN84-2 vs. HN84-01 (D) HN84-2 vs. HN84-10. Note: The size of the bubble indicates the number of genes annotated to a KEGG pathway. The color represents the enriched Qvalue value. The red color represents the smaller Qvalue
3.6 Sulfur-Related Amino Acids Metabolic Processes
DEGs related to sulfur amino acids and their derivatives. In DND252, 26 DEGs were found when sulfur was at low concentrations: 4 DEGs were involved in S-adenosylmethionine biosynthetic process, 5 DEGs were involved in S-adenosylmethionine metabolic process, 1 DEG was involved in S-adenosyl-L-methionine transmembrane transporter activity, 3 DEGs were involved in methionine metabolic process, 2 DEGs were involved in methionine biosynthetic process, 1 DEG was involved in S-adenosylmethionine cycle, 3 DEGs were involved in cysteine metabolic process, 2 DEGs were involved in cysteine biosynthetic process from serine, 2 DEGs were involved in cysteine biosynthetic process, 1 DEG was involved in S-adenosylhomocysteine catabolic process, 1 DEG was involved in L-cysteine metabolic process, and 1 DEG was involved in S-adenosylhomocysteine metabolic process. When sulfur was at high concentrations, 18 DEGs were found: 1 DEG was involved in S-adenosyl-L-methionine transmembrane transporter activity, 4 DEGs were involved in methionine metabolic process, 3 DEGs were involved in S-adenosylmethionine biosynthetic process, 3 DEGs were involved in methionine biosynthetic process, 1 DEG was involved in S-adenosylmethionine cycle, 4 DEGs were involved in S-adenosylmethionine metabolic process, 1 DEG was involved in L-methionine biosynthetic process, 1 DEG was involved in ‘de novo’ L-methionine biosynthetic process.
Forty three DEGs were found in HN84 at low sulfur concentrations: 1 DEG was involved in S-adenosyl-L-methionine transmembrane transporter activity, 3 DEGs were involved in methionine metabolic process, 4 DEGs were involved in S-adenosylmethionine biosynthetic process, 2 DEGs were involved in methionine biosynthetic process, 1 DEG was involved in peptidyl-methionine modification, 1 DEG was involved in S-adenosylmethionine cycle, 5 DEGs were involved in S-adenosylmethionine metabolic process, 8 DEGs were involved in cysteine metabolic process, 6 DEGs were involved in cysteine biosynthetic process from serine, 1 DEG was involved in peptidyl-cysteine modification, 7 DEGs were involved in cysteine biosynthetic process, 1 DEG was involved in S-adenosylhomocysteine catabolic process, 1 DEG was involved in L-cysteine metabolic process, 1 DEG was involved in S-adenosylhomocysteine metabolic process, and 1 DEG was involved in peptidyl-cysteine modification to L-cysteine persulfide. Fifteen DEGs were found at high sulfur concentrations: 1 DEG was involved in ‘de novo’ L-methionine biosynthetic process, 1 DEG was involved in methionine metabolic process, 1 DEG was involved in methionine biosynthetic process, 1 DEG was involved in L-methionine biosynthetic process, 1 DEG was involved in cysteine biosynthetic process via cystathionine, 1 DEG was involved in peptidyl-cysteine modification to L-cysteine persulfide, 3 DEGs were involved in cysteine metabolic process, 1 DEG was involved in cysteine biosynthetic process from serine, 1 DEG was involved in peptidyl-cysteine modification, 3 DEGs were involved in cysteine biosynthetic process, and 1 DEG was involved in homocysteine metabolic process.
DEGs related to sulfur-containing amino acid metabolic enzymes. In DND252, 86 DEGs were found when sulfur was at low concentrations: 4 DEGs were involved in methionine adenosyltransferase activity, 1 DEG was involved in adenosylmethionine decarboxylase activity, 1 DEG was involved in methionine-tRNA synthetase activity, 26 DEGs were involved in S-adenosylmethionine-dependent methyltransferase activity, 5 DEGs were involved in cysteine-type endopeptidase inhibitor activity, 2 DEGs were involved in cysteine synthase activity, 12 DEGs were involved in cysteine-type endopeptidase activity, 20 DEGs were involved in cysteine-type peptidase activity, 5 DEGs were involved in protein-cysteine S-palmitoyltransferase activity, 5 DEGs were involved in protein-cysteine S-acyltransferase activity, 1 DEG was involved in betaine-homocysteine S-methyltransferase activity, 2 DEGs were involved in regulation of cysteine-type endopeptidase activity, and 2 DEGs were involved in negative regulation of cysteine-type endopeptidase activity. When sulfur was at high concentrations, 69 DEGs were found: 1 DEG was involved in adenosylmethionine decarboxylase activity, 3 DEGs were involved in methionine adenosyltransferase activity, 1 DEG was involved in methionine-tRNA ligase activity, 1 DEG was involved in peptide-methionine (S)-S-oxide reductase activity, 31 DEGs were involved in S-adenosylmethionine-dependent methyltransferase activity, 1 DEG was involved in peptide-methionine (S)-S-oxide reductase activity, and 31 DEGs were involved in S-adenosylmethionine-dependent methyltransferase activity.
In HN84, 198 DEGs were found when sulfur was at low concentrations: 1 DEG was involved in adenosylmethionine decarboxylase activity, 4 DEGs were involved in methionine adenosyltransferase activity, 2 DEGs were involved in methionine-tRNA ligase activity, 2 DEGs were involved in peptide-methionine (S)-S-oxide reductase activity, 84 DEGs were involved in S-adenosylmethionine-dependent methyltransferase activity, 1 DEG was involved in peptide-methionine (R)-S-oxide reductase activity. 5 DEGs were involved in cysteine synthase activity, 13 DEGs were involved in cysteine-type endopeptidase activity, 2 DEGs were involved in calcium-dependent cysteine-type endopeptidase activity, 1 DEG was involved in glutamate-cysteine ligase activity, 6 DEGs were involved in cysteine-type endopeptidase inhibitor activity, 41 DEG was involved in cysteine-type peptidase activity, 1 DEG was involved in enzyme active site formation via cysteine modification to L-cysteine persulfide, 13 DEGs were involved in protein-cysteine S-palmitoyltransferase activity, 13 DEGs were involved in protein-cysteine S-acyltransferase activity, 1 DEG was involved in betaine-homocysteine S-methyltransferase activity, 4 DEGs were involved in regulation of cysteine-type endopeptidase activity, and 4 DEGs were involved in negative regulation of cysteine-type endopeptidase activity. When sulfur was at high concentrations, 59 DEGs were found: 2 DEGs were involved in methionine-tRNA ligase activity, 24 DEGs were involved in S-adenosylmethionine-dependent methyltransferase activity, 1 DEG was involved in enzyme active site formation via cysteine modification to L-cysteine persulfide, 5 DEGs were involved in cysteine-type endopeptidase activity, 1 DEG was involved in calcium-dependent cysteine-type endopeptidase activity, 2 DEGs were involved in cysteine-type endopeptidase inhibitor activity, 16 DEGs were involved in cysteine-type peptidase activity, 4 DEGs were involved in protein-cysteine S-palmitoyltransferase activity, and 4 DEGs were involved in protein-cysteine S-acyltransferase activity. These DEGs were directly affected by sulfur concentrations.
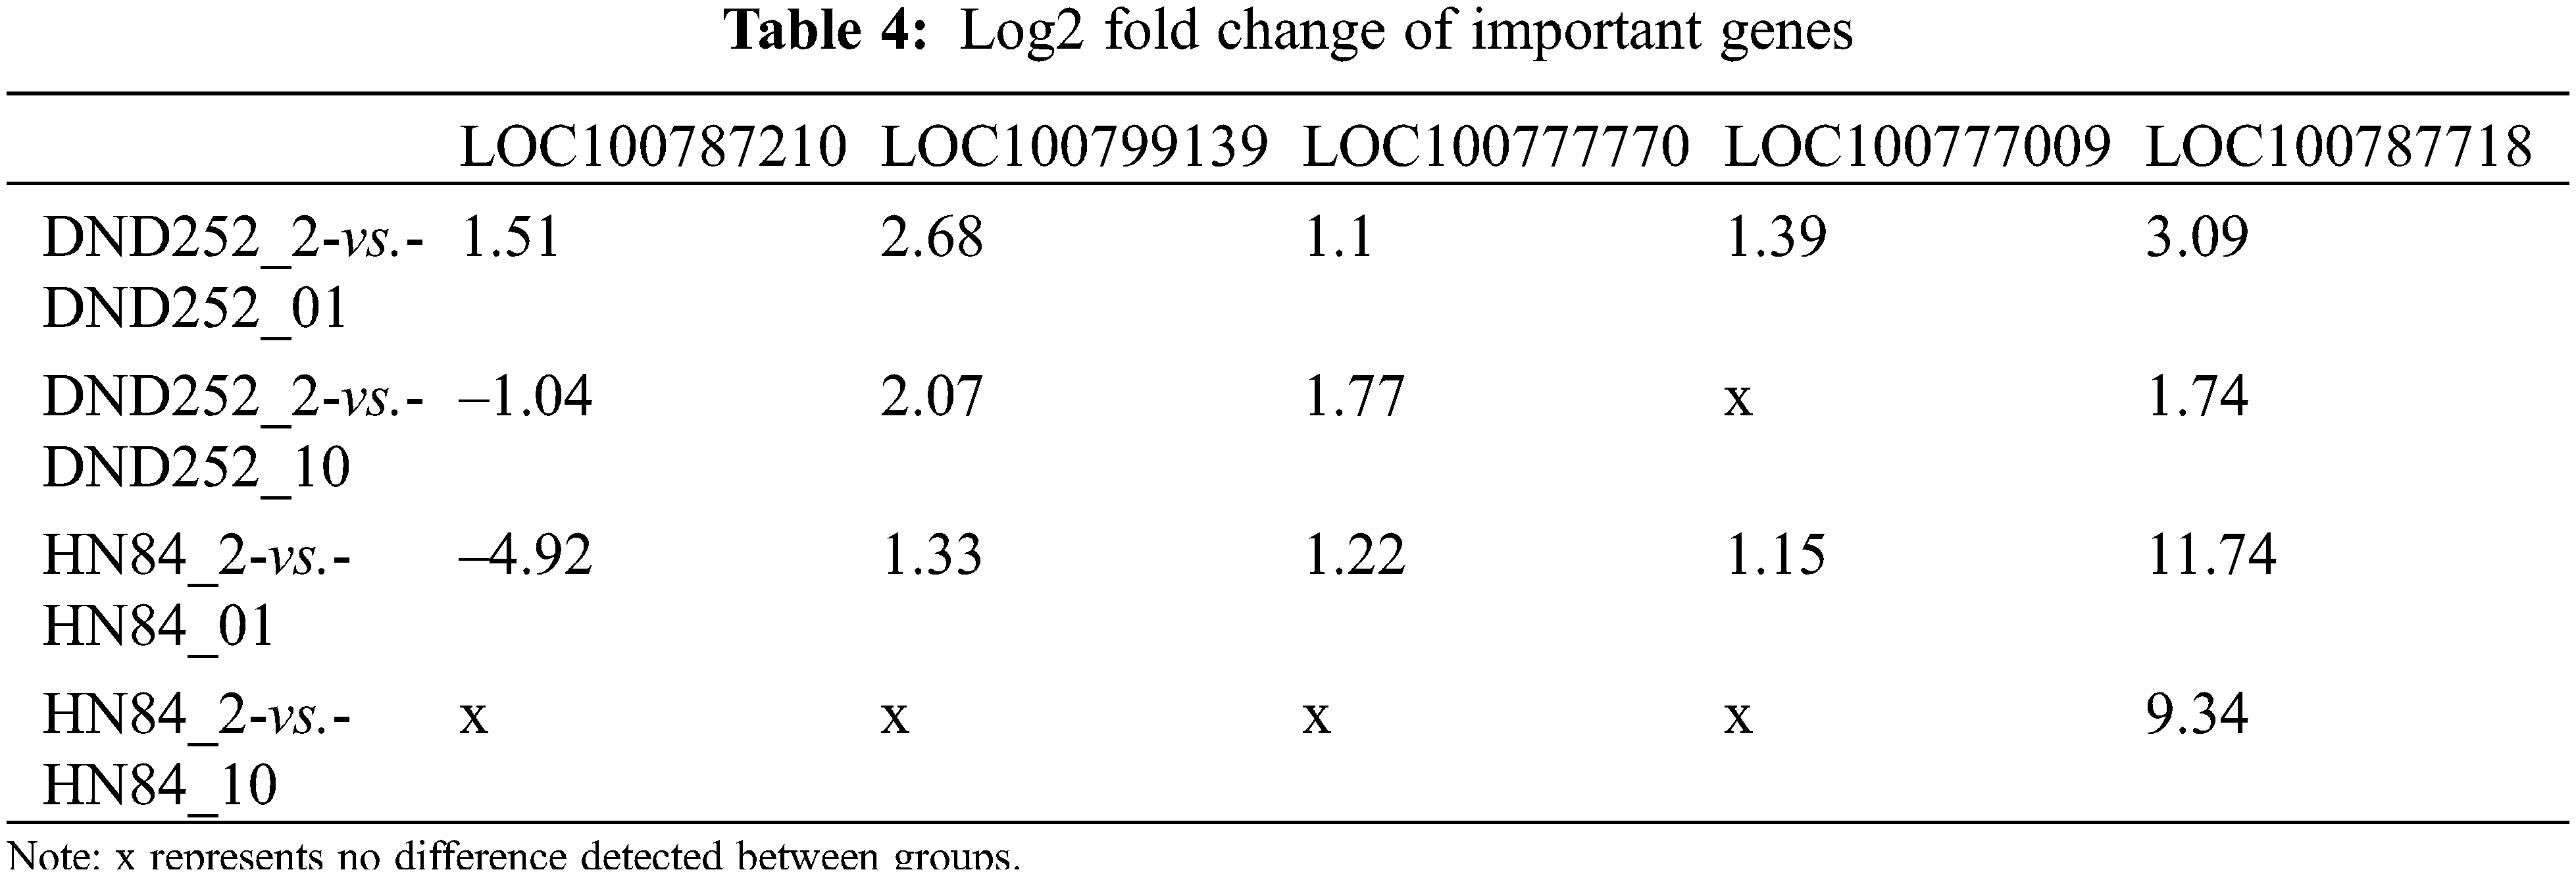
In these DEGs, combined with the results of GO analysis, we found that some DEGs were involved in the metabolic pathway of many sulfur-containing amino acids, and existed in both varieties of soybean. Fig. 7 represents the metabolic pathway of these DEGs. In the process of cysteine metabolism, LOC100806420 [EC: 2.5.1.47] mainly regulated the transformation of O-acetyl-L-serine and O-phospho-L-serine to L-cysteine. In the metabolic process of methionine, LOC100787210 [EC: 3.3.1.1] mainly regulated the transformation of S-adenosyl-l-homocysteine to L-homocysteine. LOC100799139, LOC100777770, LOC100777009 [EC: 2.5.1.6] were responsible for the transformation of l-methione to S-adenosylmethione.
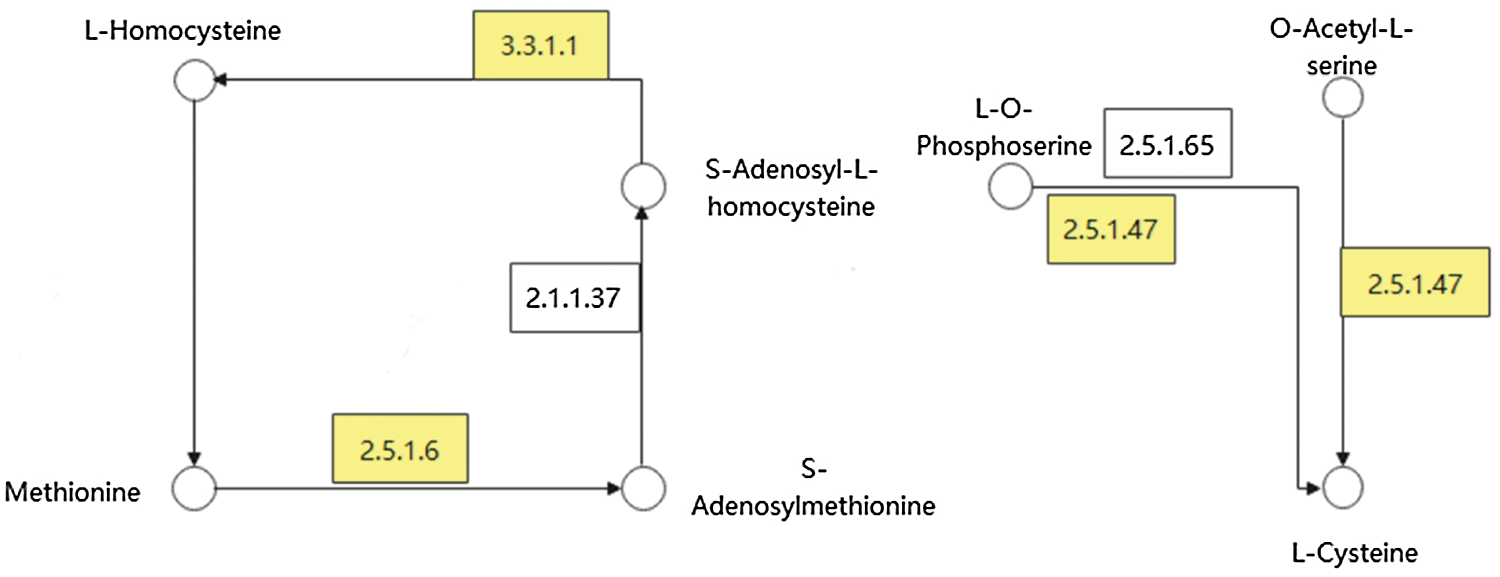
Figure 7: Metabolic pathway diagram of important DEGs. Note: Circles represent substances, boxes represent enzymes or genes, and yellow represents important DEGs
Table 4 showed the log2 fold change of important genes. The expression of gene LOC100777009 was the largest under the low sulfur concentration of the two varieties (measured according to the FPKM value). Gene LOC100787718 was a gene with large differential changes in the four groups. In variety HN84, the differential change multiple of the gene under the low sulfur concentration reached 11.7, and 9.3 at the high sulfur concentration. The differential change multiple of the gene reached 3.1 at medium and low sulfur concentration, and 1.7 at the high sulfur concentration. When the sulfur concentration changed, this gene expression increased, and increased more at low sulfur concentrations. In addition, we also found that the expression of LOC100812341 gene was opposite under different sulfur concentrations between the two varieties. In DND252, the expression of LOC100812341 gene was the largest under the high sulfur concentration, while in HN84, the expression was the largest under the low sulfur concentration, which may be one of the reasons for the different sensitivity of the two varieties to sulfur.
Higher plants assimilate inorganic sulfate into cysteine, which is subsequently converted into methionine and into various other sulfur-containing organic compounds. Nikiforova et al. [26] found that 632 genes responded specifically to sulfur deficiency through significant overexpression in Arabidopsis thaliana. Forieri et al. [27] found that glutathione, cysteine, total glucosinolates, methylthioadenosine, methionine, and S-methylmethionine significantly decreased in the absence of sulfur in Arabidopsis. Sulfur deficiency down-regulated 1,638 genes and up-regulated 1,338 genes in roots. This experiment described changes in gene expression under different sulfur concentrations. When sulfur was deficient, 7,867 (6,772 up-regulated and 1,095 down-regulated) and 8,078 (5,992 up-regulated and 2,086 down-regulated) differential genes were identified in the two varieties, and the number of up-regulated genes was significantly greater than that of down-regulated genes. The results were inconsistent with those obtained by Forieri et al. [27], which may be due to differences in species, sulfur concentrations and sampling sites. Assefa et al. [28] studied the effect of sulfur application rate on wheat yield. Among the three sulfur levels (0, 15 and 30 kg ha−1), wheat yield was the highest at 15 kg ha−1, and too high or too low sulfur application rates affected wheat yield. Similar results have been shown in studies of Wild Marigold (Tagetes minuta L.) in the Western Himalaya [29]. In this study, we studied the effects of five sulfur concentrations on yield. The results showed that yield of the control group was the highest, and it decreased if the sulfur concentration was too high or too low, which was consistent with the results of the above experiments.
RNA sequencing, a powerful strategy for identifying functional genes, has provided a better qualitative and quantitative description of gene expression under certain conditions in several plant species [30]. In the present study, we identified the numbers of upregulated and downregulated genes in the two soybean varieties under different sulfur concentrations, and performed GO functional annotation and KEGG pathway analyses of these genes. DEGs identified in the DND252 variety were primarily enriched in cellular amide metabolic processes, cell, binding, and catalytic activity, whereas DEGs identified in the HN84 variety were primarily enriched in cellular processes, membranes, and binding. A transcriptome analysis of cucumber treated with H2S showed that the DEGs were primarily enriched in inherent components of the membrane [31], which is similar to the findings of the present study, suggesting that sulfur affects the cell membranes.
Sulfur deficiency leads to stunted plant growth and yield loss [32]. Sulfur is not only a nutrient element but can also be used to relieve heavy metal stress in plants. Cadmium (Cd) accumulation and sulfur assimilation in poplar leaves are limited by low sulfur content; high sulfate supply increases Cd toxicity, whereas low sulfur reduces it [33]. A recent study suggested that H2S and proline interact to alleviate Cd damage in foxtail millet [34]. Studies on A. thaliana have shown that sulfur deficiency increases phosphate accumulation, absorption, and transport [6]. The pivotal role of sulfur compounds in plant disease resistance has become obvious in recent decades. Sulfur-containing defense compounds (SDCs) play important roles in plant defense responses against pathogens. These compounds include sulfur-containing amino acids, such as cysteine and methionine, tripeptide glutathione, thionine, defensins, glucosinolates, phytoalexins, reactive sulfur species, and hydrogen sulfide. SDCs play versatile roles in both pathogen perception and initiation of signal transduction pathways that are interconnected with various defense processes regulated by plant hormones (salicylic acid, jasmonic acid, and ethylene) and ROS [35]. Drought is one of the most common factors that limits plant growth and productivity. Sulfur dioxide (SO2) has recently been found to play a beneficial role in the protection of plants against environmental stress. SO2 pretreatment increased the activities of superoxide dismutase and peroxidase, and effectively reduced the hydrogen peroxide and malondialdehyde content of wheat seedlings under drought conditions; this suggests that SO2 could alleviate drought-induced oxidative damage by enhancing the antioxidant defense system in plants [36]. SO2 has also been used to improve the drought resistance of millet [37]. In the studies cited above, sulfur generally played an auxiliary role or participated in regulating other elements. Some studies have also reported physiological indicators of the sulfur effect, but the direct effect of sulfur on crop transcription level is rarely reported. In the present study, we examined the transcriptional effects of different concentrations of sulfur on soybean.
In the present study, the response of two soybean varieties to sulfur was examined at the transcriptome level, and we found that low and high sulfur concentration significantly influenced the expression of several genes. We highlighted some DEGs involved in methionine and cysteine metabolism. Additionally, the DEGs identified in the varieties under low and high sulfur concentrations were involved in several GO terms and KEGG pathways, including plant-pathogen interaction, MAPK signaling pathway, and plant hormone signal transduction. We also found some important DEGs regulating sulfur-containing amino acid metabolism, and their expression changed under different sulfur concentrations. Soybean yield was also significantly affected by sulfur concentrations, with the best result obtained at 2.0 mmol/L. However, future studies should examine the roles of several functionally related differential proteins and metabolites in response to the different sulfur concentrations.
Acknowledgement: This work was supported by the Ministry of Science and Technology of the People’s Republic of China, and the Science and Technology Department of Heilongjiang Province, China.
Availability of Data and Materials: Raw data has been deposited in the NCBI Short Read Archive (SRA) database, and the accession number is PRJNA757564.
Funding Statement: This research was funded by the National Key R&D Program of China, Grant No. 2020YFD1000902; and funded by Natural Science Foundation of Heilongjiang Province of China, Grant No. LH2021C023.
Conflicts of Interest:The authors declare that they have no conflicts of interest to report regarding the present study.
1. Piotrowska-Długosz, A., Siwik-Ziomek, A., Długosz, J., Gozdowski, D. (2017). Spatio-temporal variability of soil sulfur content and arylsulfatase activity at a conventionally managed arable field. Geoderma, 295(9–10), 107–118. DOI 10.1016/j.geoderma.2017.02.009. [Google Scholar] [CrossRef]
2. Jez, J. M. (2019). Structural biology of plant sulfur metabolism: From sulfate to glutathione. Journal of Experimental Botany, 70(16), 4089–4103. DOI 10.1093/jxb/erz094. [Google Scholar] [CrossRef]
3. Hasanuzzaman, M., Bhuyan, M., Mahmud, J. A., Nahar, K., Mohsin, S. M. et al. (2018). Interaction of sulfur with phytohormones and signaling molecules in conferring abiotic stress tolerance to plants. Plant Signaling & Behavior, 13(5), e1477905. DOI 10.1080/15592324.2018.1477905. [Google Scholar] [CrossRef]
4. Fuentes-Lara, L. O., Medrano-Macías, J., Pérez-Labrada, F., Rivas-Martínez, E. N., García-Enciso, E. L. et al. (2019). From elemental sulfur to hydrogen sulfide in agricultural soils and plants. Molecules, 24(12), 2282. DOI 10.3390/molecules24122282. [Google Scholar] [CrossRef]
5. Li, Q., Gao, Y., Yang, A. (2020). Sulfur homeostasis in plants. International Journal of Molecular Sciences, 21(23), 8926. DOI 10.3390/ijms21238926. [Google Scholar] [CrossRef]
6. Allahham, A., Kanno, S., Zhang, L., Maruyama-Nakashita, A. (2020). sulfur deficiency increases phosphate accumulation, uptake, and transport in Arabidopsis thaliana. International Journal of Molecular Sciences, 21(8), 2971. DOI 10.3390/ijms21082971. [Google Scholar] [CrossRef]
7. Devendar, P., Yang, G. F. (2017). Sulfur-containing agrochemicals. Topics in Current Chemistry, 375(6), 82. DOI 10.1007/s41061-017-0169-9. [Google Scholar] [CrossRef]
8. Kopriva, S., Malagoli, M., Takahashi, H. (2019). Sulfur nutrition: Impacts on plant development, metabolism, and stress responses. Journal of Experimental Botany, 70(16), 4069–4073. DOI 10.1093/jxb/erz319. [Google Scholar] [CrossRef]
9. Prince, S. J., Vuong, T. D., Wu, X., Bai, Y., Lu, F. et al. (2020). Mapping quantitative trait loci for soybean seedling shoot and root architecture traits in an inter-specific genetic population. Frontiers in Plant Science, 11, 1284. DOI 10.3389/fpls.2020.01284. [Google Scholar] [CrossRef]
10. Khan, M. A., Sahile, A. A., Jan, R., Asaf, S., Hamayun, M. et al. (2021). Halotolerant bacteria mitigate the effects of salinity stress on soybean growth by regulating secondary metabolites and molecular responses. BMC Plant Biology, 21(1), 176. DOI 10.1186/s12870-021-02937-3. [Google Scholar] [CrossRef]
11. Otie, V., Udo, I., Shao, Y., Itam, M. O., Okamoto, H. et al. (2021). Salinity effects on morpho-physiological and yield traits of soybean (Glycine max L.) as mediated by foliar spray with brassinolide. Plants, 10(3), 541. DOI 10.3390/plants10030541. [Google Scholar] [CrossRef]
12. Zhao, Q., Shi, X., Yan, L., Yang, C., Liu, C. et al. (2021). Characterization of the common genetic basis underlying seed hilum size, yield, and quality traits in soybean. Frontiers in Plant Science, 12, 610214. DOI 10.3389/fpls.2021.610214. [Google Scholar] [CrossRef]
13. Dastmalchi, M. (2021). Late-stage maturation erodes lipid content in soybean seeds. Plant Physiology, 186(2), 816–818. DOI 10.1093/plphys/kiab129. [Google Scholar] [CrossRef]
14. Van, K., McHale, L. K. (2017). Meta-analyses of QTLs associated with protein and oil contents and compositions in soybean [Glycine max (L.) Merr.] seed. International Journal of Molecular Sciences, 18(6), 1180. DOI 10.3390/ijms18061180. [Google Scholar] [CrossRef]
15. Müller, M., Schneider, J. R., Klein, V. A., da Silva, E., da Silva Júnior, J. P.et al. (2021). Soybean root growth in response to chemical, physical, and biological soil variations. Frontiers in Plant Science, 12, 602569. DOI 10.3389/fpls.2021.602569. [Google Scholar] [CrossRef]
16. FAO (2018). Food and Agriculture Organisation of United Nations. http://www.fao.org/faostat/en/#data/QC. [Google Scholar]
17. Zhou, Y., Zhao, D., Shuang, L., Xiao, D., Xuan, Y. et al. (2020). Transcriptome analysis of rice roots in response to root-knot nematode infection. International Journal of Molecular Sciences, 21(3), 848. DOI 10.3390/ijms21030848. [Google Scholar] [CrossRef]
18. Liu, C., Chen, X., Wang, W., Hu, X., Han, W. et al. (2021). Identifying wild versus cultivated gene-alleles conferring seed coat color and days to flowering in soybean. International Journal of Molecular Sciences, 22(4), 1559. DOI 10.3390/ijms22041559. [Google Scholar] [CrossRef]
19. Jo, Y., Yoon, Y. N., Jang, Y. W., Choi, H., Lee, Y. H. et al. (2020). Soybean viromes in the republic of korea revealed by RT-PCR and next-generation sequencing. Microorganisms, 8(11), 1777. DOI 10.3390/microorganisms8111777. [Google Scholar] [CrossRef]
20. McCabe, C. E., Graham, M. A. (2020). New tools for characterizing early brown stem rot disease resistance signaling in soybean. Plant Genome, 13(3), e20037. DOI 10.1002/tpg2.20037. [Google Scholar] [CrossRef]
21. Sun, Y., Zhao, J. Y., Li, Y. T., Zhang, P. G., Wang, S. P. et al. (2021). Genome-wide analysis of the C2 domain family in soybean and identification of a putative abiotic stress response gene GmC2-148. Frontiers in Plant Science, 12, 620544. DOI 10.3389/fpls.2021.620544. [Google Scholar] [CrossRef]
22. Ste-Croix, D. T., St-Marseille, A. G., Lord, E., Bélanger, R. R., Brodeur, J. et al. (2021). Genomic profiling of virulence in the soybean cyst nematode using single-nematode sequencing. Phytopathology, 111(1), 137–148. DOI 10.1094/PHYTO-08-20-0348-FI. [Google Scholar] [CrossRef]
23. Kopriva, S. (2015). Plant sulfur nutrition: From sachs to big data. Plant Signaling & Behavior, 10(9), e1055436. DOI 10.1080/15592324.2015.1055436. [Google Scholar] [CrossRef]
24. Kim, D., Langmead, B., Salzberg, S. L. (2015). HISAT: A fast spliced aligner with low memory requirements. Nature Methods, 12(4), 357–360. DOI 10.1038/nmeth.3317. [Google Scholar] [CrossRef]
25. Wang, L., Feng, Z., Wang, X., Wang, X., Zhang, X. (2010). DEGseq: An R package for identifying differentially expressed genes from RNA-seq data. Bioinformatics, 26(1), 136–138. DOI 10.1093/bioinformatics/btp612. [Google Scholar] [CrossRef]
26. Nikiforova, V., Freitag, J., Kempa, S., Adamik, M., Hesse, H. et al. (2003). Transcriptome analysis of sulfur depletion in Arabidopsis thaliana: Interlacing of biosynthetic pathways provides response specificity. Plant Journal: For Cell and Molecular Biology, 33(4), 633–650. DOI 10.1046/j.1365-313x.2003.01657.x. [Google Scholar] [CrossRef]
27. Forieri, I., Sticht, C., Reichelt, M., Gretz, N., Hawkesford, M. J. et al. (2017). System analysis of metabolism and the transcriptome in Arabidopsis thaliana roots reveals differential co-regulation upon iron, sulfur and potassium deficiency. Plant, Cell & Environment, 40(1), 95–107. DOI 10.1111/pce.12842. [Google Scholar] [CrossRef]
28. Assefa, S., Haile, W., Tena, W. (2021). Effects of phosphorus and sulfur on yield and nutrient uptake of wheat (Triticum aestivum L.) on Vertisols, North Central. Ethiopia Heliyon, 7(3), e06614. DOI 10.1016/j.heliyon.2021.e06614. [Google Scholar] [CrossRef]
29. Walia, S., Kumar, R. (2021). Nitrogen and sulfur fertilization modulates the yield, essential oil and quality traits of wild marigold (Tagetes minuta L.) in the western himalaya. Frontiers in Plant Science, 11, 631154. DOI 10.3389/fpls.2020.631154. [Google Scholar] [CrossRef]
30. Nie, S., Li, C., Wang, Y., Xu, L., Muleke, E. M. et al. (2016). Transcriptomic analysis identifies differentially expressed genes (DEGs) associated with bolting and flowering in radish (Raphanus sativus L.). Frontiers in Plant Science, 7, 682. DOI 10.3389/fpls.2016.00682. [Google Scholar] [CrossRef]
31. Jiang, J., Ren, X., Li, L., Hou, R., Sun, W. et al. (2020). H2S regulation of metabolism in cucumber in response to salt-stress through transcriptome and proteome analysis. Frontiers in Plant Science, 11, 1283. DOI 10.3389/fpls.2020.01283. [Google Scholar] [CrossRef]
32. Narayan, O. P., Verma, N., Jogawat, A., Dua, M., Johri, A. K. (2021). Sulfur transfer from the endophytic fungus Serendipita indica improves maize growth and requires the sulfate transporter SiSulT. Plant Cell, 33(4), 1268–1285. DOI 10.1093/plcell/koab006. [Google Scholar] [CrossRef]
33. Shi, W., Liu, W., Ma, C., Zhang, Y., Ding, S. et al. (2020). Dissecting MicroRNA-mRNA regulatory networks underlying sulfur assimilation and cadmium accumulation in poplar leaves. Plant & Cell Physiology, 61(9), 1614–1630. DOI 10.1093/pcp/pcaa084. [Google Scholar] [CrossRef]
34. Tian, B., Qiao, Z., Zhang, L., Li, H., Pei, Y. (2016). Hydrogen sulfide and proline cooperate to alleviate cadmium stress in foxtail millet seedlings. Plant Physiology and Biochemistry, 109, 293–299. DOI 10.1016/j.plaphy.2016.10.006. [Google Scholar] [CrossRef]
35. Künstler, A., Gullner, G., Ádám, A. L., Kolozsváriné, J., Király, L. (2020). The versatile roles of sulfur-containing biomolecules in plant defense-A road to disease resistance. Plants, 9(12), 1705. DOI 10.3390/plants9121705. [Google Scholar] [CrossRef]
36. Li, L. H., Yi, H. L., Liu, X. P., Qi, H. X. (2021). Sulfur dioxide enhance drought tolerance of wheat seedlings through H2S signaling. Ecotoxicology and Environmental Safety, 207, 111248. DOI 10.1016/j.ecoenv.2020.111248. [Google Scholar] [CrossRef]
37. Han, Y., Yang, H., Wu, M., Yi, H. (2019). Enhanced drought tolerance of foxtail millet seedlings by sulfur dioxide fumigation. Ecotoxicology and Environmental Safety, 178, 9–16. DOI 10.1016/j.ecoenv.2019.04.006. [Google Scholar] [CrossRef]
 | This work is licensed under a Creative Commons Attribution 4.0 International License, which permits unrestricted use, distribution, and reproduction in any medium, provided the original work is properly cited. |