| Phyton-International Journal of Experimental Botany |
DOI: 10.32604/phyton.2022.018983
ARTICLE
Phenotypic Characterization of Oryza nivara (Sharma et Shastry) Collected from Different Ecological Niches of Sri Lanka
1Department of Agricultural Biology, Faculty of Agriculture, University of Ruhuna, Matara, 81100, Sri Lanka
2State Key Laboratory of Systematic and Evolutionary Botany, Institute of Botany, Chinese Academy of Sciences, Beijing, 100093, China
3University of Chinese Academy of Sciences, Beijing, 100049, China
4Department of Crop Science, Faculty of Agriculture, University of Ruhuna, Matara, 81100, Sri Lanka
5Department of Crop Science, Faculty of Agriculture, University of Peradeniya, Kandy, 20400, Sri Lanka
6Department of Agronomy, Faculty of Agriculture, Kafrelsheikh University, Kafrelsheikh, 33516, Egypt
7Department of Biology, College of Science, Taif University, Taif, 21944, Saudi Arabia
*Corresponding Author: Disna Ratnasekera. Email: disnar@agbio.ruh.ac.lk
#These authors contributed equally to this work
Received: 27 August 2021; Accepted: 14 December 2021
Abstract: Information on the genetic diversity of wild rice species in Sri Lanka is relatively meagre, though it plays a key role in crop improvement programs of cultivated rice (Oryza sativa L.). The present study was carried out to identify the morphological variation pattern of the wild populations of O. nivara in Sri Lanka. Seven populations (P1 to P7) collected from different agro-ecological regions were characterized in a common garden based on nine morphological traits. The findings revealed a high level of phenotypic variation between populations when compared to within a population. The most variable traits were the flag leaf panicle neck length (FLPNL) and flag leaf angle (FLA), whereas the least variable trait was the flag leaf length (FLL). Box plots clearly illustrated the large differentiation of phenotypic traits in the entire distribution of wild rice populations. The cumulative values of the two principal components, i.e., FLPNL and FLA, explained 58.7% of the total variance. Populations from similar natural habitats clustered together. The P7 was adapted to intercept more sunlight by increasing flag leaf width (FLW) and FLA to compete with weeds and other shrubs. P2 and P5 were the most closely related populations representing approximately similar ecological conditions of the dry zone. The P3 population from the intermediate zone showed a vigorous plant growth with the highest plant height, culm girth and awn length (P < 0.05). Knowledge of such morphological diversity would facilitate designing conservation strategies and basic information for the proper utilization of wild resources in rice genetic improvement.
Keywords: AA-genome; morphological traits; natural habitats; population differentiation; wild rice
Rice (O. sativa L.) is the staple food for more than one-third of the world’s population and the most important crop cultivated in Asia. The genetic diversity of cultivated rice has rapidly narrowed down after the green revolution due to the development of high-yielding cultivars focusing on a few agronomic traits [1–3]. Rice improvement efforts have thus been directed towards incorporating biotic and abiotic resistance to the cultivars and the physiological processes governing yield potential to optimize growth duration and improve grain quality of the cultivars [4,5]. The wide range of genetic diversity in Oryza species has been well documented [6–10]. In particular, the wild species closely related to cultivated rice have a valuable gene pool and play a pivotal role in rice breeding programs by contributing genes resistant to biotic stresses and tolerance to abiotic stresses [2,5,11]. The species of the genus Oryza are widely diverse morphologically [12–16] and are genetically represented by distinct genome types, which provide a valuable opportunity to investigate variations of rice breeding programs [13,17]. Due to their high genetic compatibility with cultivated rice, species possessing the AA-genome are the most accessible genetic resources among the wild relatives [18]. Therefore, the transfer of alien genes from such wild relatives is readily accomplished via sexual hybridization [19]. The development of resistance for biotic stresses such as grassy stunt virus [20], bacterial blight [21], rice blast [22], sheath blight [22], green rice leafhopper [5] are such successful applications that have been achieved using the wild species, Oryza nivara (Sharma et Shastry). Moreover, O. nivara has shown varying degrees of resistance to the brown planthopper (BPH; Nilaparvata lugens Stal.) [23,24], indicating the availability of varying degrees of genetic diversity in terms of BPH resistance. Furthermore, O. nivara has unique traits that could be used in rice breeding, such as high micronutrient content [25] and the unique yield traits, namely, kernel characteristics [26], panicle length [27], seed weight [26], seed characteristics [28], grain yield [27,29,30], number of tillers [25] and number of panicles per plant [31].
Furthermore, O. nivara and Oryza rufipogon (Griff) are the progenitors of Asian cultivated rice. They have been recognized as valuable genetic sources for rice genetic improvement programs [5]. O. rufipogon is a perennial cross-pollinator found in permanently wet areas such as ponds and swamps, while O. nivara is a wild, annual diploid species of Asian origin carring the AA genome. These two species can readily hybridize with cultivated rice. Oryza nivara is the most closely related to O. sativa in terms of phenotypic and life-history traits and probably the direct progenitor of Asian rice [32,33]. Both species showed allopatric distribution in Sri Lanka, enhancing the potential of sharing genes with cultivated rice [34–36]. The annual O. nivara is globally distributed in the tropics and subtropics of Asia [13] and Southern and Southeast Asia [32,33]. However, O. nivara found in South Asia is morphologically more differentiated than mainland Asia [37].
In Sri Lanka, O. nivara was first reported in 1963 in the Trincomalee district of the eastern province [38]. The species is widely distributed but mostly confined to the dry zone and marginally extending to the intermediate zone of the country [34,35,39]. The size, morphology, and geographic distribution of the natural populations of this species vary considerably. A high level of phenotypic variations of O. nivara populations across the geographic locations in Sri Lanka has been recorded [40]. Though the habitat preference of O. nivara is shallow water, some populations exist in habitats with water levels nearly 1 m in depth during the rainy season (in-situ life cycle observation). Flowering times of wild populations also vary from place to place, with the peak of flowering time from January to May [41]. Oryza nivara populations had previously been reported in nine out of 25 districts in Sri Lanka [42], but current field investigations showed that the geographic range of the species has decreased. The existing populations have shrunk due to habitat loss and degradation caused by agriculture and urbanization [39]. Therefore, a better understanding of the genetic diversity of O. nivara is instructive both for developing the conservation management for germplasm collection, and effective utilization of genetic resources in rice improvement programs in Sri Lanka.
In the present study, we conducted a baseline study on the O. nivara populations in Sri Lanka to identify the population diversity across the country based on selected morphological traits. Regardless of rapid changes in the climate, O. nivara populations across the country have adapted well, displaying robust and diverse morphological traits to their native habitat. Thus, utilizing the diversity of wild rice, O. nivara, is critical for developing new cultivars that they respond to future climate threats. Consequently, the development of “climate-ready rice” varieties is essential as they will provide significant benefits to farmers in developing countries. Thus, our study focused the ability of O. nivara to adapt to rapid changes in local climate through morphological changes, providing new insights for future research on speciation and local adaptation.
2.1 Sample Collection and Morphological Characterization
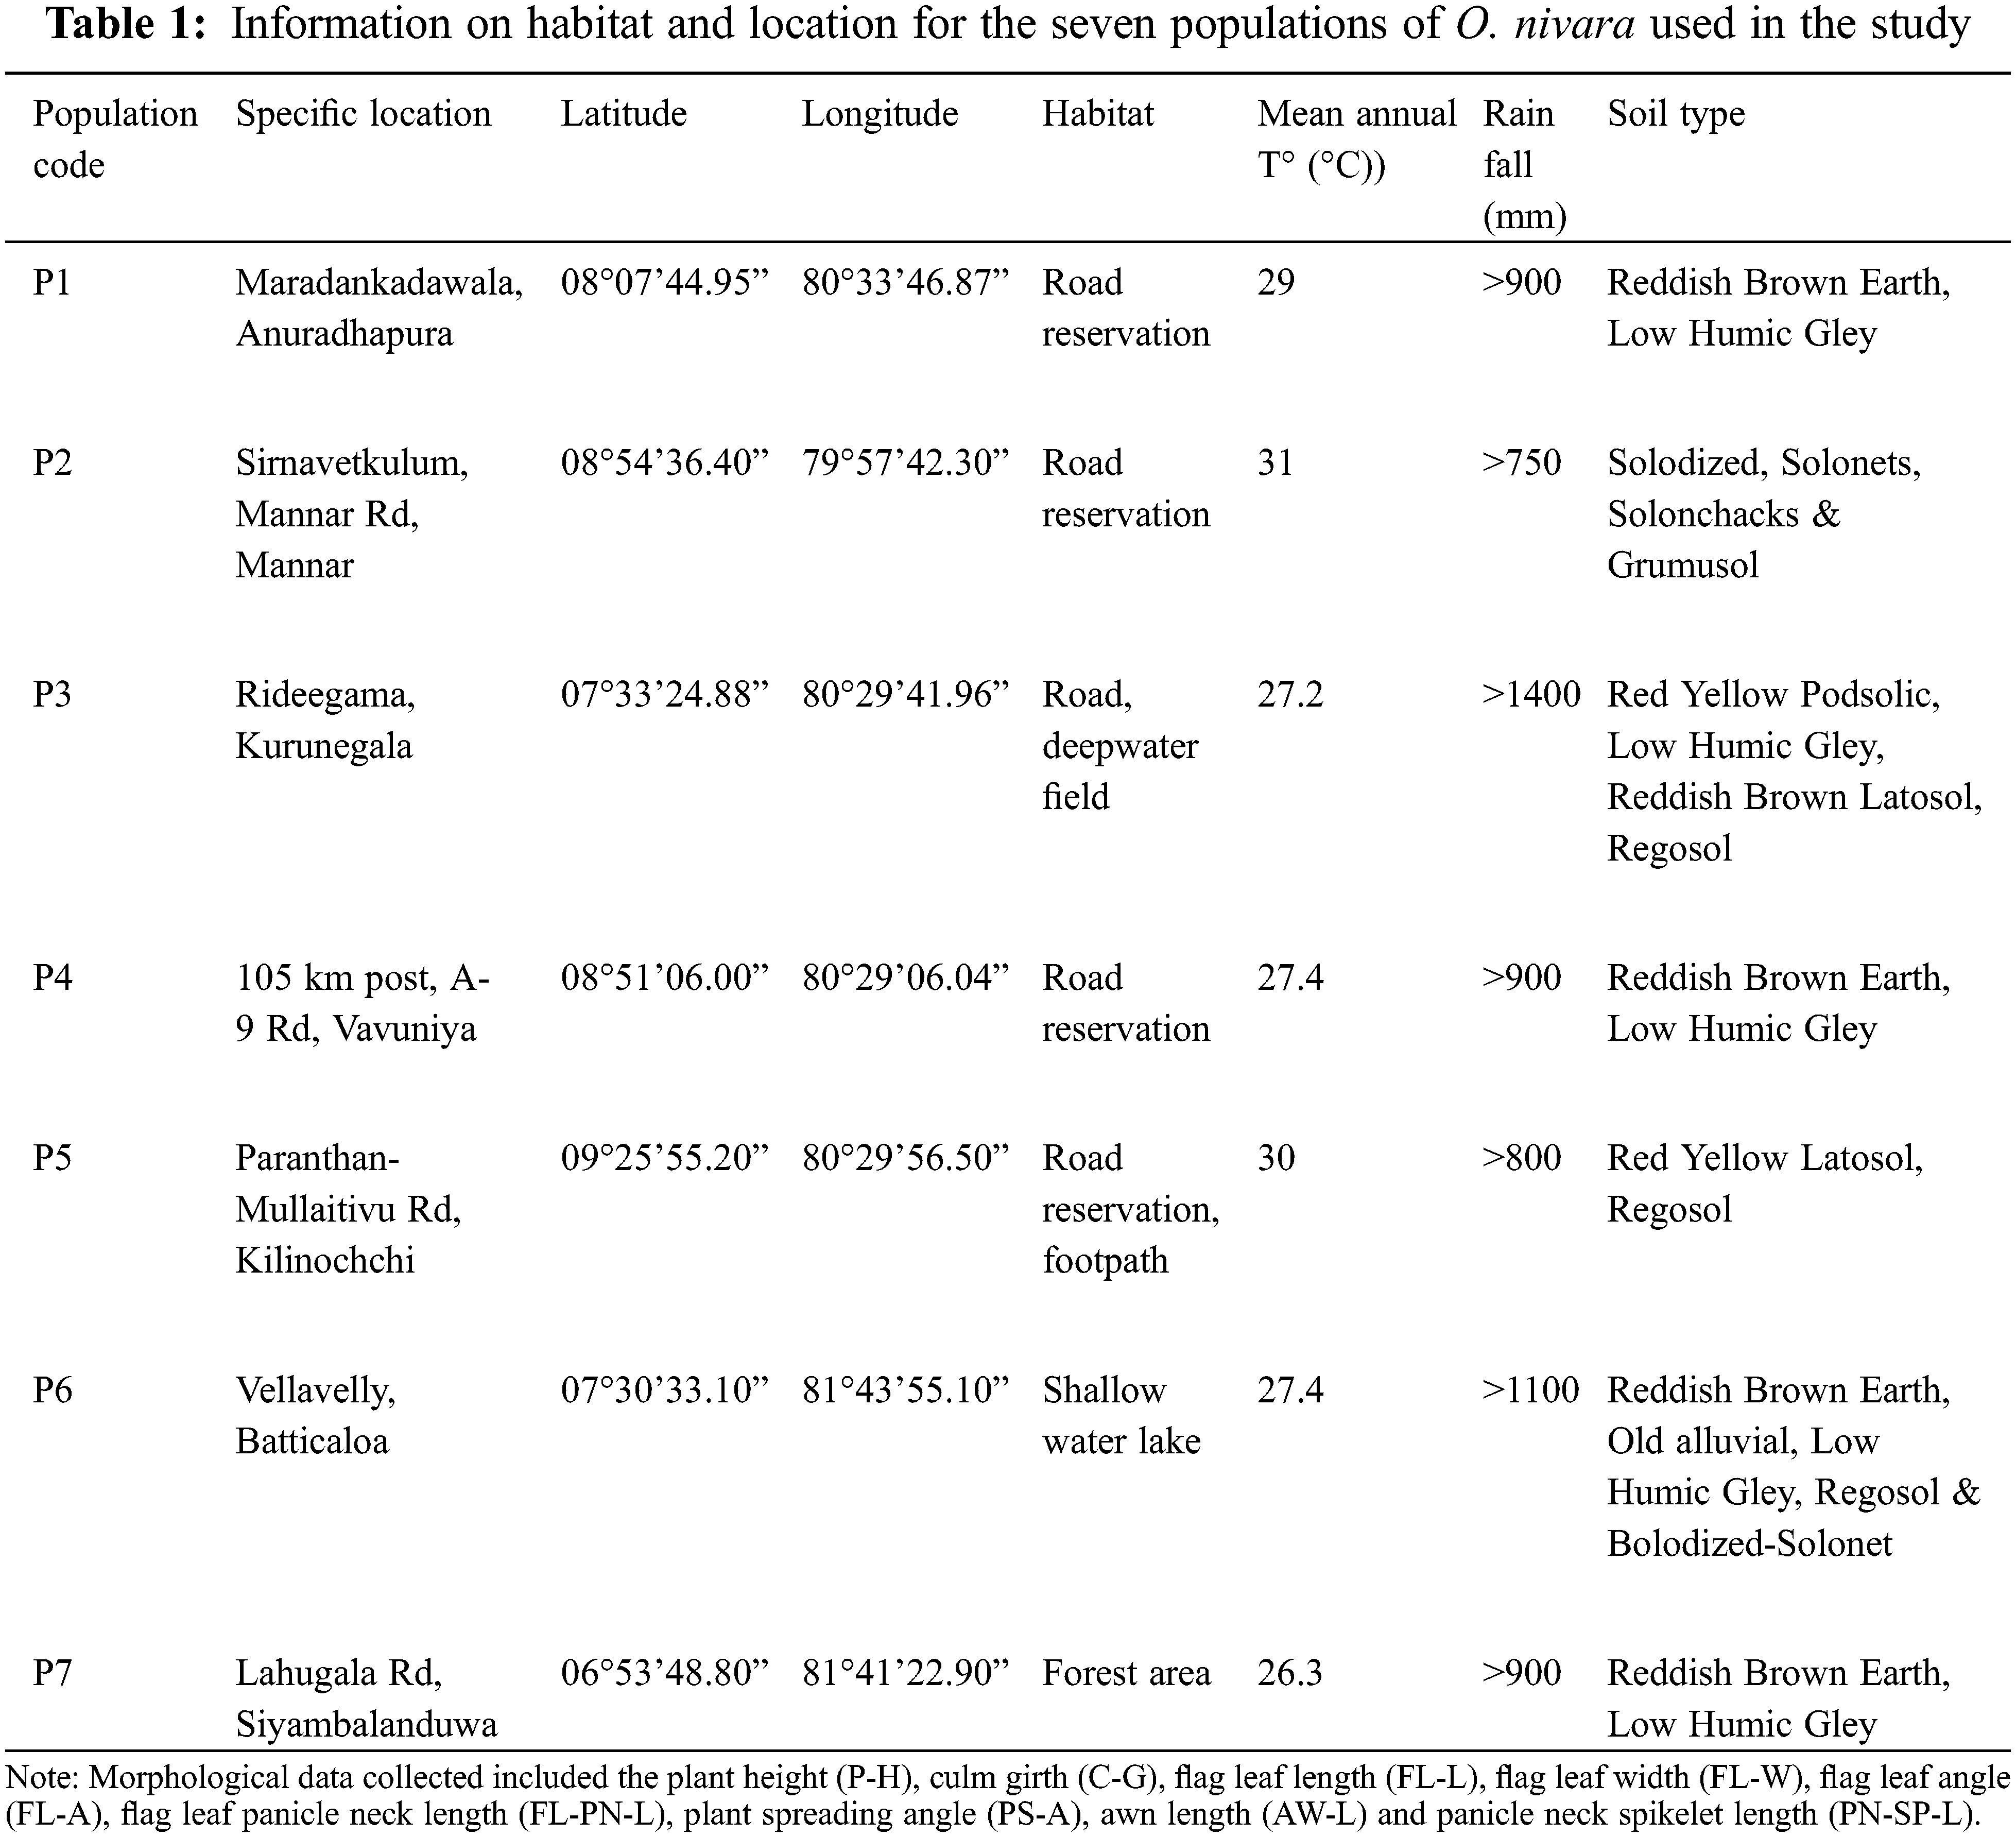
Based on GPS coordinates available from the earlier reports [34], seven wild populations (P1 to P7) of O. nivara were collected from an intermediate and a dry zone (Fig. 1), exhibiting a broad range of typical environments [39]. The typical O. nivara populations were identified based on several distinctive features, including panicle type, culm type and length, and anther length. Thirty individuals were randomly collected from each population with a minimum distance of five meters between any two individuals. (Fig. 1, Table 1). The selected plants were carefully uprooted with an intact soil mass of 15 cm radius and 15 cm deep and planted in cement pots filled with topsoil in a common garden at the Faculty of Agriculture, University of Ruhuna in Sri Lanka 06.08°N, 80.56°E). The established plants were allowed to grow for two consecutive years (2016–2017). A fertilizer mixture containing Urea: Triple Super Phosphate: Muriate of Potash to provide a N:P:K ratio of 4:1:1 was applied at a rate of 2.0 g per plant per month to support the plant growth during the study period. The nine quantitative parameters were measured as defined by the Africa Rice Center and the Biodiversity International, International Rice Research Institute (IRRI) [43]. All the observations and measurements were taken by the following methods described in the rice descriptors [44].
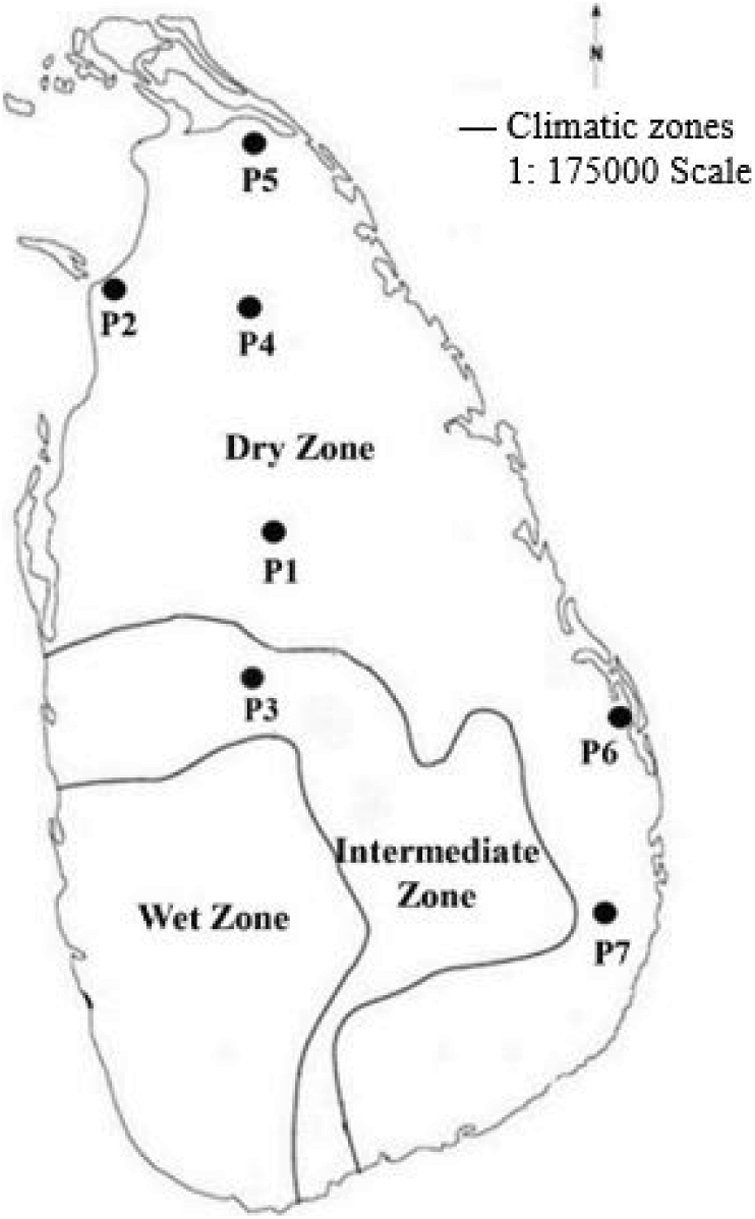
Figure 1: The distribution of the seven O. nivara populations sampled from intermediate and dry zones of Sri Lanka
All the analysis were carried out using Minitab 17 and SAS 9.1 statistical packages. Each parameter was subjected to an analysis of variance to discover particular traits that differed significantly among populations. Pearson’s correlation analysis was conducted on quantitative variables. Populations were clustered by performing cluster analysis (Dendrogram by cluster variable option of centroid linkage method) and PCA analysis where populations were grouped according to the first two principal components (biplot analysis).
3.1 Identification of Adaptive Morphological Traits
The morphological differences among populations were studied to identify the significant traits involved in population differentiation. The ANOVA showed that P-H (P < 0.0001), C-G (P < 0.0001), FL-L (P < 0.0001), FL-W (P < 0.0001), FL-A (P < 0.0001), AW-L (P < 0.0001), FL-PN-L (P < 0.0001), PS-A (P < 0.0001) and PN-SP-L (P < 0.0001) were significantly different among the populations (Table 2). A high level of variance was observed among populations for the tested quantitative traits. Pooled means of traits calculated by considering all population individuals are presented in Table 2.
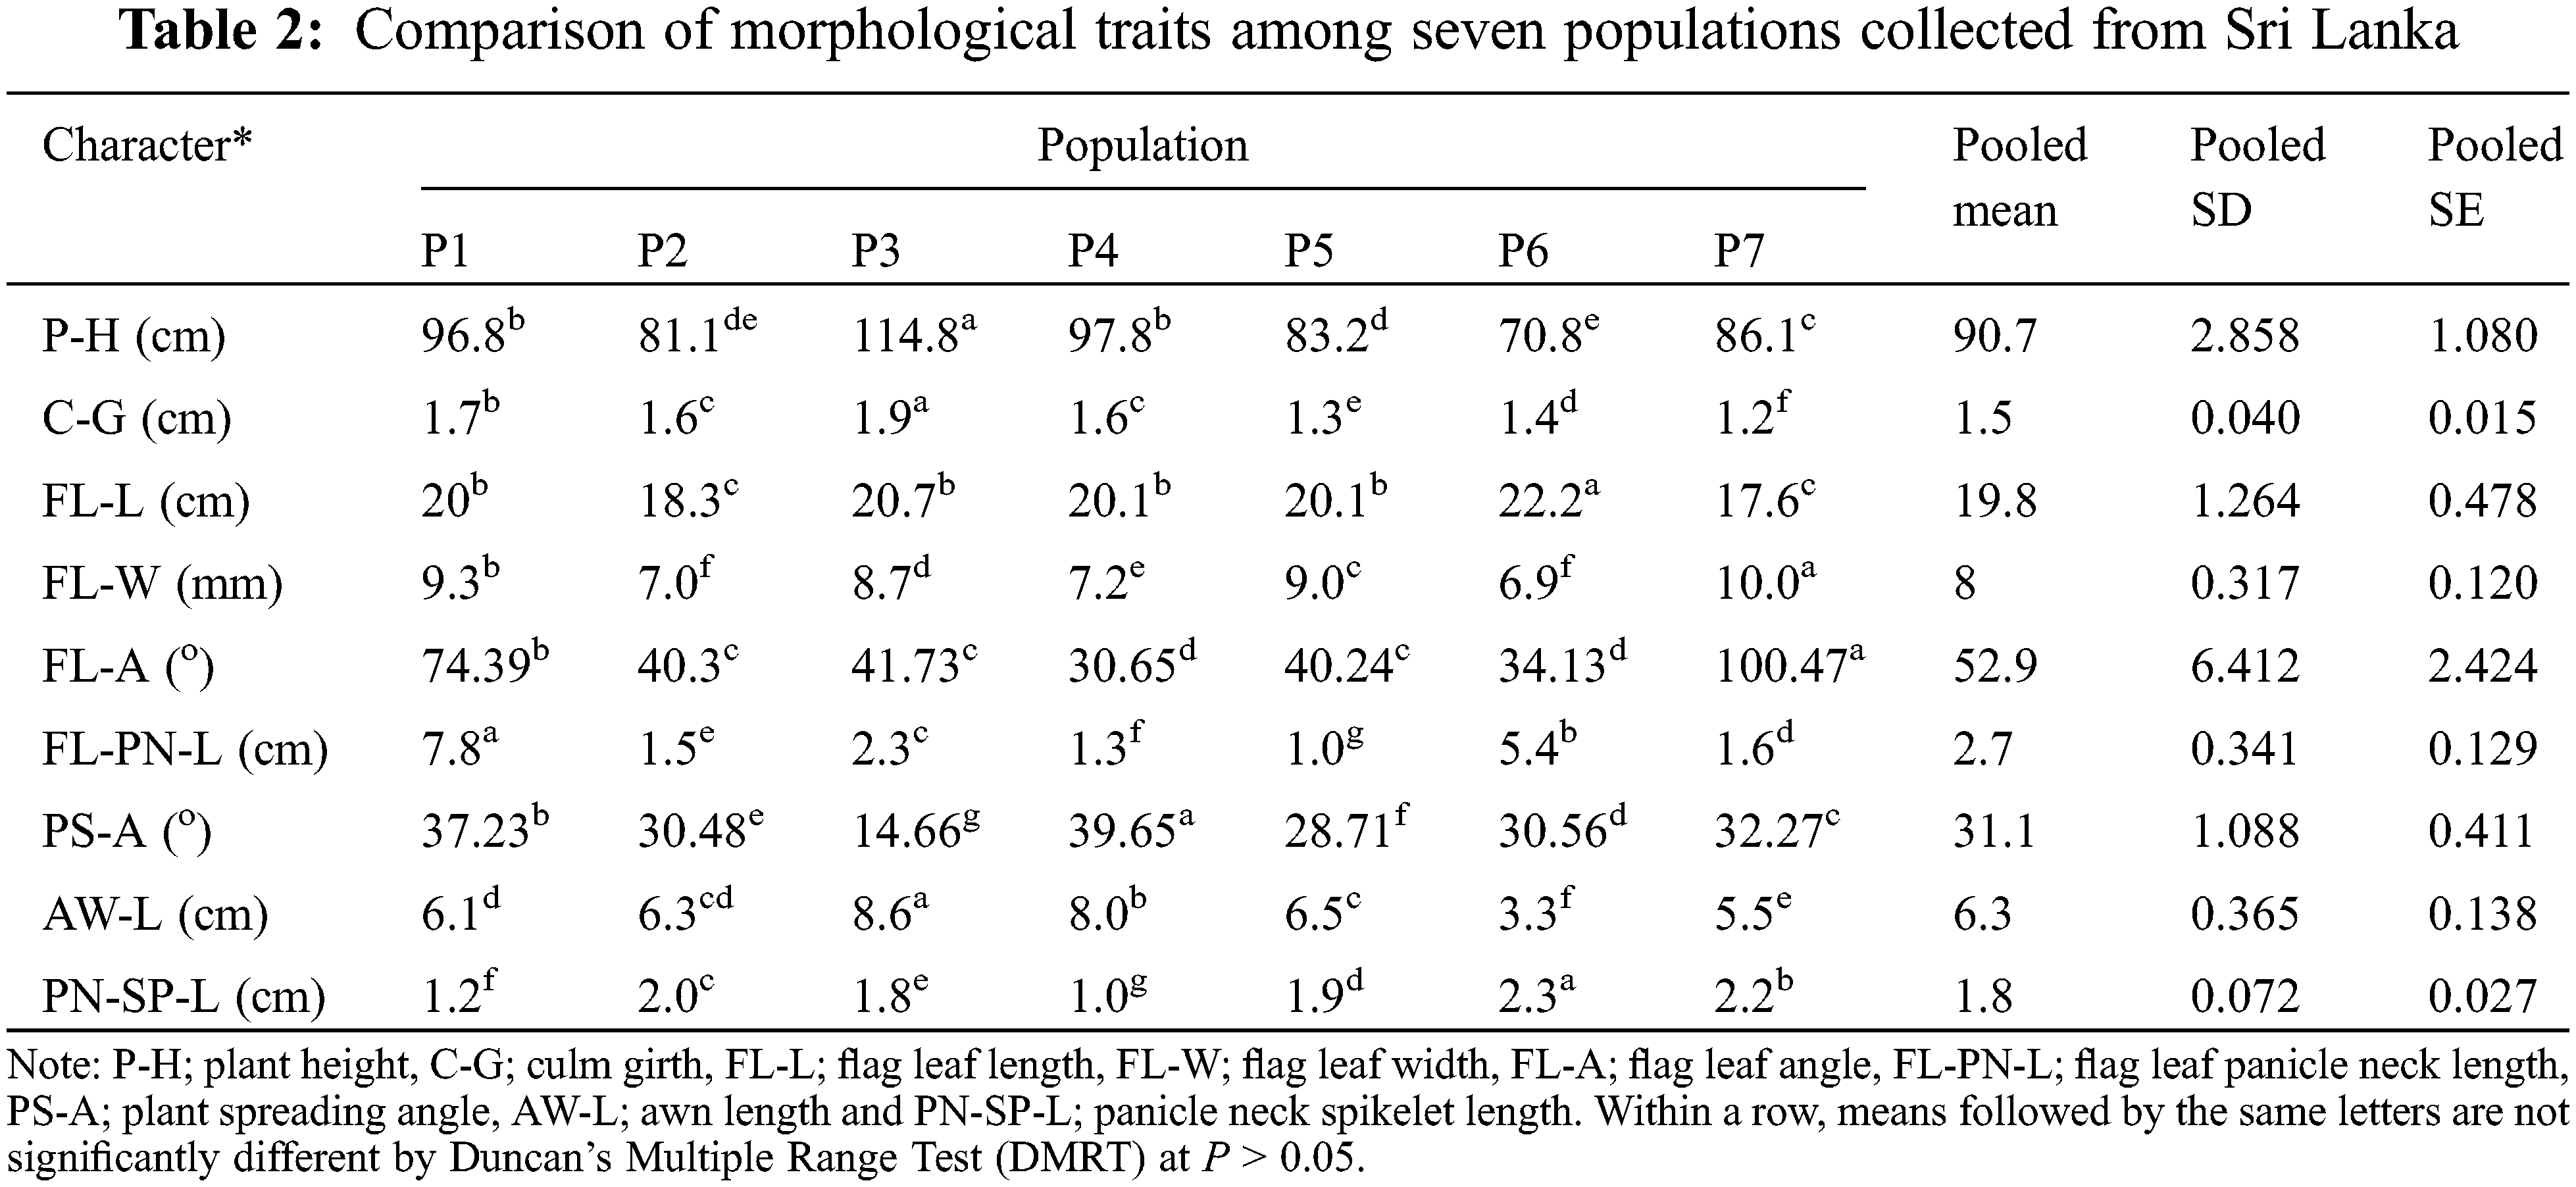
The highest P-H observed in the P3 population (P < 0.05) belonged to the intermediate zone. The P-H of P6 was the shortest (38% lower than the P3), which showed statistically similar results to those of P2 (P > 0.05). The P3 showed the highest C-G, which was 58% higher than that of P7, which recorded the lowest C-G (P < 0.05).
The plants in P6 had the longest FL-L (P < 0.05), while the P2 and P7 populations had no significant difference in lengths (P > 0.05) but the lowest FL-L. However, P7 had the highest FL-W (P < 0.05), which was 45% higher than the plant populations with the lowest FL-W (P2 and P6). The P7 population had the highest FL-A (P < 0.05), while the P4 and P6 populations had the lowest FL-A.
Plants in P1 recorded the highest FL-PN-L, while those in P5 recorded the lowest. The PS-A was the highest in P4 and the lowest in P3. The P3 population showed the highest AW-L, which was 260% higher than that in P6 (P < 0.05), which showed the lowest AW-L. The highest PN-SP-L was recorded from plants in P6, while the lowest was from those in the P4 population. All populations showed a significant difference (P < 0.05) in the parameters FL-PN-L, PS-A and PN-SP-L.
3.2 Within and among Population Diversity of Growth Characteristics
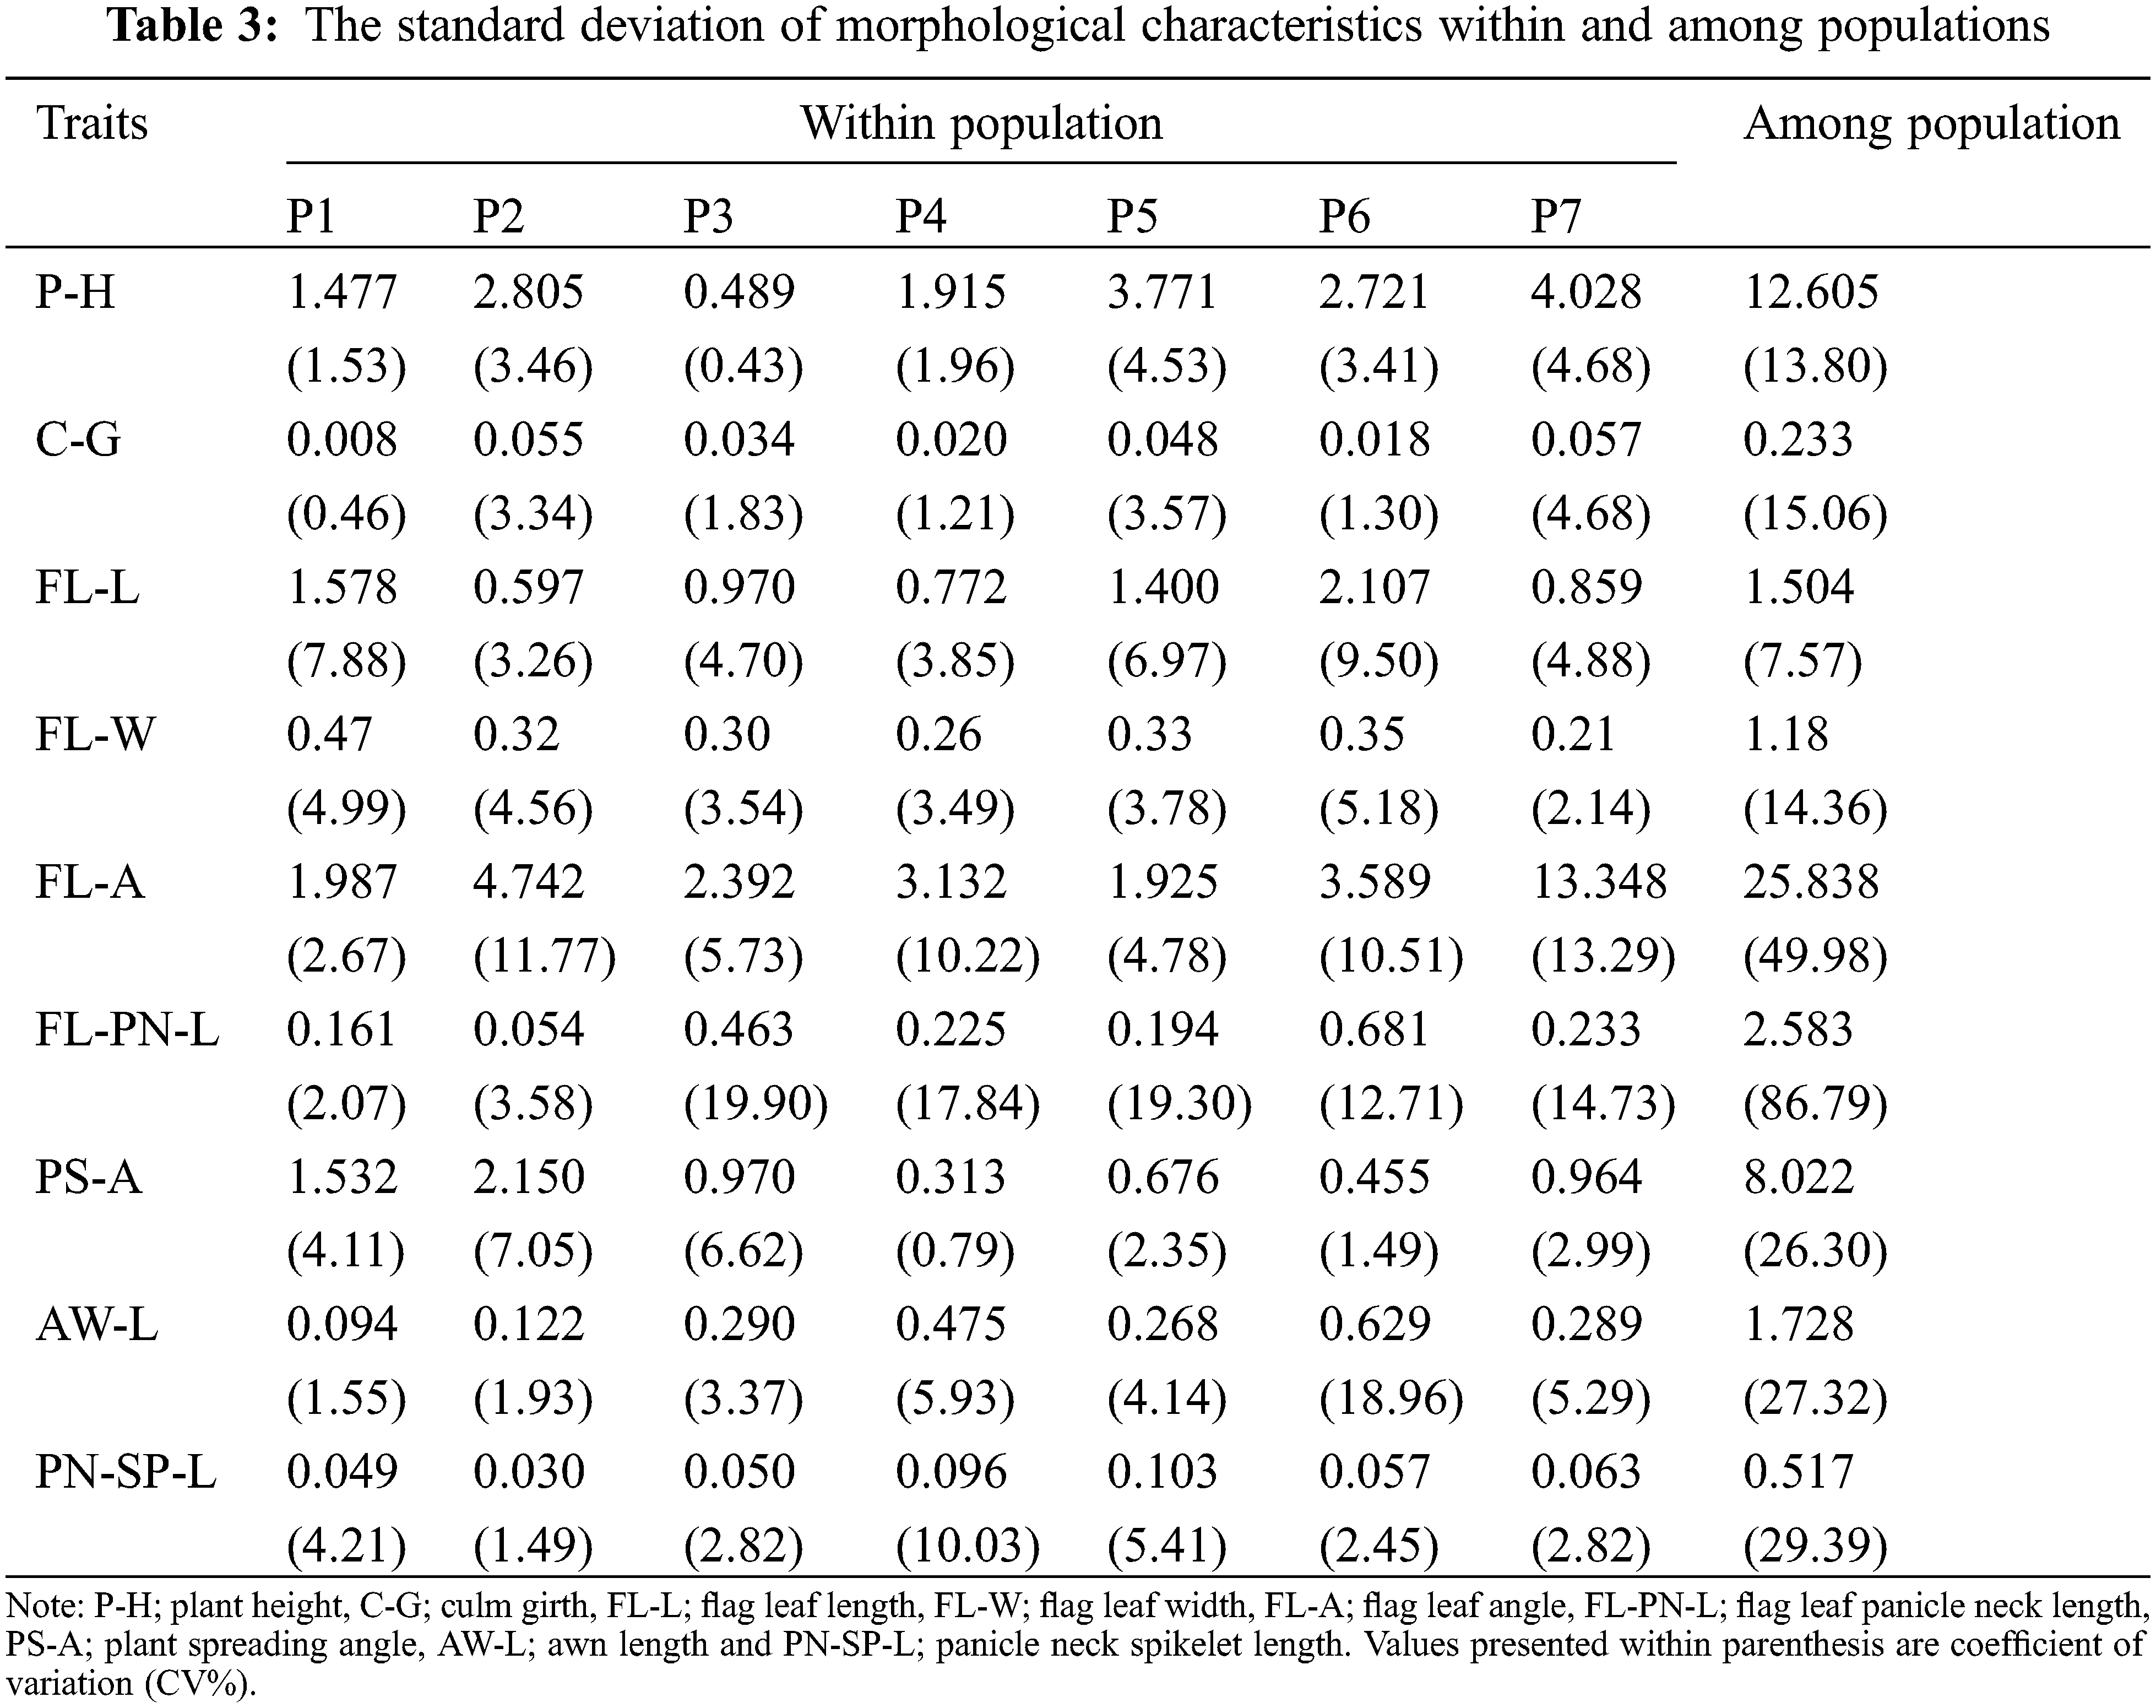
Variations of each parameter were demonstrated within and among populations (Table 3). Some traits revealed greater population variability leading to a high coefficient of variation (CV) in FL-PN-L (86.79%) followed by FL-A with 49.98%. In contrast, some traits such as FL-L, P-H, FL-W, and C-G showed a comparatively lower CV (7–15%) and those of PS-A, AW-L and PN-SP-L were moderate between 25–30%. Trait-specific variability patterns were found within populations. Similarly, C-G of P7, FL-A of P2, P4, P6 and P7, FL-PN-L in P3, P4, P5, P6 and P7, AW-L in P6 and PN-SP-L of P4 all exhibited a significant variance within the populations.
The boxplots simply demonstrated the overall patterns of the entire population distribution regarding the measured parameters and provided a simple method to show the variance of nine morphological characteristics among populations (Fig. 2).
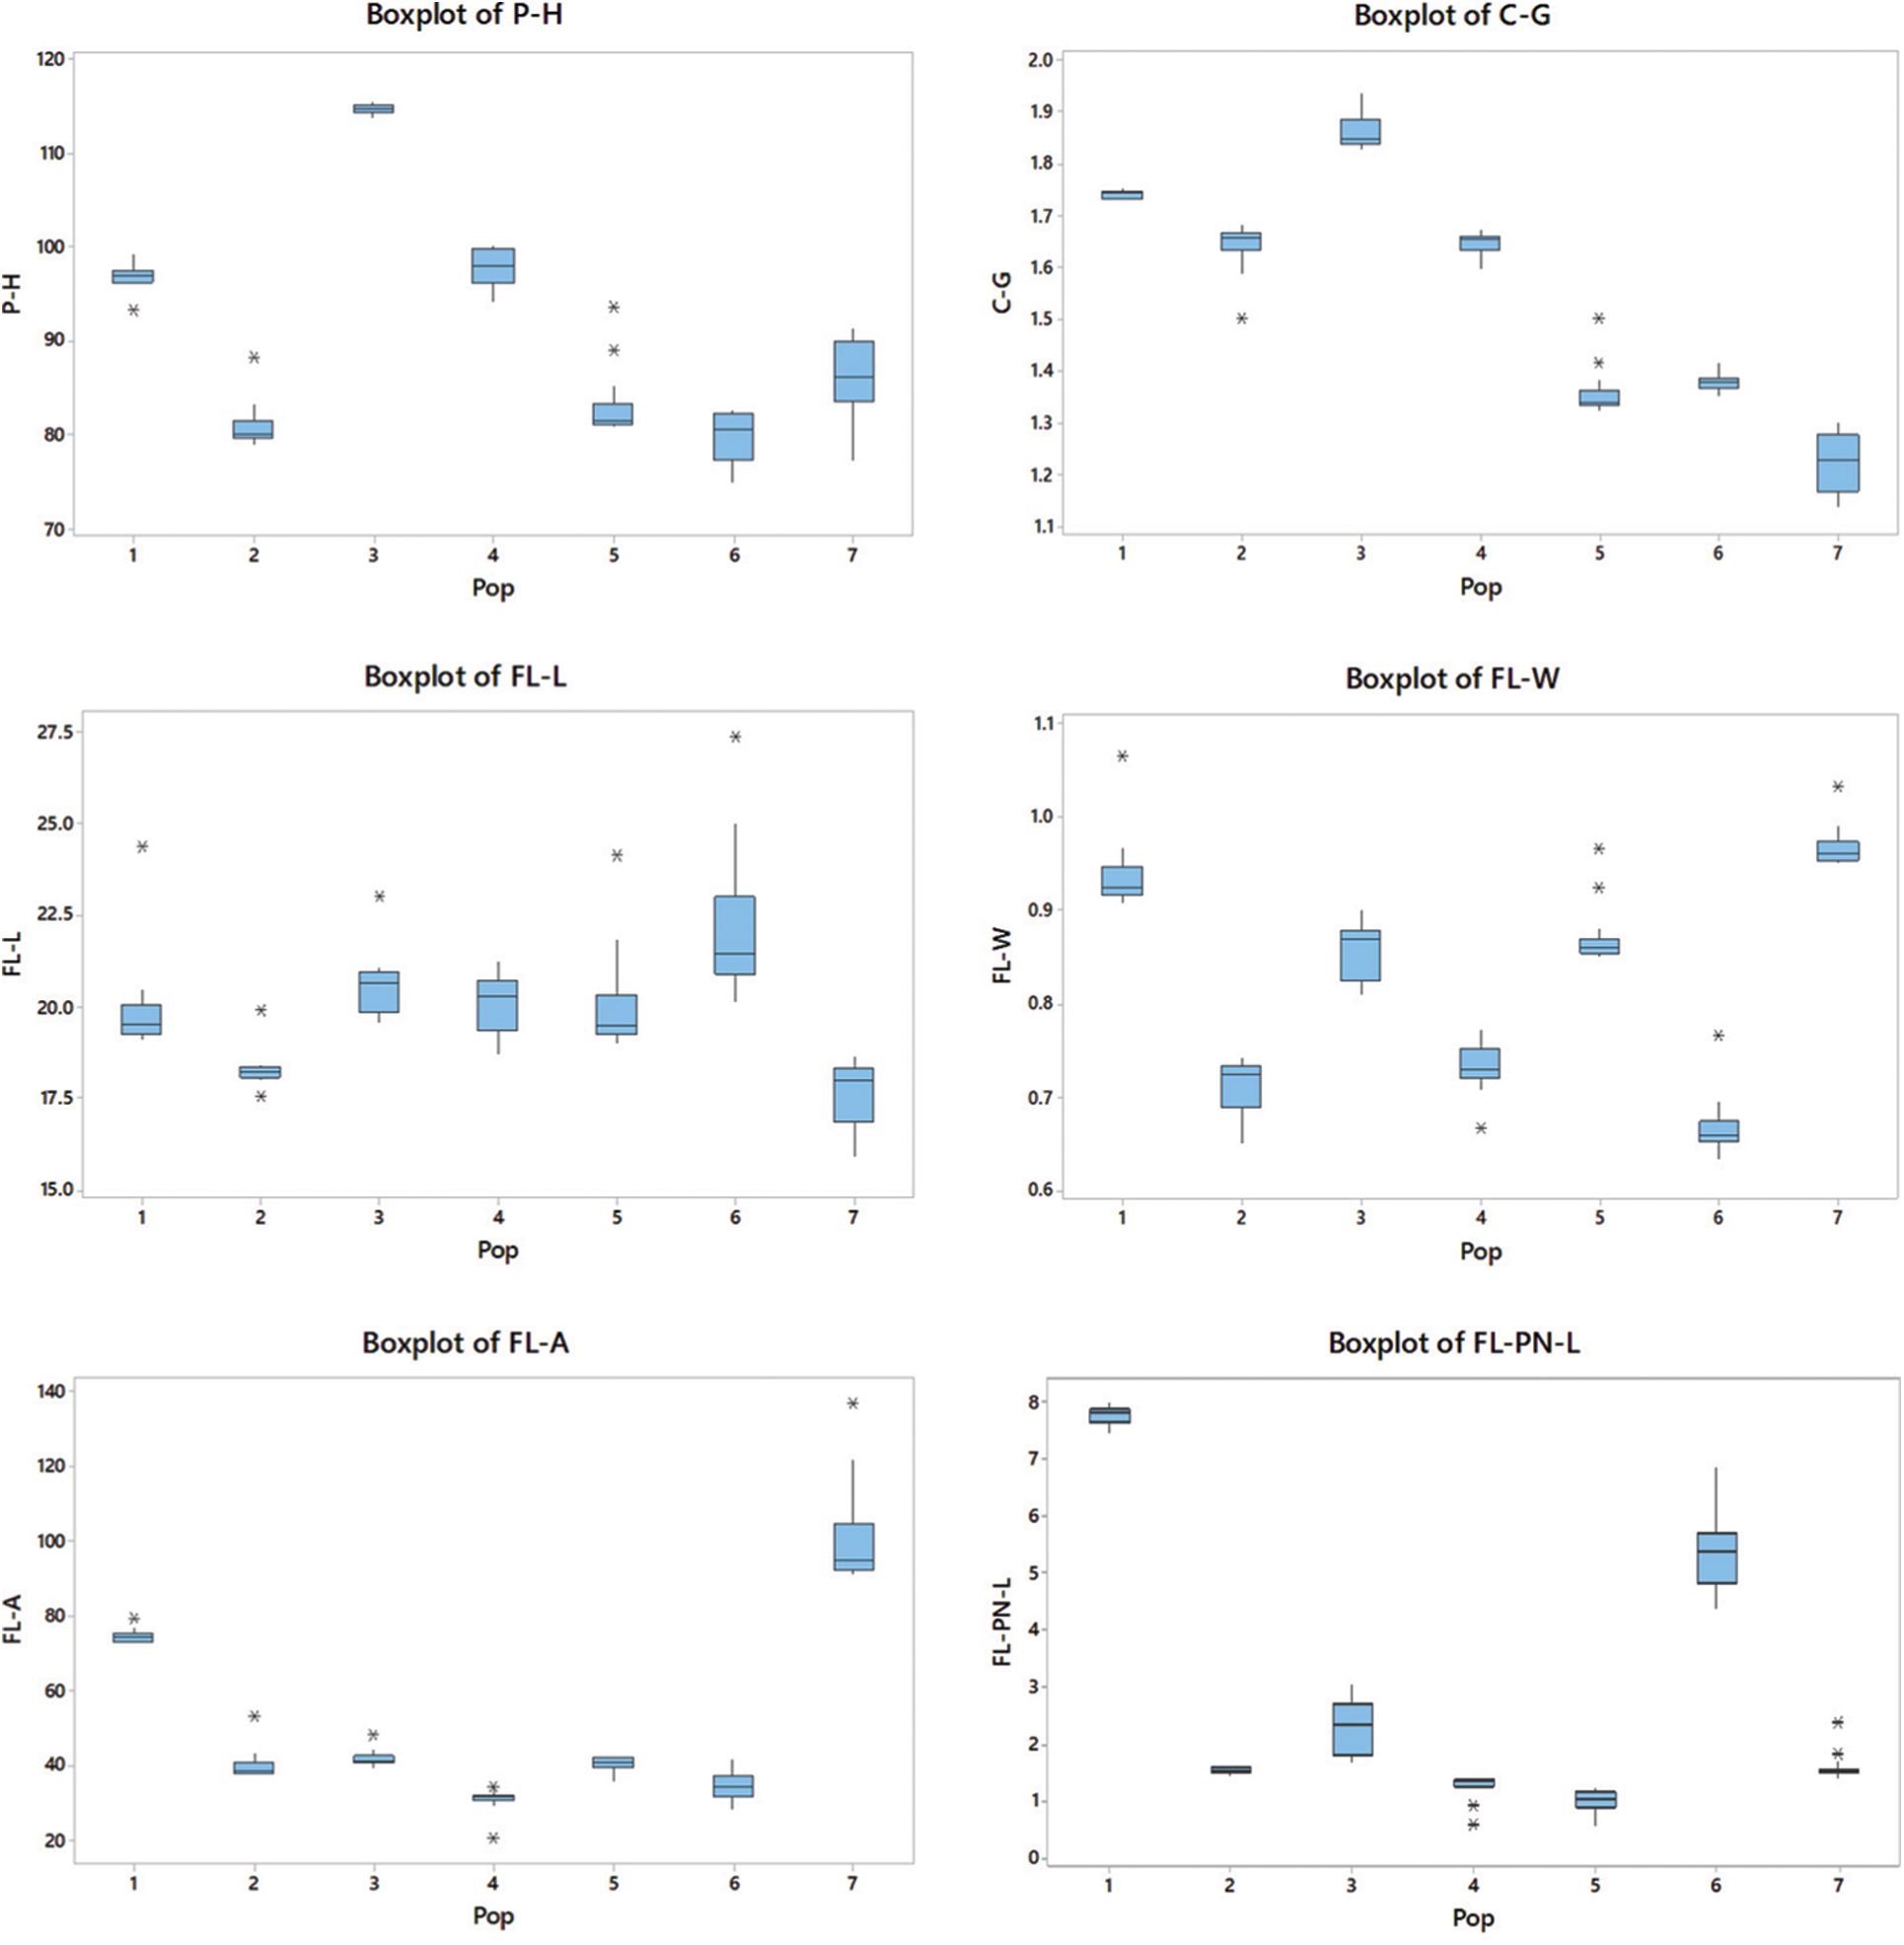
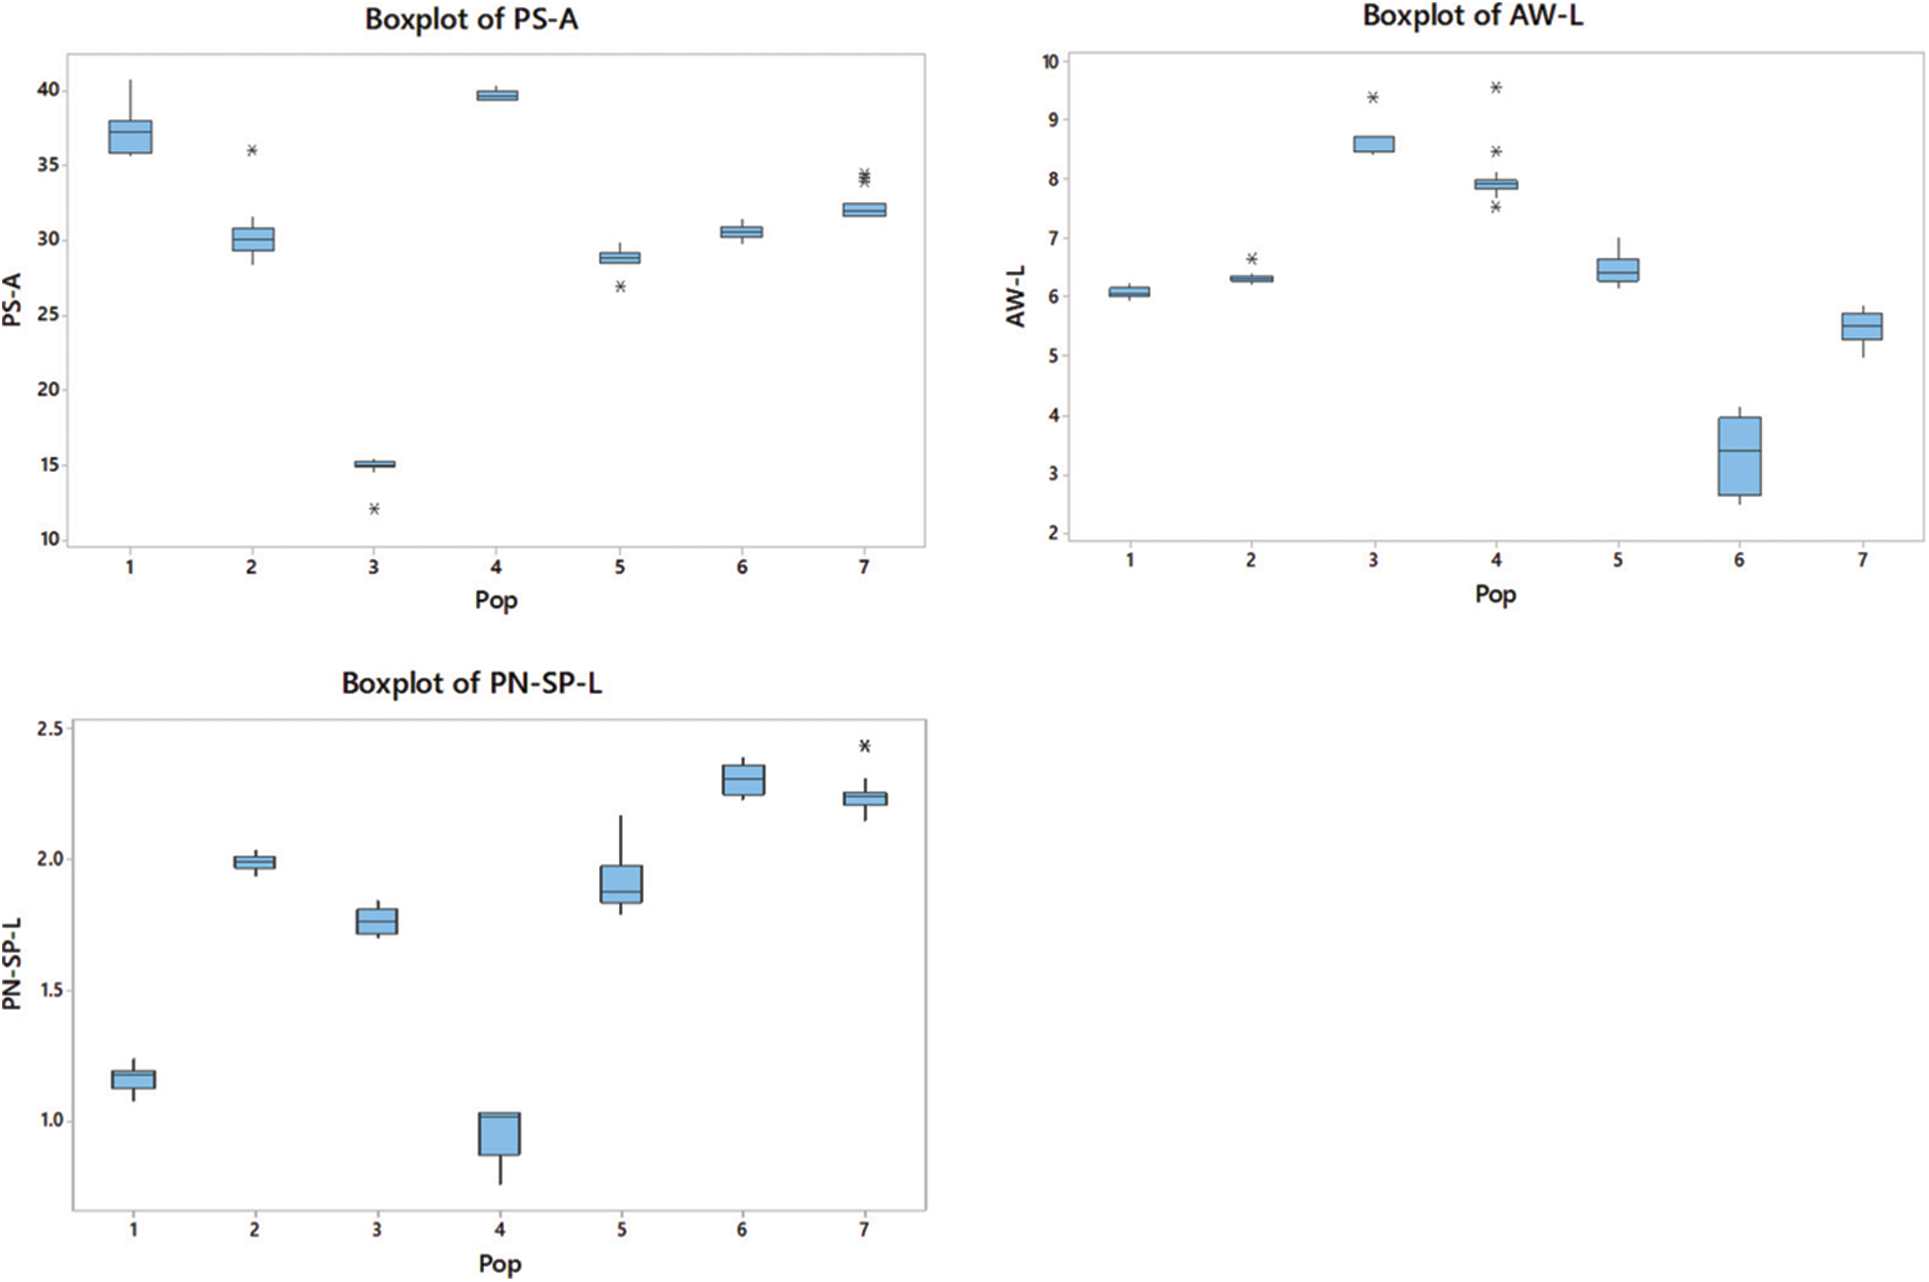
Figure 2: P-H; plant height, C-G; culm girth, FL-L; flag leaf length, FL-W; flag leaf width, FL-A; flag leaf angle, FL-PN-L; flag leaf panicle neck length, PS-A; plant spreading angle, AW-L; awn length and PN-SP-L; panicle neck spikelet length. Outliers are indicated with a star (*). The size of each boxplot indicates the extent of variation in each population in respect of each trait. The upper and lower horizontal lines show the IQR range
3.3 Relationship among Morphological Traits
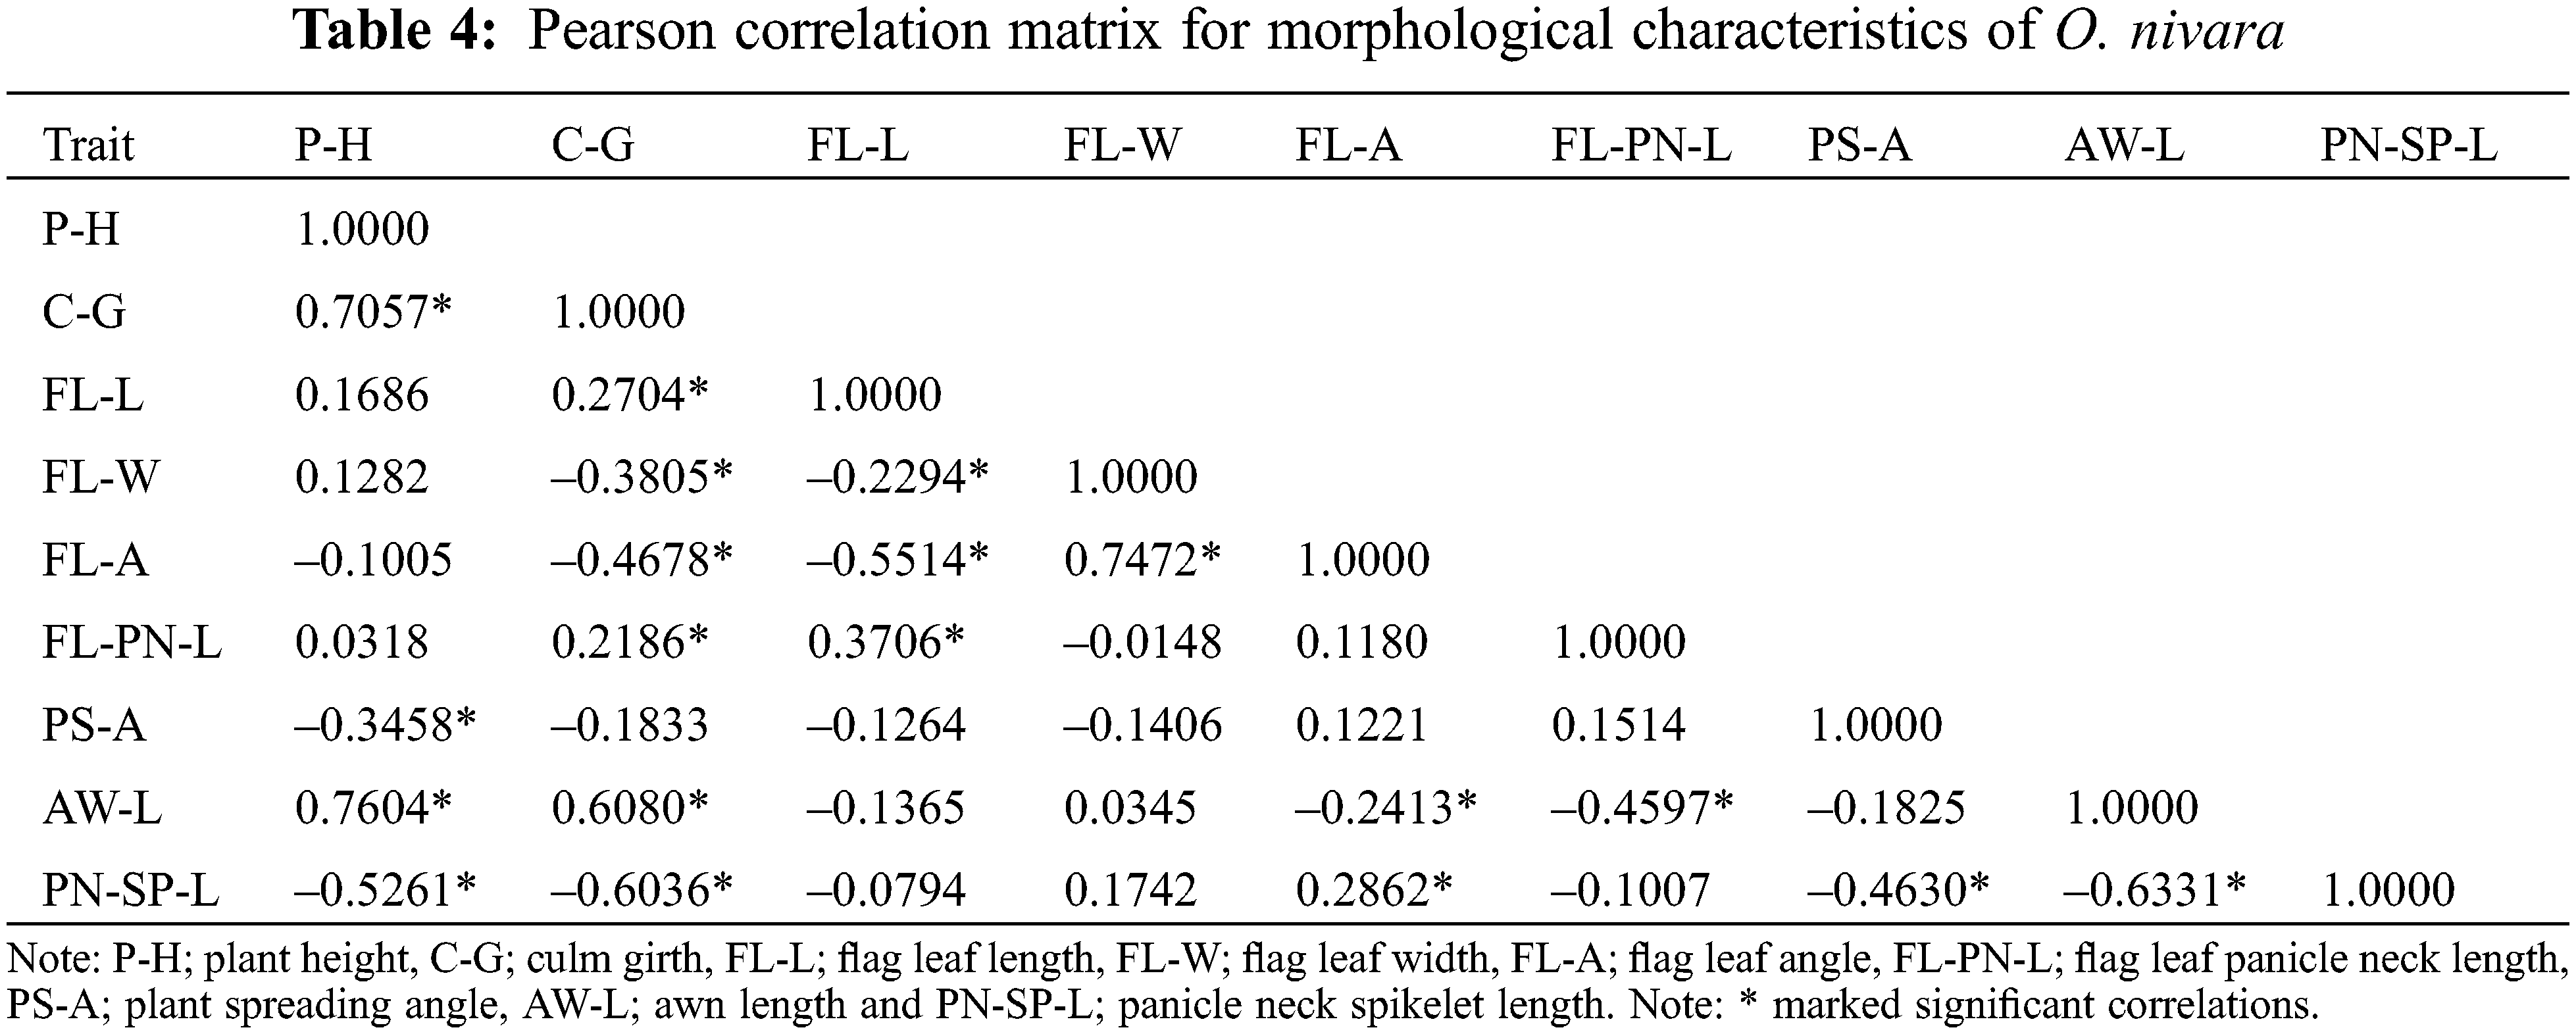
Correlations between parameters evaluated using the Pearson correlation matrix revealed that most of the relationships were statistically significant (P < 0.05; Table 4). The P-H with C-G and AW-L, and FL-A with FL-W, showed a strong positive correlation (r > 0.7), while PN-SP-L with C-G and AW-L showed a strong negative correlation (r > 0.6).
Identification of the genetically closely related populations is critical for the conservation and use of O. nivara populations and their natural habitats. The dendrogram illustrated in Fig. 3 was created using a hierarchical cluster analysis based on morphological variation patterns. Populations designated to one cluster had mostly comparable morphological traits that permitted them to be separated from the rest. Results indicated that four of the seven major clusters showed a similarity value of 99.22 and were the most closely associated populations with strong identification (Fig. 3). Furthermore, the P2 and P5 populations formed the first cluster (similarity level = 99.75). The first cluster with P1 and P4 populations was considered as the first cluster group. The P6 and P3 populations made up the second and third clusters, respectively. Population P7 did not cluster with others indicating the highest morphological difference to the rest.
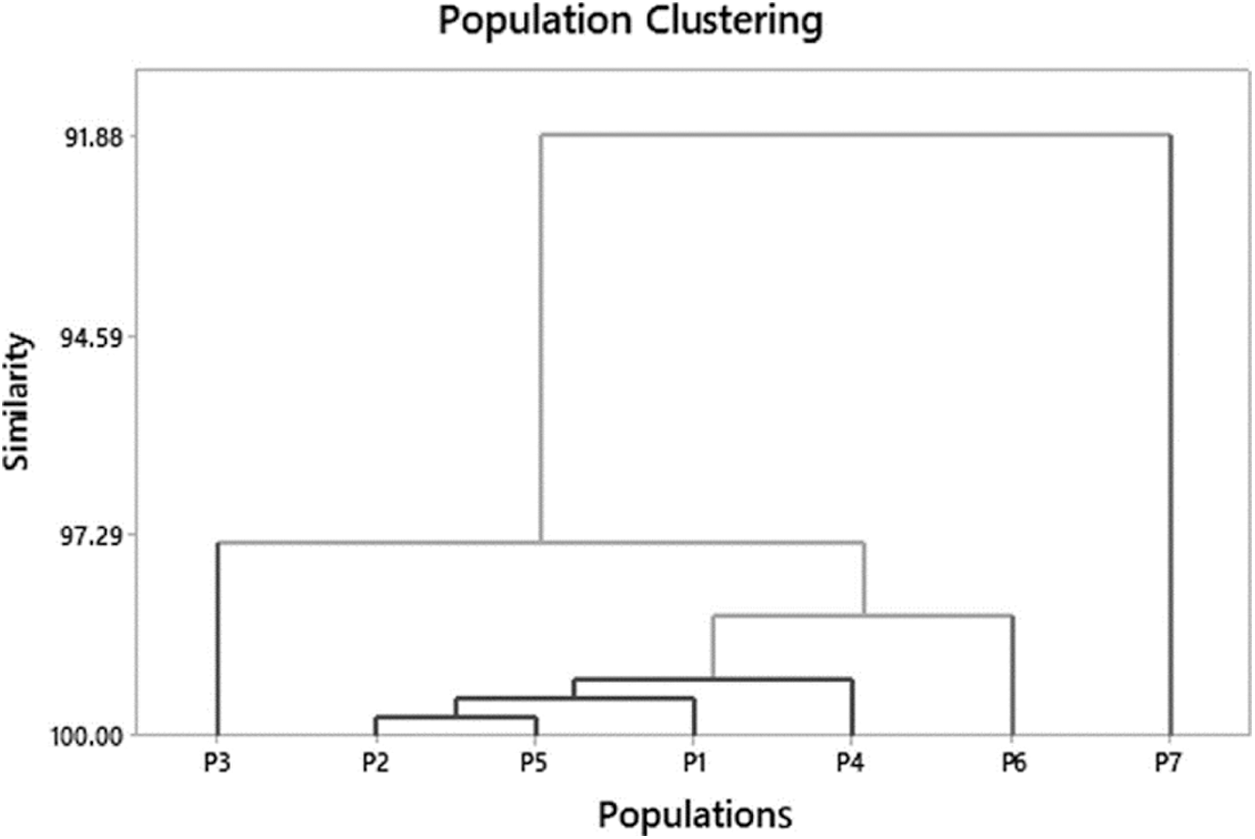
Figure 3: The morphological relationship among the seven O. nivara populations in Sri Lanka
3.4 Grouping of Individuals in Each Population Based on Principal Component Analysis
The results revealed that the cumulative values of the first two principal components explained 58.7% of the total variance (Table 5). The PC1 and PC2 explained 35.7% and 23% of the total variance, respectively. Certain morphological traits of O. nivara populations contributed to group the population parallel to their existing environments. Biplot analysis illustrated the population grouping based on morphological traits was shown in Fig. 4. For example, P7 recorded a relatively higher FL-A and differed with other populations, which was confirmed from the cluster analysis.
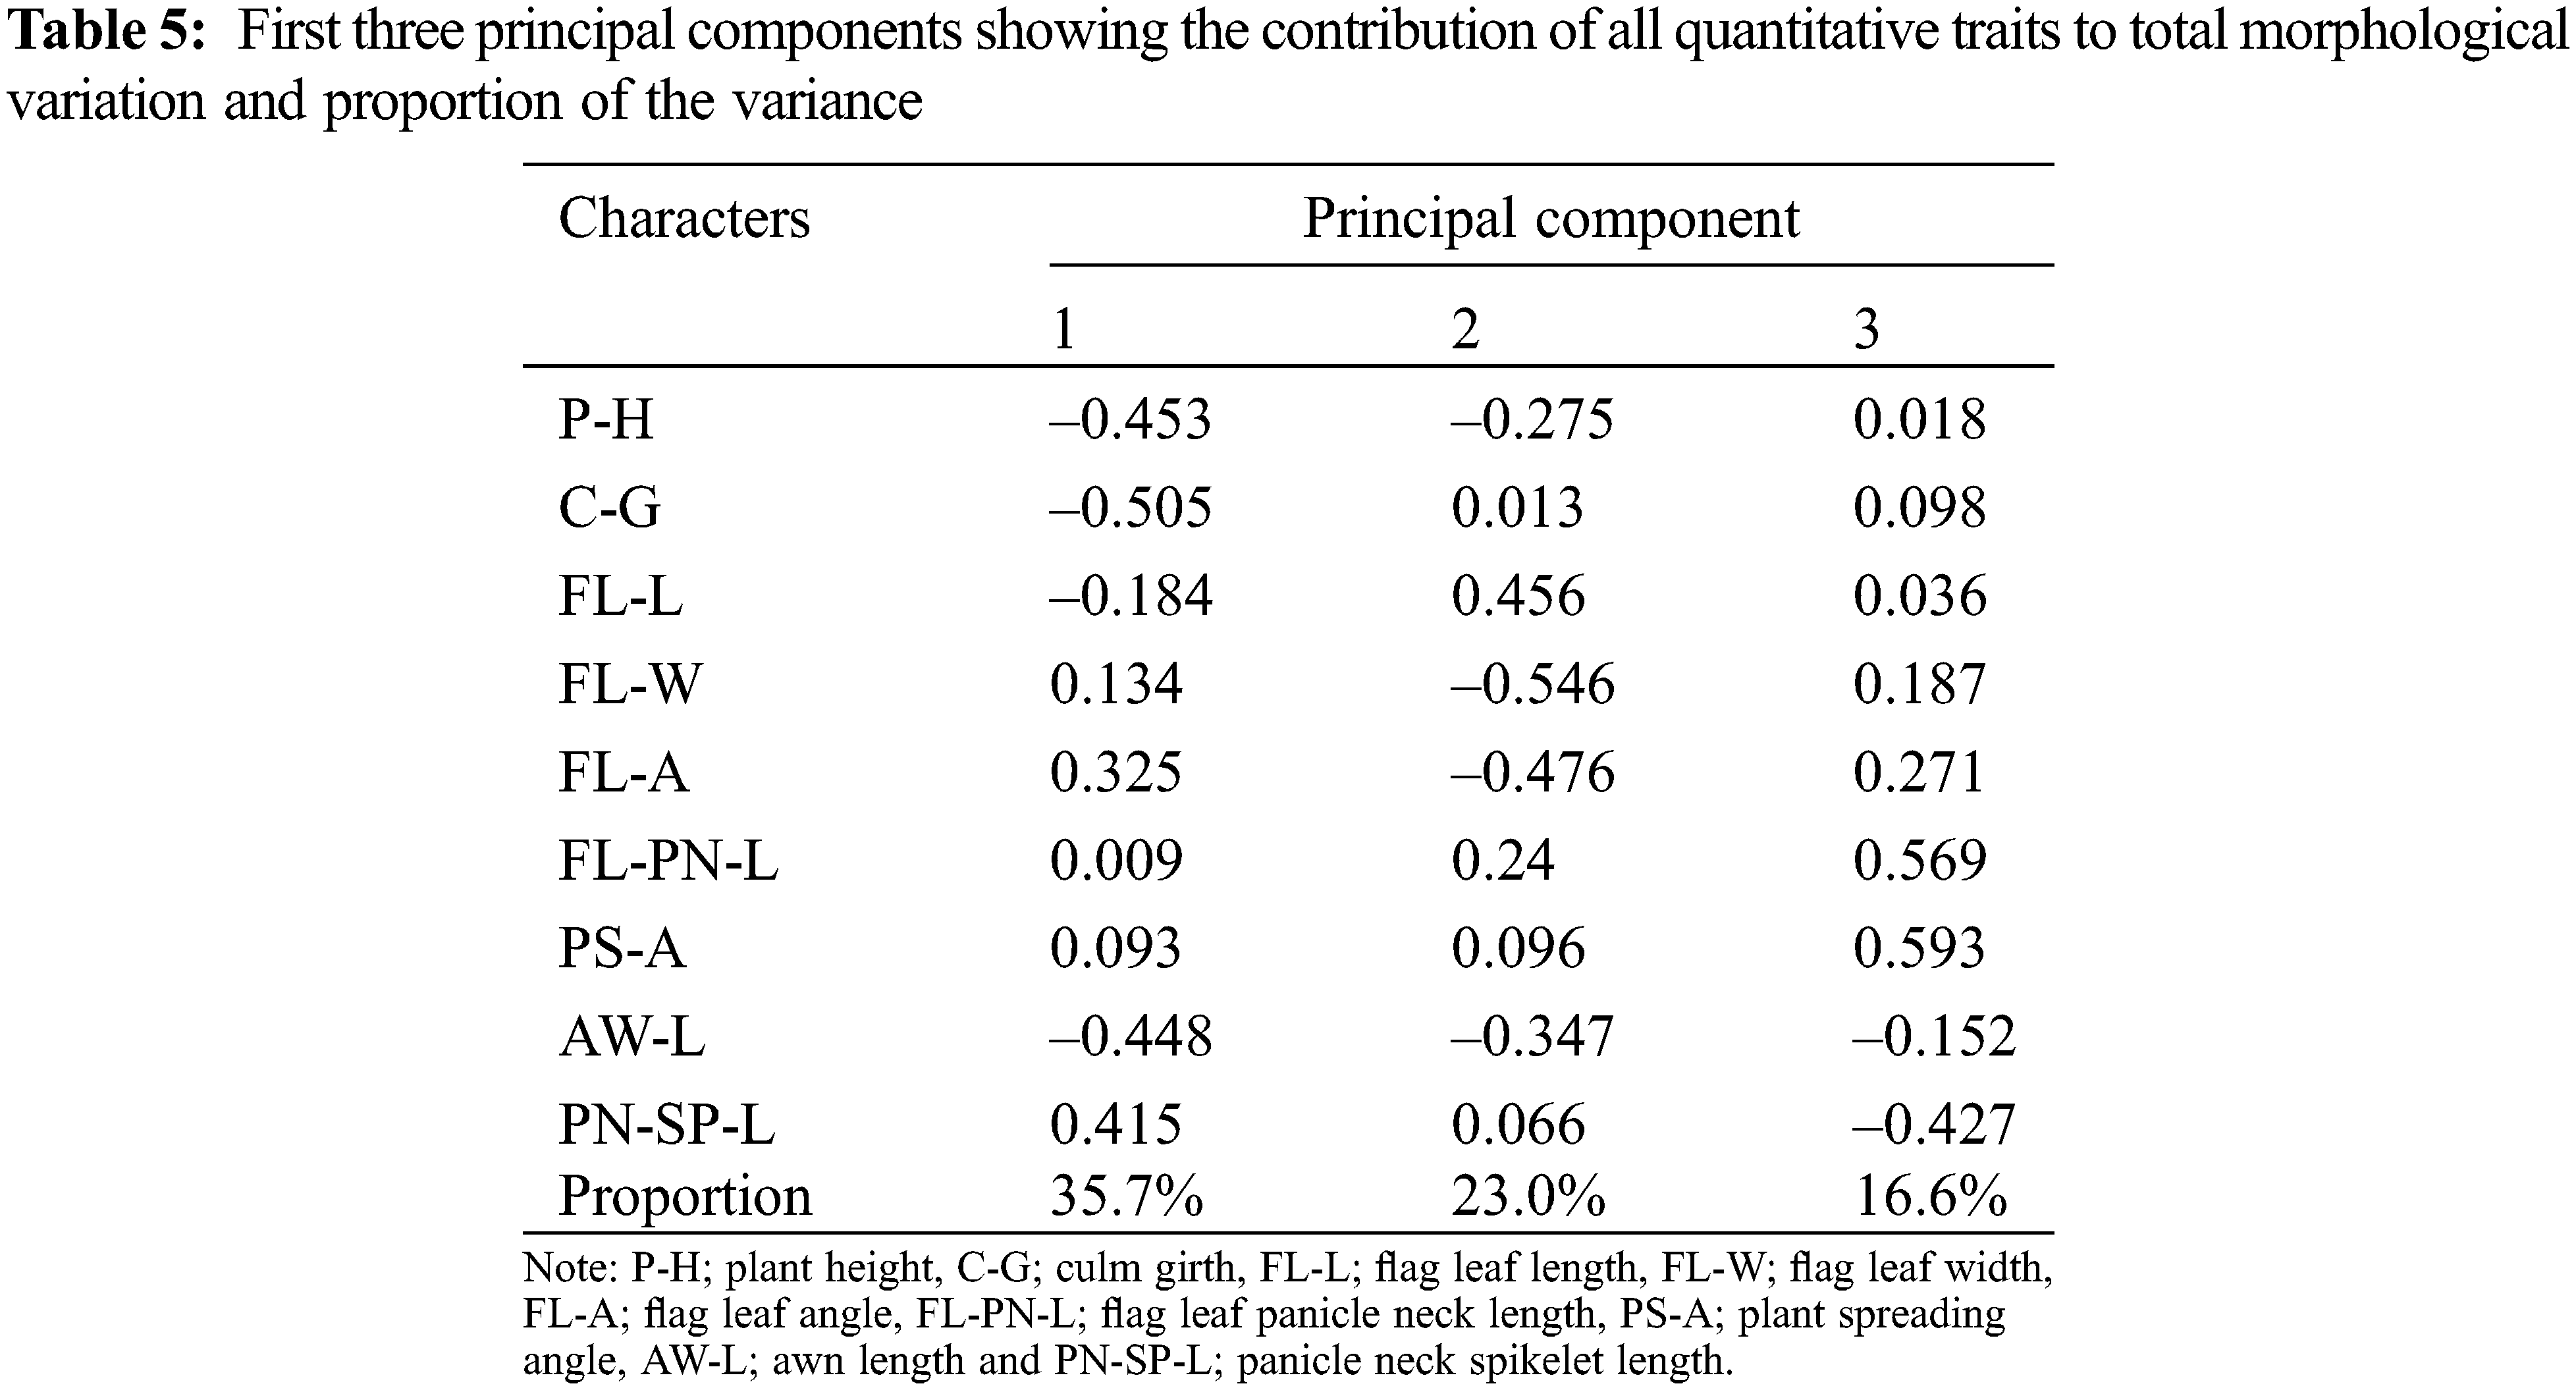
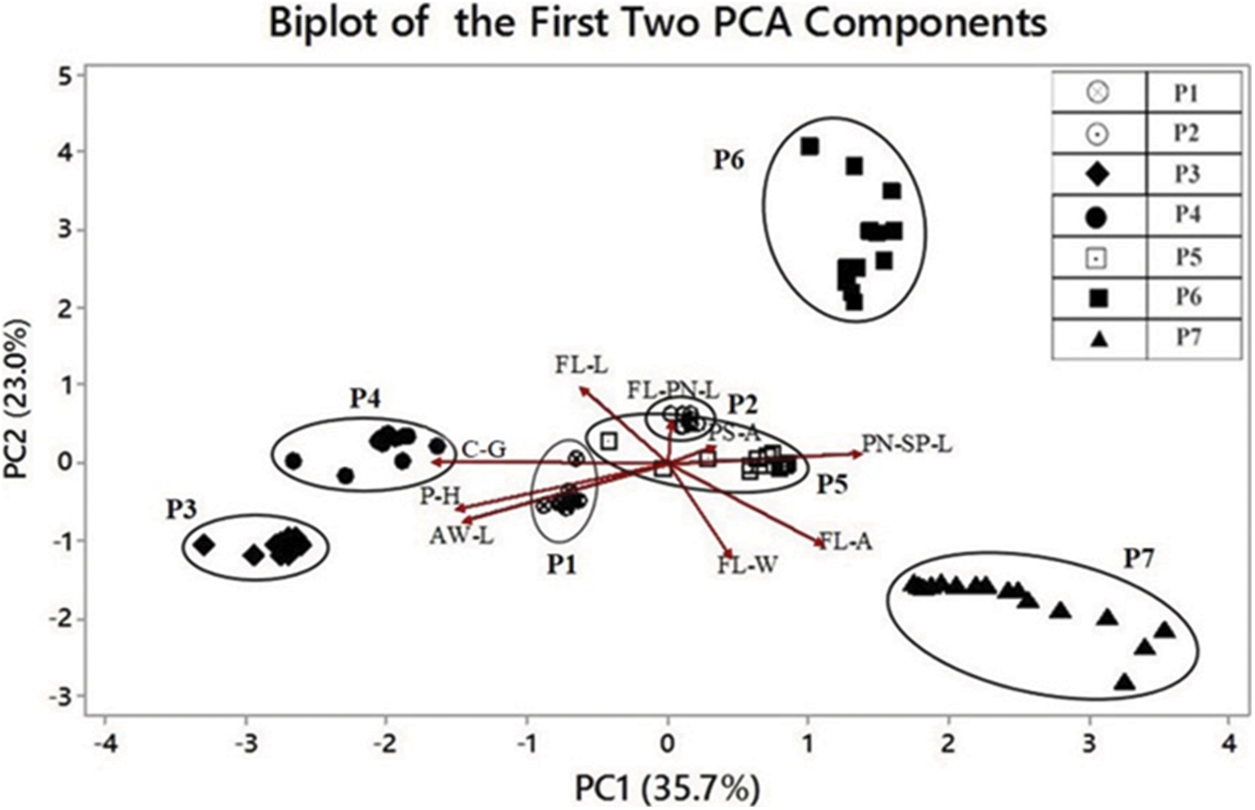
Figure 4: Biplot cluster against the principal component analysis (PC1 on the X-axis and PC2 on the Y-axis). Determination of closely related individuals within and among populations illustrates an overall picture of the variation pattern of O. nivara found in different geographical regions of Sri Lanka
Biplot also showed that some populations are separated clearly while some are overlapped (Fig. 4). The results indicated that P2 and P5 had been grouped as they are strongly associated with their natural habitats. It also further confirmed the results of PCA. Population P7 showed distinct population differentiation from other O. nivara populations based on a different level of variation of plant traits.
4.1 Phenotypic Variation within and among O. nivara Populations in Sri Lanka
Earth’s average temperature is anticipated to rise from 2 to 4.5°C in the Twenty-first Century [45] if no climate actions are implemented globally. The frequency of stress spells, their effect on daily life, and damage to agricultural crops are used to evaluate the impact of climate change and environmental variation, which will eventually disrupt the ecosystem [46]. The changing pattern of climatic factors, specifically rainfall and temperature, are primary sources affecting crop yields, thus making, developing countries with marginal inputs highly vulnerable. New climate-smart crop cultivars must be developed to address these constraints and ensure food security [47]. As a result, abiotic stressors significantly impact plant growth and yield; high rainfall occurrences may generate floods, while shortage or lack of rainfall over an extended length of time causes drought pressures [48]. There are growing concerns about the quick changes in climatic conditions because adverse weather significantly impacts food security and agricultural productivity. Cropping systems face exacerbated climate impacts with low diversity and high input concentrations and unpredictable crop production owing to environmental changes [49]. More frequent droughts and heavy rains, temperature fluctuations, salinity, and insect pest attacks are imminent, all of which will reduce agricultural yields and raise the risk of starvation [50].
This study emphasized the influence of weather variations on crop wild relatives (CWRs) and its effects on rice genetic resources. Thus, their morphological adaptation to cope with extreme environmental conditions was evaluated for developing climate-smart rice cultivars as the present crop cultivars vary greatly from their wild relatives in terms of phenotypic characteristics. Domestication bottleneck may also increase phenotypic uniformity [51], resulting in consistent phenotypes across environments [52,53]. Agricultural performance may benefit from phenotypic consistency [53]. Plants change their phenotypes in response to their environment. Although formerly thought to be ambient noise, it is now apparent that (adaptive) phenotypic plasticity involves modifications to exhibit functionally relevant phenotypes under different situations [54]. Consequently, the significance of phenotypic plasticity in crop plant adaptation to environmental variation is yet to be determined.
The current findings identified a location-specific high phenotypic diversity among populations compared to within populations of the CWR of rice, O. nivara (Table 3), in line with the previous studies reported [40,55]. Results also revealed that the morphological variation of O. nivara was not evenly scattered. The FL-PN-L and FL-A were the most variable traits for O. nivara in Sri Lanka. High population-based morphological variations were previously reported in other Oryza species in Sri Lanka, but no association was found between those traits and eco-geography [15]. The within-population variation for FL-L showed a relatively higher variation than that of among populations. For example, FL-L variation of the P6 population revealed a higher CV (9.5%) than that of among populations (7.57%) because the phenotypic investigation of this study contained ample sample size to deliver the vital messages on a morphological variation of plant traits. Moreover, O. nivara exhibits annual growth habit, early leaf senescence and photoperiod insensitivity, higher inbreeding percentage and continuous flowering [55,56]. Stigmas and anthers are shorter, and panicles are more inserted and close for self-pollination (field observation). Therefore, the within-population diversity is generally lower than that of among populations [57].
Oryza nivara is closely related to domesticated crop species, O. sativa. Therefore, it should be given special attention to producing crop varieties that are more tolerant and adaptive to climate change using the prevailing diversity of the natural populations. Furthermore, many species exhibit phenotypic plasticity, indicating that individuals may change their phenotypes in response to their surroundings [58]. When individuals modify their phenotypes across settings in the direction of selection, phenotypic plasticity can be adaptive and enhance fitness across diverse landscapes [59]. Many species are plastic in response to environmental factors. However, scientists do not know whether these plastic modifications benefit under changing climates or are harmful in most situations. Further, adaptive behavioral plasticity in breeding phenology promotes long-term population survival and those populations would be considerably more sensitive to climatic change if plasticity did not exist [60].
4.2 Diversity and Relationships of Morphological Traits
Morphological characteristics have been used as an effective method for determining the genetic diversity of plant genetic resources [61]. Our results showed the morphological variation that existed within and among populations of O. nivara in Sri Lanka (Table 3). Some traits measured in this study were significantly different (P < 0.05) among populations, and high variance reflected its ability to adapt to a particular habitat resulting in high diversification [16,55]. Plant height is one of the most important traits having the ability to capture more sunlight [62,63]. Results revealed that P5 and P7 populations that grew with other shrubs and weeds had a high variance in plant height. However, the variance for P-H of P5 and P7 populations was not significantly different (P > 0.05).
Most of the phenotypic differences of O. nivara can be seen in their responses to existing in natural habitats [55]. For instance, vigorous plant growth with the greatest P-H, C-G and AW-L showed in the P3 population from the intermediate zone in Kurunegala district. The higher annual rainfall, suitable soil condition and favourable environment of the intermediate zone (Table 1) in comparison to the dry zone would have resulted in superior development of O. nivara in the intermediate zone [64]. Plants in P3 may also resist pest attacks because of their AW-L compared to other populations [65]. The P2 population was slightly morphologically different from the P6 population (Fig. 3), and both P2 and P6 populations were in the coastal line in the dry zone. However, the highest FL-L was recorded in P6, indicating that these plants are adapted to dry environments [66]. Thus, plants have been morphologically adapted for dry, saline conditions and high temperatures to conserve water for survival by reducing P-H, FL-A, and FL-W, suggesting their adaptation of populations for dry environments [36,55]. However, the P7 population from Siyambalanduwa recorded the highest FL-W and FL-A to intercept more sunlight in competition with weeds and other shrubs [67]. However, the heterogeneous light environment inside a plant canopy results in a range of stress effects for leaves. The adaptation of leaf features to the light gradient [68] from the top to the bottom of the canopy, mostly during leaf creation [69], is one expression of plant phenotypic plasticity. The specific leaf area (SLA, ratio between leaf area and leaf dry mass) is one of the most important morphological features that varies in response to light differences. The SLA plasticity implies morphogenetic regulation of leaves, which prefers to expand leaf area in the shade to intercept more light, although there is a genetic or physiological limitation to total leaf volume as well as a resource limitation [70]. The P7 population was collected from a forest area, scattered as patches, and showed a mixed-growing with other shrubs and weeds (Table 1). However, they were subjected to stress conditions due to competition from other plants. Therefore, plants tend to adjust phenotypically to tolerate the stress conditions [71]. The P1 population in Maradankadawala had the highest value for FL-PN-L as an adaptation to frequent flooding in this habitat [72]. Similar geographically adaptive characteristics have been reported recently [55]. However, the morphological traits measured in this study follow the same ranges reported in IRRI records in species identification. Oryza nivara is possibly more appropriate for seasonally dry habitats [55] because of the high mean annual temperature and low precipitation in those regions.
Furthermore, studies on gene expression are essential as it is determined by environmental and genetic factors and varies extremely among populations or species, individuals and within individuals [73]. The influence of local ecological conditions on the genotypic composition of landraces, as well as the close relationship between agroecological factors and plant morphological variation, has previously been explained [74]. Additionally, plasticity may be adaptive in parts of the range subject to temporal fluctuation in environmental circumstances. Moreover, maladaptive or absent in parts of the range subject to less changeable conditions [75]. Few studies have looked into how much plasticity varies intra specifically across the environments [76].
4.3 Implications for the Origin and Adaptation of O. nivara
The higher level of genetic differentiation among populations in O. nivara over O. rufipogon across different geographies has been well documented [34,36,77]. Similar patterns of morphological variation observed in this study could be attributed to population adaptation to specific environments, exacerbated by habitat fragmentation [33]. Commonly, O. nivara in Sri Lanka was found on the edge of ponds, tanks, and beside streams and grown in shallow waters [39,42]. Furthermore, O. nivara is found in disturbed habitats, whereas O. rufipogon occupies comparatively stable habitats around the globe [78]. Reports highlighted the same phenomenon of ecological adaptation that O. nivara habitats have significantly reduced in their scale and size due to agriculture and urbanization [79]. Inbreeding is expected in isolated and small populations, contributing to increasing the genetic differentiation among populations. Further, the presence of a high level of population differentiation in O. nivara, explained in terms of different degrees of BPH resistances among populations, has been reported previously [80].
Many studies have suggested modifications in the life history of O. nivara populations associated with their habitats [41]. Much evidence has shown that O. nivara shifted from persistently wet areas where it originated to seasonally dry areas to adapt to a new environment [33,34,36,81]. In order to adapt to the dry and stressful conditions encountered during this process, phenotypic changes such as shorter life cycles and sexual reproduction may be encouraged. Our results indicated that vigorous plants are found in the P3 population from the intermediate zone (Fig. 1, Table 2). However, O. nivara plants from the dry zone also showed adaptive morphological changes for dry and stressful conditions (Table 1), consistent with previous studies [11,33] that found differentiation of morphology, life cycle, and reproductive system to facilitate plant adaptation to diverse habitats conditions.
Lu et al. [82] reported that O. nivara is mostly confined to dry habitats with a pronounced dry season but has not been recorded in more moist, western parts of Myanmar. Our study reported that the morphological characters are significantly different among O. nivara populations in specific parameters (Table 2), reflecting the ability of ecological adaptation of this wild species because shorter plant height, small culm girth, and erect culm are related to adaptation of O. nivara to dry habitats (Fig. 2). Results of our study also supported the assumption of migration of O. nivara from wet regions to dry habitats in the country [34]. Some of the morphological differences among seven O. nivara populations can be seen as responses to the differences in their genome characters, life cycle, habitat and breeding system [72]. Climate change has the potential to have a significant impact on some natural populations and enhance the risk of extinction for several native species [83]. As a result, researchers propose that future research should use cross-disciplinary integration to examine climate adaptation in a broader range of species. More research is urgently required to produce climate-adaptive crops [84]. The CWRs have a high genetic diversity and can contribute to new genetic diversity for agricultural sustainability [85]. For instance, previous research has indicated that several recently discovered wild rice species in northern Australia have unique alleles for distinct critical traits, which could improve the ability of cultivated rice to withstand climate change [86]. The ability of the same species to display distinct features under different environmental situations is referred to as phenotypic plasticity. A plastic developmental program enables species to detect environmental signals early and produce phenotypes that are more suited to later-life situations. This is frequently used as an adaptive approach for surviving in diverse environments, as long as the plastic reaction is sufficiently rapid, precise, and not too expensive. Despite the direct costs of sustaining plasticity and developing phenotypes, the predictability of the future environment based on environmental signals obtained throughout development is a primary restriction on the utility of phenotypic plasticity of crop wild relatives.
Habitat-specific populations are grouped (Table 1). Both P2 and P5 populations are from similar natural habitats with approximately similar ecological conditions (mean annual temperature and rainfall) (Table 1) of the dry zone and located relatively closer in proximity than other populations (Fig. 1). Sandamal et al. [34] reported a similar clustering pattern according to their genetic basis. Furthermore, P1 and P4 populations were genetically close populations, and they were closely clustered on the basis of the expression of their phenotype. However, genetically very close populations [34], namely P6 and P7, clustered separately based on their morphological differences. The P7 population separated from all populations having the lowest C-G, FL-L and the highest FL-A and FL-W because of its adaptation to shade environment. Additionally, the P1 and P7 populations were also differentiated from the rest (Fig. 3).
Populations from different natural habitats did not cluster together. Morphological adaptation based on habitat specificity is critical for the preserving and long-term usage of the primary gene pool. For O. nivara conservation, our results suggest that four out of seven populations should be monitored closely, whereas P1, P3, and P7, as well as one population from P2, P4, P5, and P6, may be utilized for conservation. Contrary to these findings, a population genetic structure study has reported considerable genetic diversity in a particular population [34]. Therefore, further investigations on their morphology, genetic and genomics levels are required to identify populations necessary to give immediate conservation priorities. In addition, O. nivara has undergone and still undergoing ecological speciation [55]. In Sri Lanka, most of the O. nivara populations can be seen in disturbed habitats [78]. Even in closely related populations, changing environmental circumstances might have affected this CWR adapting to various geographical areas in Sri Lanka. However, natural populations may be able to adapt to changing conditions due to existing plasticity [87], but this plasticity may be insufficient when individuals face future climates that are outside the range of existing environmental variation [88].
The genetic diversity of O. nivara in Sri Lanka was assessed using their natural populations. A high degree of variability was detected in most of the quantitative traits recorded. The most variable traits were the FL-PN-L and FL-A, whereas the least variable trait was the FL-L. The P7 population, which was collected from a forest area, was adapting to percept more sunlight by increasing FL-W and FL-A while growing with weeds and other shrubs, while P2 and P5 were the most closely related populations among those evaluated. Both P2 and P5 populations were from the same natural habitat in the dry zone with similar ecological conditions in the dry zone. The P3 population from the intermediate zone showed vigorous plant growth with the highest P-H, C-G and AW-L. Genotypic diversity depends on the specificity of the natural habitats and occurs due to morphological variations. The knowledge gained on the diversity of the country specific rice germplasm enhances the conservation efforts of valuable genetic resources, which can be utilized in developing climate-smart cultivars.
Acknowledgement: The authors extend their sincere appreciation to the Department of Agricultural Biology, Faculty of Agriculture, University of Ruhuna and Taif University Researchers Supporting Project Number (TURSP-2020/59), Taif University, Taif, Saudi Arabia.
Funding Statement: This research was financially supported by the National Research Council (Grant No. NRC 15-108) and the National Science Foundation of Sri Lanka. Taif University Researchers Supporting Project Number (TURSP-2020/59), Taif University, Taif, Saudi Arabia.
Conflicts of Interest: The authors declare that they have no conflicts of interest to report regarding the present study.
1. Samal, R., Roy, P. S., Sahoo, A., Kar, M. K., Patra, B. C. et al. (2018). Morphological and molecular dissection of wild rices from eastern India suggests distinct speciation between O. rufipogon and O. nivara populations. Scientific Reports, 8(1), 1–13. DOI 10.1038/s41598-018-20693-7. [Google Scholar] [CrossRef]
2. Khush, G. S. (1997). Origin, dispersal, cultivation and variation of rice. Plant Molecular Biology, 35(1–2), 25–34. DOI 10.1023/A:1005810616885. [Google Scholar] [CrossRef]
3. Sang, T., Ge, S. (2007). The puzzle of rice domestication. Journal of Integrative Plant Biology, 49(6), 760–768. DOI 10.1111/j.1744-7909.2007.00510.x. [Google Scholar] [CrossRef]
4. Zhang, H., Hou, D. P., Peng, X. L., Shao, S. M., Jing, W. J. et al. (2019). Optimizing integrative cultivation management improves grain quality while increasing yield and nitrogen use efficiency in rice. Journal of Integrative Agriculture, 18(12), 2716–2731. DOI 10.1016/S2095-3119(19)62836-4. [Google Scholar] [CrossRef]
5. Gaikwad, K. B., Singh, N., Kaur, P., Rani, S., Babu, H. P. et al. (2021). Deployment of wild relatives for genetic improvement in rice (Oryza sativa). Plant Breeding, 140(1), 23–52. DOI 10.1111/pbr.12875. [Google Scholar] [CrossRef]
6. Mishra, A., Kumar, P., Shamim, M., Tiwari, K. K., Fatima, P. et al. (2019). Genetic diversity and population structure analysis of Asian and African aromatic rice (Oryza sativa L.) genotypes. Journal of Genetics, 98(3), 1–19. DOI 10.1007/s12041-019-1131-0. [Google Scholar] [CrossRef]
7. Sandamal, S., Tennakoon, A., Ratnasekera, D. (2018). Habitat fragmentation and isolation-by-distance driven population divergence of Oryza rufipogon in Sri Lanka. International Forestry and Environment Symposium, pp. 43,Sri Lanka: University of Sri Jayewardenepura. [Google Scholar]
8. Tennakoon, A., Sandamal, S., Ratnasekera, D. (2018). Genetic structure of common wild rice (Oryza nivara) populations from Sri Lanka. 4th International Research Symposium, pp. 160.Rajarata University of Sri Lanka. [Google Scholar]
9. Tennakoon, A., Sandamal, S., Wijerathna, P., Ratnasekera, D. (2020). Origin, evolution and genetic basis of weedy rice in Sri Lanka. International Conference on Emerging Trends in Biotechnology, pp. 43.India: Vellore Institute of Technology. [Google Scholar]
10. Tennakoon, A., Sandamal, S., Ratnasekera, D. (2020). Genetic diversity of selected Sri Lankan traditional rice (Oryza sativa L.) varieties. International Symposium on Agriculture and Environment, pp. 76. Sri Lanka: University of Ruhuna. [Google Scholar]
11. Vaughan, D. A., Morishima, H., Kadowaki, K. (2003). Diversity in the Oryza genus. Current Opinion in Plant Biology, 6, 139–146. DOI 10.1016/S1369-5266(03)00009-8. [Google Scholar] [CrossRef]
12. Tiwari, S., Yadav, M. C., Dikshit, N., Yadav, V. K., Pani, D. R. et al. (2020). Morphological characterization and genetic identity of crop wild relatives of rice (Oryza sativa L.) collected from different ecological niches of India. Genetic Resources and Crop Evolution, 67, 2037–2055. DOI 10.1007/s10722-020-00958-9. [Google Scholar] [CrossRef]
13. Vaughan, D. A. (1994). The wild relatives of rice: A genetic resources handbook. Los Banos, Philippines: International Rice Research Institute. [Google Scholar]
14. Sandamal, P. S., Tennakoon, A., Amarasekera, D. A. B. N., Marambe, B., Rathnasekera, D. (2021). Functional trait diversity of wild rice species in Sri Lanka: Implications for field identification and application. Journal of the National Science Foundation of Sri Lanka, 49(3),369–382. DOI 10.4038/jnsfsr.v49i3.10223. [Google Scholar] [CrossRef]
15. Sandamal, S., Tennakoon, A., Ratnasekera, D., Amarasekera, D. A., Marambe, B. (2018). Eco-geographic variation of common wild rice-Oryza rufipogon Griff. in Sri Lanka. Plantae Scientia, 1(2), 36–43. DOI 10.32439/ps.v1i02.36-43. [Google Scholar] [CrossRef]
16. Tennakoon, A., Sandamal, S., Ratnasekera, D., Amarasekera, D. (2019). Study on morphological traits of wild rice species collected from different agro-ecological regions of Sri Lanka. International Symposium on Agriculture and Environment, pp. 88. Faculty of Agriculture, University of Ruhuna. [Google Scholar]
17. Ge, S., Sang, T., Lu, B. R., Hong, D. Y. (1999). Phylogeny of rice genomes with emphasis on origins of allotetraploid species. Proceedings of the National Academy of Sciences of the United States of America, 96(25), 14400–14405. DOI 10.1073/pnas.96.25.14400. [Google Scholar] [CrossRef]
18. Zhu, Q., Ge, S. (2005). Phylogenetic relationships among A-genome species of the genus Oryza revealed by intron sequences of four nuclear genes. New Phytologist, 167(1), 249–265. DOI 10.1111/j.1469-8137.2005.01406.x. [Google Scholar] [CrossRef]
19. Brar, D. S., Khush, G. S. (2018). Wild relatives of rice: A valuable genetic resource for genomics and breeding research. In: The wild Oryza genomes. pp. 1–25. Cham: Springer. [Google Scholar]
20. De, S. (2021). Strategies of plant biotechnology to meet the increasing demand of food and nutrition in India. International Annals of Science, 10(1), 7–15. DOI 10.21467/ias.10.1.7-15. [Google Scholar] [CrossRef]
21. Kumar, P. N., Sujatha, K., Laha, G. S., Rao, K. S., Mishra, B. et al. (2012). Identification and fine-mapping of Xa33, a novel gene for resistance to Xanthomonas oryzae pv. oryzae. Phytopathology, 102, 222–228. DOI 10.1094/PHYTO-03-11-0075. [Google Scholar] [CrossRef]
22. Eizenga, G. C., Prasad, B., Jackson, A. K., Jia, M. H. (2013). Identification of rice sheath blight and blast quantitative trait loci in two different O. sativa/O. nivara advanced backcross populations. Molecular Breeding, 31, 889–907. DOI 10.1007/s11032-013-9843-y. [Google Scholar] [CrossRef]
23. Muduli, L., Pradhan, S. K., Mishra, A., Bastia, D. N., Samal, K. C. (2021). Understanding brown planthopper resistance in Rice: Genetics, biochemical and molecular breeding approaches. Rice Science, 28(6), 532–546. DOI 10.1016/j.rsci.2021.05.013. [Google Scholar] [CrossRef]
24. Kumar, K., Sarao, P. S., Bhatia, D., Neelam, K., Kaur, A. et al. (2018). High-resolution genetic mapping of a novel brown planthopper resistance locus, Bph34 in Oryza sativa L. X Oryza nivara (Sharma & Shastry) derived interspecific F 2 population. Theoretical and Applied Genetics, 131(5), 1163–1171. DOI 10.1007/s00122-018-3069-7. [Google Scholar] [CrossRef]
25. Swamy, B. M., Kaladhar, K., Reddy, G. A., Viraktamath, B. C., Sarla, N. (2014). Mapping and introgression of QTL for yield and related traits in two backcross populations derived from Oryza sativa cv. Swarna and two accessions of O. nivara. Journal of Genetics, 93(3), 643–654. [Google Scholar]
26. Eizenga, G. C., Neves, P. C., Bryant, R. J., Agrama, H. A., Mackill, D. J. (2016). Evaluation of a M-202 × Oryza nivara advanced backcross mapping population for seedling vigor, yield components and quality. Euphytica, 208(1), 157–171. DOI 10.1007/s10681-015-1613-y. [Google Scholar] [CrossRef]
27. Gaikwad, K. B., Singh, N., Bhatia, D., Kaur, R., Bains, N. S. et al. (2014). Yield-enhancing heterotic QTL transferred from wild species to cultivated rice Oryza sativa L. PLoS One, 9(6), e96939. DOI 10.1371/journal.pone.0096939. [Google Scholar] [CrossRef]
28. Eizenga, G. C., Sanchez, P. L., Jackson, A. K., Edwards, J. D., Hurwitz, B. L. et al. (2017). Genetic variation for domestication-related traits revealed in a cultivated rice, Nipponbare (Oryza sativa ssp. japonica) × ancestral rice, O. nivara, mapping population. Molecular Breeding, 37(11), 1–22. DOI 10.1007/s11032-017-0734-5. [Google Scholar] [CrossRef]
29. Gaikwad, K. B., Singh, N., Bhatia, D., Sharma, N., Bains, N. S. et al. (2018). Heterotic response of genomic regions derived from Oryza rufipogon and O. nivara in improving grain morphology and quality of indica rice (Oryza sativa L.). Indian Journal of Genetics and Plant Breeding, 78(2), 155–165. DOI 10.5958/0975-6906.2018.00020.2. [Google Scholar] [CrossRef]
30. Addanki, K. R., Balakrishnan, D., Yadavalli, V. R., Surapaneni, M., Mesapogu, S. et al. (2019). Swarna × Oryza nivara introgression lines: A resource for seedling vigour traits in rice. Plant Genetic Resources, 17(1), 12–23. DOI 10.1017/S1479262118000187. [Google Scholar] [CrossRef]
31. Surapaneni, M., Balakrishnan, D., Mesapogu, S., Addanki, K. R., Yadavalli, V. R. (2017). Identification of major effect QTLs for agronomic traits and CSSLs in rice from Swarna/Oryza nivara derived backcross inbred lines. Frontiers in Plant Science, 8, 1027. DOI 10.3389/fpls.2017.01027. [Google Scholar] [CrossRef]
32. Haritha, G., Malathi, S., Divya, B., Swamy, B. P. M., Mangrauthia, S. K. et al. (2018). Oryza nivara Sharma et Shastry. In: The wild oryza genomes, pp. 207–238. Cham: Springer. [Google Scholar]
33. Cai, Z., Zhou, L., Ren, N. N., Xu, X., Liu, R. et al. (2019). Parallel speciation of wild rice associated with habitat shifts. Molecular Biology and Evolution, 36(5), 875–889. DOI 10.1093/molbev/msz029. [Google Scholar] [CrossRef]
34. Sandamal, S., Tennakoon, A., Meng, Q. L., Marambe, B., Ratnasekera, D. et al. (2018). Population genetics and evolutionary history of the wild rice species Oryza rufipogon and O. nivara in Sri Lanka. Ecology and Evolution, 8(23), 12056–12065. DOI 10.1002/ece3.4665. [Google Scholar] [CrossRef]
35. Tennakoon, A., Sandamal, S., Ratnasekera, D. (2019). Habitat preference of common wild rice species in Sri Lanka by species distribution modelling techniques. International Conference on Climate Change & Its Impact on Global Food Security & Sustainability of Agriculture, pp. 3.Varanasi, Varanasi: Institute of Sciences, Banaras Hindu University. [Google Scholar]
36. Liu, R., Zheng, X. M., Zhou, L., Zhou, H. F., Ge, S. (2015). Population genetic structure of Oryza rufipogon and Oryza nivara: Implications for the origin of O. nivara. Molecular Ecology, 24, 5211–5228. DOI 10.1111/mec.13375. [Google Scholar] [CrossRef]
37. Banaticla-Hilario, M. C. N. (2012). An ecogeographic analysis of Oryza series Sativae in Asia and the Pacific (Ph.D. Thesis). Wageningen University. [Google Scholar]
38. Chang, T., Oka, H. (1976). Genetic variousness in the climatic adaptation of rice cultivars. Proceedings of the Symposium on Climate and Rice, pp. 87–111. International Rice Research Institute. [Google Scholar]
39. Liyanage, A., Senanayake, G. (2010). The atlas of selected crop wild relatives in Sri Lanka. Peradeniya, Sri Lanka: Department of Agriculture. [Google Scholar]
40. Sandamal, S., Tennakoon, A., Ratnasekera, D. (2018). Among and within population diversity of Oryza nivara in Sri Lanka revealed by phenotypic characterization. 4th International Conference on Dry Zone Agriculture, pp. 95. Faculty of Agriculture, Sri Lanka: University of Jaffna. [Google Scholar]
41. Wijerathna, P., Tennakoon, A., Sandamal, S., Ratnasekera, D. (2021). Comparison of phenology stages of wild rice species: Oryza nivara and Oryza rufipogon using Ex-situ common garden experiment. International Symposium on Agriculture & Environment, Faculty of Agriculture. University of Ruhuna. [Google Scholar]
42. Liyanage, A. S. U., Hemachandra, P. V., Edirisinghe, D. K., Senevirathna, S. K., Takahashi, J. (2002). Surveying and mapping of wild species of Oryza in Sri Lanka. Japanese Journal of Tropical Agriculture, 46, 14–22. DOI 10.11248/jsta1957.46.14. [Google Scholar] [CrossRef]
43. Center, A. R. (2007). Descriptors for wild and cultivated rice (Oryza spp.). Descriptors for Wild & Cultivated Rice. [Google Scholar]
44. Grillo, M. A., Li, C., Fowlkes, A. M., Briggeman, T. M., Zhou, A. et al. (2009). Genetic architecture for the adaptive origin of annual wild rice, Oryza nivara. Evolution, 63, 870–883. DOI 10.1111/j.1558-5646.2008.00602.x. [Google Scholar] [CrossRef]
45. Pachauri, R. K., Allen, M. R., Barros, V. R., Broome, J., Cramer, W. (2014). Climate change 2014: Synthesis report. In: Contribution of Working Groups I, II and III to the fifth assessment report of the intergovernmental panel on climate, pp. 151. Switzerland: Change World Meteorological Organization. [Google Scholar]
46. Kanojia, A., Dijkwel, P. P. (2018). Abiotic stress responses are governed by reactive oxygen species and age. Annual Plant Reviews Online, 1, 295–326. DOI 10.1002/9781119312994. [Google Scholar] [CrossRef]
47. Wheeler, T., Von Braun, J. (2013). Climate change impacts on global food security. Science, 341(6145), 508–513. DOI 10.1126/science.1239402. [Google Scholar] [CrossRef]
48. Khan, A. A., Ijaz, M., Muhammad, J., Goheer, A. R., Akbar, G. et al. (2016). Climate change implications for wheat crop in Dera Ismail Khan district of Khyber Pakhtunkhwa. Pakistan Journal of Meteorology, 13(25), 17–27. [Google Scholar]
49. Reckling, M., Döring, T. F., Bergkvist, G., Chmielewski, F. M., Stoddard, F. L. et al. (2018). Grain legume yield instability has increased over 60 years in long-term field experiments as measured by a scale-adjusted coefficient of variation. In: Advances in legume science and practice, pp. 15–20.Association of Applied Biologists. [Google Scholar]
50. Dhankher, O. P., Foyer, C. H. (2018). Climate resilient crops for improving global food security and safety. Plant Cell and Environment, 41, 877–884. DOI 10.1111/pce.13207. [Google Scholar] [CrossRef]
51. Meyer, R. S., Purugganan, M. D. (2013). Evolution of crop species: Genetics of domestication and diversification. Nature Reviews Genetics, 14(12), 840–852. DOI 10.1038/nrg3605. [Google Scholar] [CrossRef]
52. Bloomfield, J. A., Rose, T. J., King, G. J. (2014). Sustainable harvest: Managing plasticity for resilient crops. Plant Biotechnology Journal, 12(5), 517–533. DOI 10.1111/pbi.12198. [Google Scholar] [CrossRef]
53. Makumburage, G. B., Stapleton, A. (2011). Phenotype uniformity in combined-stress environments has a different genetic architecture than in single-stress treatments. Frontiers in Plant Science, 2, 12. DOI 10.3389/fpls.2011.00012. [Google Scholar] [CrossRef]
54. Sultan, S. E. (2003). Phenotypic plasticity in plants: A case study in ecological development. Evolution and Development, 5, 25–33. [Google Scholar]
55. Banaticla-Hilario, M. C. N., Sosef, M. S., Mcnally, K. L., Hamilton, N. R. S., van Den Berg, R. G. (2013). Ecogeographic variation in the morphology of two Asian wild rice species, Oryza nivara and Oryza rufipogon. International Journal of Plant Sciences, 174, 896–909. DOI 10.1086/670370. [Google Scholar] [CrossRef]
56. Li, C., Zhou, A., Sang, T. (2006). Genetic analysis of rice domestication syndrome with the wild annual species, Oryza nivara. New Phytologist, 170(1), 185–194. DOI 10.1111/j.1469-8137.2005.01647.x. [Google Scholar] [CrossRef]
57. Morishima, H., Barbier, P. (1990). Mating system and genetic structure of natural populations in wild rice Oryza rufipogon. Plant Species Biology, 5(1), 31–39. DOI 10.1111/j.1442-1984.1990.tb00190.x. [Google Scholar] [CrossRef]
58. Murren, C. J., Auld, J. R., Callahan, H., Ghalambor, C. K., Handelsman, C. A. et al. (2015). Constraints on the evolution of phenotypic plasticity: Limits and costs of phenotype and plasticity. Heredity, 115(4), 293–301. DOI 10.1038/hdy.2015.8. [Google Scholar] [CrossRef]
59. Baythavong, B. S. (2011). Linking the spatial scale of environmental variation and the evolution of phenotypic plasticity: Selection favors adaptive plasticity in fine-grained environments. American Naturalist, 178(1), 75–87. DOI 10.1086/660281. [Google Scholar] [CrossRef]
60. Valladares, F., Gianoli, E., Gómez, J. M. (2007). Ecological limits to plant phenotypic plasticity. New Phytologist, 176(4), 749–763. DOI 10.1111/j.1469-8137.2007.02275.x. [Google Scholar] [CrossRef]
61. Sharifi, S., Amiri Fahliani, R., Masoumi Asl, A. (2021). Walnut genetic diversity investigation using phenological and morphological characteristics and ISSR markers. Journal of Agricultural Science and Technology, 23(1), 187–200. [Google Scholar]
62. Xu, Y., Ma, K., Zhao, Y., Wang, X., Zhou, K. (2021). Genomic selection: A breakthrough technology in rice breeding. Crop Journal, 9(3), 669–677. DOI 10.1016/j.cj.2021.03.008. [Google Scholar] [CrossRef]
63. Shivrain, V. K., Burgos, N. R., Scott, R. C., Gbur Jr, E. E., Estorninos Jr, L. E. (2010). Diversity of weedy red rice (Oryza sativa L.) in Arkansas, USA in relation to weed management. Crop Protection, 29(7), 721–730. DOI 10.1016/j.cropro.2010.02.010. [Google Scholar] [CrossRef]
64. Wickramasinghe, W. M. A. D. B., Wijewardena, J. D. H. (2000). Soil fertility management and integrated plant nutrition systems in rice cultivation. Proceedings Rice Symposium, pp. 125–140. Peradeniya, Sri Lanka: Department of Agriculture. [Google Scholar]
65. Tad-awan, B. A., Sagalla, J. D. (2011). Morphological diversity analysis of rice landraces in benguet. Mountain Journal of Science and Interdisciplinary Research (Formerly Benguet State University Research Journal), 66, 1–14. [Google Scholar]
66. Kumar, S., Tripathi, S., Singh, S. P., Prasad, A., Akter, F. et al. (2021). Rice breeding for yield under drought has selected for longer flag leaves and lower stomatal density. Journal of Experimental Botany, 72(13), 4981–4992. DOI 10.1093/jxb/erab160. [Google Scholar] [CrossRef]
67. Saitoh, K., Yonetani, K., Murota, T., Kuroda, T. (2002). Effects of flag leaves and panicles on light interception and canopy photosynthesis in high-yielding rice cultivars. Plant Production Science, 5(4), 275–280. DOI 10.1626/pps.5.275. [Google Scholar] [CrossRef]
68. Dengler, N. G. (1980). Comparative histological basis of sun and shade leaf dimorphism in Helianthus annuus. Canadian Journal of Botany, 58(6), 717–730. DOI 10.1139/b80-092. [Google Scholar] [CrossRef]
69. Larcher, W. (2003). Physiological plant ecology: Ecophysiology and stress physiology of functional groups. Verlag, Berlin, Heidelberg, New York: Springer Science & Business Media. [Google Scholar]
70. Mc Clendon, J. H., Mc Millen, G. G. (1982). The control of leaf morphology and the tolerance of shade by woody plants. Botanical Gazette, 143(1), 79–83. DOI 10.1086/337273. [Google Scholar] [CrossRef]
71. Oka, H. I. (2012). Origin of cultivated rice. Tokyo: Japan Scientific Society Press, Elsevier. [Google Scholar]
72. Pucciariello, C., Perata, P. (2013). Quiescence in rice submergence tolerance: An evolutionary hypothesis. Trends in Plant Science, 18(7), 377–381. DOI 10.1016/j.tplants.2013.04.007. [Google Scholar] [CrossRef]
73. Pavey, S. A., Collin, H., Nosil, P., Rogers, S. M. (2010). The role of gene expression in ecological speciation. Annals of the New York Academy of Sciences, 1206, 110–129. DOI 10.1111/j.1749-6632.2010.05765.x. [Google Scholar] [CrossRef]
74. Bonny, B. S., Adjoumani, K., Seka, D., Koffi, K. G., Kouonon, L. C. et al. (2019). Agromorphological divergence among four agro-ecological populations of Bambara groundnut (Vigna subterranea (L.) Verdc.) in Côte d’Ivoire. Annals of Agricultural Sciences, 64(1), 103–111. DOI 10.1016/j.aoas.2019.04.001. [Google Scholar] [CrossRef]
75. Valladares, F., Matesanz, S., Guilhaumon, F., Araújo, M. B., Balaguer, L. et al. (2014). The effects of phenotypic plasticity and local adaptation on forecasts of species range shifts under climate change. Ecology Letters, 17(11), 1351–1364. DOI 10.1111/ele.12348. [Google Scholar] [CrossRef]
76. Baythavong, B. S., Stanton, M. L. (2010). Characterizing selection on phenotypic plasticity in response to natural environmental heterogeneity. Evolution: International Journal of Organic Evolution, 64(10), 2904–2920. DOI 10.1111/j.1558-5646.2010.01057.x. [Google Scholar] [CrossRef]
77. Kuroda, Y., Sato, Y. I., Bounphanousay, C., Kono, Y., Tanaka, K. (2007). Genetic structure of three Oryza AA genome species (O. rufipogon, O. nivara and O. sativa) as assessed by SSR analysis on the Vientiane Plain of Laos. Conservation Genetics, 8, 149–158. [Google Scholar]
78. Kariali, E., Kuanar, S. R., Mohapatra, P. K. (2008). Individual tiller dynamics of two wild Oryza species in contrasting habitats. Plant Production Science, 11(3), 355–360. DOI 10.1626/pps.11.355. [Google Scholar] [CrossRef]
79. Rajkumar, G., Weerasena, J., Fernando, K., Liyanage, A., Silva, R. (2011). Genetic differentiation among Sri Lankan traditional rice (Oryza sativa) varieties and wild rice species by AFLP markers. Nordic Journal of Botany, 29(2), 238–243. DOI 10.1111/j.1756-1051.2011.00998.x. [Google Scholar] [CrossRef]
80. Sandhu, R. K., Sarao, P. S. (2021). Evaluation of antixenosis resistance in wild rice accessions against brown planthopper, Nilaparvata lugens (Stål). International Journal of Tropical Insect Science, 41, 65–73. DOI 10.1007/s42690-020-00176-x. [Google Scholar] [CrossRef]
81. Huang, L., Du, Y. S., Zheng, X. M., Liu, R., Zhou, H. F. (2013). Nucleotide diversity of 11 S seed storage protein gene and its implications for ecological adaptation of Oryza nivara. Journal of Systematics and Evolution, 51(6), 641–651. DOI 10.1111/jse.12033. [Google Scholar] [CrossRef]
82. Lu, J. Z., Zhang, X. L., Wang, H. G., Yuan, X. P., Qun, X. U. et al. (2008). SSR analysis on diversity of AA genome Oryza species in the Southeast and South Asia. Rice Science, 15(4), 289–294. DOI 10.1016/S1672-6308(09)60006-8. [Google Scholar] [CrossRef]
83. Anderson, J. E., Kono, T. J., Stupar, R. M., Kantar, M. B., Morrell, P. L. (2016). Environmental association analyses identify candidates for abiotic stress tolerance in Glycine soja, the wild progenitor of cultivated soybeans. G3: Genes, Genomes, Genetics, 6(4), 835–843. DOI 10.1534/g3.116.026914. [Google Scholar] [CrossRef]
84. Zhao, C., Liu, B., Piao, S., Wang, X., Lobell, D. B. et al. (2017). Temperature increase reduces global yields of major crops in four independent estimates. Proceedings of the National Academy of Sciences of the United States of America, 114(35), 9326–9331. DOI 10.1073/pnas.1701762114. [Google Scholar] [CrossRef]
85. Zhang, H., Yasmin, F., Song, B. H. (2019). Neglected treasures in the wild-legume wild relatives in food security and human health. Current Opinion in Plant Biology, 49, 17–26. DOI 10.1016/j.pbi.2019.04.004. [Google Scholar] [CrossRef]
86. Henry, R. J. (2019). Australian wild Rice populations: A key resource for global food security. Frontiers in Plant Science, 10, 1354. DOI 10.3389/fpls.2019.01354. [Google Scholar]
87. Nicotra, A. B., Atkin, O. K., Bonser, S. P., Davidson, A. M., Finnegan, E. J. (2010). Plant phenotypic plasticity in a changing climate. Trends in Plant Science, 15(12), 684–692. DOI 10.1016/j.tplants.2010.09.008. [Google Scholar] [CrossRef]
88. Anderson, J. T., Inouye, D. W., McKinney, A. M., Colautti, R. I., Mitchell-Olds, T. (2012). Phenotypic plasticity and adaptive evolution contribute to advancing flowering phenology in response to climate change. Proceedings of the Royal Society B: Biological Sciences, 279(1743), 3843–3852. DOI 10.1098/rspb.2012.1051. [Google Scholar] [CrossRef]
 | This work is licensed under a Creative Commons Attribution 4.0 International License, which permits unrestricted use, distribution, and reproduction in any medium, provided the original work is properly cited. |