| Phyton-International Journal of Experimental Botany |
DOI: 10.32604/phyton.2022.020251
ARTICLE
Proteomics Analysis of Soybean Seedlings under Short-Term Water Deficit
College of Agriculture, Northeast Agricultural University, Harbin, 150030, China
*Corresponding Author: Shoukun Dong. Email: shoukundong@163.com
Received: 13 November 2021; Accepted: 22 December 2021
Abstract: Soybeans are one of the most important grain crops worldwide. Water deficit, which seriously affects the yield and quality of soybeans, is the main abiotic stress factor in soybean production. As a follow-up study, the drought-tolerant soybean variant Heinong 44 was analyzed via proteome analysis. Soybean was exposed to water deficit for 0, 8, and 24 h, and protein samples were extracted for detection of differentially expressed proteins. Protein sequencing of leaf tissues under water stress yielded a total of 549 differentially expressed proteins: 75 and 320 upregulated proteins as well as 70 and 84 downregulated proteins were obtained after 8 and 24 h of water deficit, respectively. Gene Ontology analysis revealed that most of the differentially expressed proteins (DEPs) were involved in catalytic activity, molecular function, and metabolic processes, whereas some of them were involved in photosynthesis, carbon metabolism, and energy metabolism. We also identified some differentially expressed proteins that may be involved in the regulation of water deficit response. Our study provides a theoretical basis for the breeding of drought-resistant soybean varieties.
Keywords: Soybean; water deficit; proteomics; stress time
Soybean (Glycine max L. Merr.) is one of the most widely cultivated economic legume crops for its oil, mineral, and protein content [1–3]. Rapid population growth, changes in people’s diet, and increased demand for biofuels will double the global soybean production demand by 2050 [4]. Although soybean production has shown an upward trend in recent years, with an average annual increase of approximately 1.3%, doubling the total production by 2050 requires an increase of 55% [5]. Therefore, the development of effective methods for improving soybean production is an important scientific research objective.
Drought stress is one of the major abiotic stresses worldwide, affecting plant growth, development, and crop yield [6]. Between 1982 and 2012, soybean in China suffered serious damage from droughts, with reductions in yields and production ranging from 7.8% to 11.6% [7]. Moreover, drought was associated with 13% of the variability in soybean yields in the United States over 50 years [8]. Therefore, it is of great theoretical and practical significance to study the response and defense of plants to water deficit, understand the response mechanism and resistance mechanism of soybean to dry stress at physiological, biochemical, and molecular genetic levels, cultivate new varieties of drought-resistant soybean, improve soybean stress resistance and productivity to solve food security problems.
Proteomics is a systematic analysis of proteins, which involves the identification and quantitative application of total protein content in cells, tissues, or organisms. It complements genomics, transcriptomics, and other “omics” technologies in clarifying the identity of proteins in organisms and elucidating the structure and function of specific proteins [9]. Proteomics technology has been widely used in the research of plant stress resistance [10]. Zeng et al. [11] used proteomics technology to study the difference between sensitive and drought-tolerant maize roots under drought conditions and found that the reason for the higher drought resistance of drought-tolerant varieties. Li et al. [12] studied the proteomic changes of soybean under halosulfuron-methyl stress, and revealed the mechanism of soybean’s response to toxic substances. Katam et al. [13] studied the proteomic changes of the cross-tolerance mechanism of soybean response to heat and water stress and provided theoretical support for soybean breeding for resistance to cold and heat damage. In this study, we performed proteomics analysis of soybean seedlings exposed to short-term water deficit conditions. Our goal was to comprehensively elucidate the molecular mechanisms underlying the response of soybean to drought stress. Our findings will lay the foundation for future genetic modifications to improve soybean productivity and adaptability to stress.
The tested material was the soybean variety Heinong 44 (HN44). For experimental cultivation, full seeds of uniform size were selected, soaked, and disinfected for 10 min with 0.1% KMnO4 solution. After being rinsed with distilled water, the seeds were sown in a sand culturing device (upper mouth diameter, 13 cm; lower bottom diameter, 10 cm; height, 10 cm). The total amount of sand was 1.3 kg. Next, the seeds were sown in shallow acupoints, with five acupoints placed at the same distance and one seed sown at each acupoint. Among the sown seedlings, three strong and similar seedlings were retained, and the process was repeated three times.
The seedlings were placed under artificial light in a constant-temperature incubator (the day and night temperatures were 25°C/20°C, the light schedule was 14 h/d, and the relative humidity ranged from 60% to 80%). Distilled water (200 ml) was sprinkled once a day before the raw leaves were fully unfolded, and 200 ml of Hoagland nutrients solution was applied once a day after the bioleaves were fully unfolded. To prevent salt accumulation, the plants were washed with 500 ml distilled water every 3 days.
Upon reaching the V3 stage, seedlings with consistent growth were chosen to undergo drought stress treatment. For the simulated drought treatment, the plants were exposed to PEG-6000 (20%), which was equivalent to a permeability potential of –0.81 MPa, mixed with the nutrient solution. Seedlings with normal growth without any stress treatment were used as controls.
2.1 Analysis of Differentially Expressed Proteins in Soybean Leaf under Water Deficit
The cultivar Heinong 44 was subjected to drought stress. After 0, 8, and 24 h of stress, the leaves were completely unfolded, and the samples obtained at 0 h were considered the control (CK). Each group had three biological replications, resulting in a total of nine samples. After the treatment period, the samples were subjected to rapid freezing in liquid nitrogen.
Soybean leaf samples (2 g each) were ground to powder under liquid nitrogen cooling and then transferred to a 50-ml centrifuge tube. An appropriate amount of 10% trichloroacetate acetone was added to the tube, and DL-Dithiothreitol (DTT) was added to a final concentration of 10 mM. The solution was mixed and allowed to sediment for over 2 h. Next, the solution was centrifuged at 15000 × g and 4°C for 20 min, and the supernatant was discarded. After that, 80% methanol containing 0.1 M ammonium acetate was added to the sediment, and DTT was added to a final concentration of 10 mM. Oscillation was performed to mix the sample at 20°C for 2 h. Subsequently, a precipitated protein solution was obtained and then centrifuged at 12,000 × g at 4°C for 25 min. The supernatant was discarded, 80% acetone was added at five times the volume of the precipitate, DTT was added to a final concentration of 10 mM, and the solution was mixed well at –20°C, yielding a precipitated protein solution after 2 h. The protein solution was subsequently centrifuged at 12,000 × g at 4°C for 25 min. The supernatant was discarded, and an appropriate volume of sucrose extract and an equal volume of Tris-saturated phenol were added. The solution was oscillated for 5 min on ice and then centrifuged at 10,000 × g and 4°C for 10 min. The phenolic phase was collected, and other volumes of tris-saturated phenol were added. The mixture was oscillated on ice for 5 min, followed by centrifugation at 10,000 × g and 4°C for 10 min. Next, the phenol phase was collected and then mixed with the last phenol phase. Methanol containing 0.1 M ammonium acetate was added at five times the volume to the supernatant, and then DTT was added to a final concentration. The solution was mixed well at 20°C, and the precipitated protein solution was allowed to stand overnight. Subsequently, the sample was washed once with methanol and then with 80% acetone once to obtain a protein precipitate. An appropriate amount of Lysis Buffer 3 was then added to the air-dried precipitate. Phenylmethylsulfonyl fluoride and Ethylene Diamine Tetraacetic Acid were added to final concentrations of 1 and 2 mM, respectively, and DTT was added to a final concentration of 10 mM. The solution was placed on ice for 5 min and then placed in an ice bath for 5 min (2 s/3 s). The solution was centrifuged at 25,000 × g and 4°C for 15 min, the supernatant was collected, and DTT was added to a final concentration of 10 mM. The supernatant was placed in a 56°C water bath for 1 h. After recovery to room temperature, IAM was added to a final concentration of 55 mM. The solution was then placed in a dark room for 45 min, five times the volume of cold acetone was added, and the precipitated protein solution was stored overnight at 20°C. After that, the solution was centrifuged at 25,000 × g at 4°C for 15 min, and the supernatant was discarded. Residual acetone was eliminated by air-drying the precipitate. Next, an appropriate amount of Lysis Buffer 3 was added to the solution, which was subjected to ice bath ultrasound for 5 min (2 s/3 s), followed by centrifugation at 25000 × g at 4°C for 15 min. The supernatant was collected, and the required protein solution was obtained.
2.1.3 Protein Concentration Determination
Standard protein at 0, 2, 4, 6, 8, 10, 12, 14, 16, and 18 μl was added to 96-well enzyme-label plates A1 to A10. Subsequently, 20, 18, 16, 14, 12, 10, 8, 6, 4, and 2 μL of pure water was added in turn. Next, 180 μl of G-250 quantitative working fluid was added to each well. OD595 was measured using an enzyme standard instrument, and a linear standard curve was generated according to measurement of OD595. Briefly, the protein solution was diluted several times, and 180 μl of quantitative working solution was added to 20 μl of the protein solution. Finally, the protein concentration of the samples was calculated according to the standard curve and OD595 sample.
2.1.4 SDS-PAGE Electrophoresis
Each sample was mixed with an appropriate amount of loading buffer, heated for 5 min at 95°C, centrifuged at 25,000 × g for 5 min, and added to 12% of the spot sample holes of SDS polyacrylamide gel. After electrophoresis, the gel was dyed with G-250 for 2 h, and then an appropriate amount of decolorization solution (40% ethanol, 10% acetic acid) was added to the gel three to five times for 30 min each time.
From each sample, 100 μg of the protein solution was collected. Next, 2.5 μg trypsin was added, and enzyme solution was added to a protein:enzyme ratio of 40:1 at 37°C for 4 h. Trypsin was added one time in the above proportion, and the enzymatic solution was incubated for 8 h at 37°C. The enzymatic peptide section was subsequently desalinated and vacuum-dried using a Strata X column.
2.1.6 Peptide Segment Labeling and Separation
Each tube of IBT reagent (2 mg) was dissolved in 80 μl isopropyl alcohol and oscillated for more than 1 min. The peptide segment after enzymatic reaction and desalination was dissolved in 0.2 M Tetraethylammonium bromide solution and oscillated for more than 1 min, yielding a peptide segment concentration of 4 μg/μl. Next, 100 μg of the peptide segment (25 μl) and 80 μl IBT reagent were quickly and evenly mixed and centrifuged. The pH was measured to be between 7.0 and 8.0. The same process was used for each channel of IBT reagent and marked. The solution was maintained at room temperature for 2 h to ensure that they were fully marked. Marked samples CK-0-1, CK-0-2, CK-0-3, D-24-1, D-24-2, D-24-3, D-8-1, D-8-2, and D-8-3 were 114, 115N, 116C, 116N, 117C, 117N, 118C, 118N, and 119, respectively.
The samples were separated using a Shimazu LC-20AB liquid phase system equipped with a Gemini C18 column (5 μm, 4.6 × 250 mm). The elution peak was monitored at a wavelength of 214 nm, and one component was collected per minute. The sample was combined with the chromatographic elution peak map to obtain 20 components, which were then frozen and drained.
2.1.7 Liquid Chromatography Tandem Mass Spectrometry (LC-MS/MS)
LC-MS/MS was performed on a Thermo Dionex Ultimate 3000 RSLCnano system (Thermo Scientific, Waltham, MA, USA) coupled with a Q Exactive mass spectrometer (Thermo Scientific). The peptide was captured on a C18 column (300 μm ID by 5 mm, Acclaim PepMap RSLC C18, 5 μm, 100 Å; Thermo Scientific) and separated on an analytical column (Acclaim PepMap 75 μm × 150 mm, C18, 3 μm, 100 Å; Thermo Scientific). The mobile phase consisted of phase A (0.1% formic acid) and B (0.1% formic acid and 80% acetonitrile). The gradient program was 5% B to 90% B for 65 min, at a flow rate of 300 nl/min.
MS data were analyzed using a Thermo Scientific Q Exactive mass spectrometer. The first single ion monitoring protocol used m/z 350-1800 mass selection, 70,000 orbital well resolution, 3 × 10⁶ target automatic gain control value, and 40 ms maximum filling time. For the second single ion monitoring, the resolution was 17,500, the target AGC value was 1 × 10⁵, the maximum single filling time was 60 ms, and the normalized collision energy was 27.
2.1.8 Protein Database Search Identification
Protein identification was carried out using Mascot2.3.02 software (Matrix Science, London, UK). The database retrieval parameter settings were as follows: search database, UniProt (http://www.uniprot.org/uniprot/?query=taxonomy:3847); single isotopes were searched; the enzyme used for enzymatic hydrolysis, trypsin; error tolerance of primary mass spectrometry, 20 PPm; secondary mass spectrometry, 0.05 Da; fixed modifications, carbamidomethyl (C) and IBT10ple; X (N-term) and IBT10plex (K) variable modifiers, Exified (M) and IBT10plex (Y).
2.1.9 Protein IBT Quantification
IBT data were quantified using the IQuant software (independently developed by Huada), which integrates the Mascot Percolator algorithm. False discovery rate of 1% (PSM-level FDR ≤ 0.01) was applied at the spectral/peptide segment level to obtain a list of spectral maps and peptide segments identified as significant. Protein assembly using peptide segments was performed based on the parsimony principle, yielding a series of protein groups. To control the false positive rate, the data were further filtered with an FDR level of 1% (protein-level FDR ≤ 0.01). According to the experimental marker information and protein abundance level, significantly differentially expressed proteins were indicated by fold change > 1.5 and q-value < 0.05.
The UniProt database was used for protein annotation and enrichment analyses. Gene Ontology (GO) [14] analysis was conducted to analyze the proteins based on molecular functions, biological processes, and cell components. Kyoto Encyclopedia of Genes and Genomes [15] analysis was performed. GO and KEGG enrichment analyses were performed using the phyper function in the R software.
3.1 Basic Information for Protein Identification
A total of 25,8625 secondary spectra were obtained in the mass spectra experiment and analyzed using the Mascot software (Fig. 1a), and 60,627 spectral maps were matched, of which 34,727 were unique. A total of 5,183 proteins were identified, of which 17,141 were peptides. Among these peptides, 1,2556 were unique.

Figure 1: Protein identification information: a: Basic information; b: relative molecular distribution of proteins; c: distribution of peptide length; d: distribution of the number of peptides
All proteins were identified according to their relative molecular weight. As shown in Fig. 1b, the relative molecular weight of the identified proteins was mainly concentrated in the 10–60 kDa range, and the molecular mass of the proteins was greater than 30 kDa. With increasing relative molecular weight, the proportion of proteins decreased, with more than 8% of proteins >100 kDa showing a decreased number.
The length of the identified peptide segment is shown in Fig. 1c. As shown in the figure, the length of the peptide segment was mostly 7 to 16 amino acid residues, the length of the independent peptide segment was mainly concentrated in 9 to 13 amino acid residue intervals, and the peptide segment length was greater than 10 amino acid residues. As the proportion of peptide segments increased, the average length of all peptide segments identified in this test was 12.32 amino acid residues.
The number of identified unique peptide segments is shown in Fig. 1d, which shows that most of the identified proteins contained fewer than 10 peptide segments. The number of proteins decreased with the number of matching peptide segments.
3.2 Distribution of Differentially Expressed Proteins
The conditions and distributions of DEPs are shown in Figs. 2 and 3. Under water deficit for 8 and 24 h, a total of 145 and 404 differentially expressed proteins were identified: 75 and 320 were upregulated, whereas 70 and 84 were downregulated, respectively. After 24 and 8 h of water deficit, a total of 430 differentially expressed proteins were identified: 332 and 98 isoproteins were upregulated and downregulated, respectively. The number of differentially expressed proteins under 24 h water deficit condition was significantly greater at than at 8 h, although the difference in the number of proteins after adjustment was not significant.

Figure 2: The statistics of differentially expressed proteins under water deficit condition

Figure 3: Logarithmic distribution plot of protein fold changes in CK and water stress 8 and 24 h
Note: Red, green, and gray triangles represent upregulated, downregulated, and non-differentially expressed proteins, respectively.
Fig. 4 shows the Venn diagram of DEPs between the groups. Fig. 4a shows the upregulated DEPs. Seven differentially expressed proteins were identified (I1L8S3_SOYBN, I1NBE4_SOYBN, C6SYA5_SOYBN, Q0PKY2_SOYBN, K7MQ84_SOYBN, I1MGV6_SOYBN, and C6T0E8_SOYBN), which played important roles in drought resistance. Fig. 4b shows the downregulated DEPs. No common DEPs were found between the three groups; only 20 common DEPs were found between D8 vs. CK and D24 vs. CK, and 36 common DEPs were observed between D24 and CK as well as between D24 and D8.

Figure 4: Venn diagrams of differentially expressed proteins in the groups. (a) represents upregulated proteins, whereas (b) represents downregulated proteins
GO analysis was conducted to determine the functions of DEPs under water stress for 8 and 24 h (Figs. 5 and 6). The functions of DEPs were divided into three categories: molecular function, cell composition, and biological processes.


Figure 5: (a) GO categories of upregulated differentially expressed proteins under water stress for 8 h (GeneRatio top 20 items); (b) GO categories of downregulated differentially expressed proteins under water stress for 8 h (GeneRatio top 20 items)
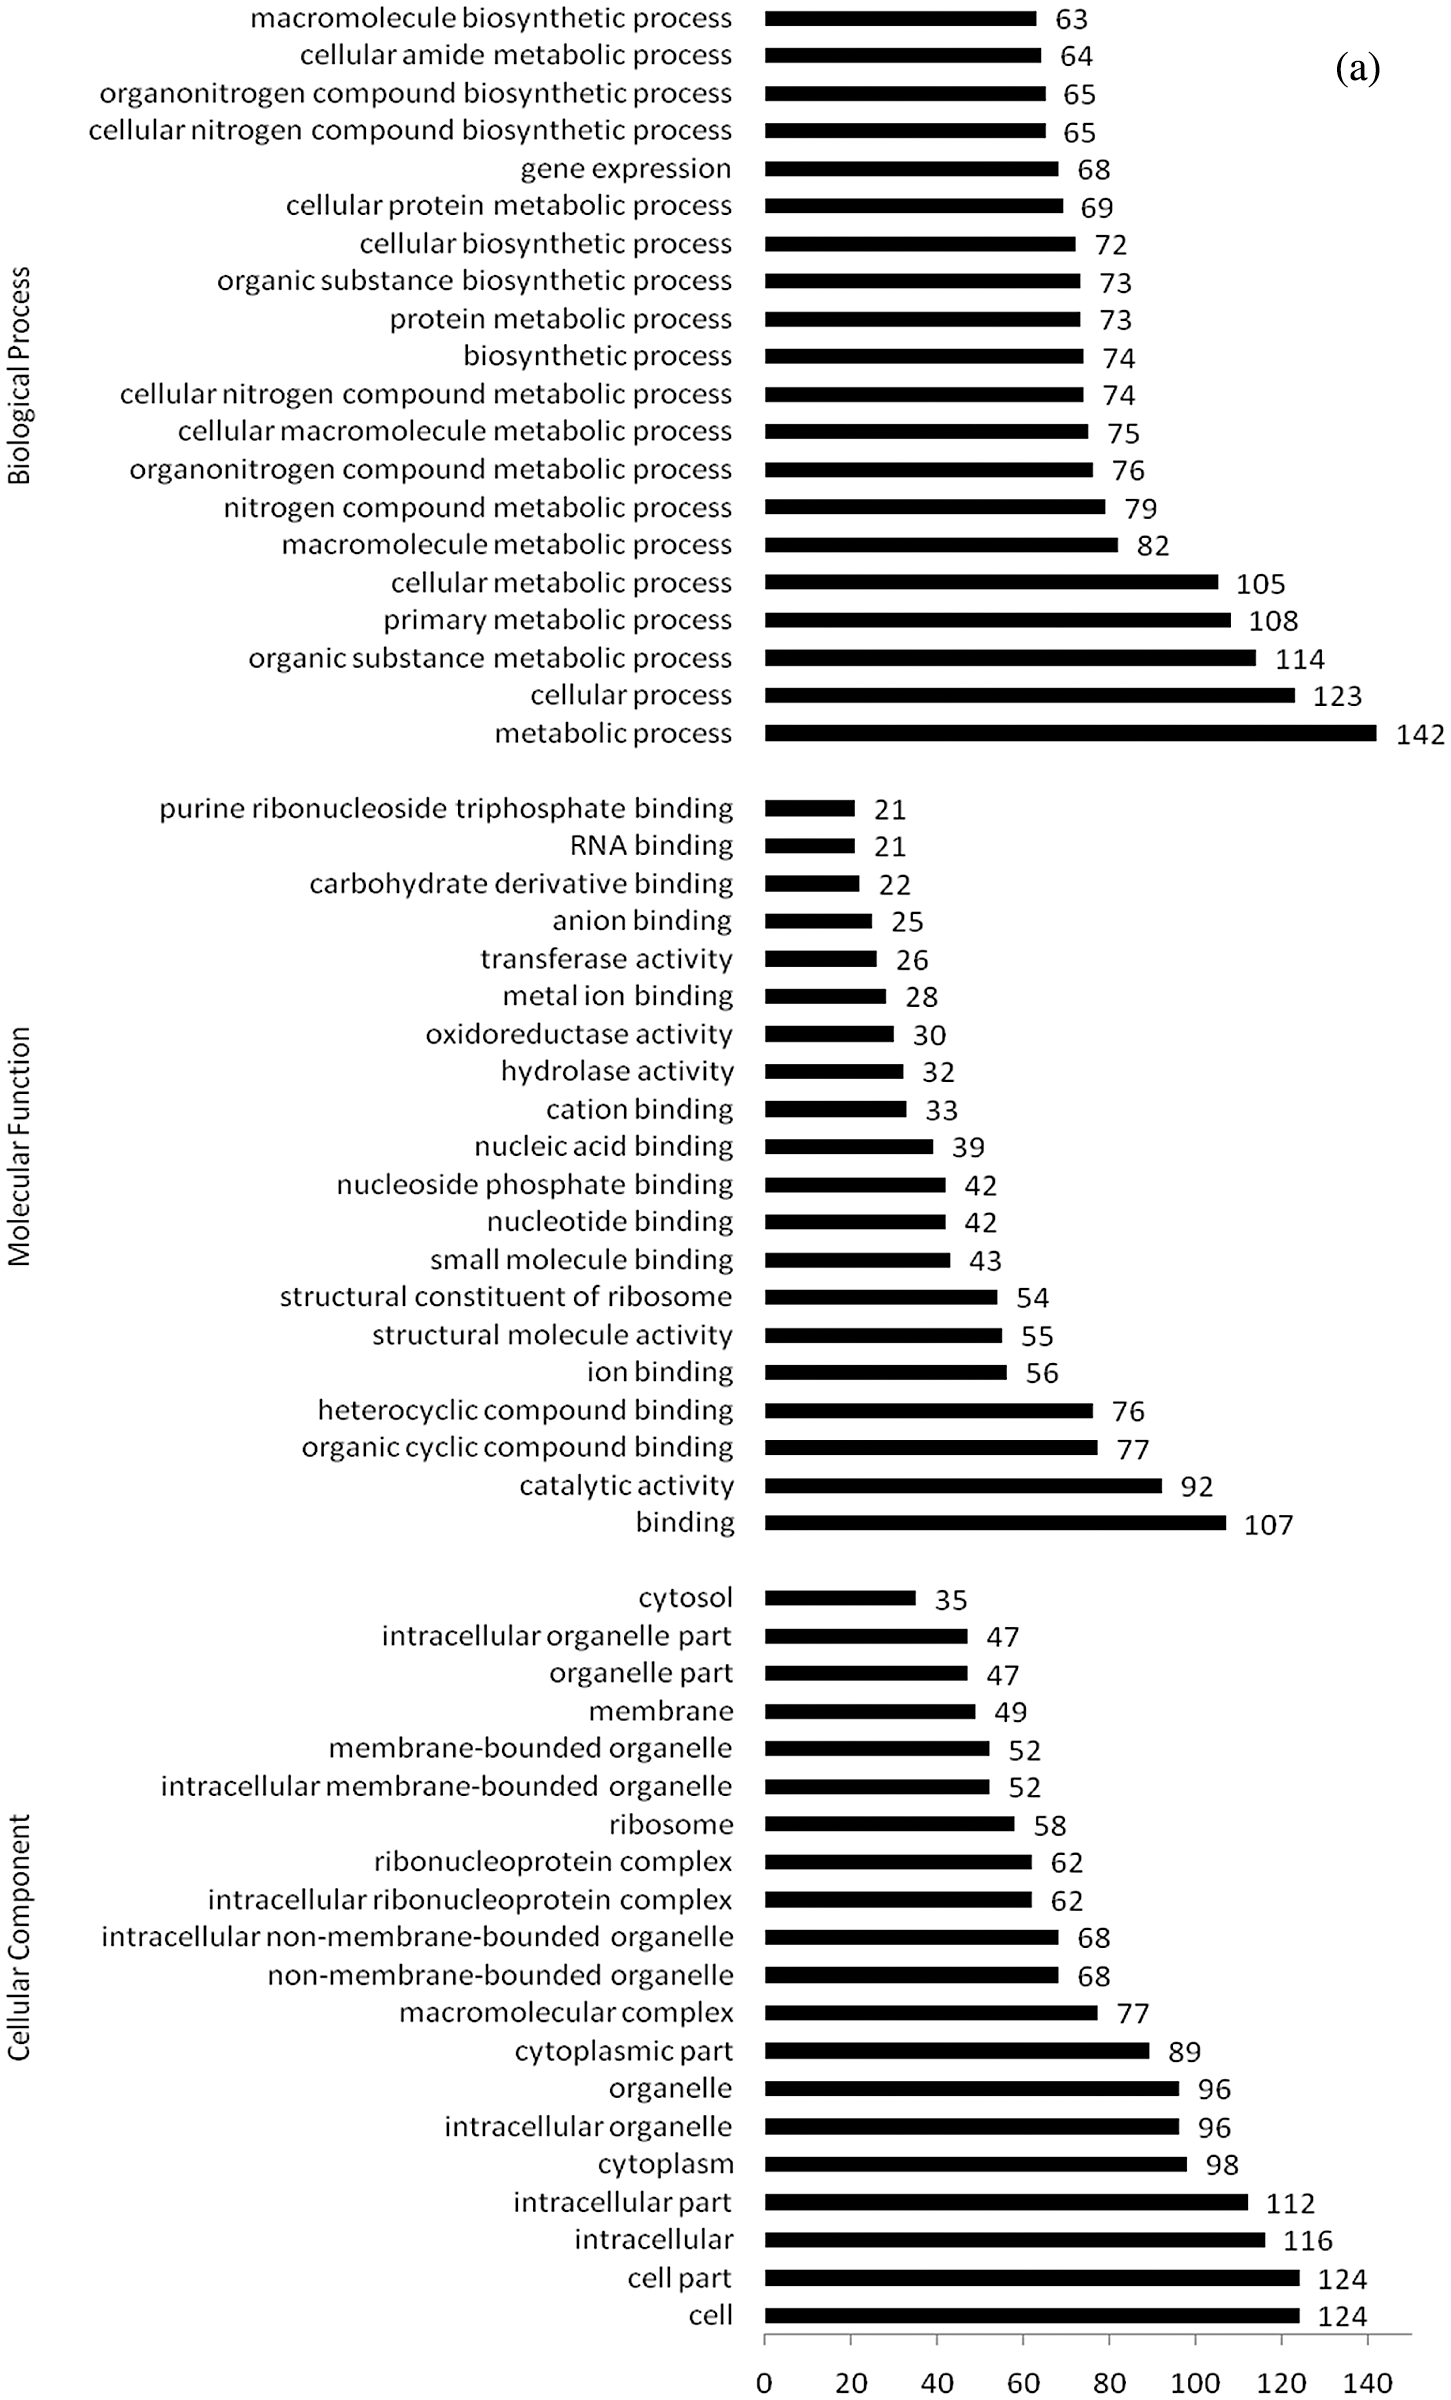

Figure 6: (a) GO categories of upregulated differentially expressed proteins under water stress for 24 h (GeneRatio top 20 items); (b) GO categories of downregulated differentially expressed proteins under water stress for 24 h (GeneRatio top 20 items)
GO annotation of upregulated differentially expressed proteins after 8 h of water stress is shown in Fig. 5. Of the 75 differentially expressed proteins, 56 matched GO annotations, with a total of 518 GO terms. Most of DEPs were associated with membranes (27, 79%), cells (27, 79%), cell parts (27, 79%), intracellular components (24, 71%), and intracellular components (23, 68%), among cell composition types. Moreover, they were primarily involved in catalytic activity (21, 54%), binding (17, 44%), and other molecular functions. They were also involved in metabolic processes (29, 69%), cellular processes (28, 67%), cellular metabolic processes (18, 19%), single-organism processes (17, 41%), primary metabolic processes (17, 41%), and other biological processes.
GO annotation of the downregulated differentially expressed proteins under water stress for 8 h is shown in Fig. 5b. Of the 70 differentially expressed proteins, 55 matched GO annotations, with a total of 529 GO terms. Cells (10, 59%) and cell components (10, 59%) were the most enriched categories. The proteins mainly participated in binding (28, 76%), catalytic activity (26.7%), and metabolic processes (28, 76%).
GO annotation of differentially upregulated proteins after 24 h of water stress treatment is shown in Fig. 6a. Of the 320 differentially expressed proteins, 267 matched 1,092 GO terms. Most of DEPs were related to cell components (124, 88%), intracellular components (116, 82%), intracellular components (112, 79%), and cytoplasm (98, 70%), among cell composition types. Furthermore, they mainly participated in binding (107, 55%), catalytic activity (92, 65%), organic cyclic compound binding (77, 55%), and heterocyclic compound binding (76, 54%), and were involved in metabolic processes (142, 81%), cell processes (123, 70%), organic matter metabolism processes (114, 65%), primary metabolism processes (108, 61%), and metabolic processes (105, 60%).
GO annotation of differentially downregulated proteins exposed to water stress for 24 h is shown in Fig. 6b. Of the 84 differentially expressed proteins, 63 matched GO annotations, with a total of 496 GO terms. Most of DEPs were related to cells (18, 75%) and cell components (18, 75%). They mainly participated in molecular functions such as catalytic activity (38, 84%), binding (27, 60%), and metal ion binding (12, 27%), as well as in metabolic processes (33, 73%) and single biological processes (21, 47%).
The identified proteins were compared with the COG database for prediction of their possible functions and for classification (Fig. 7).

Figure 7: COG functional distribution of all identified proteins. A, RNA processing and modification; B, chromatin structure and dynamics; C, energy production and conversion; D, cell cycle control, cell division, chromosome partitioning; E, amino acid transport and metabolism; F, nucleotide transport and metabolism; G, carbohydrate transport and metabolism; H, coenzyme transport and metabolism; I, lipid transport and metabolism; J, translation, ribosomal structure, and biogenesis; K, transcription; L, replication, recombination, and repair; M, cell wall/membrane/envelope biogenesis; O, posttranslational modification, protein turnover, chaperones; P, inorganic ion transport and metabolism; Q, secondary metabolite biosynthesis, transport, and catabolism; R, general function prediction only; S, function unknown; T, signal transduction mechanisms; U, intracellular trafficking, secretion, and vesicular transport; V, defense mechanisms; Z, cytoskeleton. Note: (a) and (b) are upregulated and downregulated proteins under water stress for 8 h, respectively; (c) and (d) are upregulated and downregulated proteins under water stress for 24 h, respectively
Proteins that were upregulated and downregulated under water stress for 8 and 24 h can be classified into 22 types. A total of 277 upregulated proteins (Fig. 7a) under 8 h of water stress corresponded to COG functional annotations, of which J (translation, ribosomal structure and biosynthesis), G (carbohydrate transportation and metabolism), and R (general function prediction) had the largest number of proteins, accounting for 15.88%, 15.52%, and 15.52% of the total number of proteins with functional annotations, respectively, as well as 46.93% of the total protein population. A total of 468 proteins downregulated (Fig. 7b) under 8 h of water stress corresponded to COG functional annotations, of which F (nucleic acid transport and metabolism), I (lipid transport and metabolism), and Q (biosynthesis, transportation, and decomposition metabolism of secondary metabolites) had the largest number of proteins, accounting for 19.66%, 11.96%, and 8.97% of the total number of proteins with functional annotations, respectively, as well as 40.60% of the total protein population.
Under 24 h of water stress, COG functional annotations were observed for 851 upregulated proteins (Fig. 7c), of which J (translation, ribosomal structure, and biosynthesis), R (general functional prediction), and O (translation, posttranslational modification, protein folding, and molecular companions) had the largest number of proteins, accounting for 21.27%, 14.84%, and 11.63% of the total number of upregulated proteins, respectively, and 47.71% of the total number of proteins. COG functional annotations were also obtained for 457 downregulated proteins (Fig. 7d), of which G (carbohydrate transportation and metabolism), R (general function prediction), and O (transcription, posttranslational modification, protein folding, and molecular companion) had the largest number of downregulated proteins, accounting for 15.10%, 12.69%, and 12.69% of the total number of downregulated proteins, respectively, and 42.89% of the total protein population.
KEGG enrichment analysis was carried out (Table 1) to further elucidate the metabolic pathways in which the differentially expressed water stress response proteins participate.

Of the 549 differentially expressed proteins identified following water stress for 8 and 24 h, 441 corresponded to a total of 150 KEGG metabolic pathways. Among these pathways, 13 (P ≤ 0.05) were significantly enriched based on the P values, namely the ribosomes, photosynthetic antenna proteins, phenylpropyl biosynthesis, glutathione metabolism, distyrene and gingerol biosynthesis, linoleic acid metabolism, pyridine metabolism, flavonoid biosynthesis, ribosome biosynthesis in eukaryotes, creatine phosphate metabolism, glutamate, leucine, and isoleucine pathways. Degradation, phenylalanine metabolism, and inositol phosphate metabolism were significantly enriched under water stress for 8 and 24 h. These findings indicate that plant response to water stress involves a complex metabolic regulatory process that includes ribosomes, photosynthetic antenna proteins, phenylpropyl glycerin metabolism, and glutathione metabolism.
Of the 145 differentially expressed proteins identified under water stress for 8 h, 111 corresponded to a total of 56 KEGG metabolic pathways. Among these pathways, eight were significantly enriched: photosynthesis-antenna protein and linoleic acid metabolism were upregulated, whereas phenylpropyl biosynthesis, distyrene and gingerol biosynthesis, pyridine metabolism, flavonoid biosynthesis, creatine phosphate metabolism, and phenylalanine metabolism were downregulated. These results suggest that certain metabolic pathways, such as photosynthesis-antenna protein and phenylpropylene biosynthesis, may mainly participate in the response of plants to short-term water stress.
Of the 404 differentially expressed proteins identified following water stress for 24 h, 330 corresponded to a total of 94 KEGG metabolic pathways. Among these, five were significantly enriched: ribosomes, synthesis of ribosomes in eukaryotes, degradation of valine, leucine, and isoleucine were upregulated, whereas glutathione metabolism and creatine phosphate metabolism were downregulated. This implies that the metabolic pathways of ribosomes and glutathione metabolism mainly participate in the response of plants to long-term water stress.
3.6 Analysis of Differentially Expressed Proteins Participating in the Regulation of Water Stress Response
The results of GO functional analysis and KEGG metabolic pathway enrichment analysis revealed a set of differentially expressed proteins whose functions are known and may be involved in water stress response regulation (Table 2). These functional proteins were divided into three categories: photosynthesis-related proteins, carbon metabolism-related proteins, and energy metabolism-related proteins. Short-term water stress mainly promoted photosynthesis and energy metabolism, which had little effect on carbon metabolism; in contrast, prolonged water stress inhibited photosynthesis and energy metabolism, but promoted carbon metabolism.

Through GO function annotation of DEPs, a total of 12 photosynthesis-related proteins were identified, 7 of which were upregulated after 8 h of water stress, including 2 proteins that encoded photosystem II reaction center proteins H and 10 kDa polypeptides (K7KP67_SOYBN, C6SWI3_SOYBN); 4 proteins that encoded chlorophyll a-b binding proteins CP26, CP29.2, P4 (A0A0R0FSY2_SOYBN, A0A0R0JQ91_SOYBN, C6TCH6_SOYBN, I1J7A8_SOYBN), and 1 protein that encoded photosynthetic NDH subunit 3 (I1M3H7_SOYBN) of the inner cavity position. Five differentially expressed proteins were downregulated under 24 h of water stress, including photosynthetic NDH subunit 2 (K7K1W5_SOYBN) at the inner cavity position, two proteins that encoded ketone carboxylase chains and large chains (RBS1_SOYBN, A0A0F6Y5T0_SOYBN), and two proteins that encoded chlorophyll a-b binding protein 7 and CP24 10A (C6TKB2_SOYBN, K7M9Q3_SOYBN). Long-term water stress mainly inhibited proteins associated with light reactions during photosynthesis.
In the KEGG metabolic pathway enrichment analysis, a total of 14 differentially expressed proteins related to carbon metabolism were identified. Of this, two that were observed water stress for 8 h encoded ribulose phosphate 3-epimerase (EC5.1.3.1) (I1JZN0_SOYBN) and 6-phosphate fructose kinase (EC 5.3.1.9) (I1KV07_SOYBN). The other 12 were observed under 24 h of water stress, and they consisted of two downregulated proteins encoding the small chain and large chain of carboxylase diphosphate, respectively, and 10 upregulated proteins encoding alcohol dehydrogenase (EC 1.1.1.1) (I1 LP46_SOYBN), acetyl-coacetyltransferase (EC 2.3.1.7) (I1JJT9_SOYBN) and acetyltransferase component of dihydrolipoic acid lysine residue of pyruvate dehydrogenase complex (I1NHB5_SOYBN, 1.62), hydrogen peroxidase-3 (CATA3_SOYBN), coenzyme hydrase (EC 4.2.1.55) (K7 LNL2_SOYBN, 1.82), fructose diphosphate aldolase (I1 MB71_SOYBN), members of the acyl-coenzyme A dehydrogenase family (A0A0R0GAV8_SOYBN), enolase (EC 4.2.1.11) (I1JPW5_SOYBN), methyl propionate-semialdehyde dehydrogenase (I1KL66_SOYBN), and S-formylglutathione hydrolase (I1JGB2_SOYBN), which are mainly involved in glycolysis pathways, citric acid circulation, pentose phosphate pathway, and starch and sucrose metabolism. These proteins may play an important role in plant response to long-term water stress.
In the KEGG metabolic pathway enrichment analysis, 22 differentially expressed proteins related to energy metabolism were also identified. Of this, 11 were upregulated under water stress for 8 h, with 7 of them consistent with the proteins involved in photosynthesis under water stress for 8 h, 1 consistent with the carbon metabolism-related proteins upregulated under water stress for 8 h, and 3 that encoded chlorophyll a-b binding proteins 4 and 6 (I1JWU0_SOYBN, I1JCY2_SOYBN) and NAD(P)H-quinone oxidoreductase subunit 1 (sp|Q2PMN7|NU1C_SOYBN). In addition, 11 differentially expressed proteins were upregulated after 24 h of water stress, with 5 proteins consistent with the proteins involved in photosynthesis under 24 h of water stress; 1 consistent with the carbon metabolism-related protein encoding fructose diphosphorhydehyde enzymes; 4 proteins encoding carbonic anhydrase (EC 4.2.1.1) (I1K1G3_SOYBN), NADH dehydrogenase [ubiquinone] ferrosulfin (I1MZF9_SOYBN), ferroxyregen-1 (K7LVE8_SOYBN, I1LTF4_SOYBN), and V-type proton ATPase subunit F (C6SVI1_SOYBN); and 2 proteins encoding fructose diphosphaldehydrase and NADH dehydrogenase [perquinone] ferrosulfin. The remaining proteins were downregulated and mainly involved in photosynthesis, oxidative phosphorylation, and nitrogen metabolism.
To adapt to arid environments, plants respond to water stress by regulating their gene expression, which involves the production of new proteins and alteration of the expression of response proteins, resulting in changes at the plant morphological, physiological, and biochemical levels [16]. At present, an increasing number of scholars have used proteomics technology to investigate plant responses to abiotic stress, such as water stress, identify the key response genes under water stress, and reveal the metabolic pathways underlying plant responses to water stress. Yu et al. [17] used two-way electrophoresis to extract and separate proteins, then compared and analyzed the differences in protein abundance between the leaves of the drought-tolerant soybean variety G2120 and the drought-sensitive soybean variety Valder under mild and severe water stress conditions. They found that 38.5% of DEPs were related to energy metabolism and photosynthesis, followed by proteins related to defensive reactions (36.4%) and protein metabolism-related proteins (25.2%). In addition, more proteins exhibited different abundances under severe water stress, and the drought-sensitive variety had more significantly differentially expressed proteins than the drought-tolerant soybean. Further analysis showed that soybeans with different drought-tolerant genotypes also had different responses to water stress, with drought-tolerant soybeans showing higher reactive oxygen species and maintaining a higher energy supply than sensitive soybeans. Compared with previous studies, we studied the proteomic changes of drought-resistant varieties under short-term stress. This change can more directly reflect the direct impact of drought on plants, and is less affected by external environmental factors.
Khan et al. [18] analyzed the response mechanism of the lower cortex of soybean roots under water stress and found that the proteins whose expression changed during rehydration after water stress were associated with stress response, hormone metabolism, secondary metabolism, cell wall, redox, and glycolysis. Xie et al. [19] investigated proteomic changes in tobacco leaves under water stress and found that most differentially expressed proteins were involved in photosynthesis, metabolism, stress response, and defensive reactions, and that redox-induced posttranslational modifications may play an important role in the regulation of protein activities. Koh et al. [20] analyzed protein functions in rape leaves during water stress, and their results revealed that the number of proteins related to metabolism, protein folding and degradation, and signal conduction decreased, whereas the number of proteins related to water stress (photosynthesis), protein synthesis, stress, and defensive response increased.
Photosynthesis plays an important role in plant development [21]. Water stress directly affects photosynthesis, such as by limiting stomatal and mesophyll diffusion and altering photosynthetic metabolism [22]. Chlorophyll a-b binding proteins are enriched and important proteins in higher plant cystic membranes; they comprise more than 20 members and act as the coordinator of the antenna pigment light capture complexes in the photosystems (PSI and PSII) [23]. Wang et al. [24] used iTRAQ-based comparative proteomics to examine the protein expression profiles of tea tree seedlings under water stress, and found that the expression of chlorophyll a-b binding proteins was increased under water stress. However, although the expression of chlorophyll a-b binding proteins was not significantly increased under water stress, it was significantly elevated under salt stress [25]. The present study found that several chlorophyll a-b binding proteins were upregulated under water stress for 8 h, whereas only individual members of chlorophyll a-b binding protein (chlorophyll a-b binding protein 7 and chlorophyll a-b binding protein CP24 10A) were downregulated under water stress for 24 h, indicating that short-term water stress may maintain the function of the photosynthetic system II in soybean by regulating the expression of chlorophyll a/b binding protein, whereas prolonged water stress led to excessive photosynthesis inhibition.
The ability to maintain a positive balance between carbon assimilation and utilization is crucial for plants to survive and avoid carbon starvation under water conditions [26]. Glycolysis is an important pathway in sugar metabolism in plant cells. 6-Phosphate fructose kinase is the least catalytically efficient enzyme in this pathway, and most of it is irreversible; therefore, 6-phosphate fructose kinase is a rate-limiting enzyme in glycolysis [27]. Another key enzyme catalyzed in the glycolysis pathway is enolase, which is also an important enzyme in the CAM pathway and can convert 2-phosphoglyceric acid into phosphoenol acetone acid. Enolase is widely believed to be closely related to plant reversibility. It has been shown that abiotic stress, such as water stress, can increase the gene expression of enolase and thus enhance its enzymatic activity, thereby providing energy for repairing damaged cell structures, such as the photosynthetic systems [28]. This finding was further supported by differential expression at the protein level, indicating that the glucose fermentation pathway provides energy for the photosynthetic systems to reduce the damage caused by water stress.
Under adverse stress conditions, plants need to respond to stresses by regulating their energy metabolism to maintain the most basic energy level to ensure survival. A total of 22 differentially expressed proteins related to energy metabolism were identified in this study: 11 proteins related to photosynthesis were upregulated after 8 h of water stress, and 11 were differentially expressed following 24 h of water stress, with two of which encoding fructose diphosphorhydehyde enzyme and NADH dehydrogenase [ubiquinone] ferrosulfide protein. The remaining proteins, such as ferroproprotein-1 and carbonic anhydrase, were downregulated. These findings indicate that short-term water stress can enhance energy metabolism and production to promote photosynthesis as an adaptation to the adverse environment. On the contrary, long-term photosynthetic stress had a serious negative impact on plants, inhibiting energy metabolism processes, such as photosynthesis, oxidative phosphorylation, and nitrogen metabolism, to a certain degree. Ferroproteins in plants participate in photosynthesis, and their main role is to transfer electrons from photoreduction systems to ferroprotein NADP+ oxidoreductase, which is produced to absorb CO2 [29]. Ferroxin can also distribute the electrons generated by photoreduction systems to several ferroreductive-dependent enzymes that assimilate nitrogen and sulfur [30]. Gharechahi et al. [31] found that the abundance of tobacco ferroproteins decreased under water stress. Ferrooxidan was reduced at 24 h of water stress, indicating that prolonged water stress inhibited photoreduction systems during photosynthesis. Carbonic anhydrase catalyzes the reversible hydration of CO2, and it is an important photosynthase involved in CO2 conduction and entrance into the carboxylation site. Its activity significantly affects plant water use and photosynthesis [32]. Das et al. [33] performed proteomics analysis of the seedling leaves of soybean at 3 weeks of age and found that the expression of carbonic anhydrase was upregulated under water stress and combination of heat and water stress stresses. The downregulated expression of carbonic anhydrase after 24 h of water stress in this study was not consistent with the period of water stress in plants and the degree of water stress, and may also be related to the inhibition of photosynthesis due to prolonged water stress. However, this result is consistent with the results of this test and the downregulation of photosynthesis-related ketose carboxylase after 24 h of water stress. However, our study also has some limitations. We only studied the changes of soybean proteome under short-term water stress, which cannot represent a comprehensive drought resistance system. If we want to reveal the complete mechanisms of water stress resistance, we also need to carry out multi omics analysis under different water stress conditions, which is also the focus of our future work.
Water stress for 8 and 24 h led to the upregulation of 75 and 320 proteins, respectively, and downregulation of 70 and 84 proteins, including chlorophyll a-b binding protein related to photosynthesis, diphosphate ribonose carboxylase, carbon metabolism-related enolase, fructose diphosphorhydehyde, energy metabolism-related feroxyredoprotein, carbonic anhydrase, etc. The GO analysis found that differentially expressed proteins were mainly involved in molecular functions, such as catalytic activity and binding, metabolic processes and biological processes, such as cell processes. The KEGG analysis found that 8 metabolic pathways, including photosynthetic-antenna protein and phenylalanine metabolism, were significantly enriched by water stress for 8 h while five metabolic pathways, namely, valine, leucine and isoleucine degradation and glutathione metabolism, were significantly enriched by water stress for 24 h. Our research provides theoretical support for plant drought resistance breeding.
Acknowledgement: This work was supported by the Ministry of Science and Technology of the People’s Republic of China, and the Science and Technology Department of Heilongjiang Province, China.
Availability of Data and Materials: The mass spectrometry proteomics data have been deposited to the ProteomeXchange Consortium (http://proteomecentral.proteomexchange.org) via the iProX partner repository with the dataset identifier PXD028894.
Funding Statement: This research was funded by the National Key R&D Program of China, Grant No. 2020YFD1000902, and funded by Natural Science Foundation of Heilongjiang Province of China, Grant No. LH2021C023.
Conflicts of Interest:The authors declare that they have no conflicts of interest to report regarding the present study.
1. Khan, M. A., Sahile, A. A., Jan, R., Asaf, S., Hamayun, M. et al. (2021). Halotolerant bacteria mitigate the effects of salinity stress on soybean growth by regulating secondary metabolites and molecular responses. BMC Plant Biology, 21(1), 176. DOI 10.1186/s12870-021-02937-3. [Google Scholar] [CrossRef]
2. Otie, V., Udo, I., Shao, Y., Itam, M. O., Okamoto, H. et al. (2021). Salinity effects on morpho-physiological and yield traits of soybean (Glycine max L.) as mediated by foliar spray with brassinolide. Plants, 10(3), 541. DOI 10.3390/plants10030541. [Google Scholar] [CrossRef]
3. Zhao, Q., Shi, X., Yan, L., Yang, C., Liu, C. et al. (2021). Characterization of the common genetic basis underlying seed hilum size, yield, and quality traits in soybean. Frontiers in Plant Science, 12, 610214. DOI 10.3389/fpls.2021.610214. [Google Scholar] [CrossRef]
4. Tilman, D., Balzer, C., Hill, J., Befort, B. L. (2011). Global food demand and the sustainable intensification of agriculture. Proceedings of the National Academy of Sciences of the United States of America, 108(50), 20260–20264. DOI 10.1073/pnas.1116437108. [Google Scholar] [CrossRef]
5. Ray, D. K., Mueller, N. D., West, P. C., Foley, J. A. (2013). Yield trends are insufficient to double global crop production by 2050. PLoS One, 8(6), e66428. DOI 10.1371/journal.pone.0066428. [Google Scholar] [CrossRef]
6. Scudeletti, D., Crusciol, C., Bossolani, J. W., Moretti, L. G., Momesso, L. et al. (2021). Trichoderma asperellum inoculation as a tool for attenuating drought stress in sugarcane. Frontiers in Plant Science, 12, 645542. DOI 10.3389/fpls.2021.645542. [Google Scholar] [CrossRef]
7. Shi, W., Wang, M., Liu, Y. (2021). Crop yield and production responses to climate disasters in China. Science of the Total Environment, 750, 141147. DOI 10.1016/j.scitotenv.2020.141147. [Google Scholar] [CrossRef]
8. Zipper, S. C., Qiu, J., Kucharik, C. J. (2016). Drought effects on US maize and soybean production: Spatiotemporal patterns and historical changes. Environmental Research Letters, 11(9), 094021. DOI 10.1088/1748-9326/11/9/094021. [Google Scholar] [CrossRef]
9. Aslam, B., Basit, M., Nisar, M. A., Khurshid, M., Rasool, M. H. (2017). Proteomics: Technologies and their applications. Journal of Chromatographic Science, 55(2), 182–196. DOI 10.1093/chromsci/bmw167. [Google Scholar] [CrossRef]
10. Wang, X., Cai, X., Xu, C., Wang, Q., Dai, S. (2016). Drought-responsive mechanisms in plant leaves revealed by proteomics. International Journal of Molecular Sciences, 17(10), 1706. DOI 10.3390/ijms17101706. [Google Scholar] [CrossRef]
11. Zeng, W., Peng, Y., Zhao, X., Wu, B., Chen, F. et al. (2019). Comparative proteomics analysis of the seedling root response of drought-sensitive and drought-tolerant maize varieties to drought stress. International Journal of Molecular Sciences, 20(11), 2793. DOI 10.3390/ijms20112793. [Google Scholar] [CrossRef]
12. Li, Y., Zhang, Q., Yu, Y., Li, X., Tan, H. (2020). Integrated proteomics, metabolomics and physiological analyses for dissecting the toxic effects of halosulfuron-methyl on soybean seedlings (Glycine max merr.). Plant Physiology and Biochemistry, 157, 303–315. DOI 10.1016/j.plaphy.2020.10.033. [Google Scholar] [CrossRef]
13. Katam, R., Shokri, S., Murthy, N., Singh, S. K., Suravajhala, P. et al. (2020). Proteomics, physiological, and biochemical analysis of cross tolerance mechanisms in response to heat and water stresses in soybean. PLoS One, 15(6), e0233905. DOI 10.1371/journal.pone.0233905. [Google Scholar] [CrossRef]
14. Gene Ontology Consortium (2004). The Gene Ontology (GO) database and informatics resource. Nucleic Acids Research, 32(suppl_1), D258–D261. DOI 10.1093/nar/gkh036. [Google Scholar] [CrossRef]
15. Kanehisa, M., Goto, S. (2000). KEGG: Kyoto encyclopedia of genes and genomes. Nucleic Acids Research, 28(1), 27–30. DOI 10.1093/nar/28.1.27. [Google Scholar] [CrossRef]
16. Michaletti, A., Naghavi, M. R., Toorchi, M., Zolla, L., Rinalducci, S. (2018). Metabolomics and proteomics reveal drought-stress responses of leaf tissues from spring-wheat. Scientific Reports, 8(1), 5710. DOI 10.1038/s41598-018-24012-y. [Google Scholar] [CrossRef]
17. Yu, X., James, A. T., Yang, A., Jones, A., Mendoza-Porras, O. et al. (2016). A comparative proteomic study of drought-tolerant and drought-sensitive soybean seedlings under drought stress. Crop and Pasture Science, 67(5), 528–540. DOI 10.1071/CP15314. [Google Scholar] [CrossRef]
18. Khan, M. N., Komatsu, S. (2016). Proteomic analysis of soybean root including hypocotyl during recovery from drought stress. Journal of Proteomics, 144, 39–50. DOI 10.1016/j.jprot.2016.06.006. [Google Scholar] [CrossRef]
19. Xie, H., Yang, D. H., Yao, H., Bai, G., Zhang, Y. H. et al. (2016). iTRAQ-based quantitative proteomic analysis reveals proteomic changes in leaves of cultivated tobacco (Nicotiana tabacum) in response to drought stress. Biochemical and Biophysical Research Communications, 469(3), 768–775. DOI 10.1016/j.bbrc.2015.11.133. [Google Scholar] [CrossRef]
20. Koh, J., Chen, G., Yoo, M. J., Zhu, N., Dufresne, D. et al. (2015). Comparative proteomic analysis of Brassica napus in response to drought stress. Journal of Proteome Research, 14(8), 3068–3081. DOI 10.1021/pr501323d. [Google Scholar] [CrossRef]
21. Wu, Y., Fang, W., Peng, W., Jiang, M., Chen, G. et al. (2021). Sucrose transporter in rice. Plant Signaling & Behavior, 16(11), 1952373. DOI 10.1080/15592324.2021.1952373. [Google Scholar] [CrossRef]
22. Chaves, M. M., Flexas, J., Pinheiro, C. (2009). Photosynthesis under drought and salt stress: Regulation mechanisms from whole plant to cell. Annals of Botany, 103(4), 551–560. DOI 10.1093/aob/mcn125. [Google Scholar] [CrossRef]
23. Silva, J., Kim, Y. J., Sukweenadhi, J., Rahimi, S., Kwon, W. S. et al. (2016). Molecular characterization of 5-chlorophyll a/b-binding protein genes from Panax ginseng Meyer and their expression analysis during abiotic stresses. Photosynthetica, 54(3), 446–458. DOI 10.1007/s11099-016-0189-7. [Google Scholar] [CrossRef]
24. Wang, Y., Fan, K., Wang, J., Ding, Z. T., Wang, H. et al. (2017). Proteomic analysis of Camellia sinensis (L.) reveals a synergistic network in the response to drought stress and recovery. Journal of Plant Physiology, 219, 91–99. DOI 10.1016/j.jplph.2017.10.001. [Google Scholar] [CrossRef]
25. El Rabey, H. A., Al-Malki, A. L., Abulnaja, K. O., Rohde, W. (2015). Proteome analysis for understanding abiotic stress (salinity and drought) tolerance in date palm (Phoenix dactylifera L.). International Journal of Genomics, 2015, 407165. DOI 10.1155/2015/407165. [Google Scholar] [CrossRef]
26. McDowell, N., Allen, C. D., Anderson-Teixeira, K., Brando, P., Brienen, R. et al. (2018). Drivers and mechanisms of tree mortality in moist tropical forests. New Phytologist, 219(3), 851–869. DOI 10.1111/nph.15027. [Google Scholar] [CrossRef]
27. Yao, K., Wu, Y. Y. (2016). Phosphofructokinase and glucose-6-phosphate dehydrogenase in response to drought and bicarbonate stress at transcriptional and functional levels in mulberry. Russian Journal of Plant Physiology, 63(2), 235–242. DOI 10.1134/S102144371602014X. [Google Scholar] [CrossRef]
28. Hu, X., Lu, M., Li, C., Liu, T., Wang, W. et al. (2011). Differential expression of proteins in maize roots in response to abscisic acid and drought. Acta Physiologiae Plantarum, 33(6), 2437–2446. DOI 10.1007/s11738-011-0784-y. [Google Scholar] [CrossRef]
29. Fukuyama, K. (2004). Structure and function of plant-type ferredoxins. Photosynthesis Research, 81(3), 289–301. DOI 10.1023/B:PRES.0000036882.19322.0a. [Google Scholar] [CrossRef]
30. Jangpromma, N., Kitthaisong, S., Lomthaisong, K., Daduang, S., Jaisil, P. et al. (2010). A proteomics analysis of drought stress-responsive proteins as biomarker for drought-tolerant sugarcane cultivars. American Journal of Biochemistry and Biotechnology, 6(2), 89–102. DOI 10.3844/ajbbsp.2010.89.102. [Google Scholar] [CrossRef]
31. Gharechahi, J., Hajirezaei, M. R., Salekdeh, G. H. (2015). Comparative proteomic analysis of tobacco expressing cyanobacterial flavodoxin and its wild type under drought stress. Journal of Plant Physiology, 175(87–93), 48–58. DOI 10.1016/j.jplph.2014.11.001. [Google Scholar] [CrossRef]
32. Sun, W. H., Xu, Qiu, Wen, X. Y., He, H. G., Wu, Y. Y. et al. (2015). Changes of carbonic anhydrase activities in tomato leaves under drought stress. Plant Physiology Journal, 51(4), 424–428. DOI 10.13592/j.cnki.ppj.2014.0464. [Google Scholar] [CrossRef]
33. Das, A., Eldakak, M., Paudel, B., Kim, D. W., Hemmati, H. et al. (2016). Leaf proteome analysis reveals prospective drought and heat stress response mechanisms in soybean. BioMed Research International, 2016(8), 6021047. DOI 10.1155/2016/6021047. [Google Scholar] [CrossRef]
 | This work is licensed under a Creative Commons Attribution 4.0 International License, which permits unrestricted use, distribution, and reproduction in any medium, provided the original work is properly cited. |