

 | Phyton-International Journal of Experimental Botany |  |
DOI: 10.32604/phyton.2022.018836
ARTICLE
Cloning of the Soybean sHSP26 Gene and Analysis of Its Drought Resistance
1College of Life Sciences, Jilin Agricultural University, Changchun, 130118, China
2College of Agronomy, Jilin Agricultural University, Changchun, 130118, China
*Corresponding Authors: Siyan Liu. Email: siyan_2001@163.com; Shuyan Guan. Email: guanshuyan@jlau.edu.cn
Received: 20 August 2021; Accepted: 20 December 2021
Abstract: Exploring the molecular mechanism of soybean response to drought stress, providing a basis for genetic improvement and breeding of heat-resistant varieties, relying on the transcriptome sequencing data of unpollinated ovary at the seven-leaf stage of soybean Jinong 18(JN18) and Jinong 18 mutant (JB18) soybeans, using reverse transcription, one gene in the sHSP family was cloned using PCR (RT-PCR) and it was named sHSP26. In this experiment, the soybean sHSP26 gene was successfully cloned by RT-PCR, the protein encoded by the sHSP26 gene was analyzed by bioinformatics, and the sHSP26 gene overexpression vector and CRISPR/Cas9 gene-editing vector were constructed. The positive plants were derived from Agrobacterium-mediated transformation of soybean cotyledon nodes, and T2 plants were identified through conventional PCR, QT-PCR, and Southern blot hybridization. Finally, through the determination of drought-related physiological and biochemical indicators and the analysis of agronomic traits, further research on gene function was conducted. The results indicated that the overexpression vector plant GmsHSP26 gene expression increased. After stress, the SOD and POD activities, and the PRO content of the transgenic overexpression plants increased, while the MDA content decreased. The reverse was true for soybean plants with genetically modified editing vectors. A survey of agronomic traits indicated that the four-pod ratio and yield per plant of the transgenic overexpression plants were higher than those of the control and transgenic editing vector soybean plants. It indicates that the expression of the sHSP26 gene can enhance drought resistance and soybean yield. The soybean sHSP26 gene cloning and its functional verification have not yet been reported. This is the first report where PCR amplification of soybean sHSP26 genes and gene expression vector were applied. It lays the foundation for creating new drought-resistant transgenic soybean lines through genetic engineering technology and is essential for improving soybean yield and quality.
Keywords: Soybean; ovary differentially expressed genes; sHSP26 gene; new drought-resistant
Heat-shock protein (HSP) was first discovered by Ritossa in the salivary glands of Drosophila larvae in 1962 [1], after which it was officially named by Tissieres in 1974, and it is found in almost all organisms [2]. HSP is a universal protective protein with antistress effects. It is a vital protein in the process of plant growth and development. It plays an essential regulatory role when plants are in adversity [3]. According to the relative molecular weight, HSP is divided into five major families: HSP100, HSP90, HSP70, HSP60, and sHSP [4]. sHSP is a type of HSP with a molecular weight of 15–40 ku in the HSP family. Plant sHsps can cope with different environmental pressures, including heat, cold, drought, salinity, and oxidative stress. sHsps also interact with the thylakoid membrane and participate in plant resistance [5]. Research by Huang et al. [6] indicated that overexpression of CaHSP16.4 in pepper enhances the ability to remove reactive oxygen species under high temperature and drought stress; research by Sato et al. [7] showed enhanced tolerance to drought stress in transgenic rice plants overexpressing a sHSP, sHSP17.7; Assab et al. [8] found that Olea europaea would express sHSP18.3. This indicates that sHsps are inseparable from the drought tolerance of plants. Under drought stress, plants can respond to the adverse effects of drought by inducing the expression of sHsps genes, and actively adapting to the poor drought environment.
Leguminosae is the family with the largest number of species in angiosperms, and soybean (Glycine max (L.) Merr.) has the most extensive planting range [9]. Soybean is native to China and is the fourth largest crop after rice (Oryza sativa), wheat (Triticum aestivum) and corn (Zea mays) [10,11]. It is an essential source of protein and oil and an important cash crop and food crop [12]. Adversity stresses, such as drought are unfavorable environmental factors that affect soybean growth and development, resulting in reduced quality and yield and severely restricting soybean industry development [13].
In this study, molecular biology technology and bioinformatics analysis methods were used to clone the soybean sHSP26 gene and to predict the qualities as well as the functions of the encoded protein to understand the molecular features of the sHSP26 gene. The expression pattern under heat stress was analyzed to provide a basis for future research on soybean response to abiotic stress. Through gene cloning, vector construction, soybean genetic transformation, etc., the “JN18” soybean transgenic positive plants were obtained, and the offspring were analyzed to identify the drought resistance function of the gene. The research results will provide essential clues for the analysis of the function of soybean sHSP26, provide a scientific basis for further exploring its molecular mechanism, and lay a foundation for creating new drought-resistant genetically modified soybean lines through genetic engineering technology.
In this experiment, the plant materials were JN18 and TB18 soybean, both provided by the Biotechnology Center for plant of Jilin Agricultural University.
JN18 is a soybean variety approved by the Jilin Provincial Crop Variety Approval Committee. It is bred systematically for many years from the offspring materials of foreign hybrid combinations. It is a mid-maturing variety, and its growth period is about 124 d. This variety has excellent traits, such as resistance to fertilizer and water and resistance to lodging, but its ability to resist drought and other traits are relatively weak. Our center obtained TB18 under drought stress in 2008. After years of planting, it was found that the mutant still has a very stable drought resistance and a high proportion of four pods.
The main reagents and their commercial sources were listed in Table 1. Gene primers for synthesis and sequencing were provided by the Kumei Biotechnology Company (Changchun, China).


According to the results of transcriptome sequencing of unpollinated JN18 and TB18 soybean ovaries at the seven-leaf stage using the Illumina/Solexa sequencing platform, 461 genes upregulated and 261 downregulated in TB18 were found. Twenty-one differentially expressed genes were screened from these genes, and the upregulated gene GmZFCY08 in TB18 soybean was selected as the research object. After querying the soybase database and comparing it with the NCBI database, it was determined that the gene is found in the soybean sHSP gene on chromosome 6, and ProtParam online software was later used to predict the molecular weight of the protein encoded by the gene to be 26059.52D, so the gene was named GmsHSP26. There is no relevant report on the specific function of this gene at home and abroad.
2.5 Cloning of Soybean sHSP26 Gene
Following the nucleotide sequence of the soybean sHSP26 gene, Primer Premier 5.0 software was used to design specific primers GmZFCY08 S/AS, to facilitate the construction of the overexpression vector; the restriction sequences of Bgl II and BstE II were directly introduced at the 5′ ends of the two primers. The cDNA generated using reverse transcription of total RNA from the TB18 soybean ovary was used as a template, and GmZFCY08 S/AS primers were used for PCR amplification. The amplification results were detected using 1% agarose gel electrophoresis. The recovered and purified PCR product was ligated using the pMD-18T cloning vector overnight at 16°C, and the ligation product was transformed into Escherichia coli DH5α competent cells. Then single colonies were picked up on the transformation plate, they were placed in test tubes added with 5 mL of LB + Kan liquid medium, and cultivate overnight at 37°C, shaking at 200 rpm. We used the cultured bacterial solution as a template and GmZFCY08 S/AS as primers for PCR amplification. If the size of the bacterial solution PCR product was correct, the plasmid was extracted and it was used as the template for plasmid PCR identification.
PCR was used to detect the correct size plasmid as a template. According to the restriction enzyme site introduced when cloning the gene, the constructed recombinant cloning vector was identified using double-enzyme digestion with Bgl II and BstE II restriction enzymes. The digestion reaction was conducted at 37°C for four hours. The reaction was terminated at 65°C for 20 min, and the double digestion results were detected using 1% agarose gel electrophoresis. The recombinant cloning vector plasmid was verified using PCR, and double-enzyme digestion was sent to Changchun Kumei of Jilin Province Biotechnology Laboratory Company for sequencing.
2.6 Sequence Analysis of Target Genes
The ProtParam online software was used to analyze the molecular weight, theoretical isoelectric point, molecular formula, extinction coefficient, instability coefficient, and other basic physical and chemical characteristics of the protein encoded by the soybean sHSP26 gene. NCBI Conserved Domain Search Service analyzed the gene’s protein sequence, ProtScale analyzed the hydrophilicity and hydrophobicity of genes, SignalP performed signal peptide prediction analysis on amino acid sequences, COILS performed coiled-coil prediction analysis on amino acid sequences, and Swiss-Model performed protein tertiary structure prediction.
2.7 Construction and Identification of Overexpression Vectors
The recombinant cloning vector plasmid was used as a template to conduct PCR amplification. The PCR amplification products and plant expression vectors pCAMBIA3301 plasmid are double-enzyme digested with Bgl II, BstE II. The digested products are recovered with a DNA product gel recovery kit, and then with T4 Ligase connects the two double digestion products. The T-DNA structure of the plant overexpression vector pCAMBIA3301-sHSP26 to be constructed is illustrated in Fig. 1.

Figure 1: T-DNA structure of the plant overexpression vector pCAMBIA3301-sHSP26
Single colonies on the transformed plates were picked in liquid medium from LB + Kan, cultured at 37°C overnight with shaking, plasmids were extracted using the kit, and identification of the constructed pCAMBIA3301-sHSP26 vector was conducted using PCR, double digestion, and sequencing to confirm whether the target gene was successfully connected to the pCAMBIA-3301 vector.
2.8 CRISPR/Cas9 Gene-Editing Carrier to Build, Test, and Verify
The CRISPR vector pCBSG015-sHSP26 of the soybean sHSP26 gene was constructed using the steps in the CRISPR/Cas vector construction kit of Biotech. The Oligoprimers 8 UP/Low Oligo used in the vector construction are illustrated in Table 2. After completing the vector construction, the reaction products were transformed into Escherichia coli DH5α competent cells. Then, the bacterial solution was spread on the solid plate of LB + Kan, and the culture was inverted overnight.
Single colonies on the transformed plates were picked and cultured overnight in LB + Kan liquid medium, shaking at 37°C. Plasmids were extracted using the Wiglas Plasmid Mini Extraction Kit and using Bar S/AS primers for PCR amplification. The Bar gene on the CRISPR vector was identified using plasmid PCR and sequencing primer CRI.
2.9 Agrobacterium-Mediated Transformation of Soybeans
The plasmid DNA of pCAMBIA3301-sHSP26 and pCBSG015-sHSP26 vectors were extracted and transformed into Agrobacterium competent cells EHA105. Single colonies on the transformation plate were picked and cultured in YEP + Kan liquid medium, shaking at 28°C overnight. Agrobacterium engineering bacteria liquid as a template, GmZFCY08 S/AS primers to plant overexpression vector pCAMBIA3301-sHSP26, and BarS/AS primers to pCBSG015-sHSP26 vector for bacterial liquid PCR verification were used to verify that the correct bacterial liquid was used for the genetic transformation of soybean. For transformation methods and steps, see Qu [14].
2.10 Detection of Transgenic Progeny Plants
2.10.1 PCR Detection of T2 Transgenic Plants
The plant genomic DNA extraction kit of Kang Wei Reagent Company (China) was used to extract the genomic DNA of the leaves of untransformed and T2 transformed soybean plants. The transformation of the transgenic progeny plants was detected by PCR using BarS/AS primers.
2.10.2 Southern Blot Hybridization Identification of T2 Transgenic Plants
Extracting the leaf genomic DNA of the T2 generation soybean transformed plants and untransformed plants identified as positive using PCR with pCAMBIA3301-sHSP26 plasmid, and the restriction enzyme Hind Ш for single enzyme digestion, and Southern blotting was used to detect the gene integration. Specific steps see Lin et al. [15].
2.10.3 QT-PCR Detection of Target Genes in T2-Generation Plants
The T2 generation overexpression vectors and CRISPR vectors were extracted to transform the ovary RNA of soybean-positive plants and JN18 soybean plants and reverse transcribed to generate cDNA. The cDNA generated by reverse transcription was used as a reference gene. YP15 and YP16 were used as primers, the soybean β-actin was used as an internal control, and the expression of the sHSP26 gene in untransformed JN18 soybeans was used as a control to perform fluorescence quantification and PCR detection on transgenic plants, and calculation and analysis of relative gene expression based on 2−ΔΔCt.
2.11 Research on Soybean sHSP26 Gene Function
2.11.1 Detection of Drought Resistance, and Physiological and Biochemical Indexes of T2 Transgenic Plants
When the T2 generation positively transformed plants and the control JN18 plants had three compound leaves, the whole plants were removed, washed, and placed in a solution of MS liquid medium with 400 mM mannitol. Soybean leaves were taken before and six hours after mannitol treatment, respectively. Then, the physiological and biological indicators of superoxide dismutase (SOD) activity, peroxidase (POD) activity, maldialaldehyde (MDA) content, proline (PRO) content, etc., related to drought resistance of plants (for specific methods, see the test kit instructions of Keming Biology Company (Suzhou, China)), were tested. The data were sorted and analyzed using the DPS data processing system. The drought resistance changes of transgenic plants after simulated drought stress, and then the function of the soybean sHSP26 gene were analyzed.
2.11.2 Investigation of Agronomic Traits of T2 Transgenic Plants
Plant height, node number, branch number, pod number, number of three pods, number of four pods, 100-seed weight, and yield were determined per plant on T2 generation transgenic and control plants. DPS was used to process the data obtained to study the influence of soybean sHSP26 gene expression on agronomic traits of transgenic plants.
3.1 Cloning of Soybean sHSP26 Gene
Using the cDNA generated by reverse transcription of total RNA from the TB18 soybean ovary at the seven-leaf stage as a template, the sHSP26 gene was cloned (Fig. 2). It was consistent with the size of soybean sHSP26 gene. The PCR (Fig. S1) and double enzyme digestion identification of the recombinant cloning vector (Fig. S2) proved that the sHSP26 gene was successfully cloned, and the cloning vector of the gene was recombined.
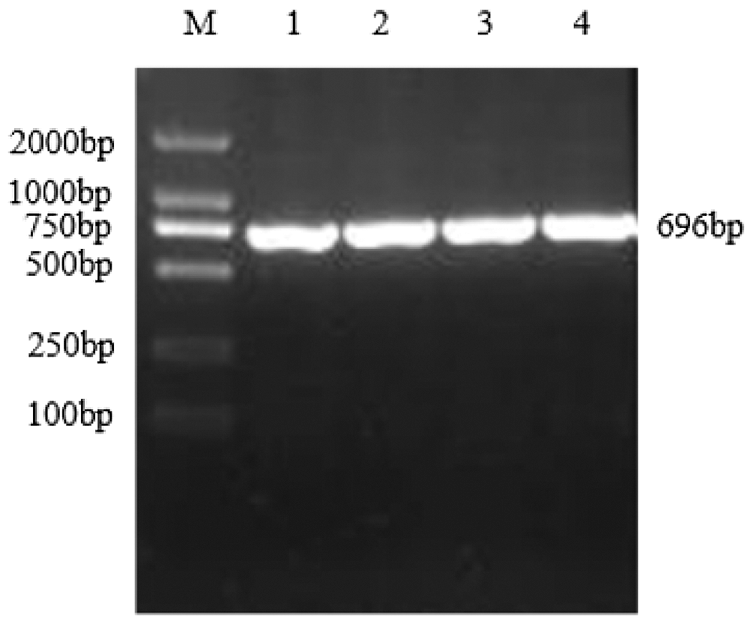
Figure 2: PCR products of sHSP26 gene in soybean
Note: M: DL2000 DNA; Marker 1–4: PCR products
3.2 Sequence Analysis of Target Genes
The bioinformatics analysis of the soybean sHSP26 gene indicated that the molecular weight of the protein encoded by the gene was 26059.52D, the theoretical isoelectric point pI was 6.98, the molecular formula was C1130H1818N330O355S11, the extinction coefficient measured at 280 nm was 22585, and the instability coefficient was 36.98. The protein was stable, with a fat coefficient of 72.12 and a total average hydrophilicity (GRAVY) of −0.705, showing that the protein was a hydrophilic protein. The protein encoded by this gene belonged to the alpha-crystallin-Hsps_p23-like superfamily and contained the alpha-crystallin domain (Fig. S3). When |Score| ≥ 1.5 was used as the threshold, these two regions were highly hydrophilic, which confirmed that the protein encoded by the soybean sHSP26 gene was a hydrophilic protein (Fig. S4). The protein encoded by the gene had no signal peptide sequence in the coding region, showing that the protein was nonsecreted (Fig. S5). The protein encoded by the soybean sHSP26 gene detected six coiled-coil regions in Window14 (Fig. S6). The coverage of the amino acid sequence of the protein and the template (Coverage) was 0.61, the identity (Seq Identity) was 55%, there was no ligand, and the global model quality estimate (GMQE) was 0.56 (Fig. S7).
3.3 Construction and Verification of Overexpression Vector
Using the recombinant vector plasmid as a template, GmZFCY08 S and GmZFCY08 AS were used for PCR amplification. The constructed recombinant plant overexpression vector pCAMBIA3301-sHSP26 can amplify a specific band of about 696 bp, which preliminarily confirms that the plant overexpression vector pCAMBIA3301-sHSP26 was successfully constructed (Fig. S8). To further verify the success of the construction of the plant overexpression vector pCAMBIA3301-sHSP26, the constructed recombinant plant overexpression vector was digested and identified using Bgl II and BstE II. The obtained band size was consistent with the expectation, and the sequence alignment was 100% (Fig. S9). Uniformly, the proof shows that the plant overexpression vector was successfully constructed.
3.4 CRISPR/Cas9 Gene-Editing Carrier to Build, Test, and Verify
The CRISPR/Cas vector construction kit of Bioge Biotech was used to construct the CRISPR vector of the soybean sHSP26 gene. A specific band of about 428 bp was obtained using PCR amplification, which was consistent with the expected size (Fig. S10). PCR identified the correct plasmid, and the sequencing primer CRI was used to sequence it, and then the construction of the soybean sHSP26 gene CRISPR vector was identified. The sequencing result was 100% consistent with the sequence to be compared, proving that the soybean pCBSG015-sHSP26 vector was successfully constructed.
3.5 Agrobacterium-mediated Transformation of Soybeans
The successfully constructed pCAMBIA3301-sHSP26 and pCBSG015-sHSP26 plasmids were transformed into Agrobacterium EHA105 competent cells. The target bands were amplified using PCR amplification of the two bacterial liquids, and the size was consistent with the expectation, which confirmed that the two Agrobacterium engineering bacterial liquids can be used for the genetic transformation of soybeans (Fig. 3).
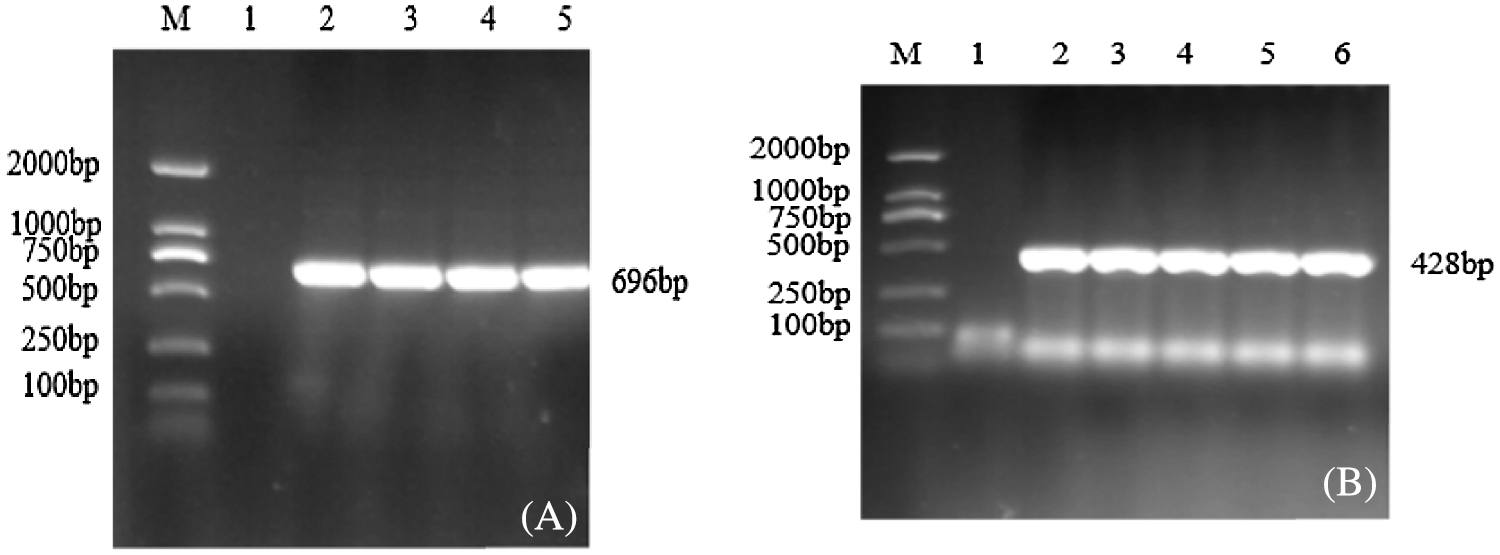
Figure 3: PCR verification of Agrobacterium bacteria solution
Note: M: DL2000; Marker 1: Negative control; 2–6: PCR product. (A) Overexpression vector bacteria solution PCR; (B) Interference expression vector Bacteria solution PCR
3.6 Detection of Transgenic Progeny Plants
3.6.1 PCR Identification of Transgenic T2 Plants with Overexpression Vector
JN18 untransformed plants and soybean plant leaf genomic DNA transformed with the overexpression vector pCAMBIA3301-sHSP26 were extracted, and BarS/AS was used to conduct the PCR amplification on the extracted genomic DNA. The PCR product of the overexpression vector plasmid was used as a positive control. There was a negative control, and the results are indicated in Fig. 4. Through the Agrobacterium-mediated transformation, 23 T0-resistant plants were obtained. PCR was used to test two of the T0-resistant plants, and the results were positive. The T0 PCR-positive seeds were harvested and planted in the greenhouse. The leaf genomic DNA of the T1 generation plants was used. As a template for PCR detection, the results of three plants were positive. The T1 generation seeds were harvested and planted in the genetically modified experimental field of Jilin Forestry Agricultural University, and the T2 generation plants were subjected to PCR detection.

Figure 4: PCR detection of transgenic plants of overexpression vector
Note: M: DL2000; Marker 1: Plasmid (Positive control); 2: H2O; 3–12: PCR products (A–C) are T0, T1 and T2 PCR test results
3.6.2 PCR Identification of Transgenic T2 Plants with CRISPR/Cas9 Vector
Extracting the genomic DNA of soybean plant leaves that had not been transformed using JN18 and the pCBSG015-sHSP26 vector, genomic DNA was used as a template, Bar S/AS as primers, and PCR detection was performed on soybean plants. Using the PCR amplification product of pCBSG015-sHSP26 plasmid as a positive control and water as the negative control, the results are indicated in Fig. 5. After the Agrobacterium-mediated transformation, a total of 29 resistant plants of T0 generation were obtained, and three plants were positive using PCR (Fig. 5A). T0 PCR-positive seeds were harvested and planted in the greenhouse. After testing T1, the test results of 6 plants in the first generation were positive (Fig. 5B). The T1 generation seeds were harvested, planted in a genetically modified experimental field of Jilin Agricultural University, and randomly sampled. PCR detection was conducted on the T2 generation plants. Part of the test results of the T2 generation is indicated in Fig. 5C.

Figure 5: PCR detection of transgenic plants of interference expression vector
Note: M: DL2000; Marker 1: Plasmid (Positive control); 2: H2O; 3–15: PCR product (A–C) are T0, T1 and T2 PCR test results
3.6.3 Southern Blot Hybridization Identification of T2 Transgenic Plants
The genomic DNA was obtained from the leaves of the T2 overexpression vector soybean plants and JN18 control plants that were identified as positive using PCR; digest overnight with Hind Ш restriction enzymes, using the vector plasmid as a positive control, the probe was prepared using Bar, and performing Southern blotting, the test results are indicated in Fig. 6. It can be seen from the figure that the untransformed plants had no hybridization signal. Among the tested plants of the T2 generation transformed with the overexpression vector, plants two, three, and four all had hybridization signals, and they wereall single copies. Still, the sites of gene integration were different. Plant No. 1 did not exhibit a hybridization signal, indicating that the gene had not been integrated into the plant genome and it was a false-positive plant.
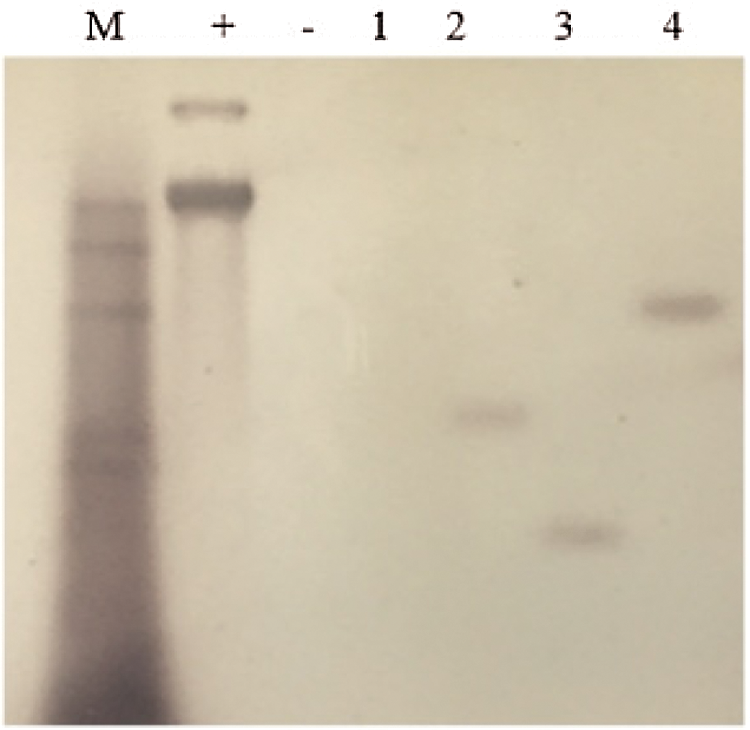
Figure 6: Southern Blot hybridization of T2 transgenic plants
Note: M: Southern dedicated Marker; +: Positive control; −: untransformed plants; 1–4: T2 transformed plants
3.6.4 QT-PCR Detection of Target Genes in T2-Generation Plants
Extracting three transgenic strains (transgenic OV8-1, OV8-2) transfected using overexpression vector and two transgenic strains (CR8-1, CR8-3) transfected using CRISPR vector of T2 generation and control JN18 soybean plant ovary RNA, and reverse transcription to generate cDNA. Using cDNA as template, YP15, and YP16 as primers, and soybean β-actin as internal control, fluorescence quantitative PCR detection was performed. The relative expression of the sHSP26 gene was calculated and analyzed based on 2−ΔΔCt. It can be seen from Fig. 7 that the relative expression level of the target gene in the CR8-1 strain was the lowest, which was 48% of the control plant, and the relative expression level of the OV8-2 strain was the highest, which was 35.13, and significantly different among the strains (P < 0.01).
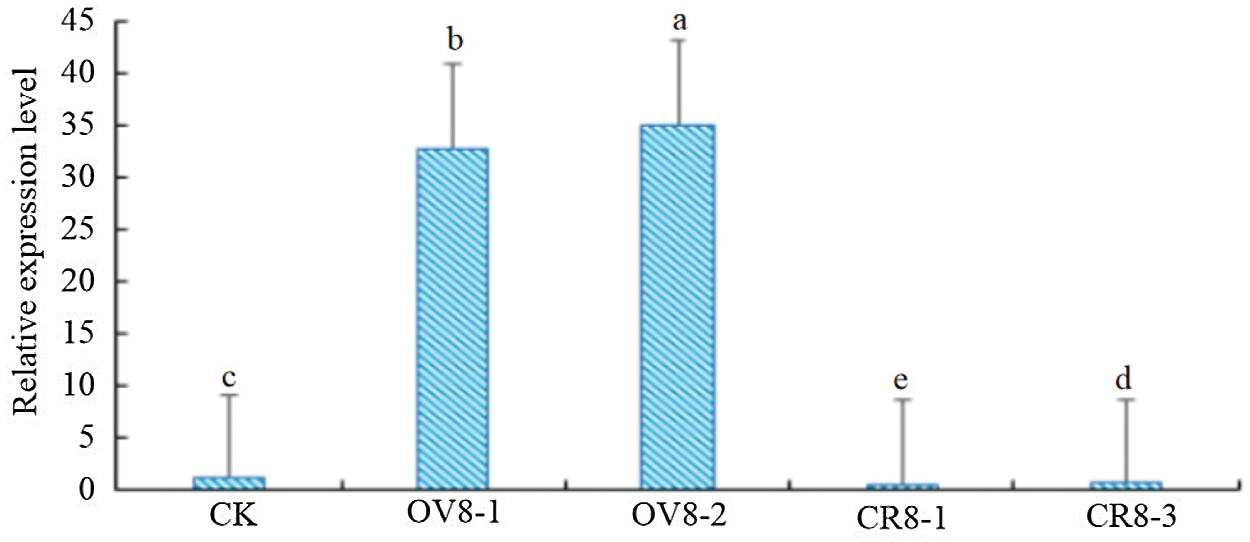
Figure 7: QT-PCR identification of T2 generation plants
3.7 Study on the Function of Soybean sHSP26 Gene
3.7.1 Detection of SOD Activity in T2 Transgenic Plants
Using the superoxide dismutase kit of Keming Biology Company (China) to transfer pCAMBIA3301-HSP26 (OV8-1, OV8-2) and CRISPR-sHSP26 (CR8-1, CR8-3) T2 transgenic soybean strains, the SOD activity was detected before and six hours after mannitol stress and the control JN18, and the experimental data were analyzed using DPS software (Fig. 8). The results indicated that the SOD value changed significantly in the different strains and before as well as after treatment (P < 0.05). The figure shows that the soybean strains transferred to the overexpression vector exhibited a trend of a significant increase in SOD activity after stress. The higher the SOD activity, the stronger the tolerance of the plant to drought.
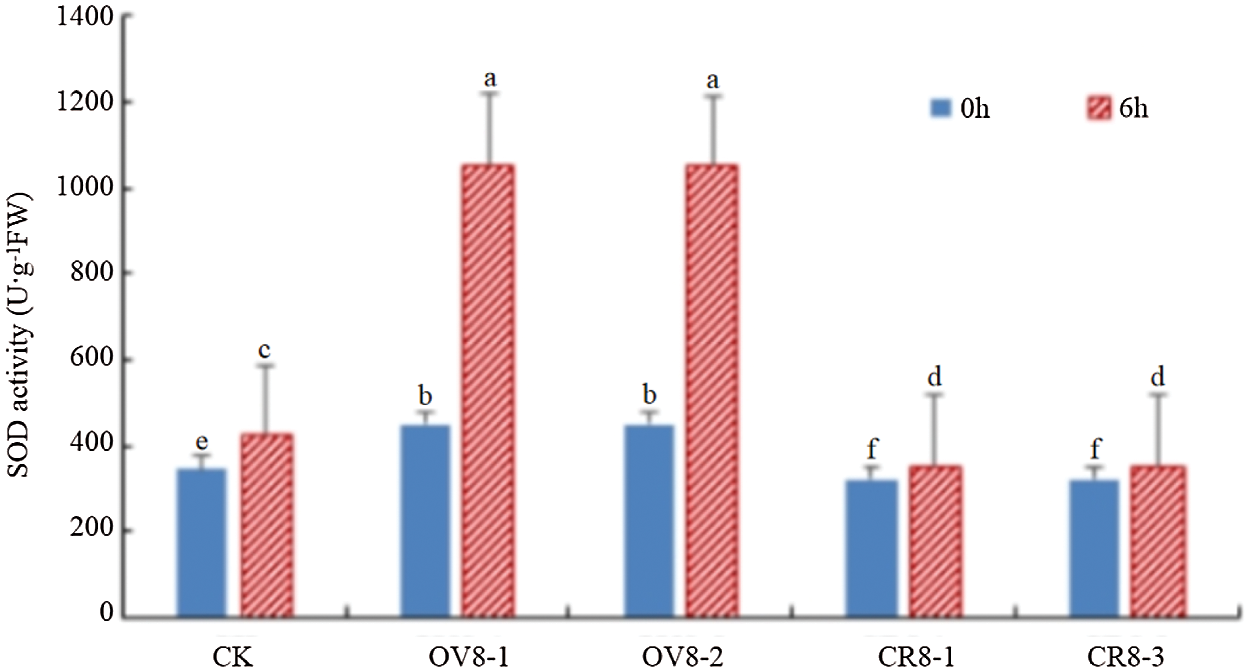
Figure 8: SOD activity detection
3.7.2 Detection of POD Activity in T2 Transgenic Plants
The kit was used to test the POD activity of the transgenic soybean strains and the control JN18 before and after mannitol stress. The results are indicated in Fig. 9. It can be seen from the figure that POD activity in the plant was significantly (P < 0.05) enhanced after mannitol stress. POD activity: overexpression plants > control plants > CRISPR plants.
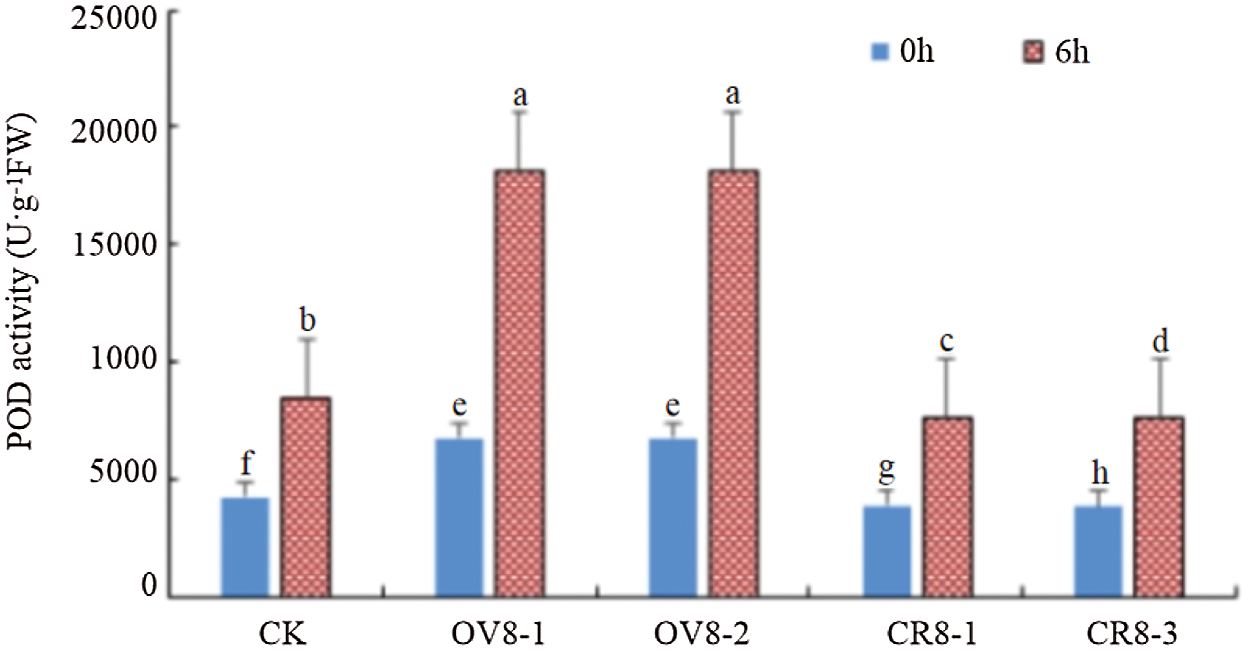
Figure 9: POD activity detection
3.7.3 Detection of MDA Content in T2 Transgenic Plants
When plants are under drought stress, membrane peroxidation will occur. The final decomposition product of membrane peroxidation is MDA. Therefore, the higher the content of malondialdehyde, the greater the damage to plants by drought, and vice versa, the smaller the change of MDA content, the stronger the ability of the plant to resist adversity [11]. The MDA activity of genetically modified soybeans and control JN18 soybeans before and after mannitol stress was detected using the MDA content determination kit of Keming Biology Company (China). It can be seen from Fig. 10 that after the stress treatment, the MDA content of the CRISPR vector lines (CR8-1, CR8-3) increased the most, showing that the adversity stress caused severe damage to this strain.
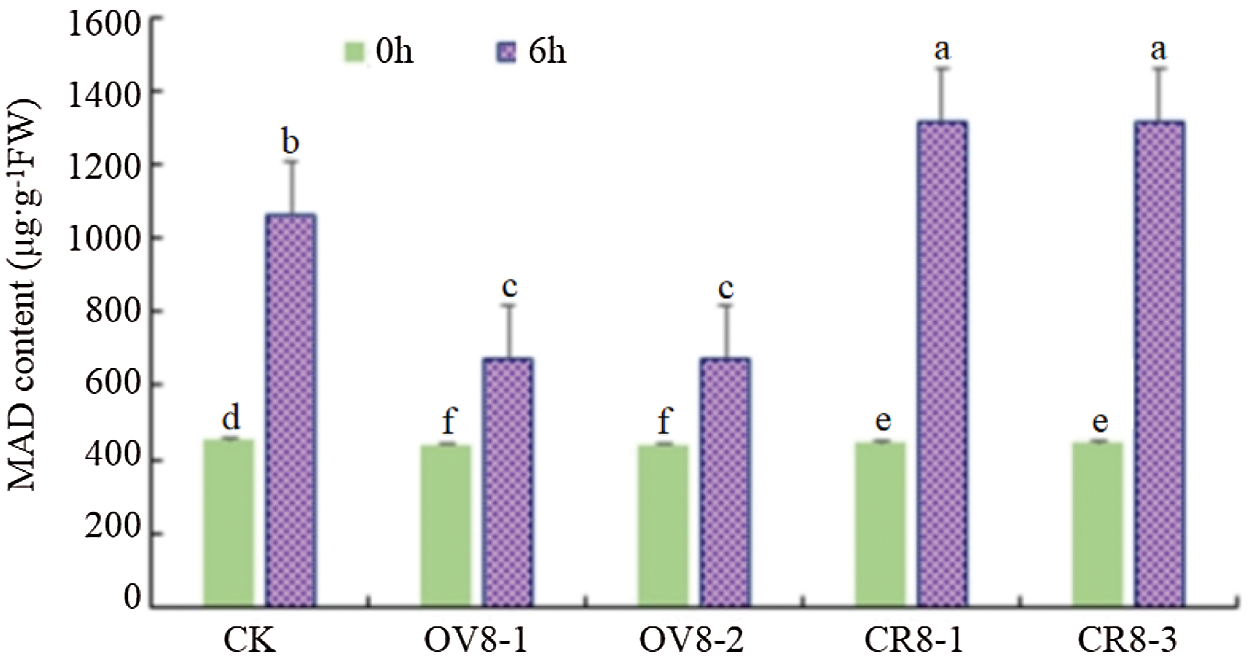
Figure 10: MDA content detection
3.7.4 Detection of PRO Concentration in T2 Transgenic Plants
The PRO content of the transgenic soybean and the control JN18 soybean before mannitol stress and six hours after the stress was tested. It can be seen from Fig. 11. The overexpression vector strains (OV8-1, OV8-2), the CRISPR vector strains (CR8-1, CR8-3), and the control plants showed significant differences in PRO content before and after the stress (P < 0.05). The changes in PRO of the strains transfected with overexpression vectors were the most significant, which were significantly higher than those on the control plants.
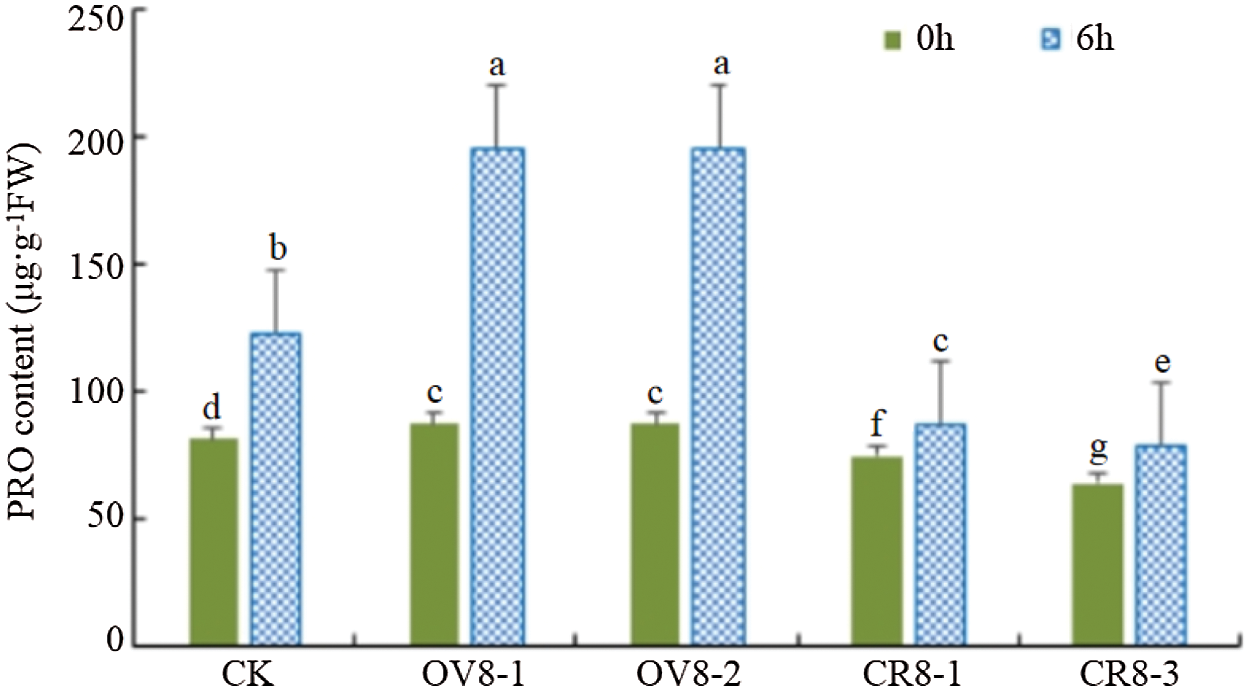
Figure 11: PRO content detection
3.7.5 Investigation of Agronomic Characters of T2 Transgenic Plants
The plant height, node number, branch number, pod number, number of three pods, number of four pods, 100-seed weight, and yield per plant of the transgenic strains and control plants were investigated. The collected data processed using DPS data Systematic analysis indicated that none of the survey indicators reached significant differences (Table 3, P > 0.05). However, the ratio between the number of four pods and yield per plant of the strain transfected with the overexpression vector (OV8-1) was higher than those of the JN18 control and transgenic CRISPR strain of the vector (CR8-3).

The occurrence of drought seriously affects the yield and quality of crops, and it is particularly vital to cultivate high-quality, drought-resistant crop varieties [16]. In 2020, Chen et al. [17] and other studies indicated that overexpression of GmMYB14 mediates the BR signaling pathway, which improves drought tolerance and increases soybean yields. In 2020, Yang et al. [18] and other studies found that the overexpression of GmbZIP2 in Arabidopsis and soybean can enhance plants’ resistance to drought and salt stress. The application of molecular biology methods to study the mechanisms of crop drought resistance, cloning drought-resistant genes, and cultivating new drought-resistant genetically modified crop varieties has become an essential goal in crop breeding research. HSPs have been studied in crops for many years, and different HSPs have been cloned. In 2006, Chen et al. [19] reported that the expression of GmHSP23 and GmHSP70 in transgenic plants increased significantly under heat stress conditions. In 2020, Zhang et al.’s [20] analysis proved that heat treatment might help plants accumulate different HSPs to improve their thermotolerance.
The enzymes that produce antioxidant effects under drought stress can scavenge free radicals, reduce cell membrane damage, and enhance the drought resistance of varieties. More PRO accumulates in plants with strong drought resistance. This study indicated that the POD and SOD activities with PRO content of overexpression in plants were higher than those on untransformed plants, similar to results of Yang et al. [21–23]. The sHSP26 gene overexpression materials OV8-1, and OV8-2 SOD, POD, and PRO responded to drought faster than the control variety JN18, and had higher activity. The SOD, POD, and PRO of the sHSP26 editing vector transgenic materials CR8-1 and CR8-3 responded to drought slower than the control variety JN18, and their activity was lower. It indicates that the overexpression of the sHSP26 gene can promote the effective removal of harmful soybean substances, and produce more protective enzymes in time to resist the damage caused by drought. MDA is the product of the cell membrane lipid peroxidation, which demonstrates the strength of plant response to adverse conditions. The MDA content was lower than that of untransformed plants, which is consistent with the results of Shi et al. [24]. The increase in MDA content of sHSP26 gene overexpression materials OV8-1 and OV8-2 was significantly lower than that of the control material. The increase in MDA content of sHSP26 interference expression transgenic materials CR8-1 and CR8-3 was significantly higher than that of the control material, showing that the overexpression of the sHSP26 gene can slow down the degree of membrane lipid peroxidation. The results indicated that the overexpression vector plants in soybeans verified that the expression of this gene could improve soybeans’ drought resistance, which is consistent with previous research results of HSPs family genes.
In addition to drought resistance, HSPs family genes also have other stress resistance functions [25]. Therefore, the role of the soybean sHSP26 gene needs further studies on multiple stress resistance function directions and protein levels. This is of great significance to the improvement of soybean yield and quality.
Soybean sHSP26 gene cloning and its functional verification have not yet been reported. In this study, the soybean sHSP26 gene was successfully cloned, the plant overexpression vector pCAMBIA3301-sHSP26 and the CRISPR vector pCBSG015-sHSP26 were constructed, and the recombinant plant expression vector was introduced into soybean receptor JN18, conventional PCR, Southern blotting, and quantitative fluorescence identification of T2 generation plants. The results indicated that the gene was integrated into the genome of the T2 trans-overexpressed soybean plant in the form of a single copy. The vector plants overexpressed in RT-PCR were about 18 times those of CK, and the CRISPR vector plants were about 0.5 times those of CK. There was a very significant difference between the lines. The sHSP26 overexpression transgenic materials OV8-1 and OV8-2 grow well under drought stress conditions. The activities of SOD and POD and the content of PRO increased relatively fast, and the content of MDA increased slowly, with respect to the sHSP26 editing vector transgenic materials CR8-1 and CR8-3 It indicates that the overexpression of the sHSP26 gene can improve the drought resistance of soybean lines. The sHSP26 gene may be involved in the drought resistance response process of soybean, but the mechanism of this gene requires further studies.
Authors Contribution: All the authors conduct the experiment. Siyan Liu analyzed the data and wrote the first draft. Jinfeng Liu edited and translated the paper. Siyan Liu was the project leader of the experiment and guided the writing of this article. All the authors read and approved the final manuscript.
Funding Statement: The research was jointly funded by the Jilin Province Education Department Science and Technology Research Project [JJKH20210350KJ], the Jilin Province Science and Technology Guidance Program Project [20200402023NC], the Jilin Provincial Natural Science Foundation Project [20200201027JC] and the Innovation and Entrepreneurship Training Program for College Students in Jilin Province [2021].
Conflicts of Interest: The authors declare that they have no conflicts of interest to report regarding the present study.
1. Ritossa, F. (1962). A new puffing pattern induced by temperature shock and DNP in Drosophila. Experientia, 18(12), 571–573. DOI 10.1007/BF02172188. [Google Scholar] [CrossRef]
2. Tissieres, A., Mitchell, H. K., Tracy, U. M. (1974). Protein synthesis in salivary glands of Drosophila melanogaster: Relation to chromo-some puffs. Journal of Molecular Biology, 84(3), 389–398. DOI 10.1016/0022-2836(74)90447-1. [Google Scholar] [CrossRef]
3. Sadura, I., Libik-Konieczny, M., Jurczyk, B., Gruszka, D., Janeczko, A. (2020). HSP transcript and protein accumulation in Brassinosteroid Barley mutants acclimated to low and high temperatures. International Journal of Molecular Sciences, 21(5), 1889. DOI 10.3390/ijms21051889. [Google Scholar] [CrossRef]
4. Hishinuma-Silva, S. M., Lopes-Caitar, V. S., Nomura, R. B. G., Sercero, B. C., Silva, A. G. et al. (2020). The soybean gene GmHsp22.4 is involved in the resistance response to Meloidogyne javanica in Arabidopsis thaliana. BMC Plant Biology, 20(1), 535. DOI 10.1186/s12870-020-02736-2. [Google Scholar] [CrossRef]
5. Upadhyay, R. K., Tucker, M. L., Mattoo, A. K. (2020). Ethylene and RIPENING INHIBITOR modulate expression of SlHSP17.7A, B Class I small heat shock protein genes during tomato fruit ripening. Frontiers in Plant Science, 11, 975. DOI 10.3389/fpls.2020.00975. [Google Scholar] [CrossRef]
6. Huang, L. J., Cheng, G. X., Khan, A., Wei, A. K., Yu, Q. H. et al. (2019). CaHSP16. 4, a small heat shock protein gene in pepper, is involved in heat and drought tolerance. Protoplasma, 256(1), 39–51. DOI 10.1007/s00709-018-1280-7. [Google Scholar] [CrossRef]
7. Sato, Y., Yokoya, S. (2008). Enhanced tolerance to drought stress in transgenic rice plants overexpressing a small heat-shock protein, sHSP17.7. Plant Cell Reports, 27(2), 329–334. DOI 10.1007/s00299-007-0470-0. [Google Scholar] [CrossRef]
8. Assab, E., Rampino, P., Mita, G., Perrotta, C. (2011). Heat shock response in olive (Olea europaea L.) twigs: Identification and analysis of a cDNA coding a class I small heat shock protein. An International Journal Dealing with all Aspects of Plant Biology, 145(2), 419–425. DOI 10.1080/11263504.2011.558711. [Google Scholar] [CrossRef]
9. Zhang, S. R., Wang, H., Wang, Z., Ren, Y., Niu, L. et al. (2017). Photoperiodism dynamics during the domestication and improvement of soybean. Science China-Life Sciences, 60(12), 1416–1427. DOI 10.1007/s11427-016-9154-x. [Google Scholar] [CrossRef]
10. Yan, C., Song, S., Wang, W., Wang, C., Li, H. et al. (2020). Screening diverse soybean genotypes for drought tolerance by membership function value based on multiple traits and drought-tolerant coefficient of yield. BMC Plant Biology, 20(1), 321. DOI 10.1186/s12870-020-02519-9. [Google Scholar] [CrossRef]
11. Yang, R., Jiang, Y., Xiu, L., Huang, J. (2019). Effect of chitosan pre-soaking on the growth and quality of yellow soybean sprouts. Journal of the Science of Food and Agriculture, 99(4), 1596–1603. DOI 10.1002/jsfa.9338. [Google Scholar] [CrossRef]
12. Wang, X., Komatsu, S. (2017). Proteomic approaches to uncover the flooding and drought stress response mechanisms in soybean. Journal of Proteomics, 172, 201–215. DOI 10.1016/j.jprot.2017.11.006. [Google Scholar] [CrossRef]
13. Feng, Z., Ding, C., Li, W., Wang, D., Cui, D. (2019). Applications of metabolomics in the research of soybean plant under abiotic stress. Food Chemistry, 310(1), 125914. DOI 10.1016/j.foodchem.2019.125914. [Google Scholar] [CrossRef]
14. Qu, J. (2016). Research on the regulation mechanism of soybean β-conglycin gene RNAi expression. Jilin: Jilin Agricultural University. [Google Scholar]
15. Qu, S., Jiao, Y. L., Abraham, L., Wang, P. W. (2021). Correlation analysis of new soybean [Glycine max (L.) Merr] gene Gm15G117700 with oleic acid. Phyton-International Journal of Experimental Botany, 90(4), 1177–1192. DOI 10.32604/phyton.2021.015206. [Google Scholar] [CrossRef]
16. Awal, A., Karim, M. F., Bhuyan, M. H. M., Mahmud, J. A., Nahar, K. et al. (2021). Potassium-induced regulation of cellular antioxidant defense and improvement of physiological processes in wheat under water deficit condition. Phyton-International Journal of Experimental Botany, 90(2), 353–372. DOI 10.32604/phyton.2021.013259. [Google Scholar] [CrossRef]
17. Chen, L., Yang, H., Fang, Y., Guo, W., Chen, H. et al. (2021). Overexpression of GmMYB14 improves high-density yield and drought tolerance of soybean through regulating plant architecture mediated by the brassinosteroid pathway. Plant Biotechnology Journal, 19(4), 702–716. DOI 10.1111/PBI.13496. [Google Scholar] [CrossRef]
18. Yang, Y., Yu, T. F., Ma, J., Chen, J., Zhou, Y. B. et al. (2020). The soybean bZIP transcription factor gene GmbZIP2 confers drought and salt resistances in transgenic plants. International Journal of Molecular Sciences, 21(2), 670. DOI 10.3390/ijms21020670. [Google Scholar] [CrossRef]
19. Chen, X. J., Ye, C. J., Lv, H. Y., Xu, M. X., Li, W. et al. (2006). Cloning of GmHSFA1 gene and its overexpression leading to enhancement of heat tolerance in transgenic soybean. Hereditas, 28(11), 1411–1420. DOI 10.1360/yc-006-1411. [Google Scholar] [CrossRef]
20. Zhang, H., Li, G., Hu, D., Zhang, Y., Zhang, Y. et al. (2020). Functional characterization of maize heat shock transcription factor gene ZmHsf01 in thermotolerance. Peer J, 8(2), e8926. DOI 10.7717/peerj.8926. [Google Scholar] [CrossRef]
21. Yang, C., Huang, Y., Lv, W., Zhang, Y., Bhat, J. A. et al. (2020). GmNAC8 acts as a positive regulator in soybean drought stress. Plant Science, 293, 110442–110452. DOI 10.1016/j.plantsci. [Google Scholar] [CrossRef]
22. Ma, X. J., Fu, J. D., Tang, Y. M., Yu, Z. G., Chen, J. et al. (2020). GmNFYA13 improves salt and drought tolerance in transgenic soybean plants. Frontiers in Plant Science, 11, 587244. DOI 10.3389/fpls. [Google Scholar] [CrossRef]
23. Wang, D., Liu, Y. X., Yu, Q., Zhao, S. P., Zhao, J. Y. et al. (2019). Functional analysis of the soybean GmCDPK3 gene responding to drought and salt stresses. International Journal of Molecular Sciences, 20(23), 5909. DOI 10.3390/ijms20235909. [Google Scholar] [CrossRef]
24. Shi, W. Y., Du, Y. T., Ma, J., Min, D. H., Jin, L. G. et al. (2018). The WRKY transcription factor GmWRKY12 confers drought and salt tolerance in soybean. International Journal of Molecular Sciences, 19(12), 4087. DOI 10.3390/ijms19124087. [Google Scholar] [CrossRef]
25. Zhu, B., Ye, C., Lv, H., Chen, X., Chai, G. et al. (2006). Identification and characterization of a novel heat shock transcription factor gene, GmHsfA1, in soybeans (Glycine max). Journal of Plant Research, 119(3), 247–256. DOI 10.1007/s10265-006-0267-1. [Google Scholar] [CrossRef]
Appendix.
Figure S1∼Figure S10 Cloning and Bioinformatics Analysis of Soybean sHSP26 Gene
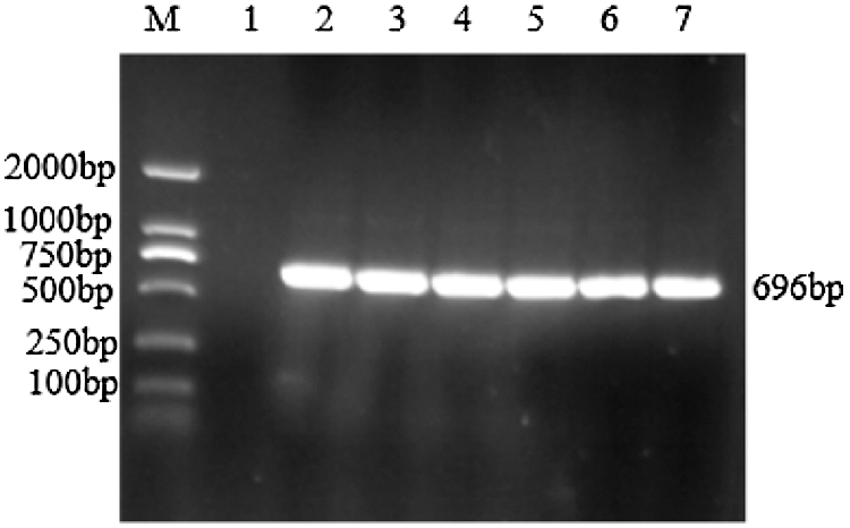
Figure S1: PCR identification of cloning vector
Note: M: DL2000 DNA Marker; 1: Negative control; 2–7: PCR product
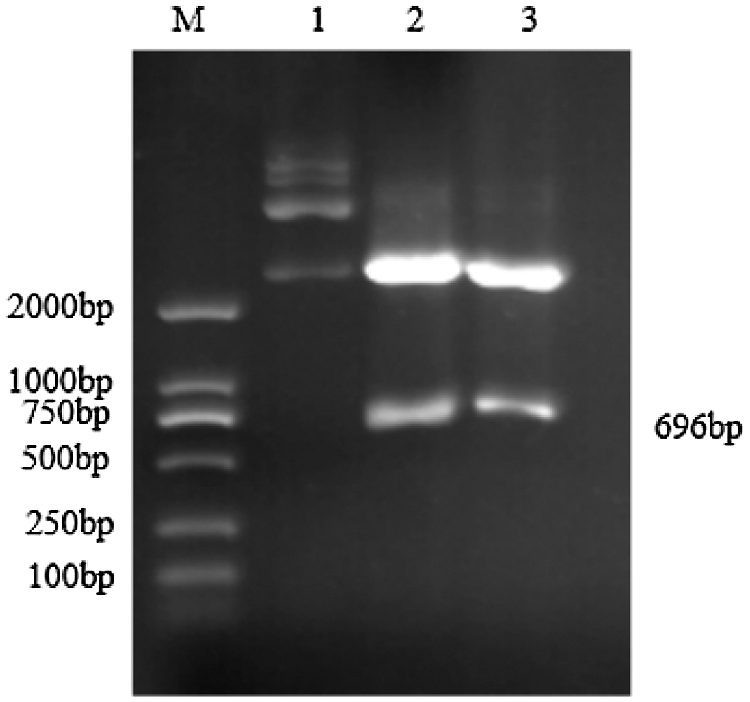
Figure S2: Double restriction digestion verification of Cloning vector
Note: M: DL2000 DNA Marker; 1: Plasmid; 2–3: Enzyme digestion product

Figure S3: Protein conservative domain analysis
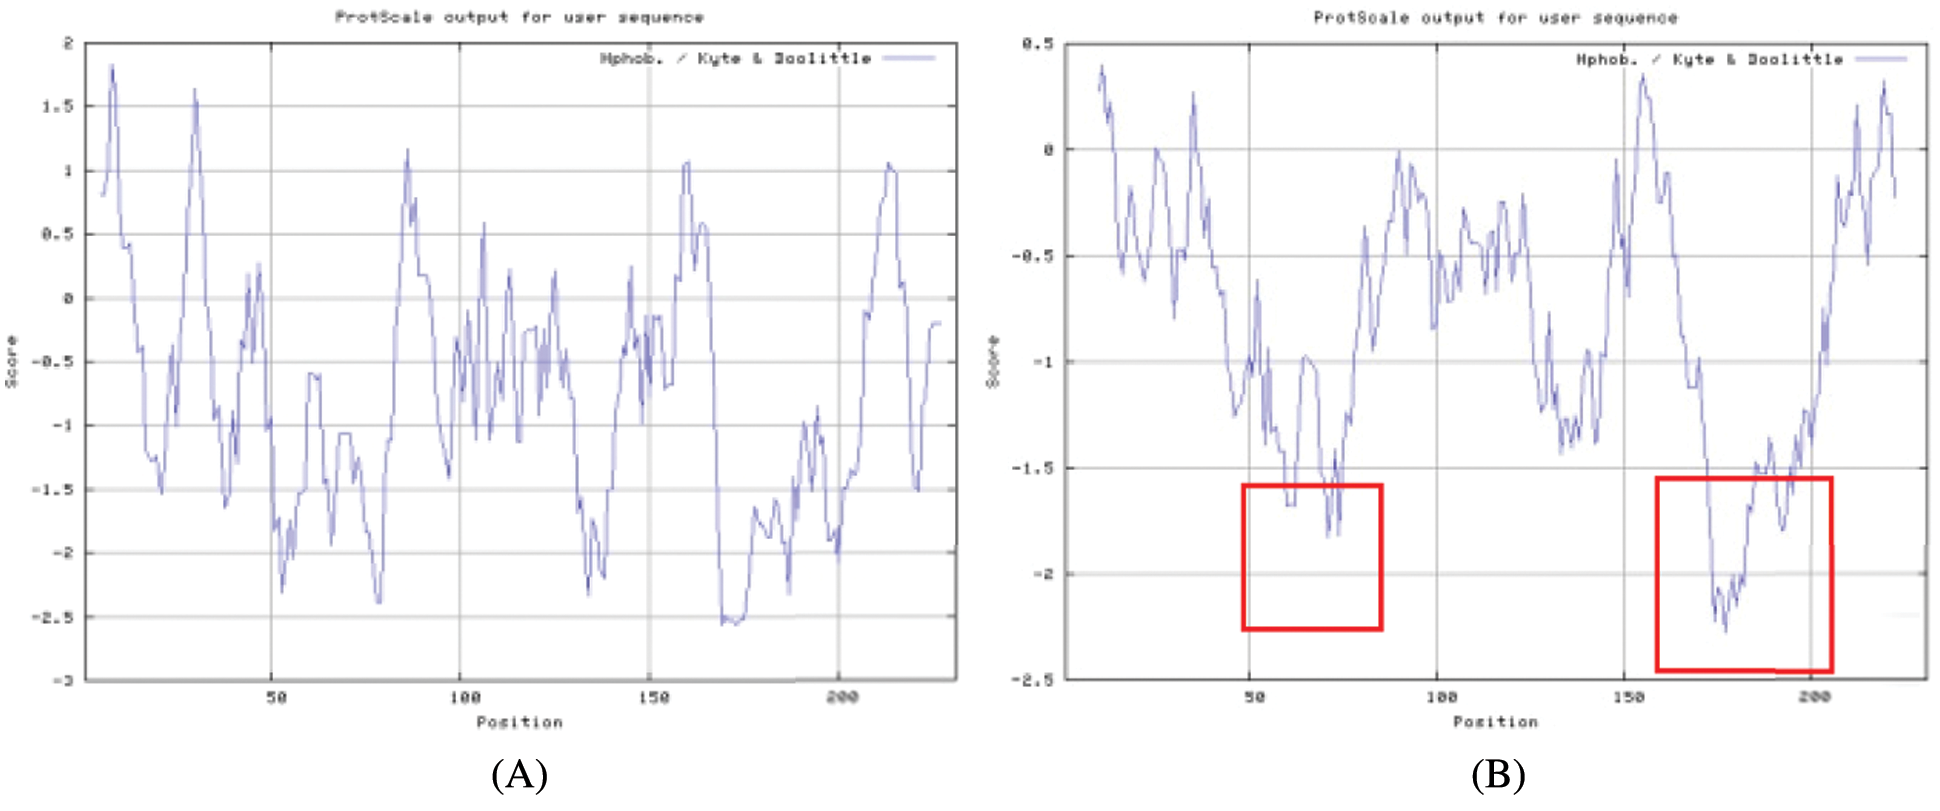
Figure S4: The hydrophilic or hydrophobic analysis
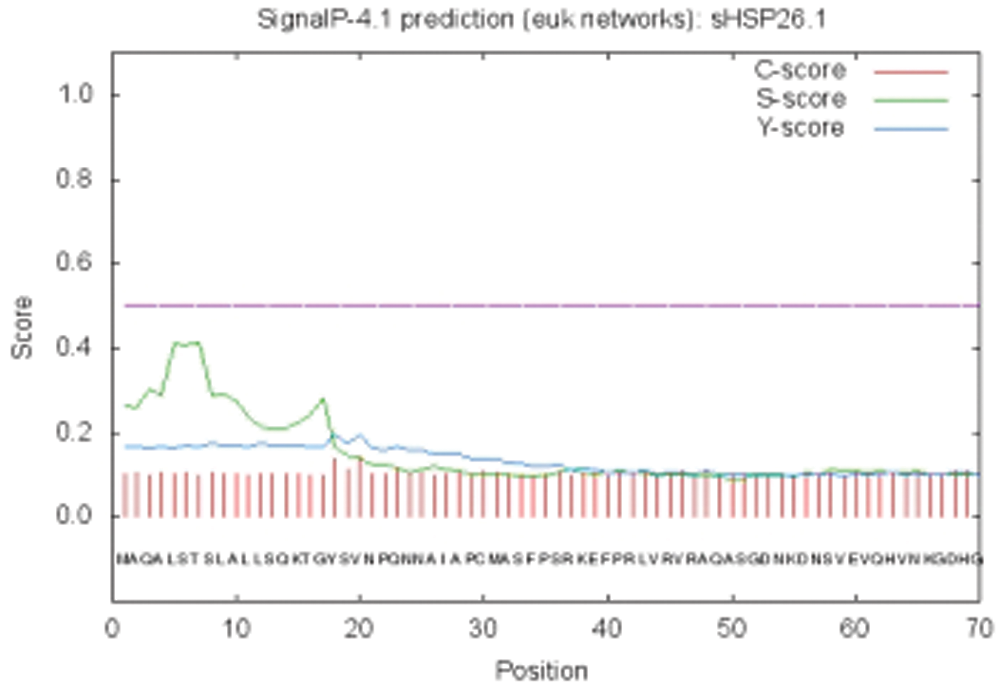
Figure S5: SignalP peptideprediction result
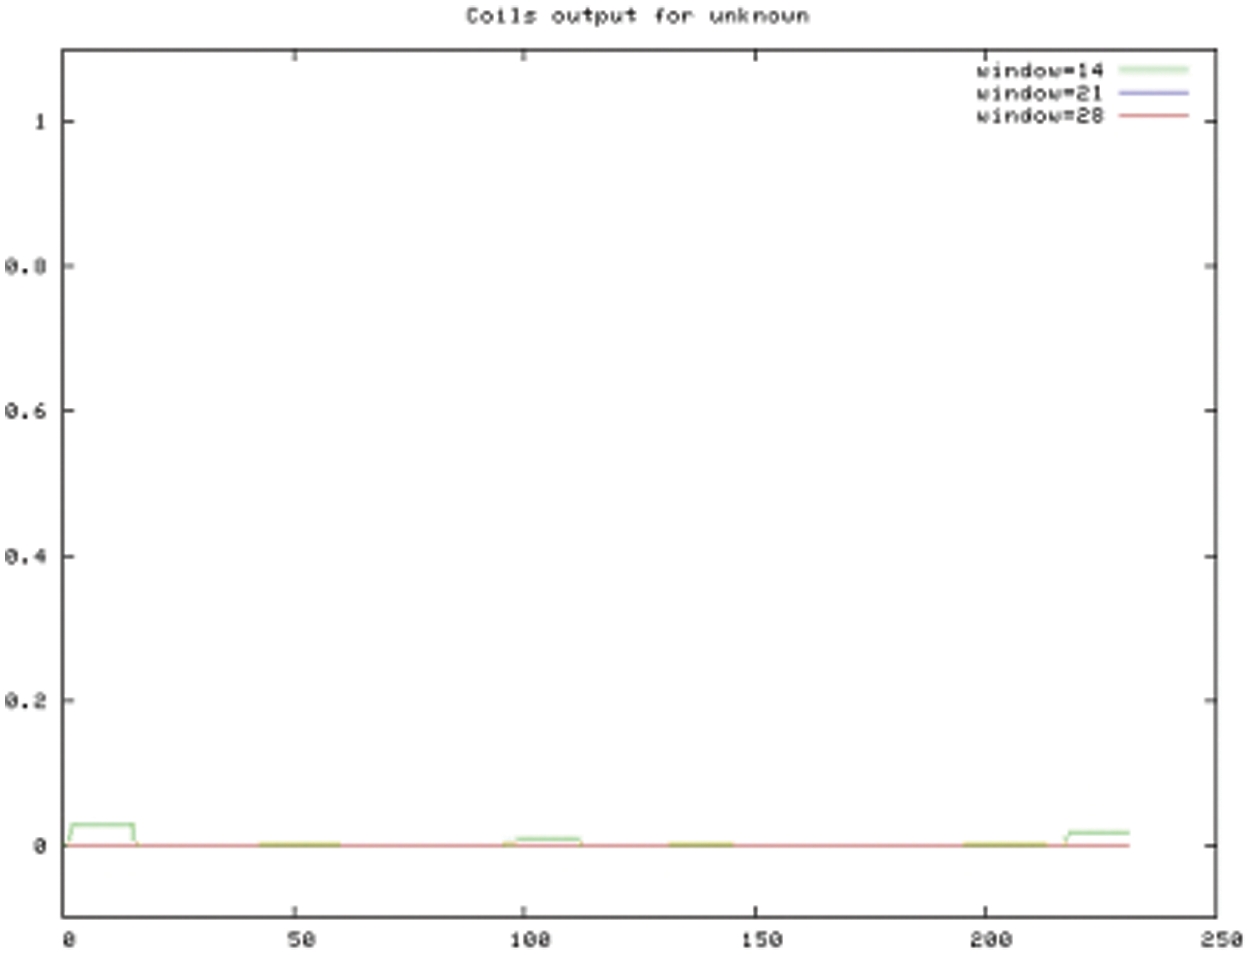
Figure S6: COILS prediction result
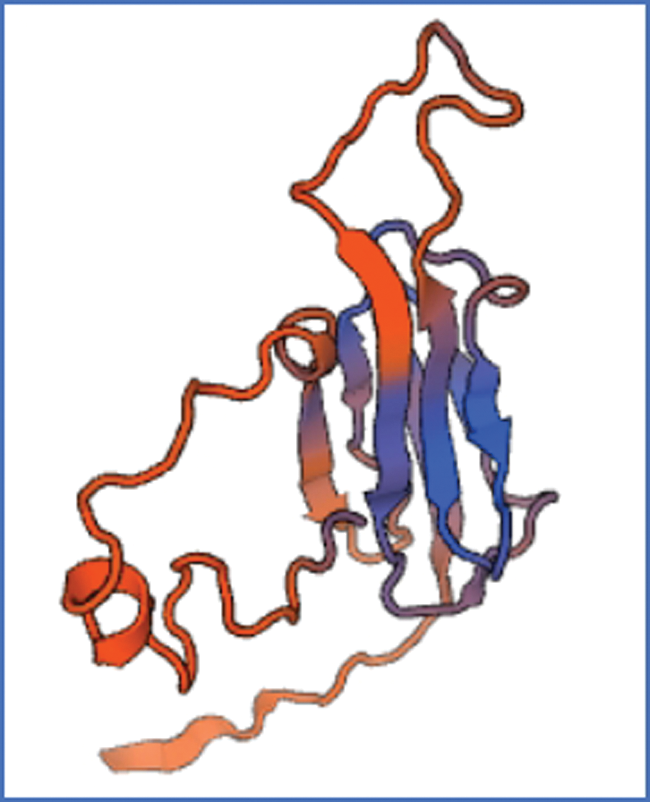
Figure S7: The tertiary structure of sHSP26 protein
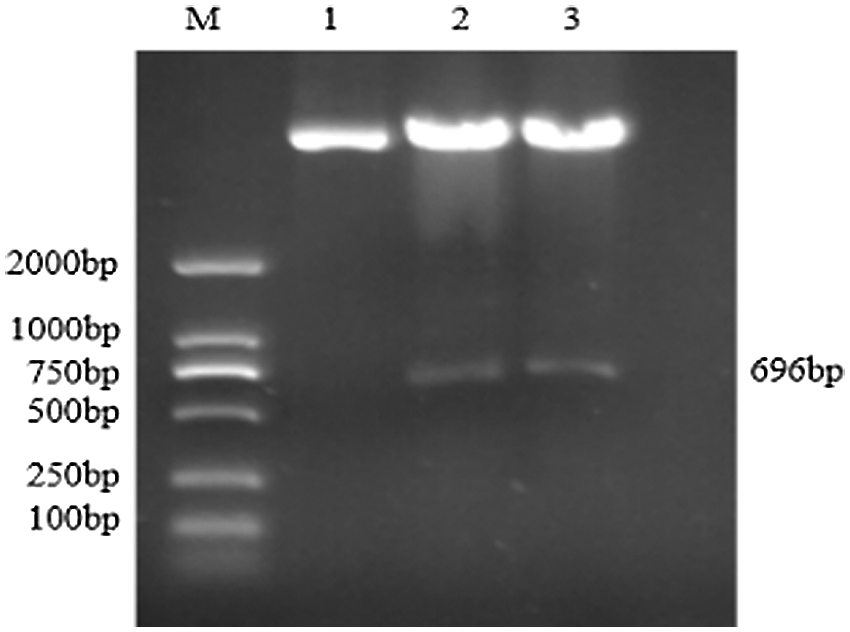
Figure S8: Double restriction digestion verification of overexpression vector
Note: M: DL2000 DNA Marker; 1: Plasmid; 2–3: Enzyme digestion product
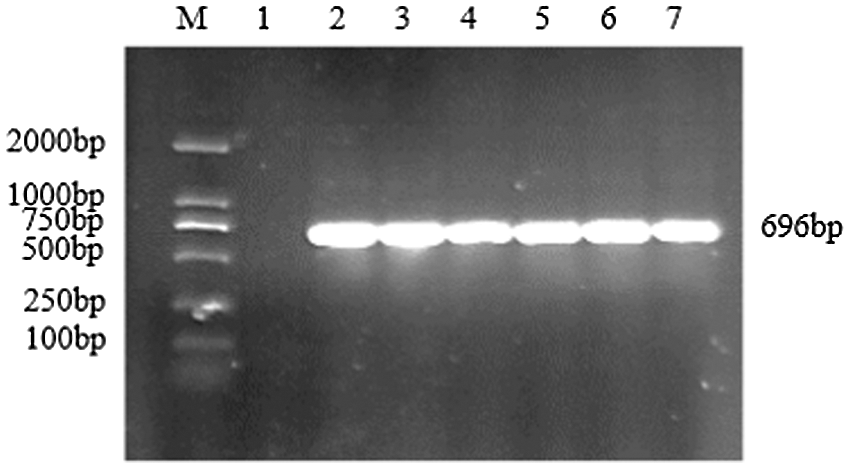
Figure S9: PCR verification of overexpression vector
Note: M: DL2000 DNA Marker; 1: Negative control; 2–7: PCR product
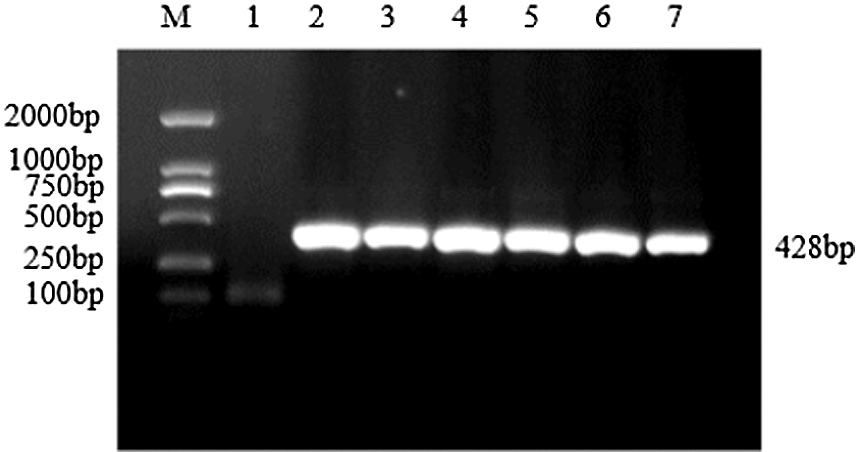
Figure S10: Verification of interference expression vector
Note: M: DL2000 DNA Marker; 1: Negative control; 2–7: bar gene
 | This work is licensed under a Creative Commons Attribution 4.0 International License, which permits unrestricted use, distribution, and reproduction in any medium, provided the original work is properly cited. |