| Phyton-International Journal of Experimental Botany |
DOI: 10.32604/phyton.2022.020645
ARTICLE
Sources of Nitrogen in Combination with Systems of Irrigation Influence the Productivity of Modern Rice (Oryza sativa L.) Cultivars during Dry Season in Sub-Tropical Environment
1Department of Agronomy, Bangladesh Agricultural University, Mymensingh, 2202, Bangladesh
2Department of Crop Botany, Bangladesh Agricultural University, Mymensingh, 2202, Bangladesh
3Department of Biology, College of Science, Taif University, Taif, 21944, Saudi Arabia
*Corresponding Author: Md. Romij Uddin. Email: romijagron@bau.edu.bd
Received: 04 December 2021; Accepted: 27 January 2022
Abstract: In irrigated agricultural systems, nitrogen (N) and water are the vital resources for sustainability of the crop production in the modern era of climate change. The current study aimed to assess the impact of water and N management on the productivity of irrigated rice cultivars. In the context, a field observation was done at the research farm of Bangladesh Agricultural University, Mymensingh, during dry seasons in consecutive two years (2018–2019 and 2019–2020). The experiments were set up following split-plot design assigning water management in the main plots, nitrogen management in the sub-plots, and the cultivars were approved in the split-split plot with three replications. After two years observation, it was revealed that rice cultivar Binadhan-8 gave the maximum value of leaf area index, number effective tillers hill-1 and grains panicle-1 which lead to the higher grain yield (GY). Substantial relationships were observed among the concentration of N, growth, total dry matter (TDM) and N content, N uptake, N utilization effectiveness, and GY. However, with little exception, the Combined effect of water and N, cultivars and water management were varied significantly for all parameters. Finally, the results of the current study concluded that application of irrigation at 8 days after the disappearance of ponded water and source of 105 kg N ha-1 from PU + Poultry manure are the best management approach for the excellent performance of rice cultivar Binadhan-8.
Keywords: Growth stage; high yielding rice cultivar; internal N use efficiency; water productivity
Nomenclature
| AT: | Active tillering |
| At: | Anthesis |
| AWD: | Alternate wetting and drying |
| BRRI: | Bangladesh Rice Research Institute |
| CGR: | Crop growth rate |
| d: | days |
| DAD: | Days after the disappearance of ponded water |
| Em: | Emergence |
| FL: | Flowering |
| GY: | Grain yield |
| LAI: | Leaf area index |
| N: | Nitrogen |
| NAR: | Net assimilation rate |
| NS: | Non-significant |
| PH: | Plant height |
| PI: | Panicle Initiation |
| PM: | Physiological Maturity |
| POM: | Poultry manure |
| PU: | Prilled Urea |
| RGR: | Relative growth rate |
| RWC: | Relative water content |
| TDM: | Total dry matter |
| USG: | Urea super granule |
Increasing population is one of the significant encounters for food and environmental security across the globe. On the other hand, due to the changing climate, water and N shortage has created a big challenge particularly in the rice growing world. The main restrictive factors for irrigated rice farming are also water and nitrogen. Proficient water and nitrogen management has remained significant for sustainable rice cultivation in irrigated rice farming system. Future rice production will depend greatly on developing approaches and practices that use water and nitrogen efficiently under climate change condition [1]. Considering the water issue, it is imperative to investigate rice-growing substitute methods by utilizing less water for food security [2]. Insufficient water, along with its higher cost, is widespread in rice production. Therefore, farmers and researchers are trying to find alternatives to reduce water usage in rice farming, upgrade its utilization efficiency, and increase rice yield [3]. Production of more rice with less water is quite tricky for crop production; thus, the efficiency of water usage for agriculture should play a vital role in fulfilling future rice needs [4]. Effective utilization of irrigation water to expand crop productivity is the possible solution for water shortage and utilization problems worldwide [5].
Proper management of N fertilizer is vital to improving rice crop development and yields. This is likewise the most restrictive supplement for rice production throughout the planet [6]. To accomplish the harvest’s monetary advantage, determination of the suitable level and wellspring of N compost is a significant concern [7]. Rice growers frequently utilize more meaningful levels than those required to keep up with yield due to the difficulty in anticipating the requirements of N manures [8]. Accordingly, evaluating suitable N fertilizer rates and sources for upgrading crop production is also vital. The N accessibility to plants is the most potent factor in rice outputs and its connection to the increment of production components [9,10]. The dry matter partitioning in shoot has been linked with availability of N and that has a positive relation GY [11,12]. The cultivars of irrigated rice contrast in their nitrogen use efficiency (NUE) [10] and GY [13]. In this manner, NUE can be expanded by suitable nitrogen management, and it can likewise further upgrade GY [10]. The proper administration of irrigation water, ideal utilization of fertilizers alongside the utilization of cultivars that are effective in absorbing and utilizing nutrients, particularly N are a portion of the innovations used to increment and support horticultural outcomes in the long run [11,14]. Sustainable and quality production can be ensured by good management of these practices.
For improvement of water productivity and water use efficiency in irrigated rice, various water management systems have been anticipated [15–18]. However, considering the rise in price of chemical fertilizer and enormous competition for water for industrial, domestic and agricultural use, it is necessary to recognize the most proficient water management methods and best possible N fertilizer level for sustainable augment in rice productivity in irrigated rice farming system in Bangladesh. Considering these above facts, the current study aimed to assess the impact of water and N management on the productivity of irrigated rice cultivars in dry season under sub-tropical region.
2.1 The Characteristics of the Experimental Site
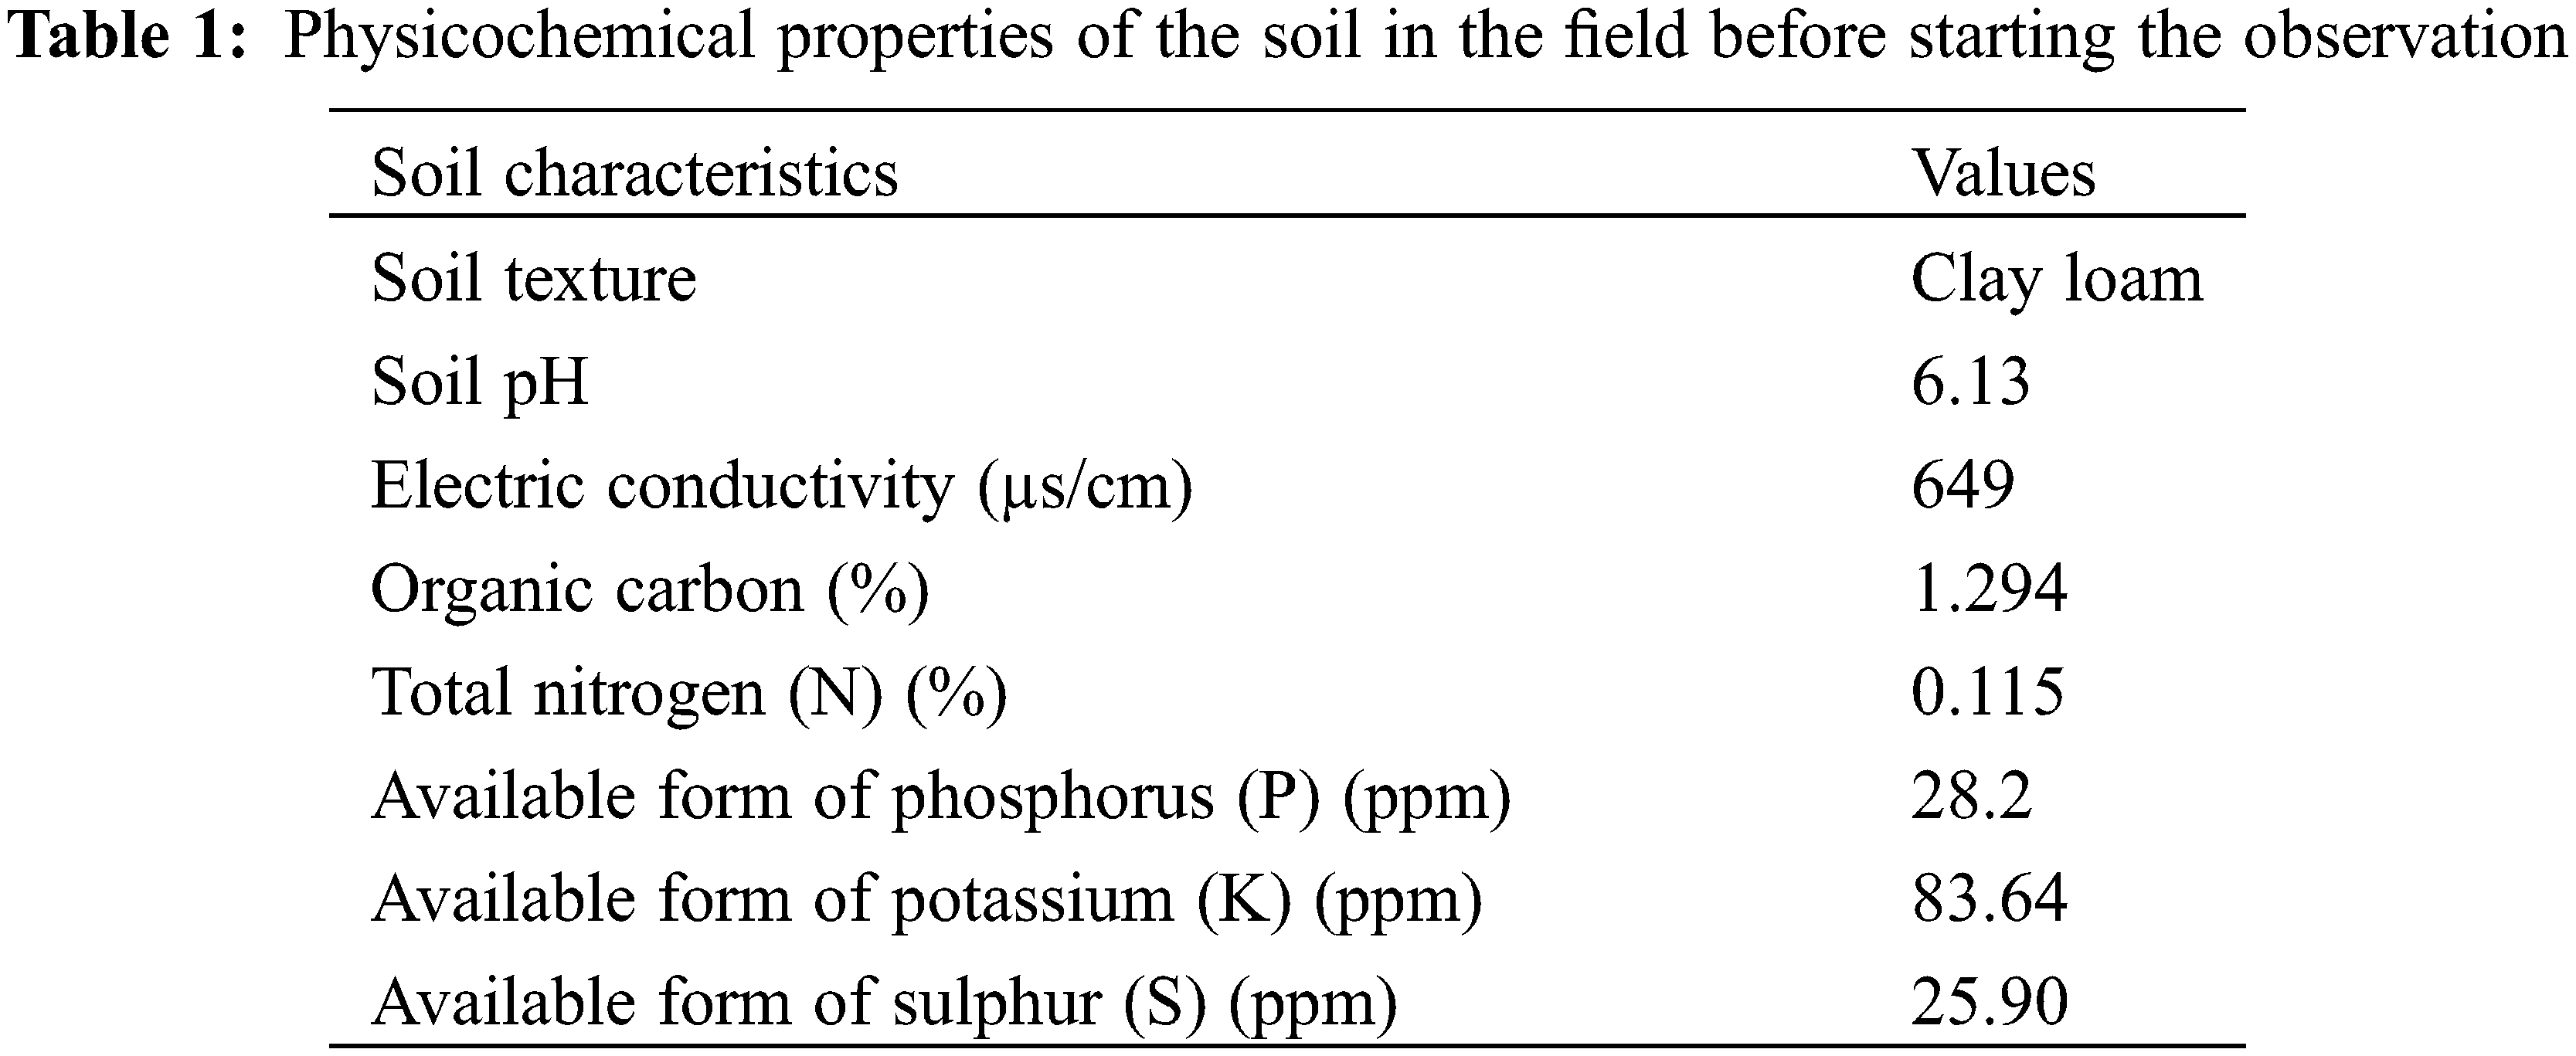
We conducted the field experiment during dry seasons of 2018–2019. The experiment was also repeated in the next season of 2019–2020. The site of experimental was the Agronomy Field Laboratory of Bangladesh Agricultural University, Mymensingh, Bangladesh. Geographically the site lies at the latitude of 24°42′55″N, longitude of 90°25′47″E, and the elevation of 19 m above the sea level. The experimental place experiences the subtropical monsoon climate with humid nature. Before starting the trial the physicochemical properties of the field soils were analyzed and are displayed in Table 1.
2.2 Experimental Materials, Treatments and Design
Treatments were: (a) three rice cultivars viz., BRRI dhan-28, Binadhan-8 and Binadhan-10; (b) three water management systems, viz., application of irrigation at 8 and 10 days after the disappearance of ponded water (DAD) and Bangladesh Rice Research Institute (BRRI) recommended water application systems (AWD) and (c) three sources of N viz., Prilled Urea (PU) (140 kg N ha-1), Urea Super Granule (USG) (83 kg N ha-1), PU + 3 t ha-1 poultry manure (POM) (105 kg N ha-1). All treatments were arranged in a split-plot design where water management treatments were assigned in the main plots and nitrogen management as the sub-plots, and the cultivars were arranged in the split-split plot and all treatments were replicated thrice.
2.3 Field Preparation and Crop Management
The field was prepared by 4-5 ploughing followed by laddering. Except N sources, other fertilizers such as P-K-S-Zn were applied at 20-65-18-1.3 kg ha-1. Nitrogen was applied as per treatments. The source of the nutrients was applied for N as PU (140 kg N ha-1), USG (83 kg N ha-1), PU + 3 t ha-1POM (105 kg N ha-1); for P as triple super phosphate (TSP), for K as muriate of potash (MOP), for S as Gypsum and for Zn as Zinc sulphate fertilizers. Calculation of nutrients was accomplished based on IPNS, and only the required amount was added from the fertilizers. During the final land preparation, entire amounts of P, K, S, Zn fertilizers and poultry manure were applied as basal dose. Two seedlings were transplanted hill-1 maintain spacing of 25 cm × 15 cm. USG was applied among every four hills in an alternate row after one week of the transplanting of rice seedling. Urea was used in three equal installments after 15, 40, and 70 days after the crops were transplanted. The unit plot size was 4.0 m × 2.5 m. At the time transplanting the field was with 4 cm of standing water, and the three irrigation treatments were imposed after the disappearance of this ponded water-traditional irrigation at 8, and 10 days after DAD, and BRRI recommended AWD. Free flooding method was used for application of irrigation except AWD. Irrigation water was measured using volumetric method. For AWD method, a 20 cm deep hole was dug in treated plot and a perforated plastic pipe was installed to monitor the level of the water table after irrigation. The practice was continued until flowering starts. 2–4 cm standing water was kept from flowering to dough stage. Polythene sheet was used beneath the soil to prevent seepage from one plot to another.
2.4 Data and Their Measurement Procedures
The plants were sampled from each pot at active tillering stage, panicle initiation stage, flowering stage, and physiological maturity for the measurement of growth parameters includingplant height, leaf area index (LAI), crop growth rate (CGR), relative growth rate (RGR), and net assimilation rate (NAR). For LAI, the leaf blades were isolated from the leaf sheath immediately after sampling the plants then the area of the leaf blades was estimated by using a digital leaf area meter (LI 3100, Licor, Inc., Lincoln NE, USA). After assessing the leaf area, the plant sampled, including leaves used for determining its area, was dried in an electric oven at 65°C for 72 h. Different parameters of growth analysis viz., RGR, CGR, LAI, and NAR were calculated from the dry mass and leaf areas by using the following the standard formulae reported by Radford [19] and Hunt [20].
Water productivity in rice was calculated as follows [21]:
where, Y, grain yield (t ha-1), WR, total amount of water used (cm).
Relative water content (RWC) was calculated after collection of leaf in turgid condition accordingly [22]:
where, FW, fresh leaf weight, TW, turgid leaf weight, and DW, leaf dry weight. For determining the FW, the fresh leaf was cut into small pieces, and afterwards, weighed. the leaf sample (cut pieces) was drenched in distilled water for 4 h in the dim, and afterwards, the turgid leaf weight was determined to measure the TW. The small pieces of leaves were then oven dried at 80°C in an electric oven for 24 h and were weighed to estimate the DW.
The following formula calculates the internal N use efficiency of GY (INUEY):
It is expressed as kg GY/kg N uptake.
Internal N use efficiency of dry biomass (INUEDM) was calculated by the following formula:
It is expressed as kg biomass/kg N uptake.
2.5 Statistical Analysis of Recorded Data
All recorded data were statistically analyzed by using analysis of variance (ANOVA) and mean separation test was done by following Duncan’s multiple range test (DMRT) at 5% level of probability [23].
3.1 Climatic Condition during Two Crop Cycles
The weather data were recorded Department of Irrigation and Water Management, Bangladesh Agricultural University, Mymensingh, Bangladesh which are presented in Fig. 1.
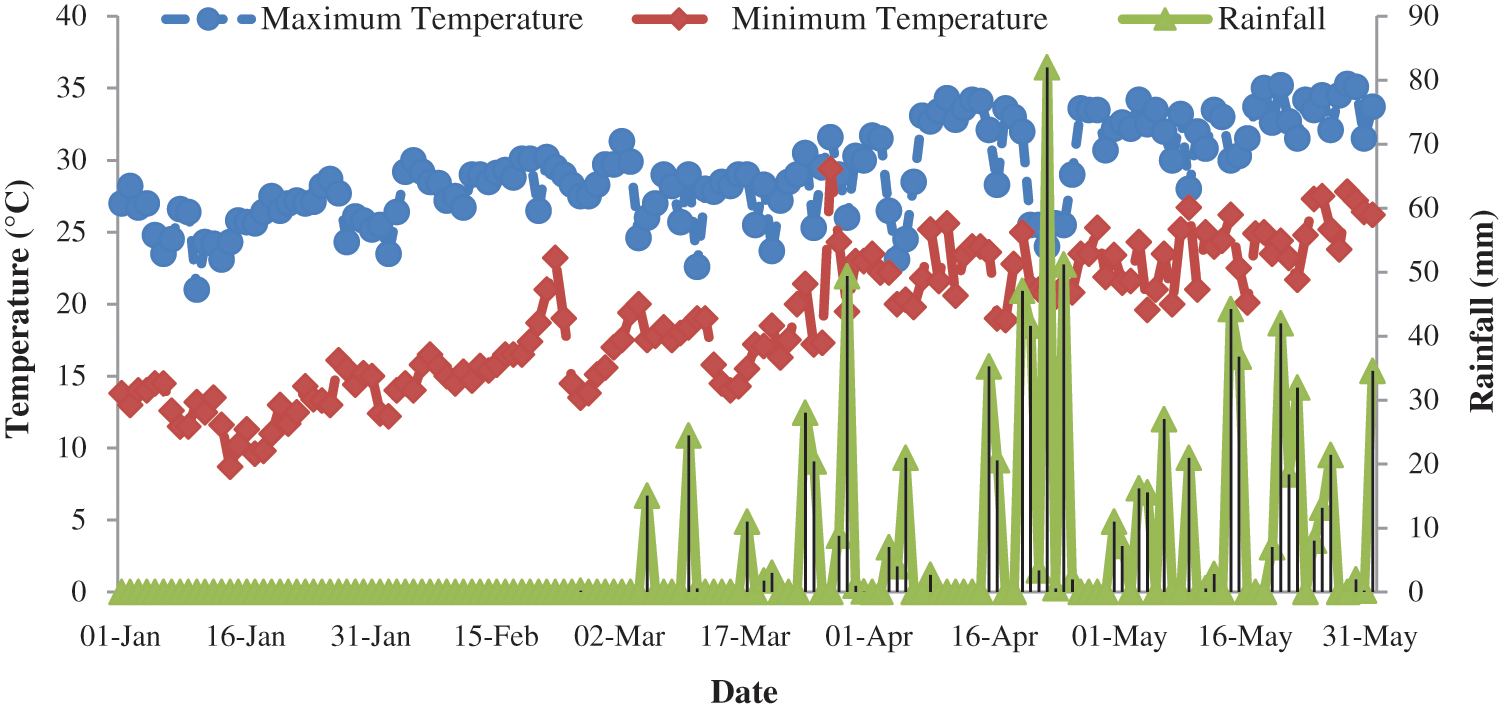
Figure 1: Weather condition during crop growth stages in both years’ of observation
In both seasons, the maximum temperatures were varied from 21.0°C to 35.3°C with an average value of 29.1°C, however the minimum temperature ranged from 8.7°C to 29.4°C having a mean value of 18.7°C. Considering the months of observation, March to May was the hottest time, while January to February was the coolest period in both seasons. Daily rainfall ranged from 0 to 82 mm with monthly recorded values (January to May) of 0.0, 0.2, 163.7, 329.5, and 350.2 mm, respectively. No rainfall was happened up to the end of February. Though, rainfall was more regular and steady from the first week of March to onwards. During growth crop stages, 15.3 mm of rainfall was recorded up to panicle initiation (PI) (17 January–08 March), 155.6 mm during PI to flowering (FL) (09 March to 03 April), and 672.7 mm from FL (04 April) to harvest (02 May).
The vegetative growth of plants was completely in fully irrigated condition. On the opposing, they were subjected to equally irrigation and rainfall at PI stage and almost completely grown under rainfed conditions from FL to harvesting stages. From FL to harvest stages the crop received the maximum rainfall. The cultivar and environment had an influence on the duration of crop life cycle. Outline for three cultivars with their phenology are shown in Fig. 2. According to findings of the experiment, the usual duration of the life span of cultivars was 134 days (d). The Em to FL widely ranged between 102 d to 105 d, based on cultivars. The grain-filling period revealed cultivar difference from 28 d for BRRI dhan-28 and 34 for Binadhan-8.
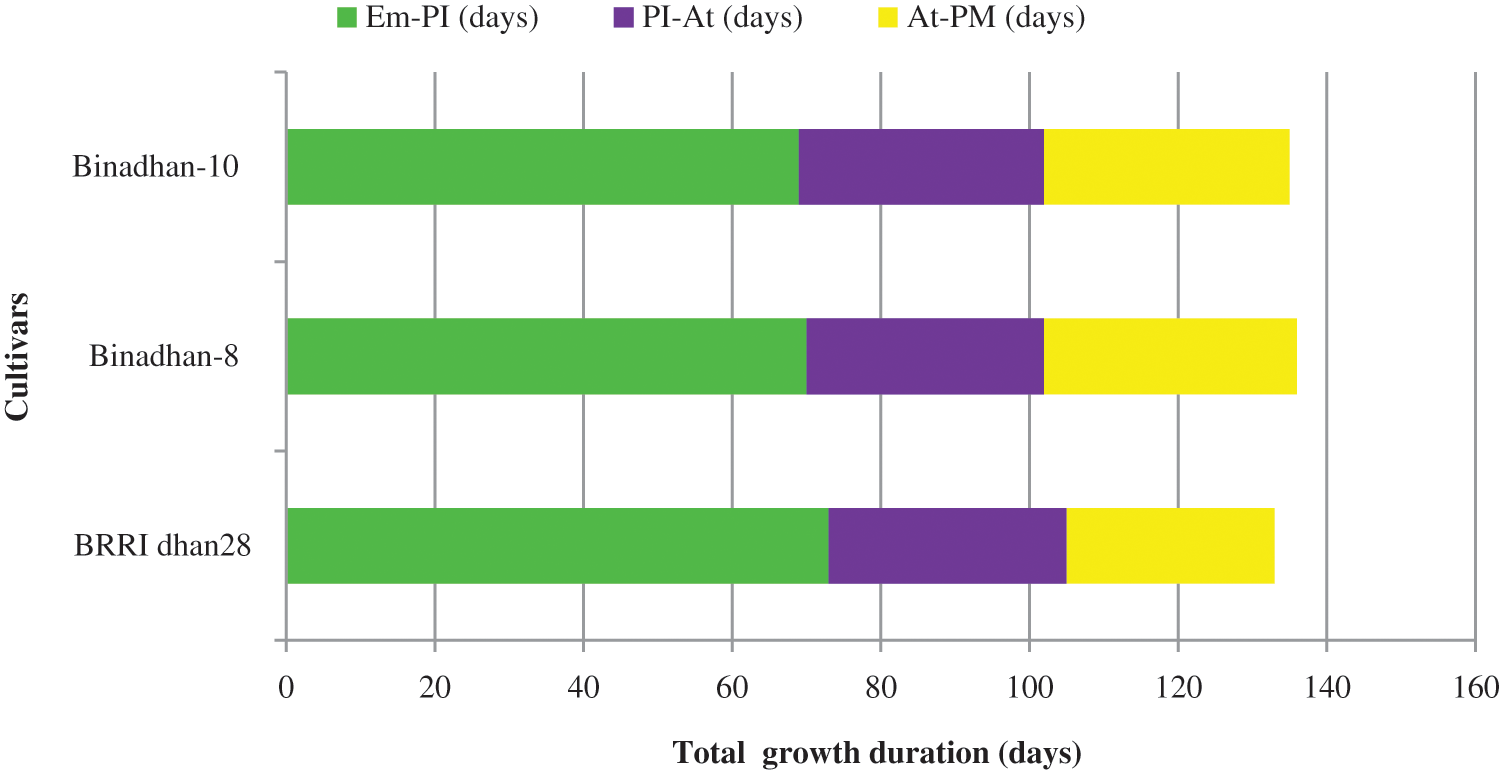
Figure 2: Phenological variation of rice cultivars in both years. The horizontal bar exhibits the duration of each developmental phases: emergence stage, Em; panicle initiation, PI; anthesis, At and physiological maturity, PM. The green bars show emergence Em-PI, violet bars show PI-At, and the yellow bars show At-PM
A significant dissimilarity for plant height was recorded at different growth stages of all rice cultivars, water and nitrogen treatments (Table 2).
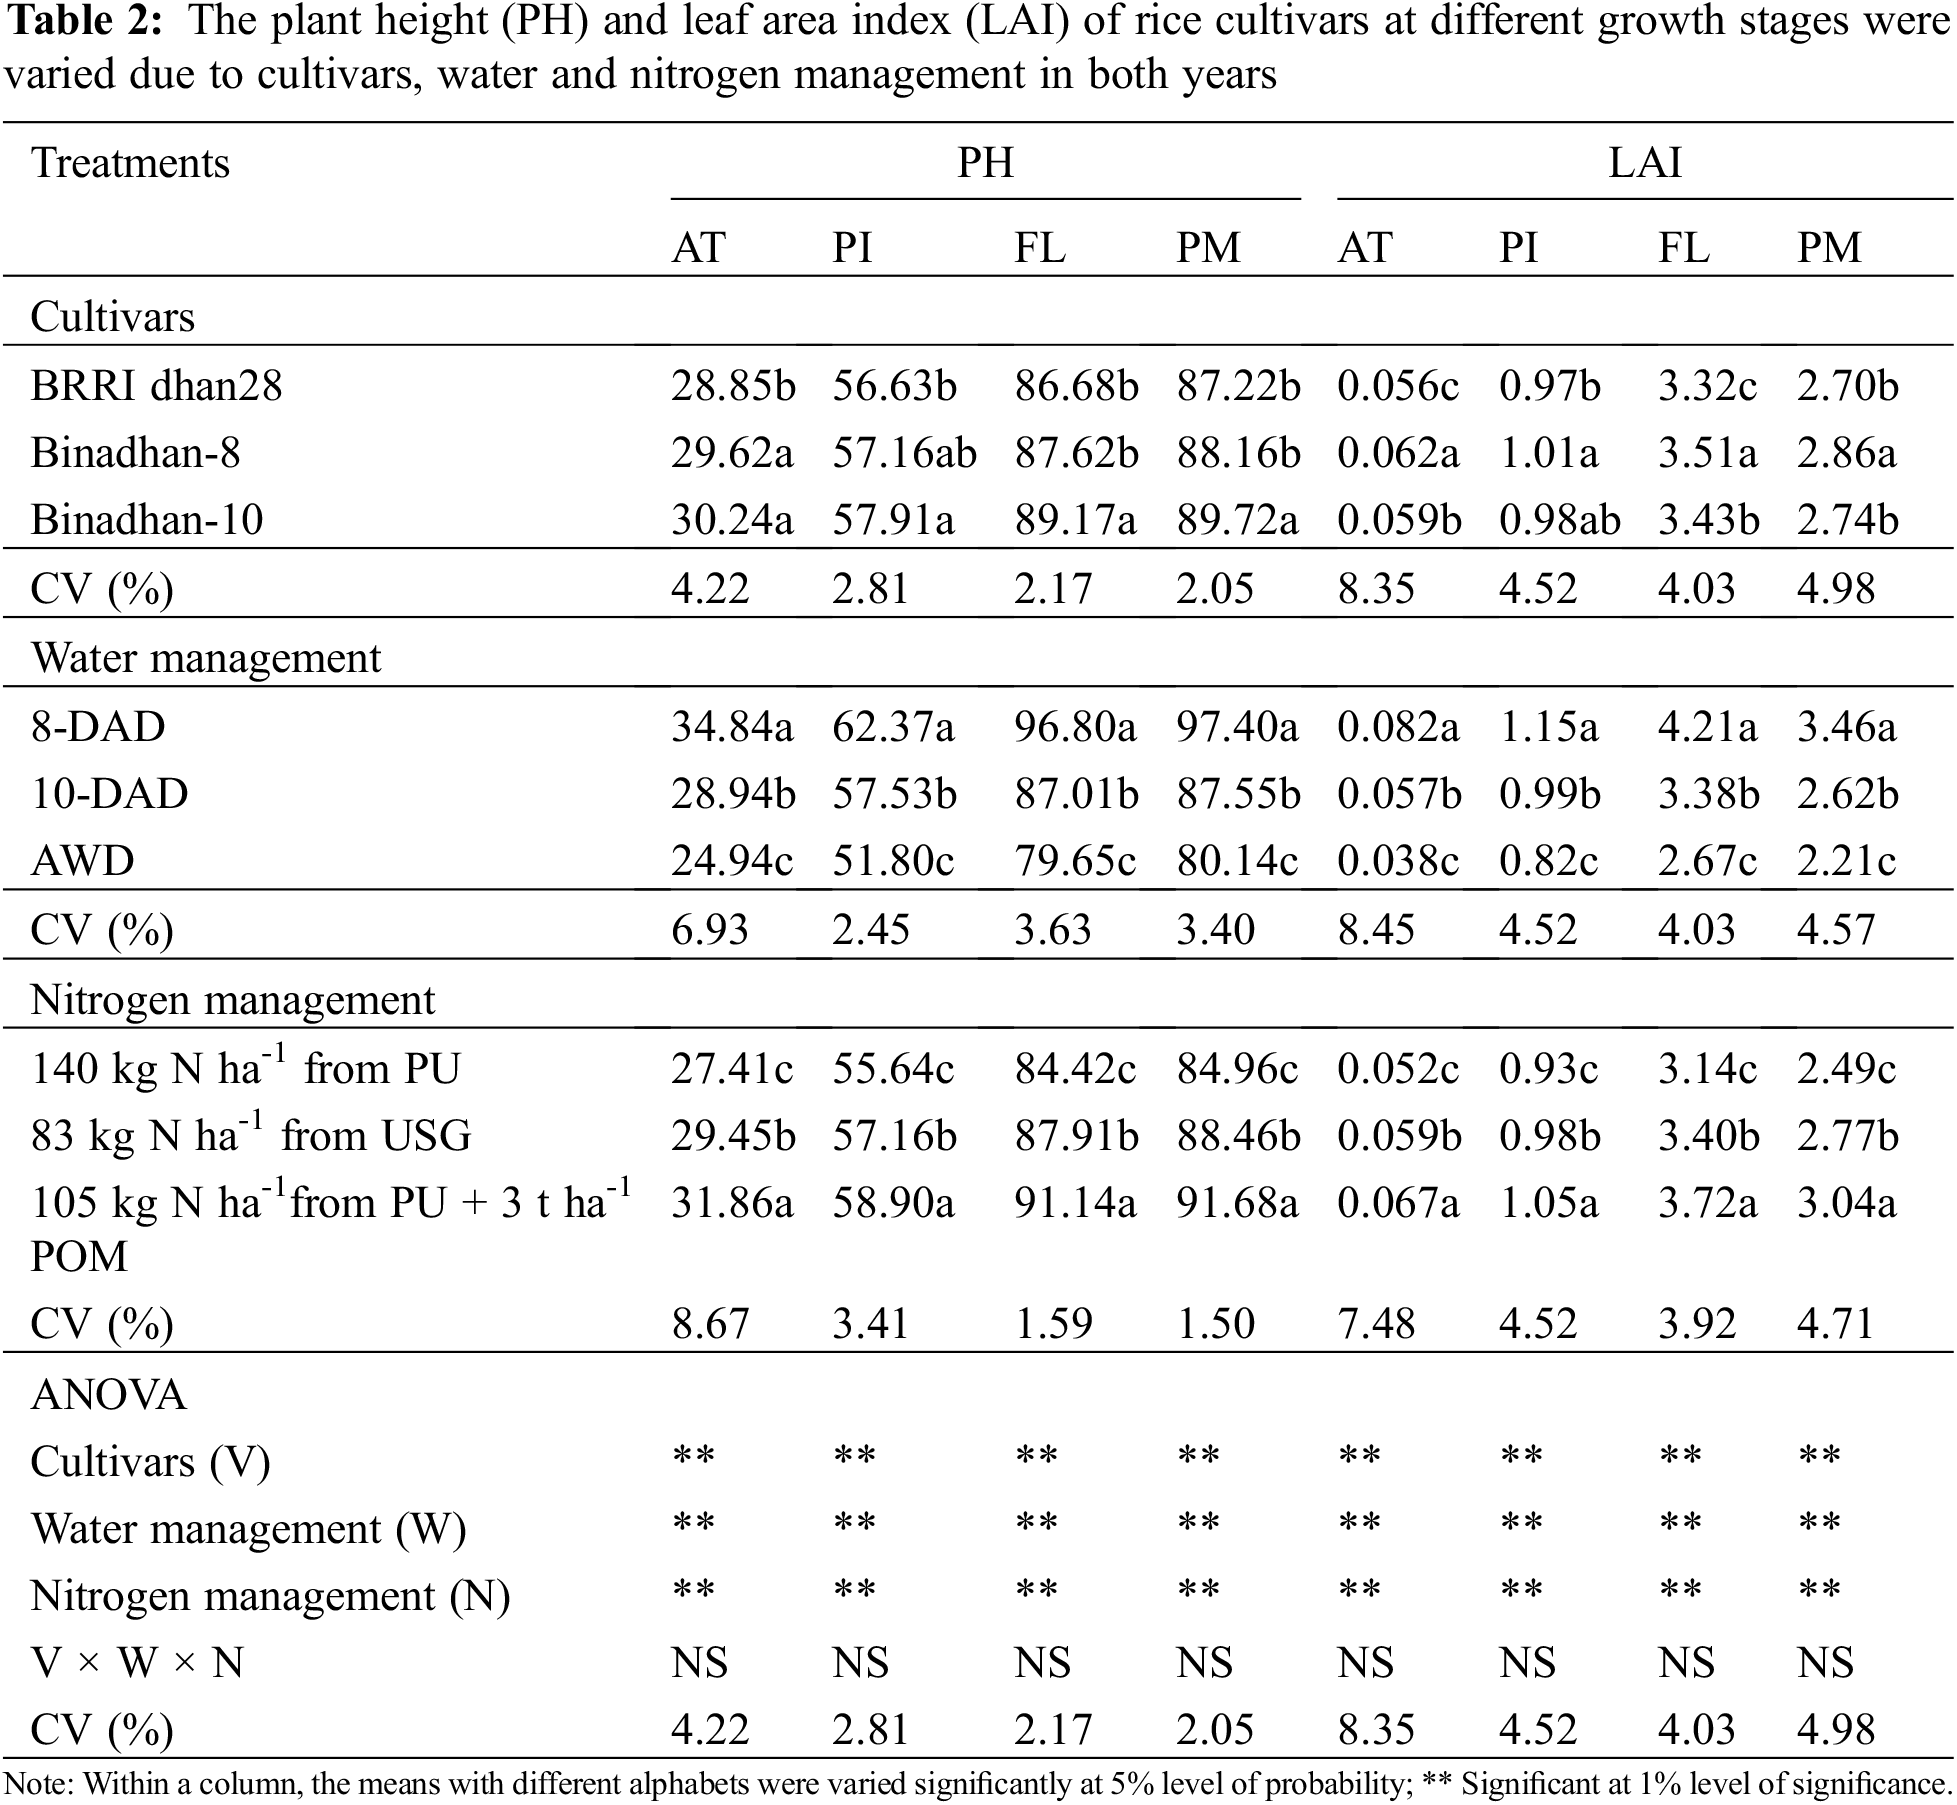
Plant height augmented progressively over time reaching the peak level at PM. Binadhan-10 at PM showed longest plant (89.72 cm) height. The longest plant was observed at 8-DAD treatment in view of water management system. The influence of nitrogen management on plant height was also documented (Table 2). The maximum plant height was registered with 105 kg N from PU + 3 t ha-1 POM. In respect of cultivars, water and nitrogen management LAI was found significant. In the case of growth stage, LAI was enlarged raucously, attainment a peak at FL and then declining regardless of treatment differentiations. Due to the loss of some leaves through senescence LAI decreased after FL. Maximum LAI (3.51) was found at FL by Binadhan-8. Growing LAI with 8-DAD was recorded at all growth stages. LAI with 8-DAD was significantly higher than 10-DAD and AWD. The levels of nitrogen management had marked variation in LAI (Table 2).
Elevated LAI was registered with the application of 105 kg N from PU + 3 t ha-1 POM as compared to 83 kg N ha-1 from USG and 140 kg N ha-1 from PU. Fig. 3a revealed significant correlation (R2 = 0.98, P ≤ 0.01) amongst yield and LAI at FL. More solar radiation was absorbed with higher LAI containing cultivars which resulted in higher photosynthesis and eventually generated higher yields. GY differences for all rice varieties were correlated significantly (R2 = 0.94, P ≤ 0.01) with CGR at FL (Fig. 3b).
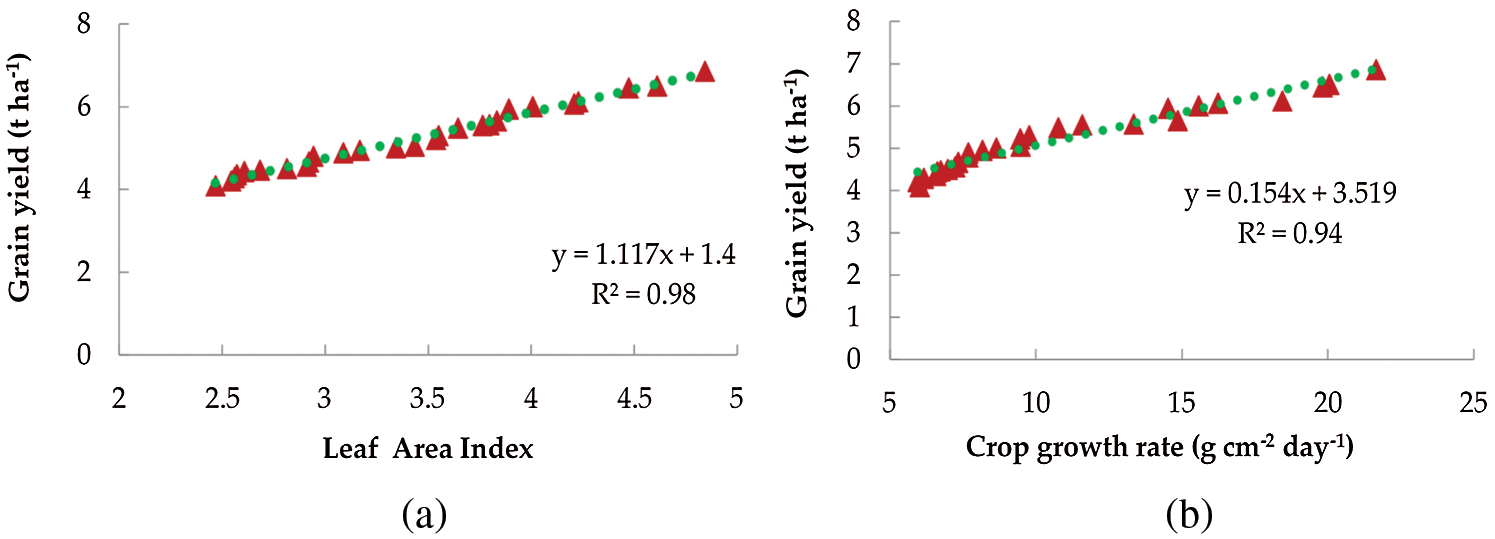
Figure 3: Correlation between GY and LAI (a) and CGR at flowering (b)
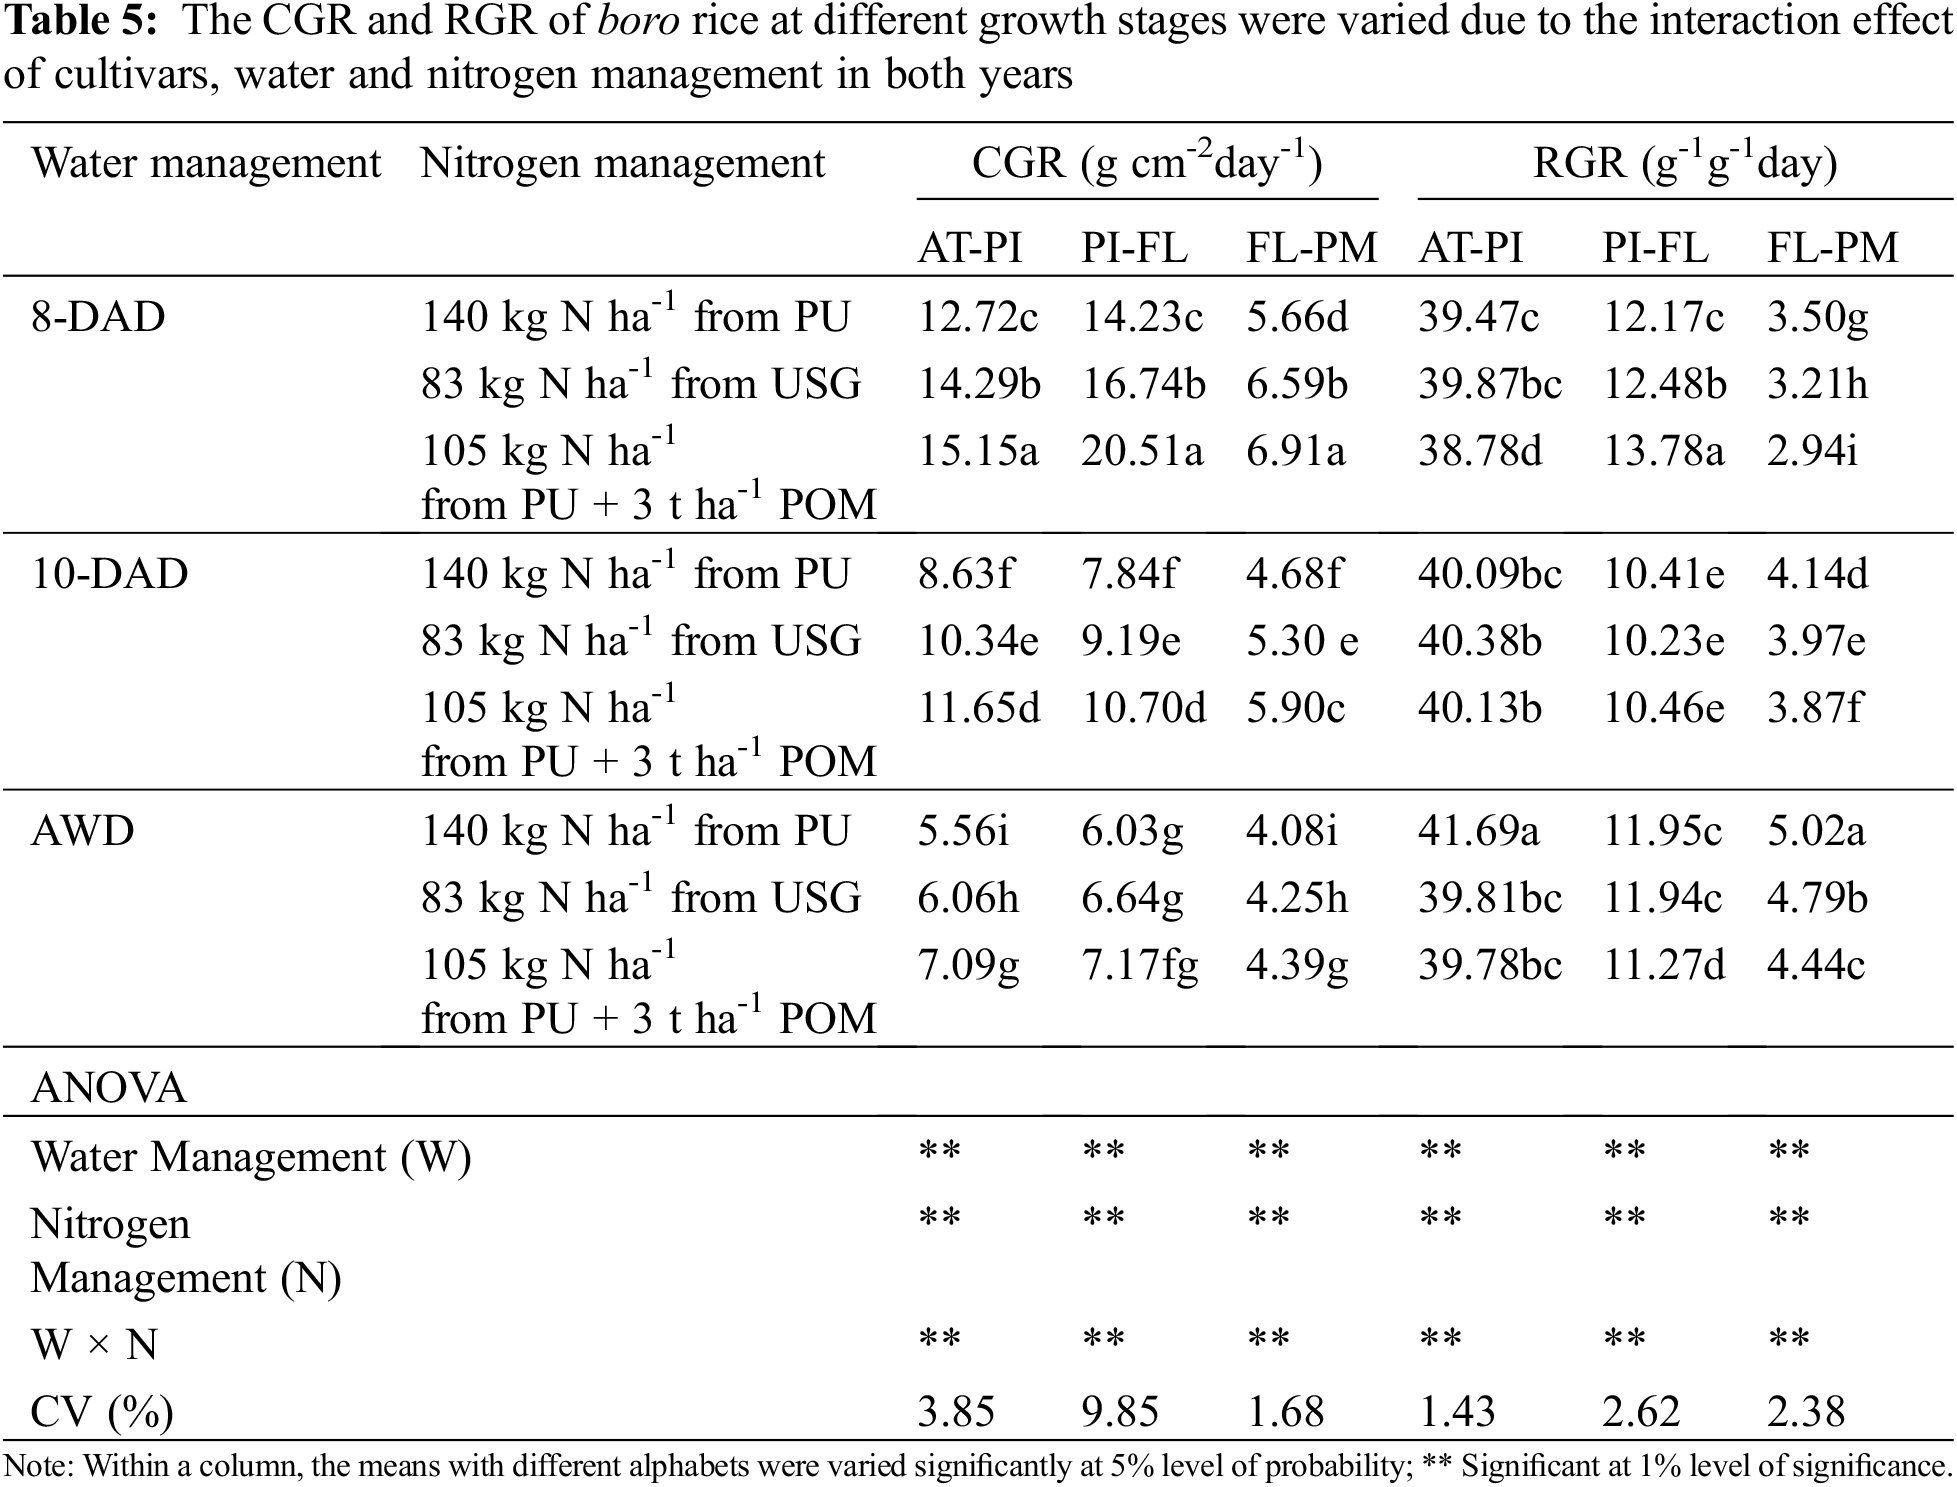
CGR improved similarly with the upsurge in leaf area over the time until FL and then declined irrespective of cultivar, water and nitrogen management (Tables 3 and 4). This parameter was significant for interactions between water and nitrogen management, cultivar and water management (Tables 5–8). CGR was highest (20.51 g cm-2 day-1) at 105 kg N from PU + 3 t ha-1 POM at FL for 8-DAD and lowest was noted at 140 kg N ha-1 from PU for AWD. In the same way, CGR at Binadhan-8 was the highest (18.20 g cm-2 day-1) at FL for 8-DAD and the lowest was found at BRRI dhan-28 for AWD. Regardless of treatments, RGR was higher at the premature stage (AT) and demonstrated a retreating tendency with the progression of plant age (Tables 3 and 4). Increment of metabolically active tissue resulted in the decrease of RGR. The use of 105 kg N from PU + 3 t ha-1 POM with 8-DAD had the highest RGR (13.78 g-1g-1day) at FL (Table 5). Maximum RGR (13.01 g-1g-1 day) was obtained from Binadhan-10 along with 8-DAD at FL (Tables 7 and 8) in view of the interaction between cultivars and water management.

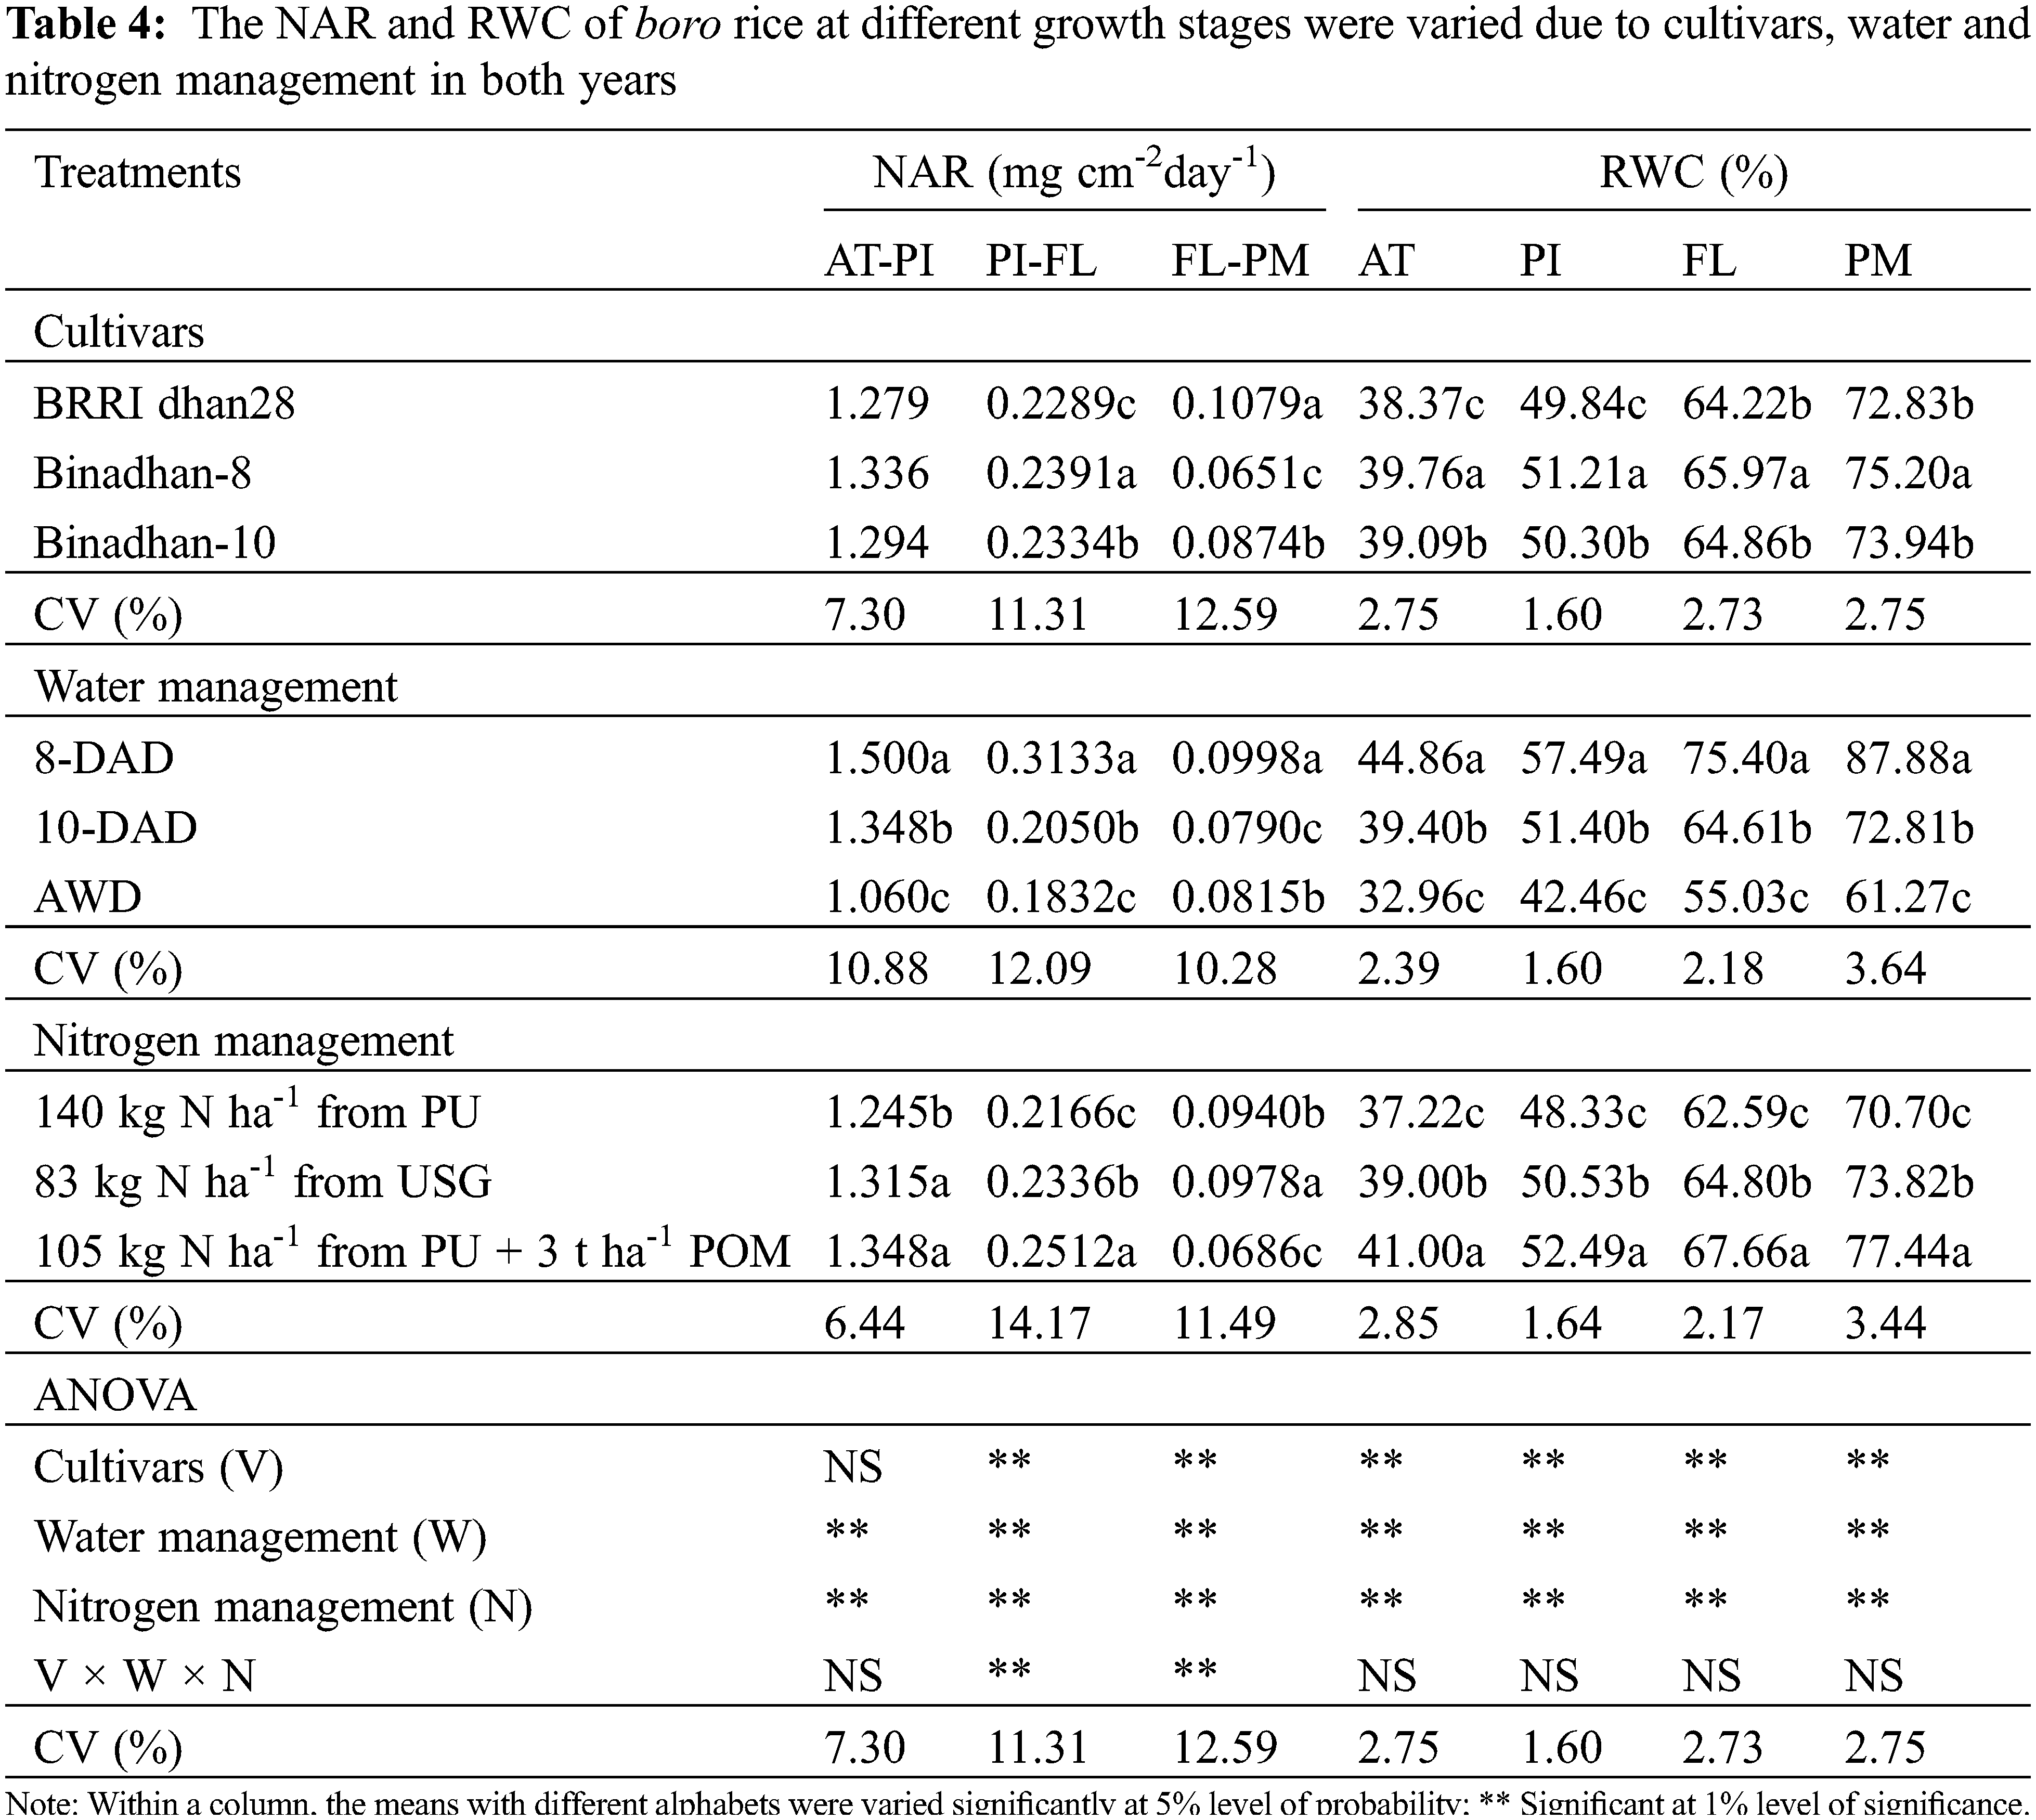
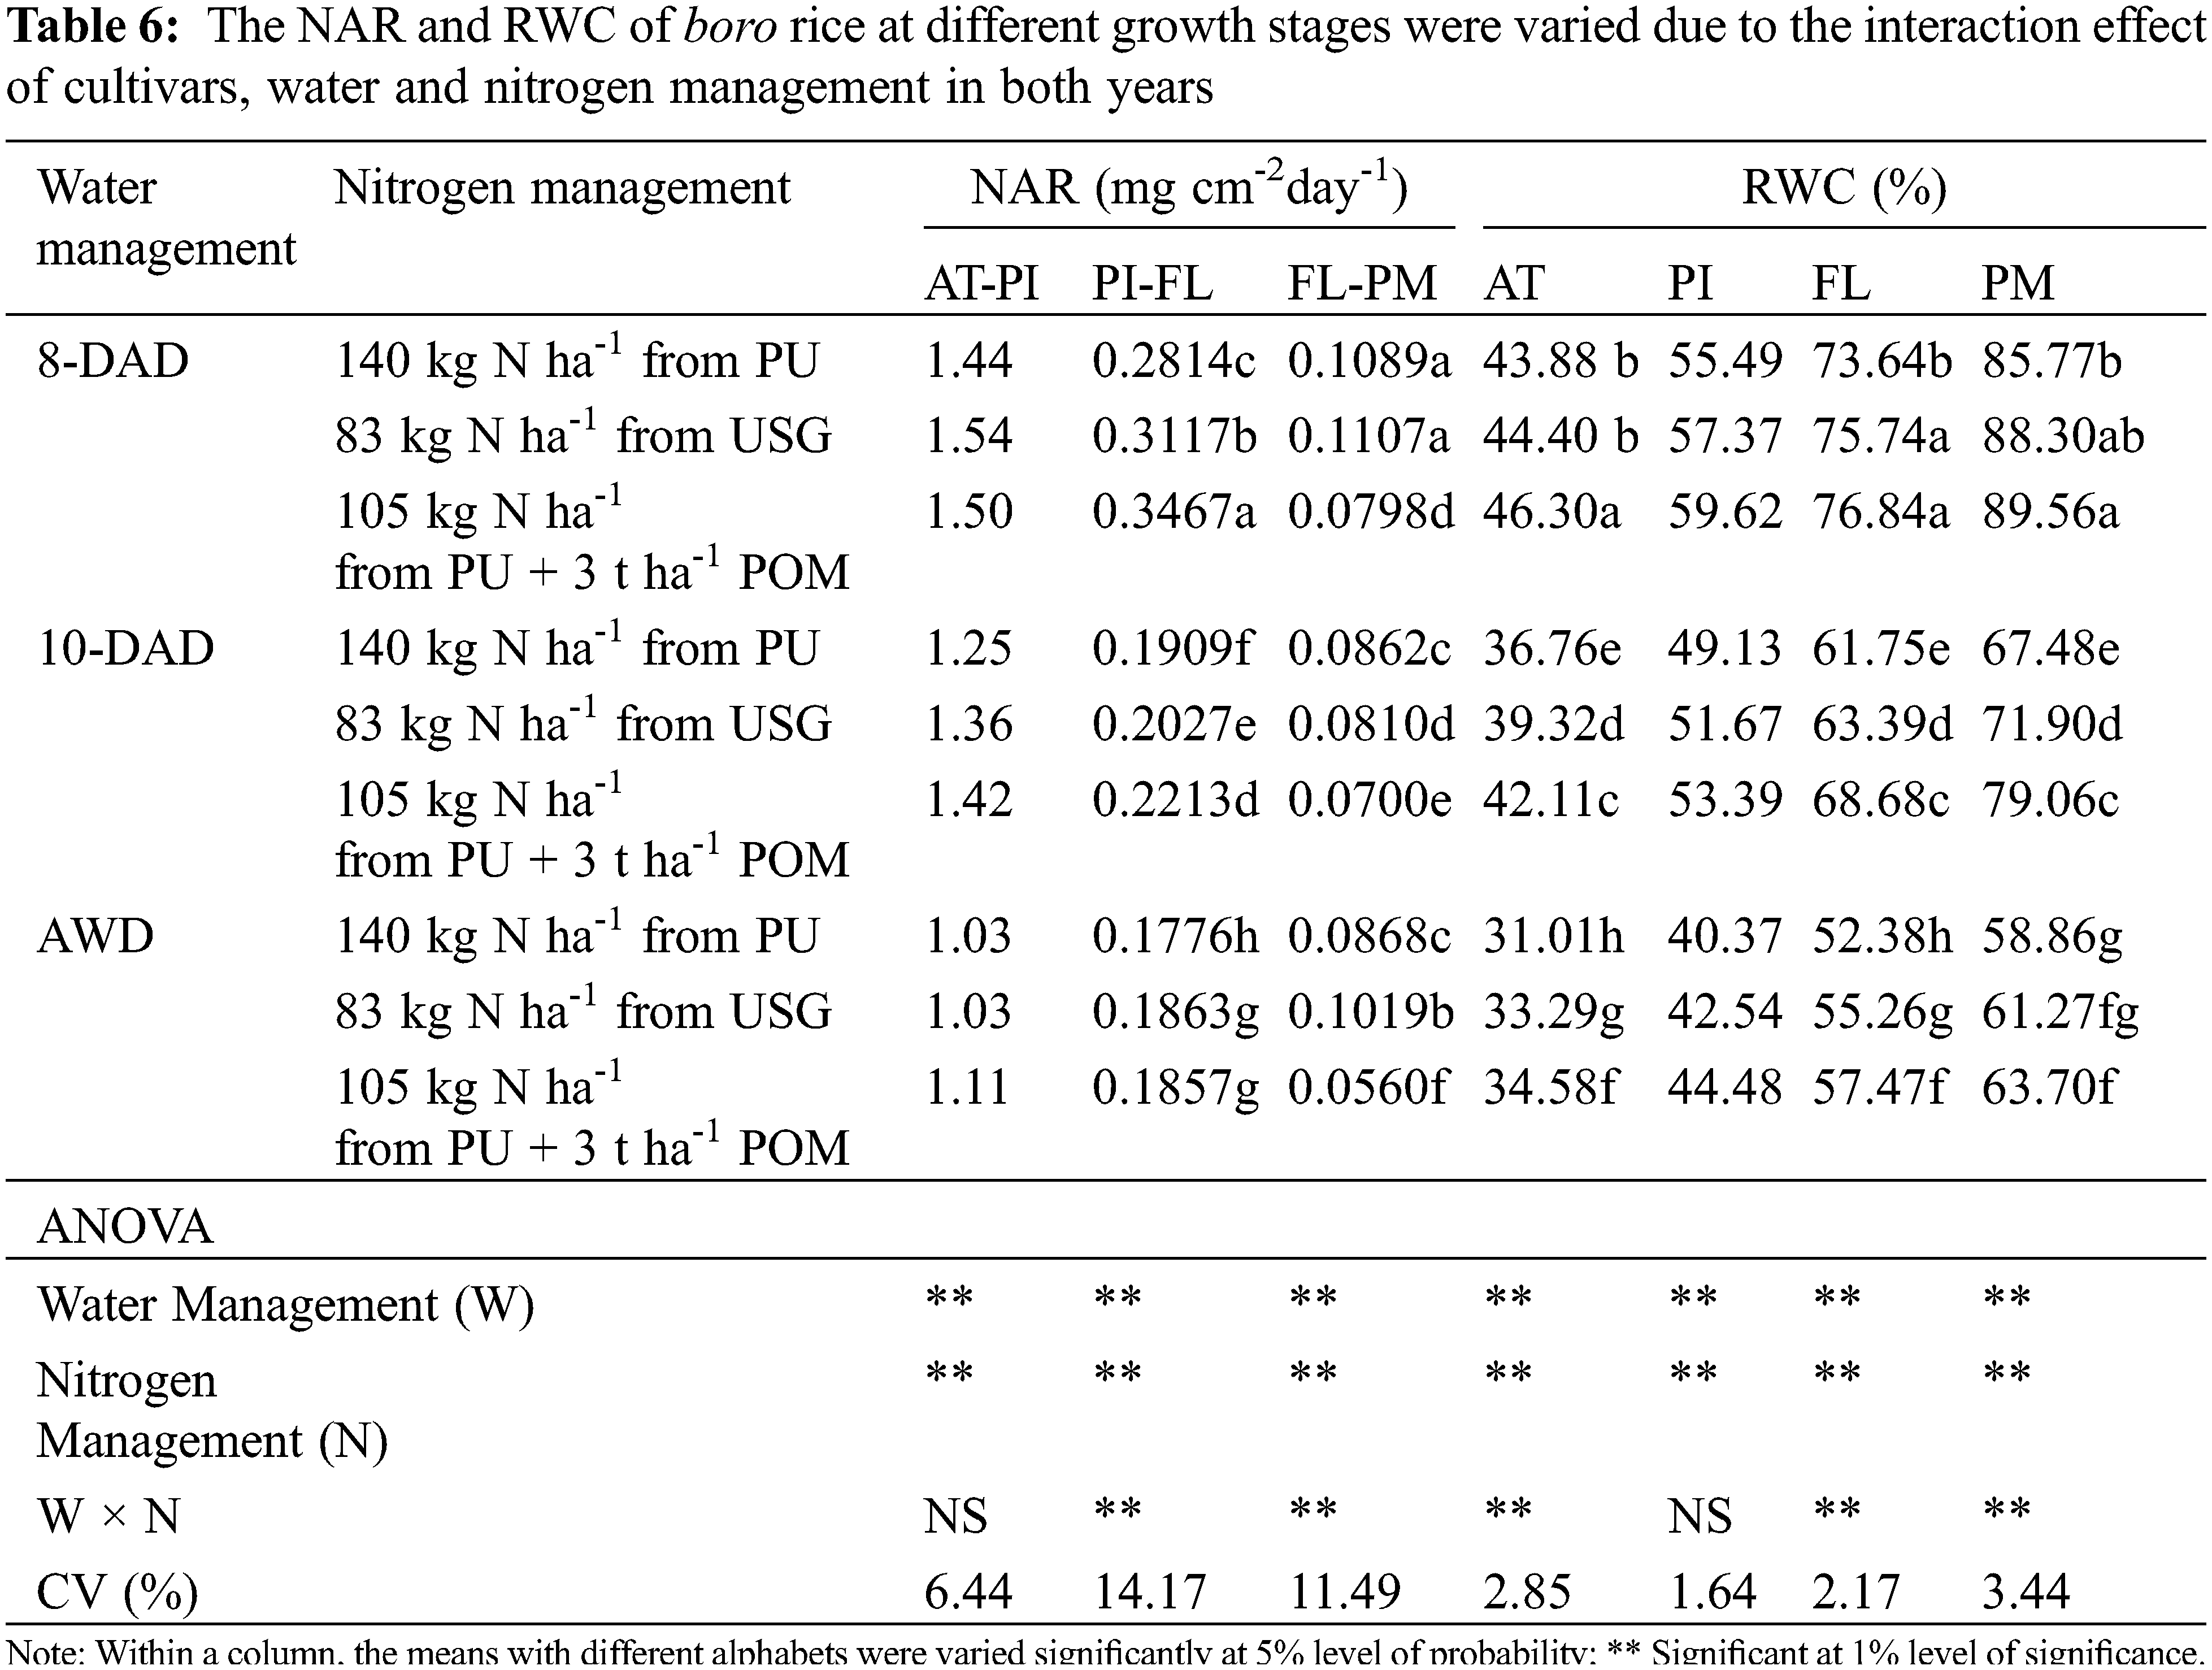
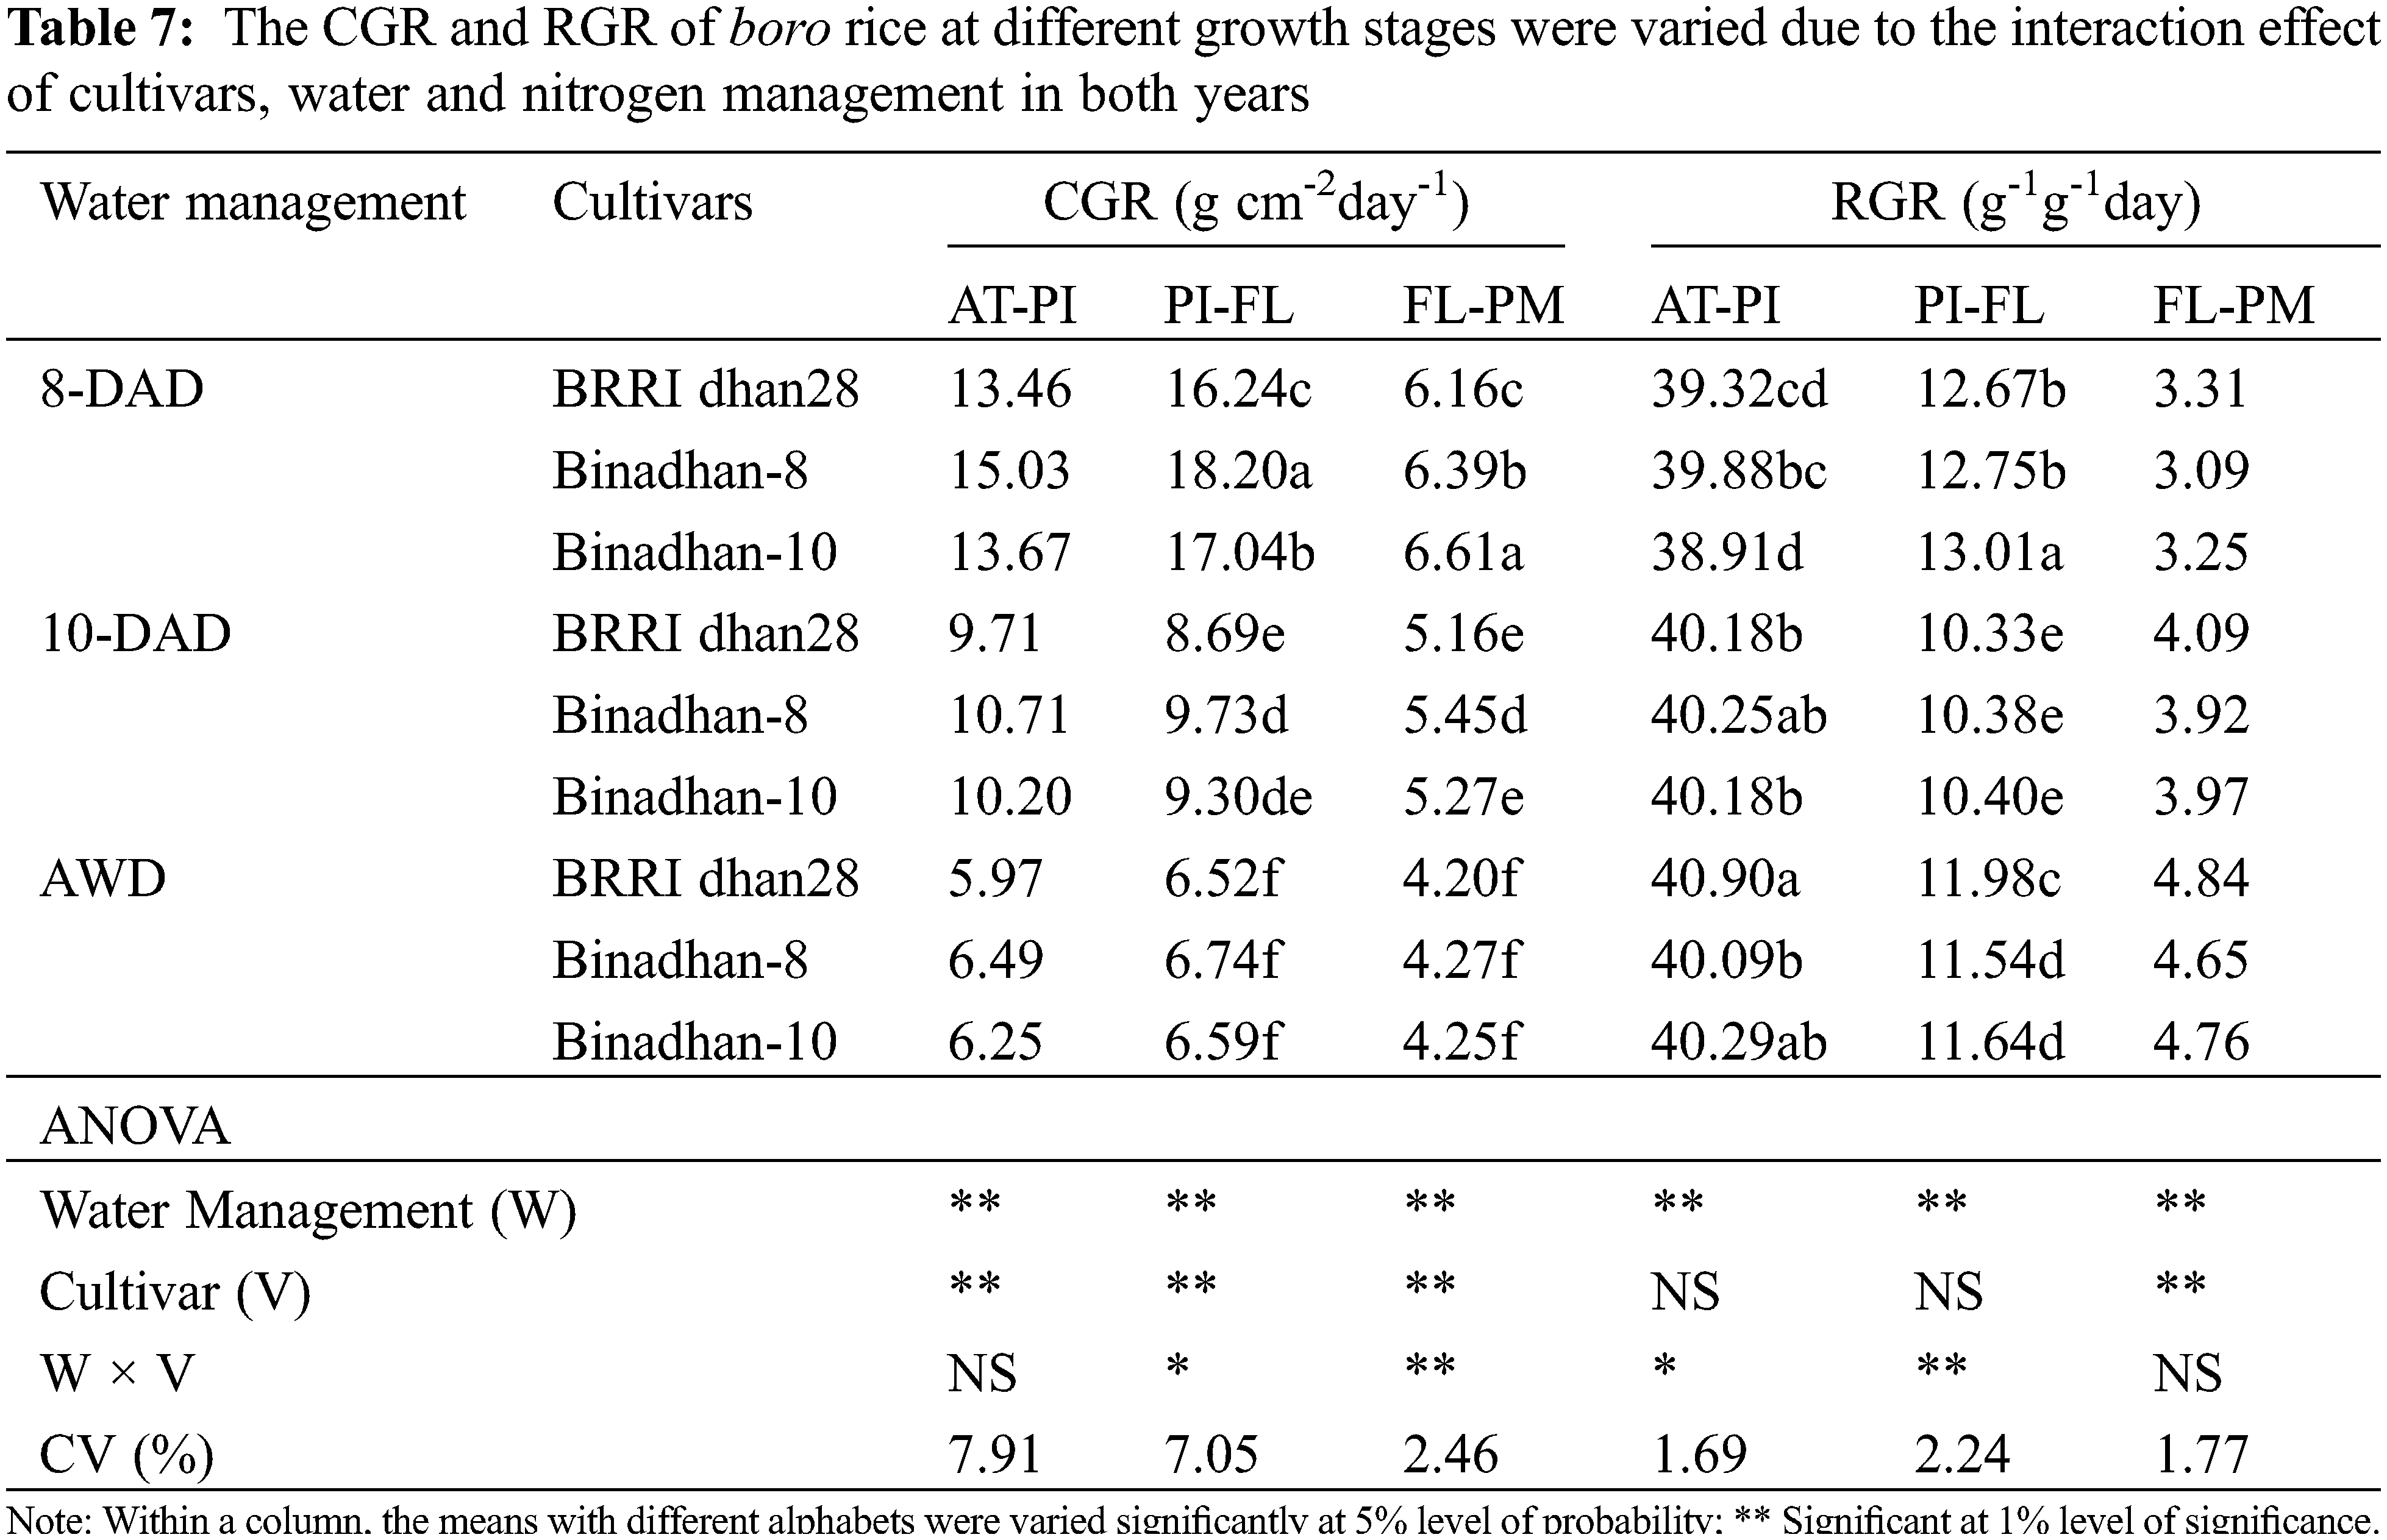
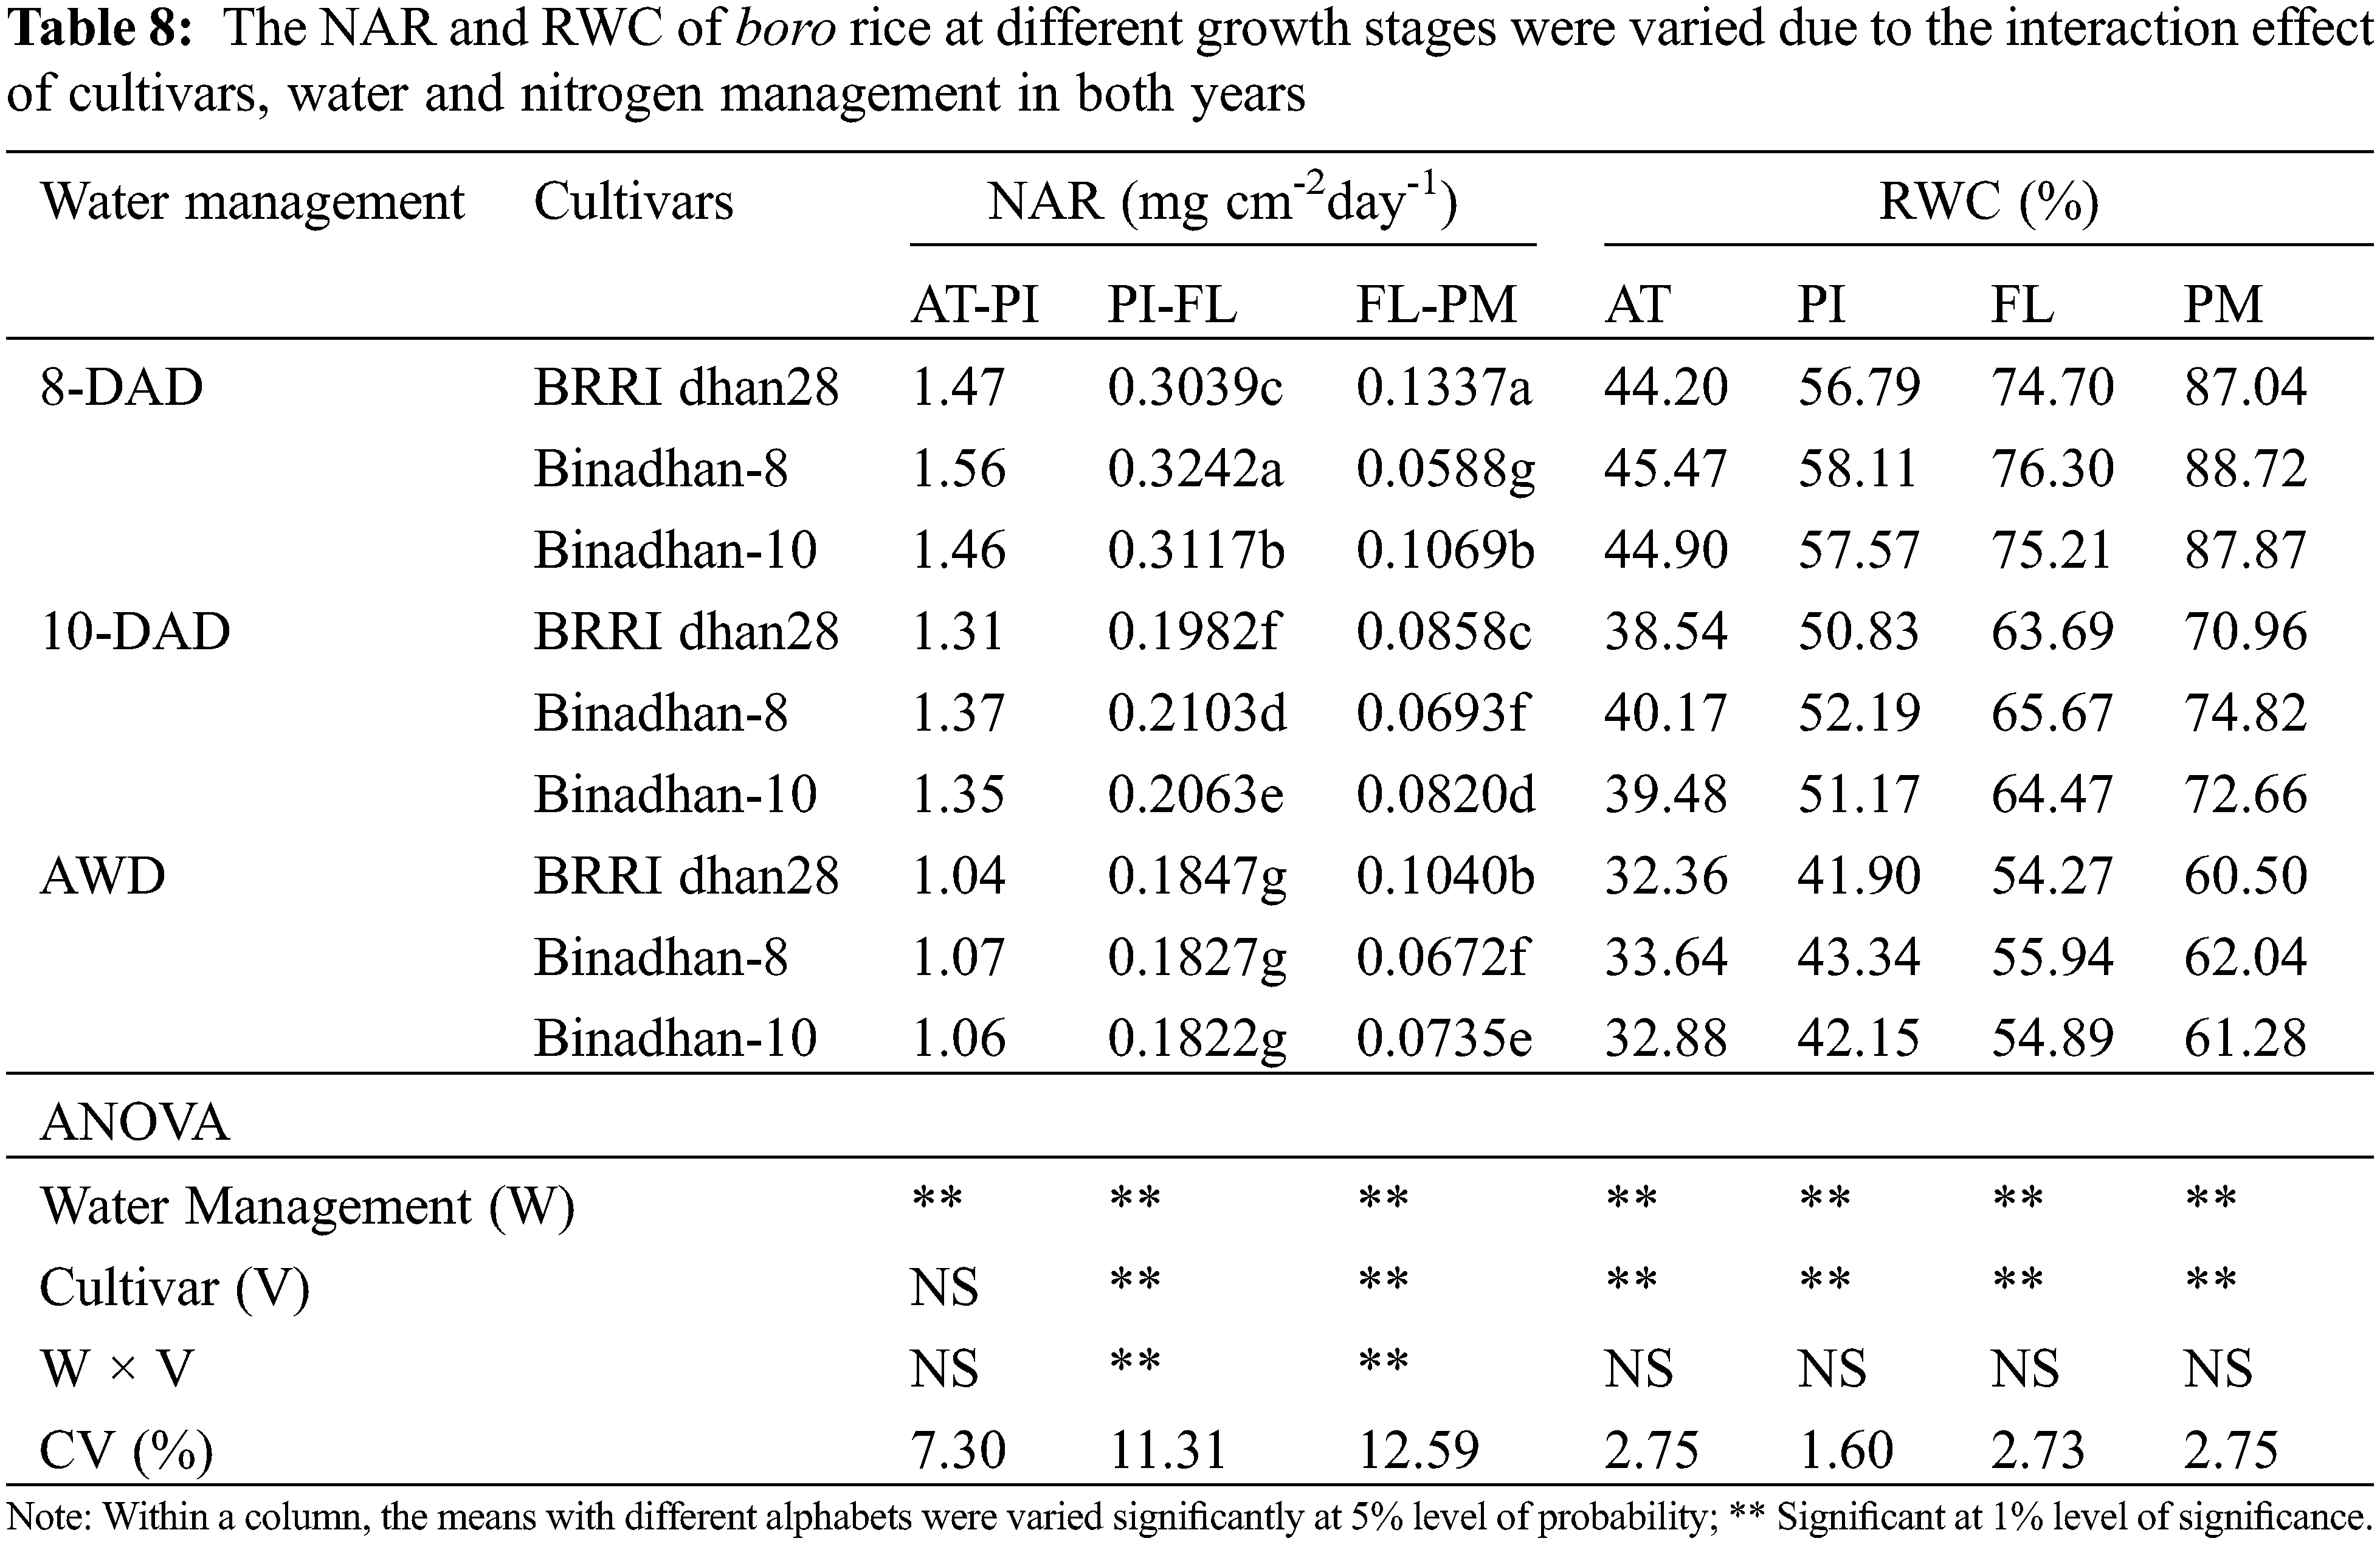
The movement in NAR was descending based on treatments (Table 3). NAR was significant for interaction between water and nitrogen management and a parallel trend of the result was recorded as achieved in CGR and RGR. The result obtained is related to CGR in view of cultivar and water management.
RWC was significantly influenced by cultivars, water and nitrogen management. The tolerance levels of cultivars were higher to drought conditions having elevated RWC (%). At FL, the maximum RWC (65.97%) was exhibited by Binadhan-8. Most of the cultivars had a slight change in RWC at FL and PM and related patterns of RWC as before were documented. The interaction effect of water and nitrogen management was significant for RWC. The highest RWC (76.84%) at FL was recorded from 105 kg N from PU + 3 t ha-1 POM with 8-DAD which is statistically similar to 83 kg N ha-1 from USG and 8-DAD.
3.3 Total Dry Matter, Grain yield and Yield Components
TDM increased significantly from AT to PM (TDM at FL only presented, Table 9). It was maximum (P < 0.05) in Binadhan-8 followed by Binadhan-10 and BRRI dhan28. TDM varied from 12.70 to 30.78 g plant-1with water management treatments. Highest TDM was recorded at 8-DAD compared to 10-DAD and AWD. In respect of nitrogen management, maximum TDM was found in 105 kg N from PU + 3 t ha-1 POM. TDM was significant for combined effect of water and nitrogen management (Table 10). Use of 105 kg N from PU + 3 t ha-1 POM with 8-DAD treatment produced highest TDM (35.13 g plant-1). In addition, interaction effect of cultivar and water management was also significant for this parameter (Table 11).
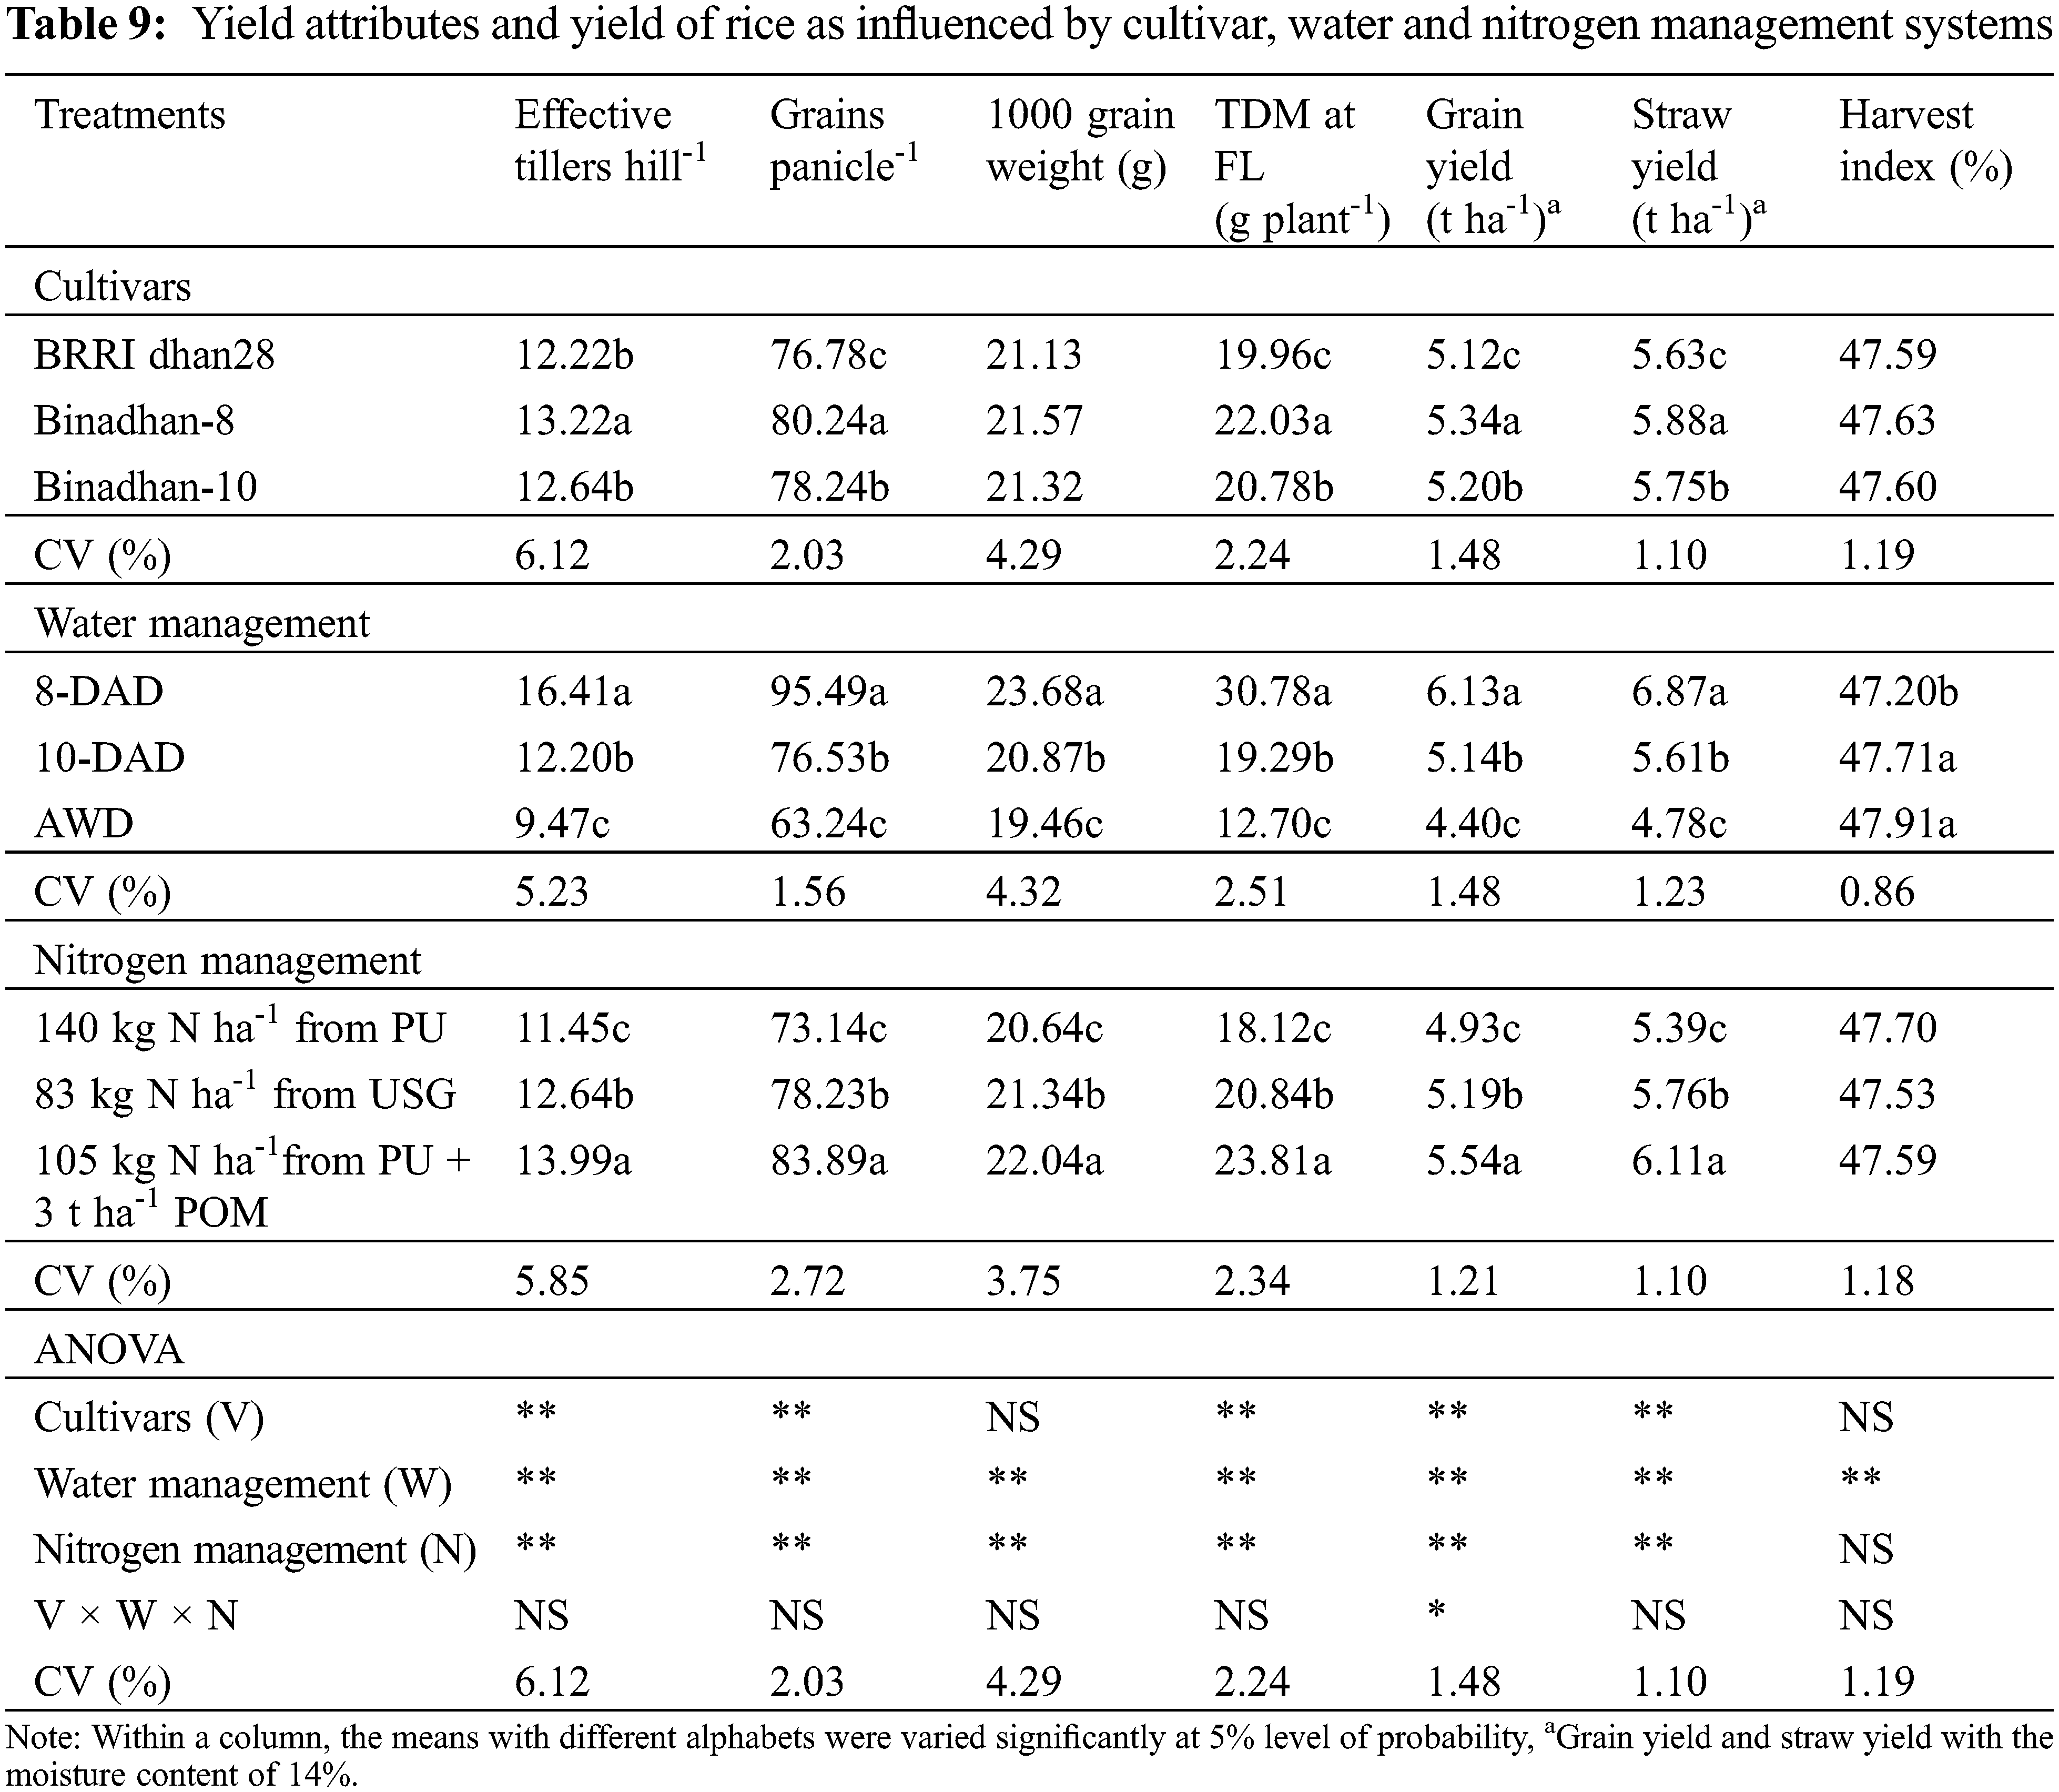
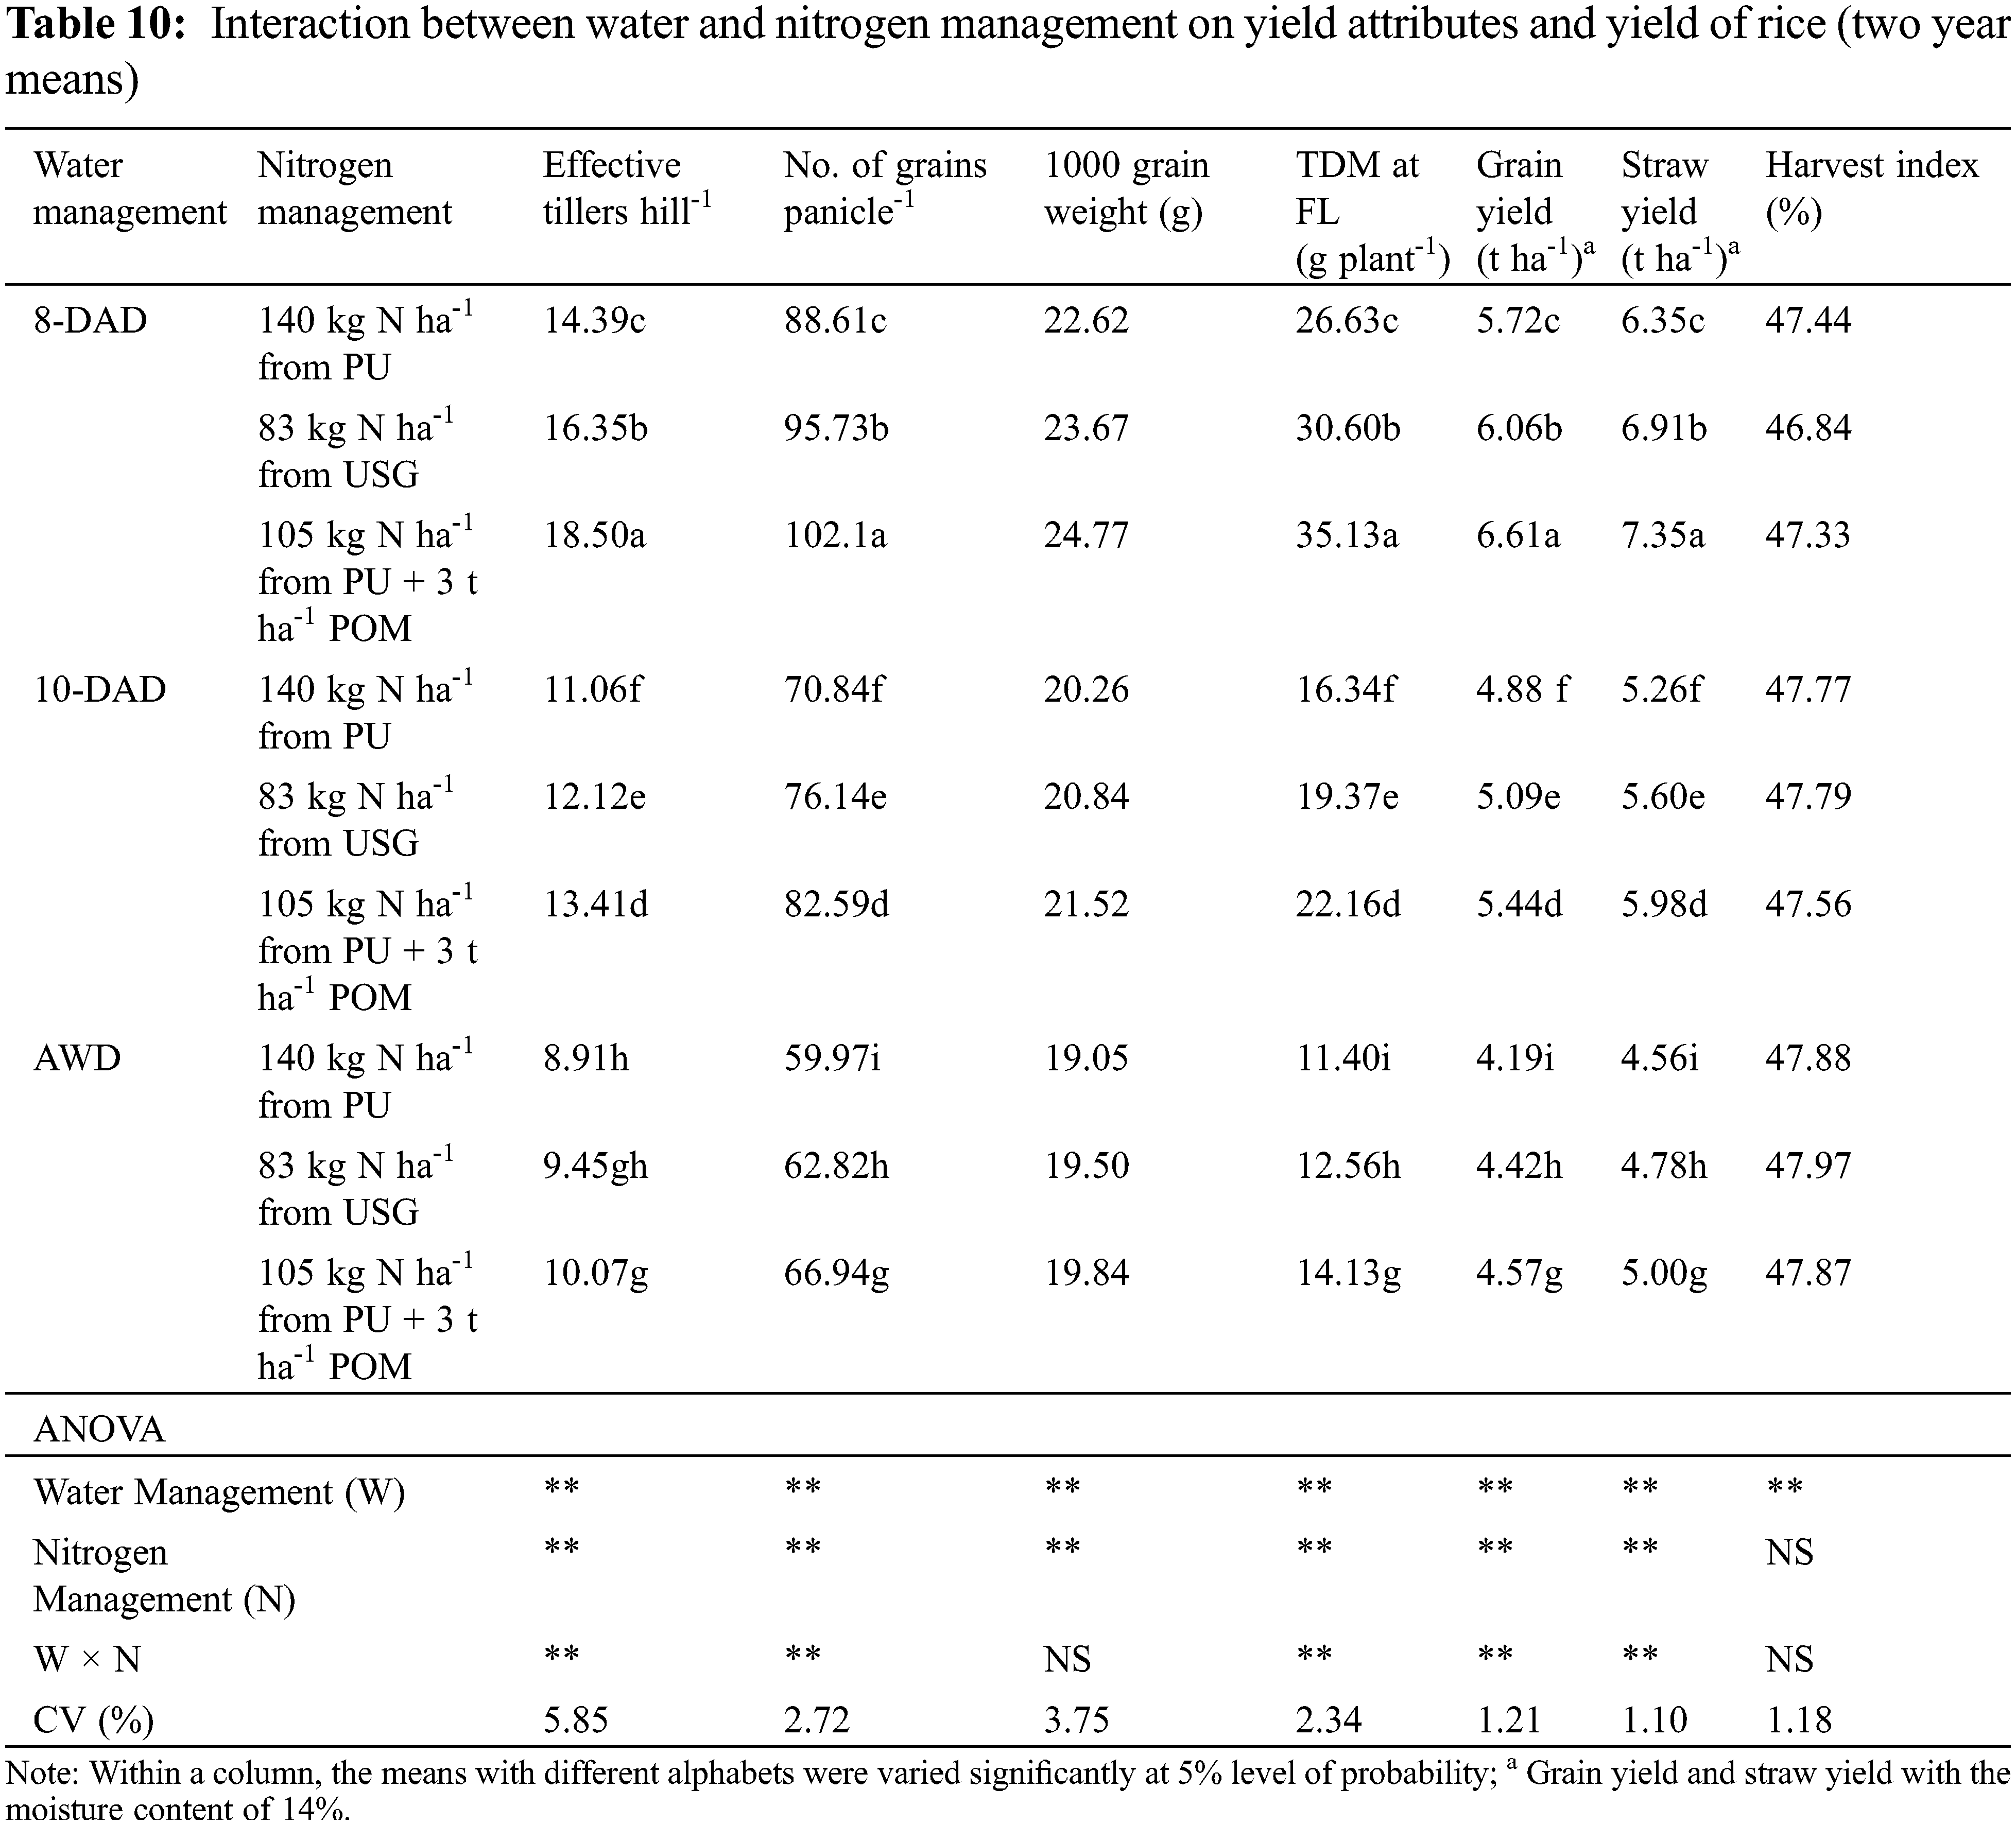
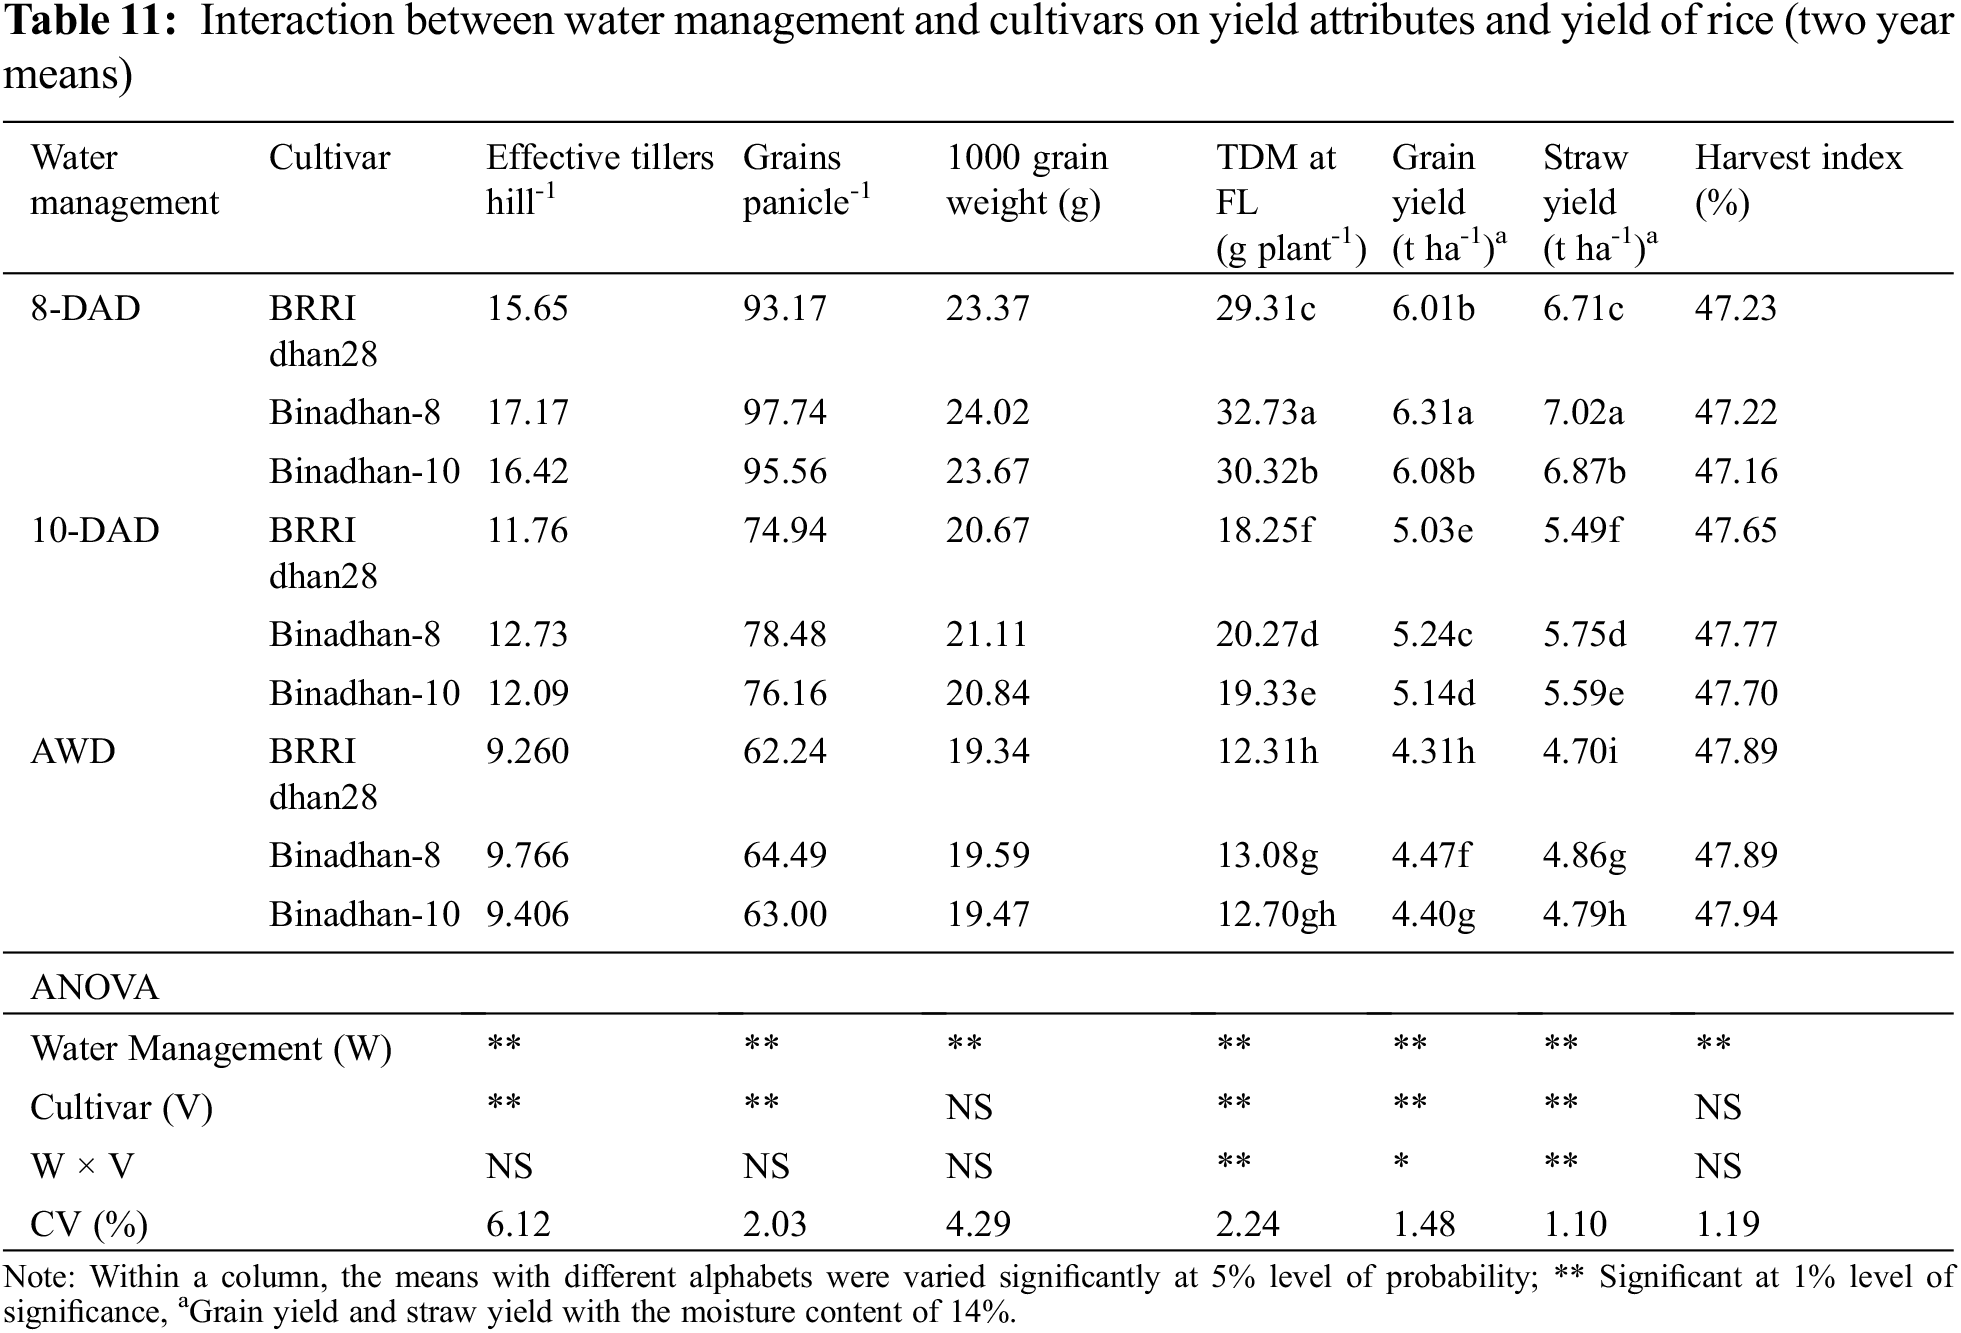
The highest TDM (32.73 g plant-1) was recorded in Binadhan-8 and 8-DAD treatment. TDM was greatly responsible for GY variations among cultivars (R2 = 0.98, P < 0.01) to (Fig. 4a). Table 9 showed the ANOVA of GY and yield components and their mean relationship. The highest number of effective tillers hill-1 was observed in Binadhan-8 followed by Binadhan-10 and BRRI dhan28. Effective tillers hill-1 had a strong correlation with GY (R2 = 0.98, P < 0.01) (Fig. 4b). Moreover, number of grains panicle-1, GY and straw yield was higher in Binadhan-8. There was a positive relationship (R2 = 0.98, P < 0.01) between grains panicle-1 and GY (Fig. 4c). Yield attributes and yield differed significantly with water management (Table 9). GY of rice under 8- DAD and 10- DAD treatments was 39.32% and 16.82 % higher than AWD. GY was also significantly affected by nitrogen management. 105 kg N from PU + 3 t ha-1 POM produced maximum GY (5.54 t ha-1) followed by 83 kg N ha-1 from USG and 140 kg N ha-1 from PU. Combined effect of water and nitrogen management demonstrated significant response in terms of yield components and yield (Table 10). The top value related to GY (6.61 t ha-1) was recorded from application of 105 kg N from PU + 3 t ha-1 POM with 8-DAD while the minimum was established in 140 kg N ha-1 from PU with AWD. Binadhan-8 with 8-DAD treatment produced highest GY (6.31 t ha-1) (Table 11). Besides lowest GY (4.31 t ha-1) was obtained from BRRI dhan28 along with AWD treatment. There was a distinct variation in GY due to interaction effect among cultivar, water and nitrogen management (Fig. 5).
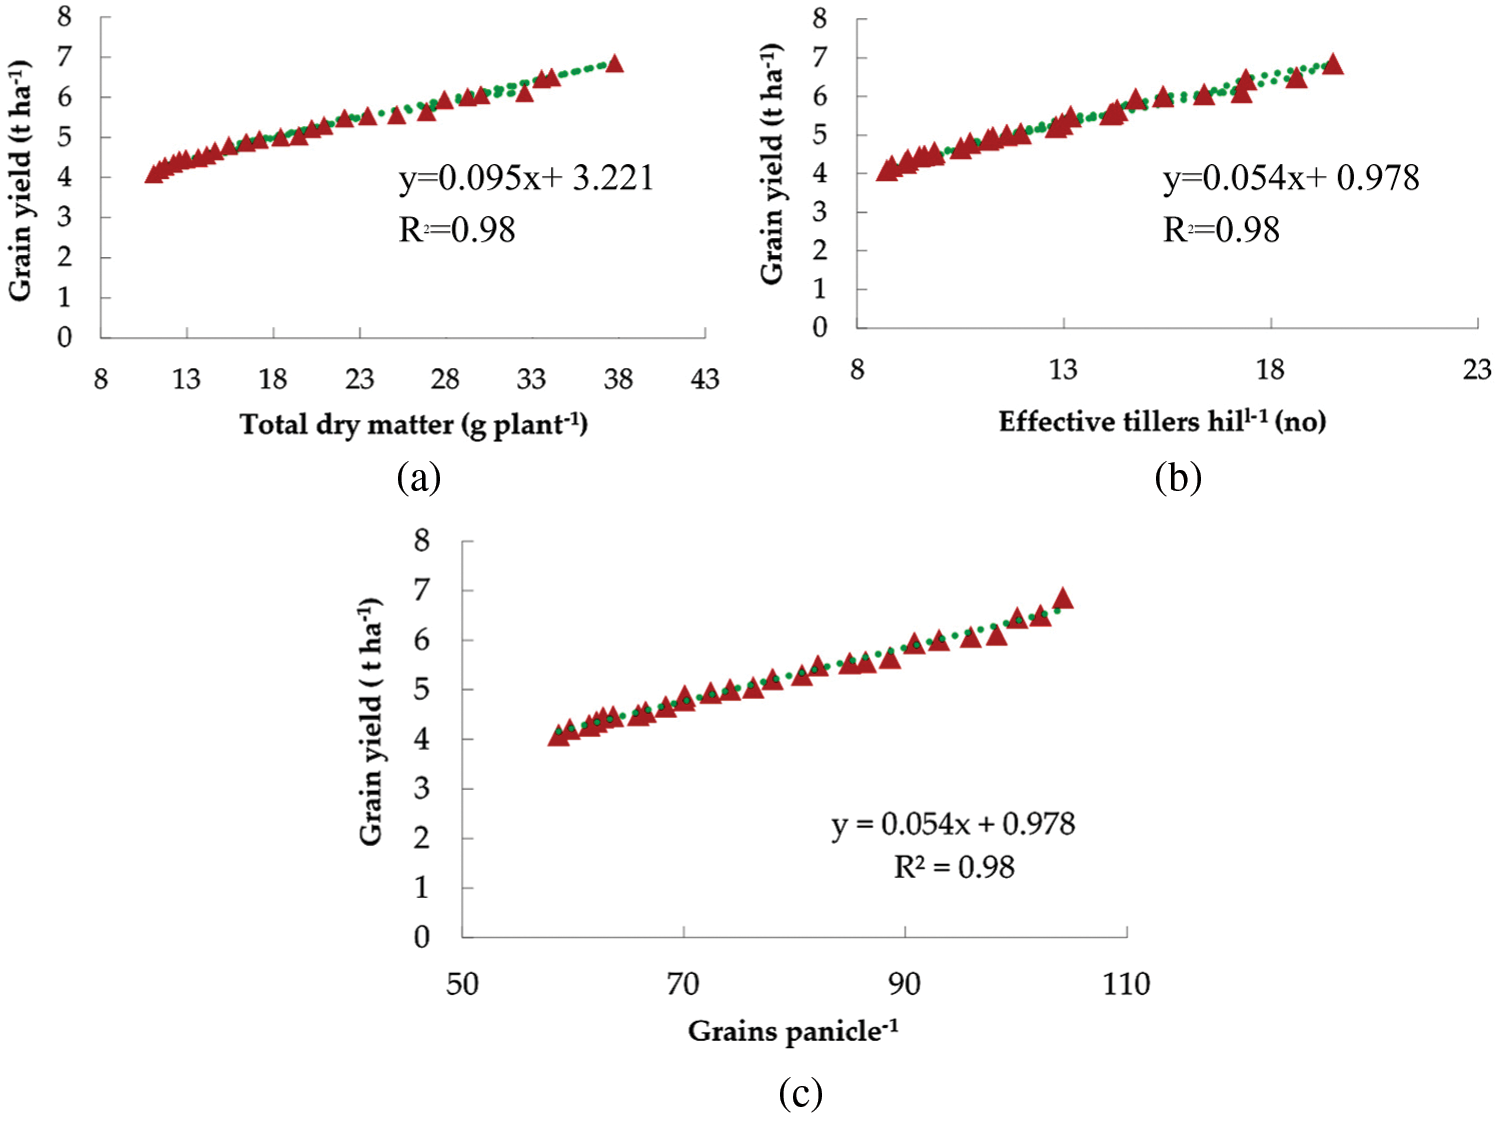
Figure 4: Relationship between GY and total dry matter (a), effective tillers hill-1 (b), and grains panicle-1 (c)
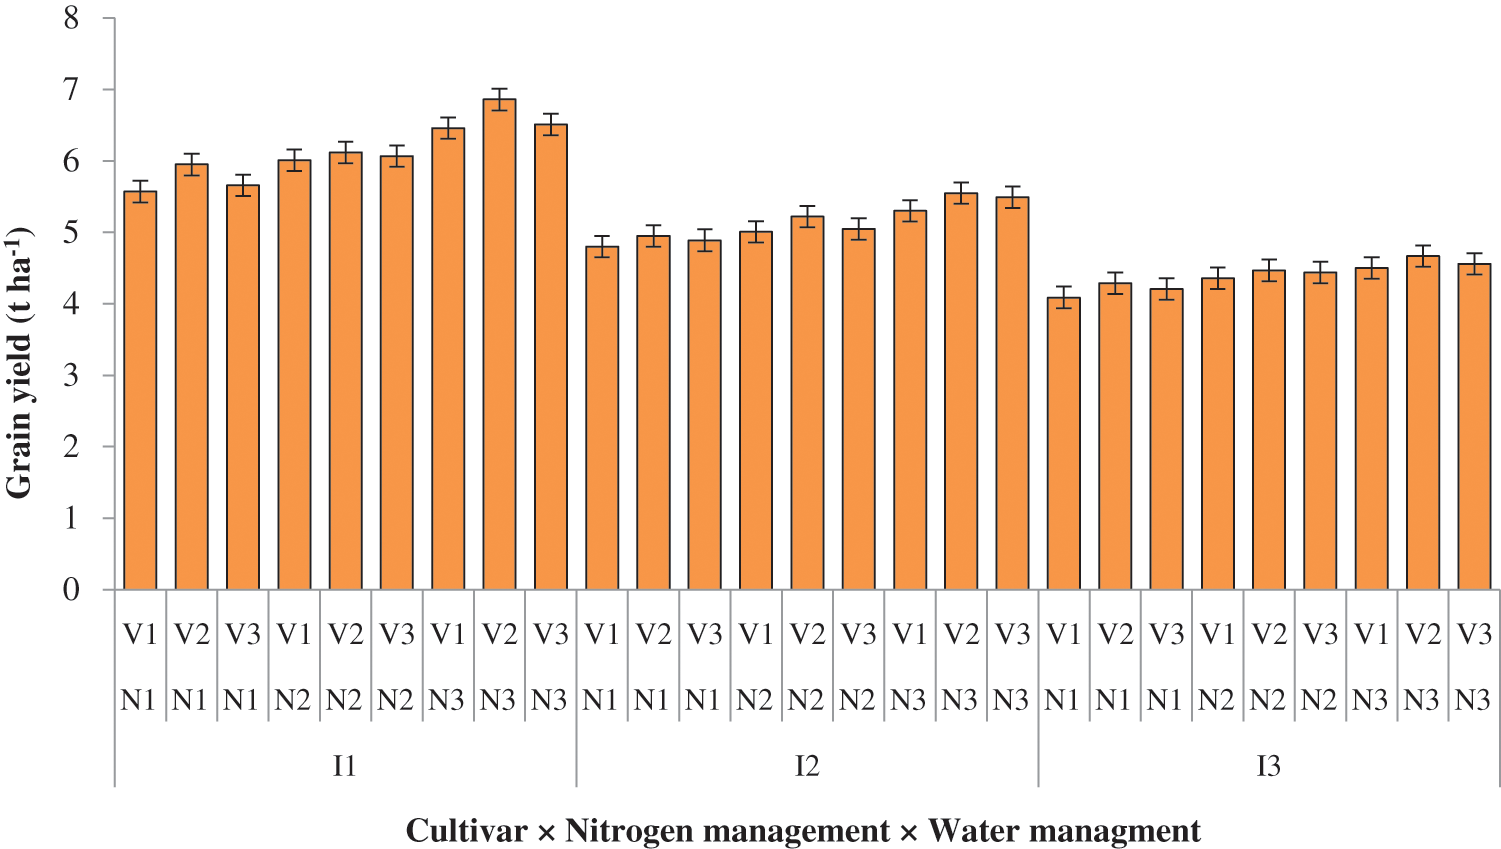
Figure 5: Interaction among cultivar, water and nitrogen management for GY
3.4 Water Use and Productivity
Table 12 figured out the water consumption and water productivity with different water management treatments.
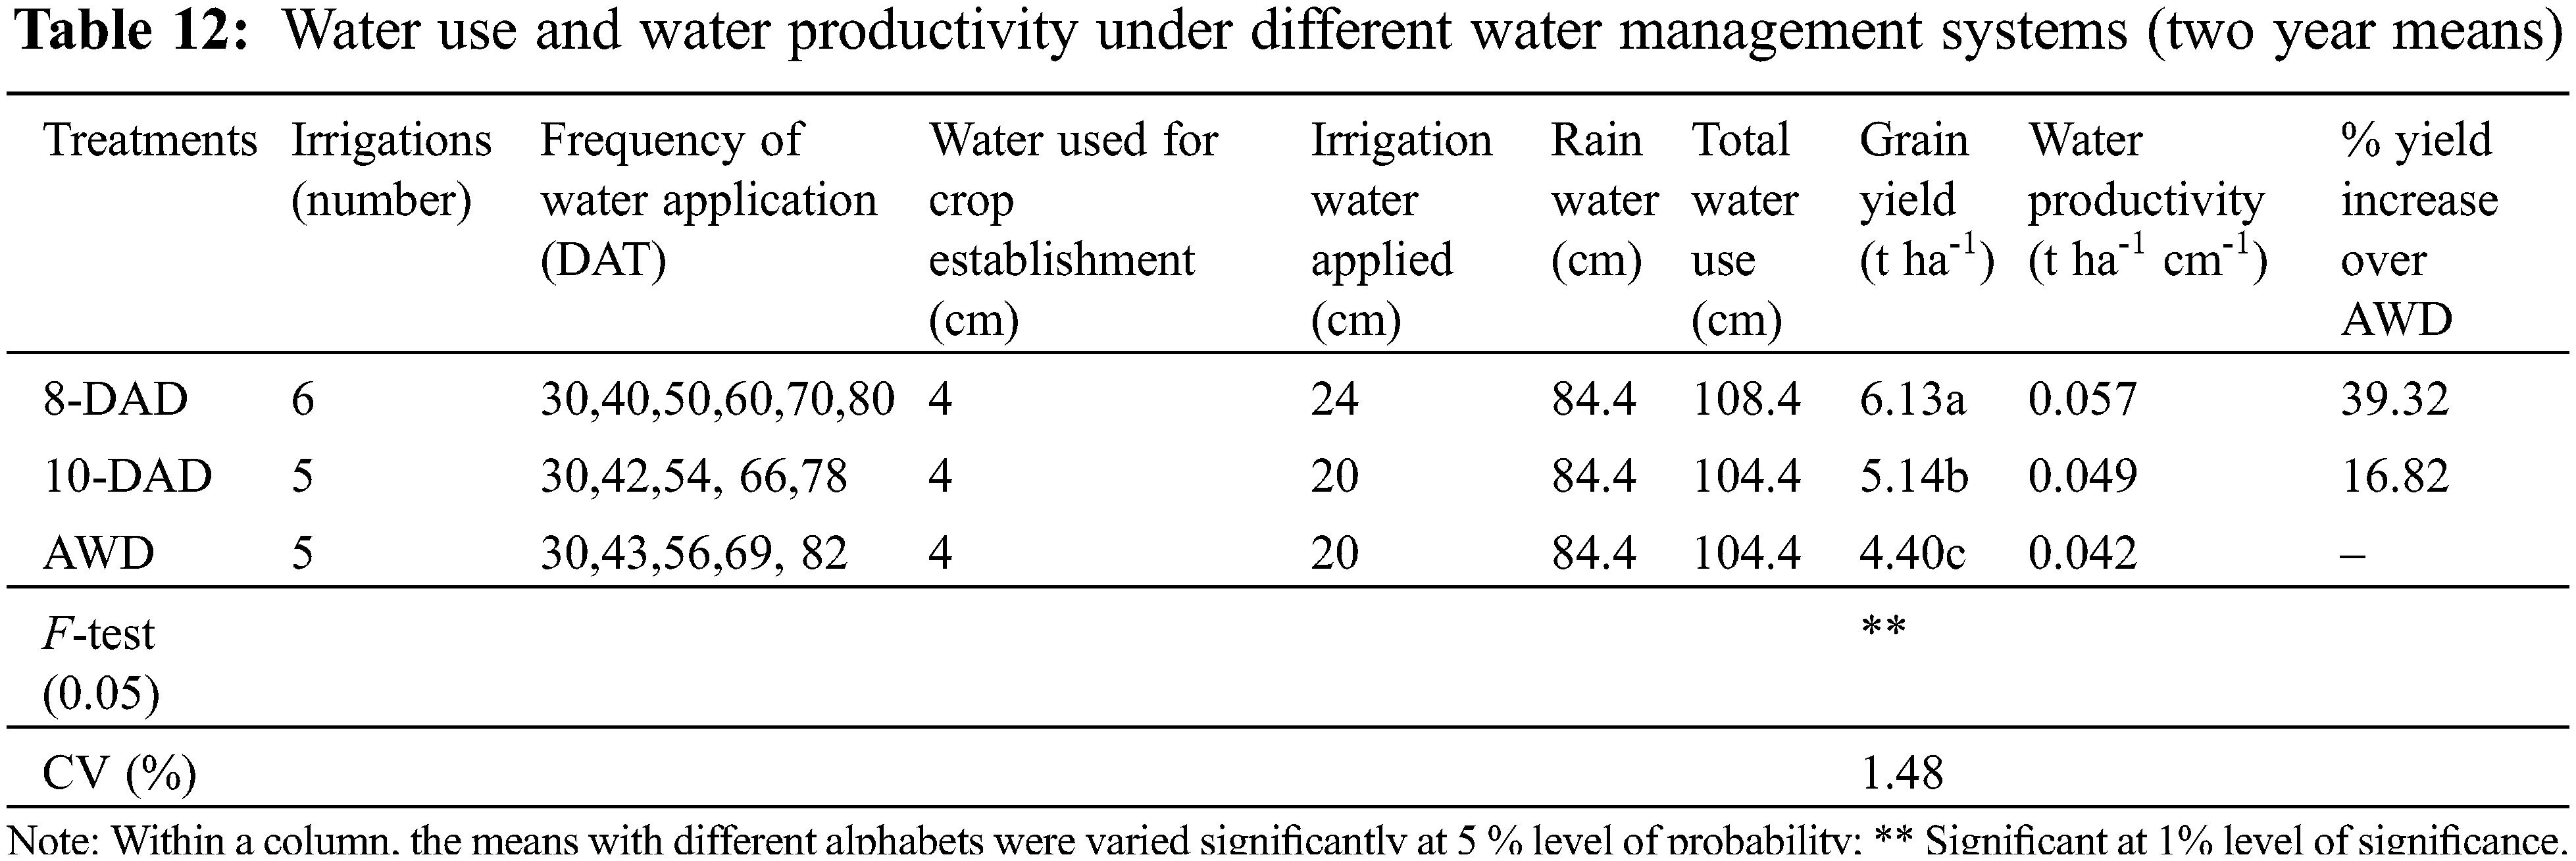
Three water management systems had distinct amount of water. Full water under 10-DAD and AWD was lesser than that of 8-DAD. The amount of water was 108.4 cm for 8-DAD and 104.4 cm for that of 10-DAD and AWD. Water productivity was the maximum (0.057 t ha-1 cm-1) in 8-DAD due to higher yield and was found to be least (0.042 t ha-1 cm-1) in AWD.
3.5 N Content (%) and Uptake (kg ha-1)
N content (%) and uptake of grain and straw were influenced by cultivar, water and nitrogen management (Table 13).
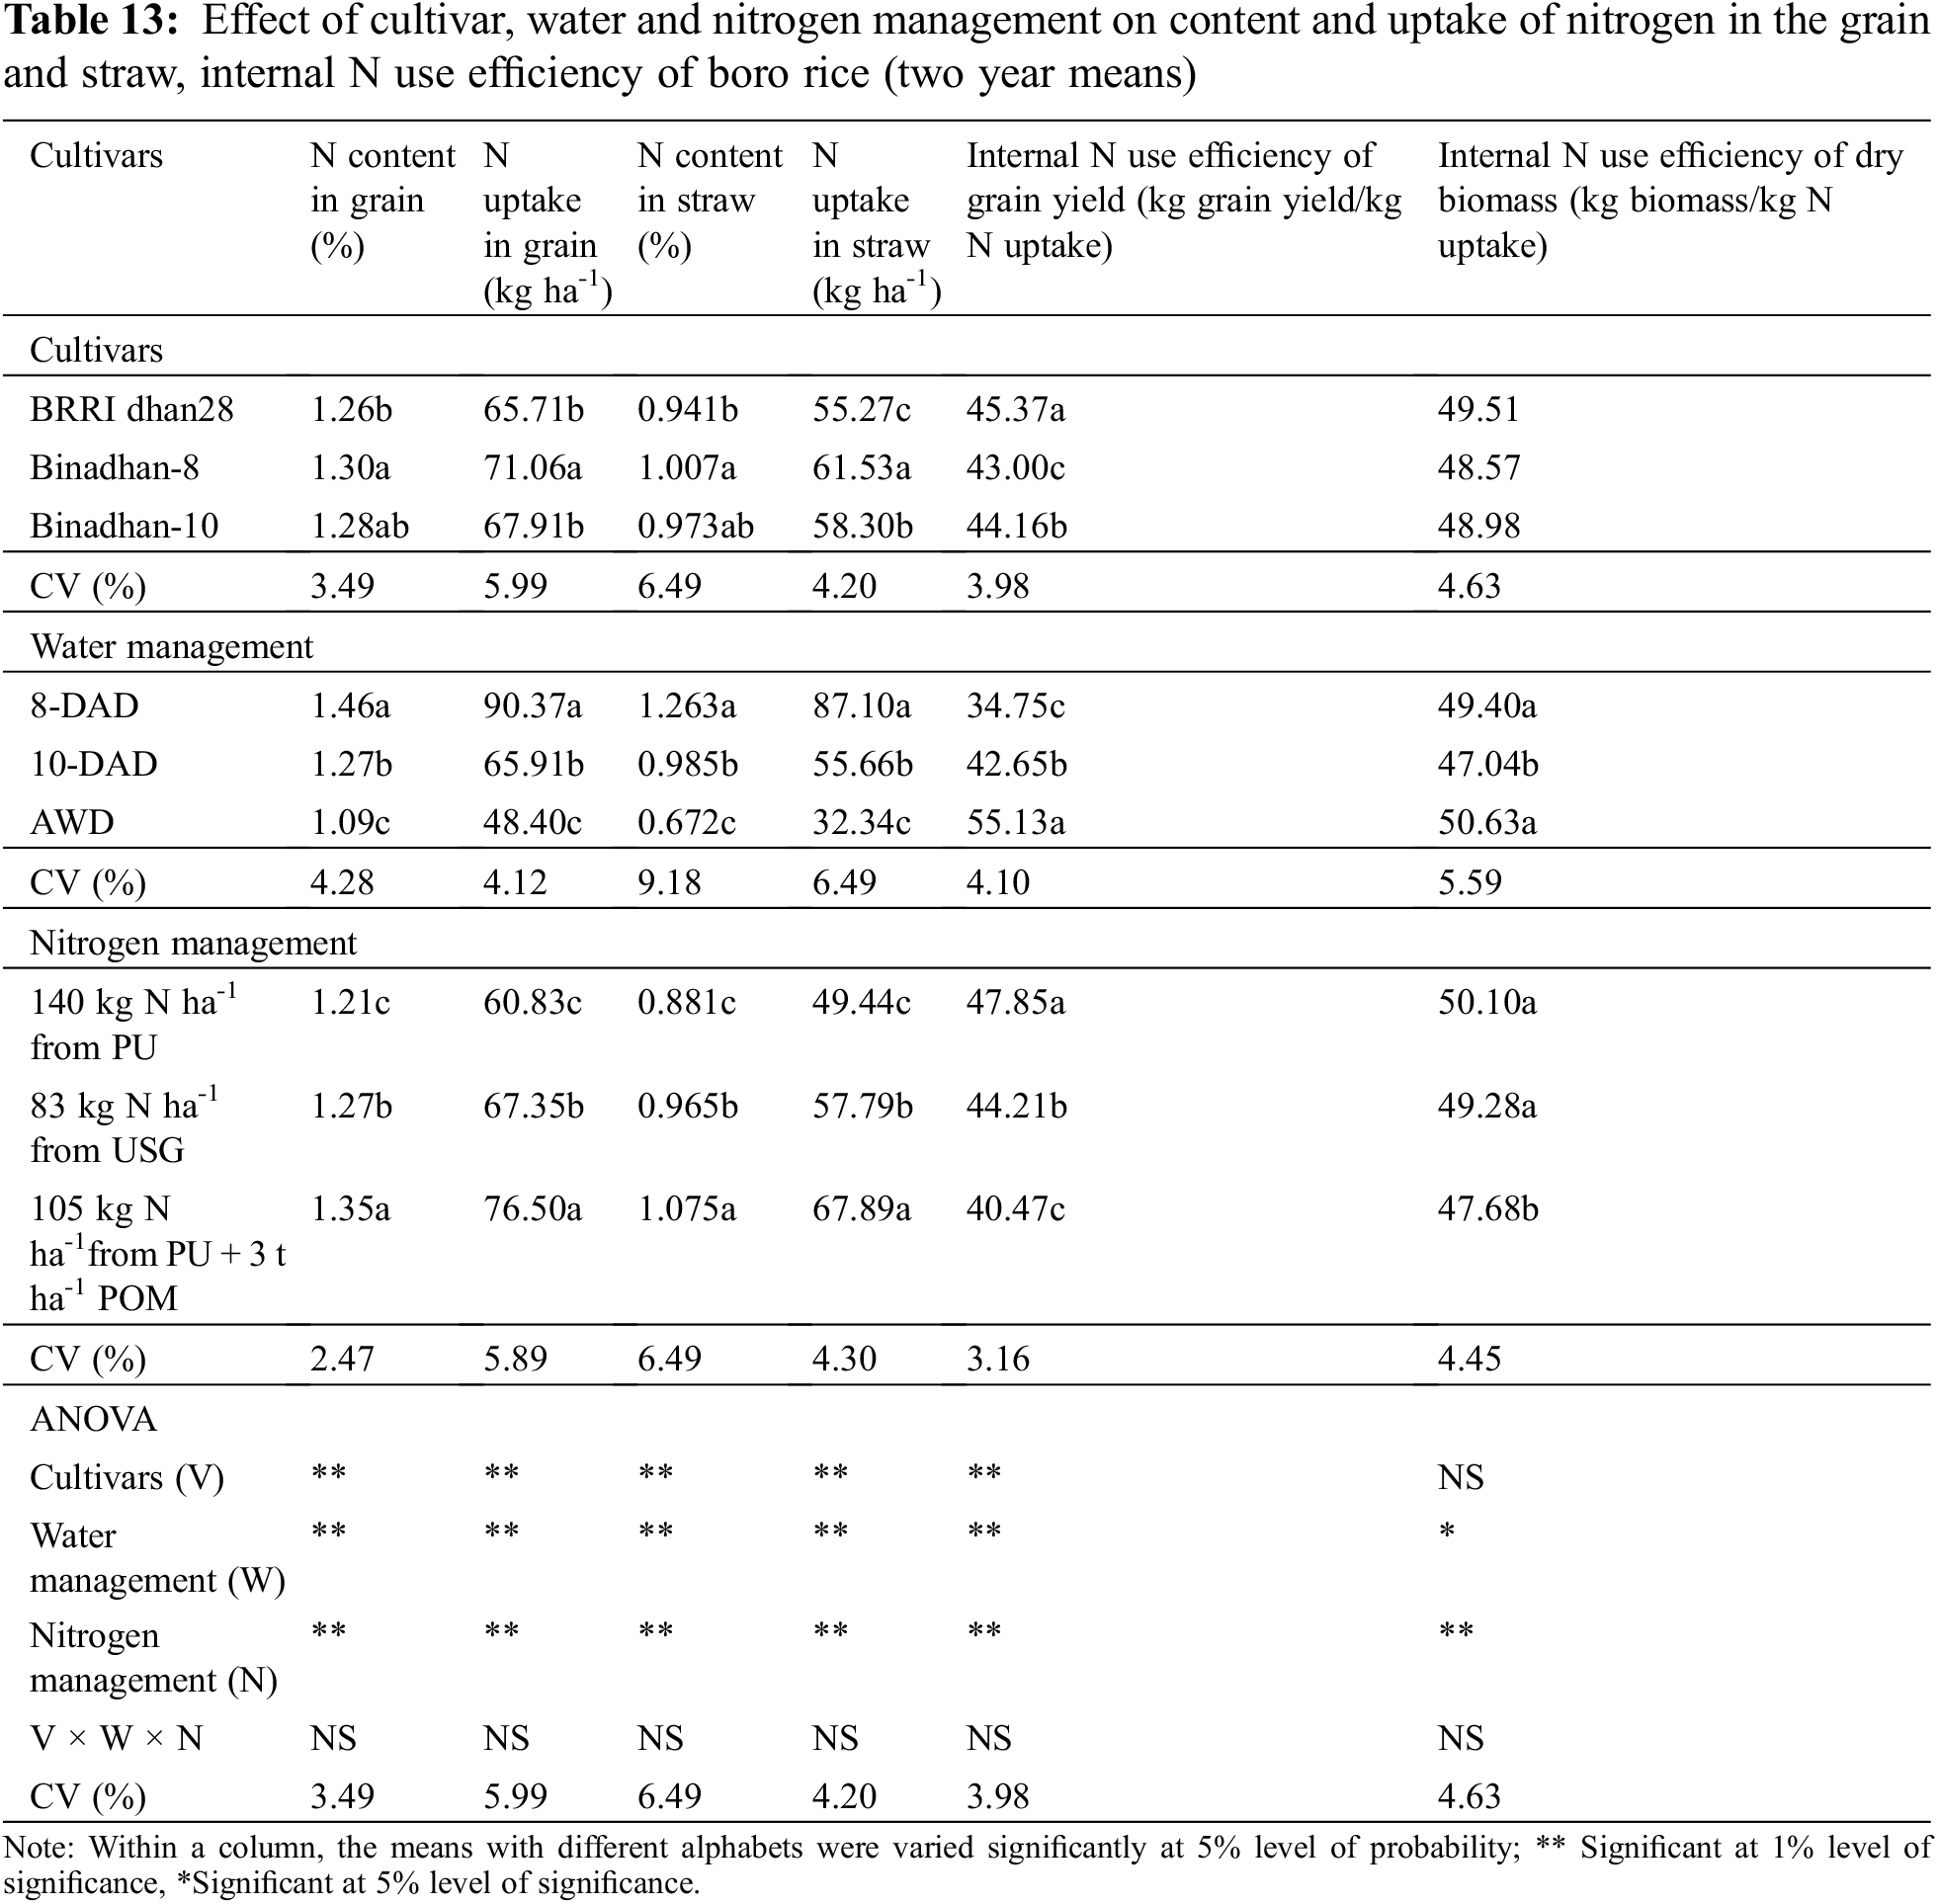
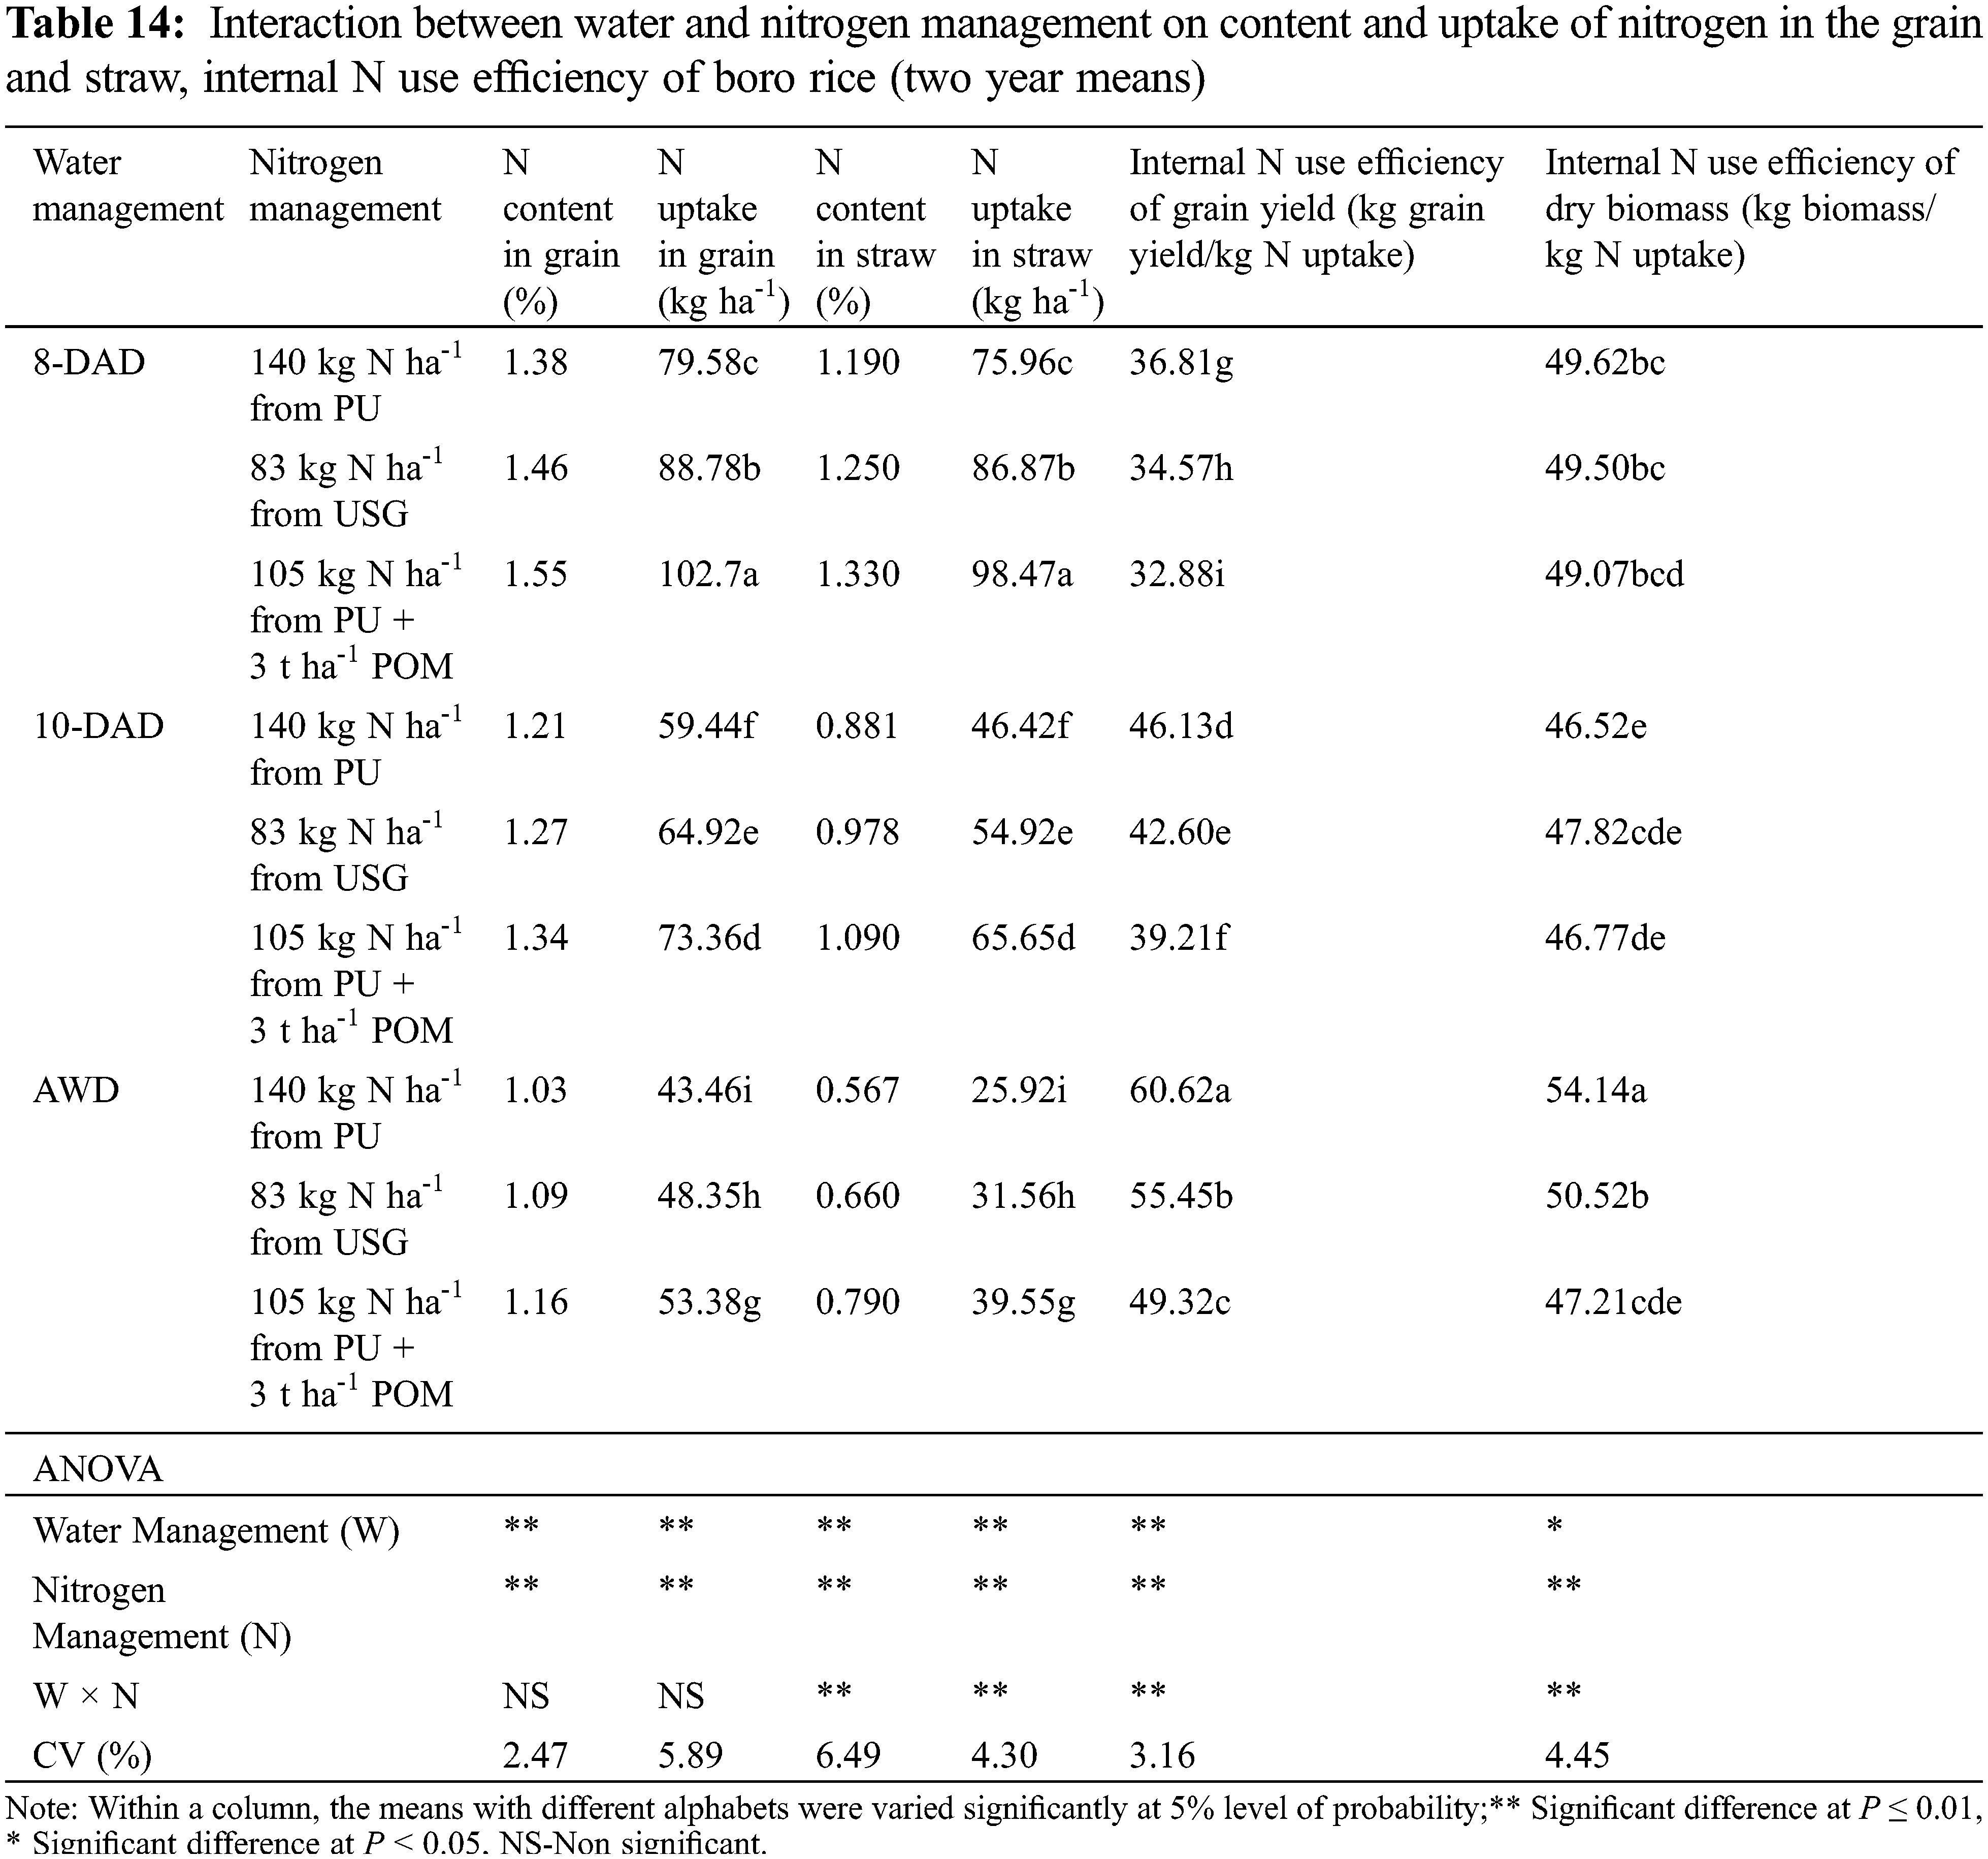
The grain N content (%) in cultivar ranged from 1.26% to 1.30%. Binadhan-8 had the highest N content (%) whereas that content was superior in 8-DAD and 105 kg N from PU + 3 t ha-1 POM. Increment of rice GY is the outcome of superior grain N content (%) and uptake. In respect of straw, N content (%) varied from 0.941% to 1.007% for cultivar, 0.672% to 1.263% for water management and 0.881% to 1.075% for nitrogen management. Irrespective of treatments, N uptake in straw varied from 32.34 to 87.10 kg ha-1. Straw N uptake was also inferior to that of grain. A well significant positive association was observed between grain N content and GY (R2 = 0.98, P < 0.01) Fig. 6a. Parallel tendency of result was also recorded for N content in straw and GY (Fig. 6b). Uptake of N in grain (R2 = 0.99, P < 0.01) and straw (R2 = 0.99, P < 0.01) had a greatly significant relationship with GY (Figs. 6c and 6d). Combined effect of water and nitrogen management was significant for all those parameters apart from N content in grain (%).
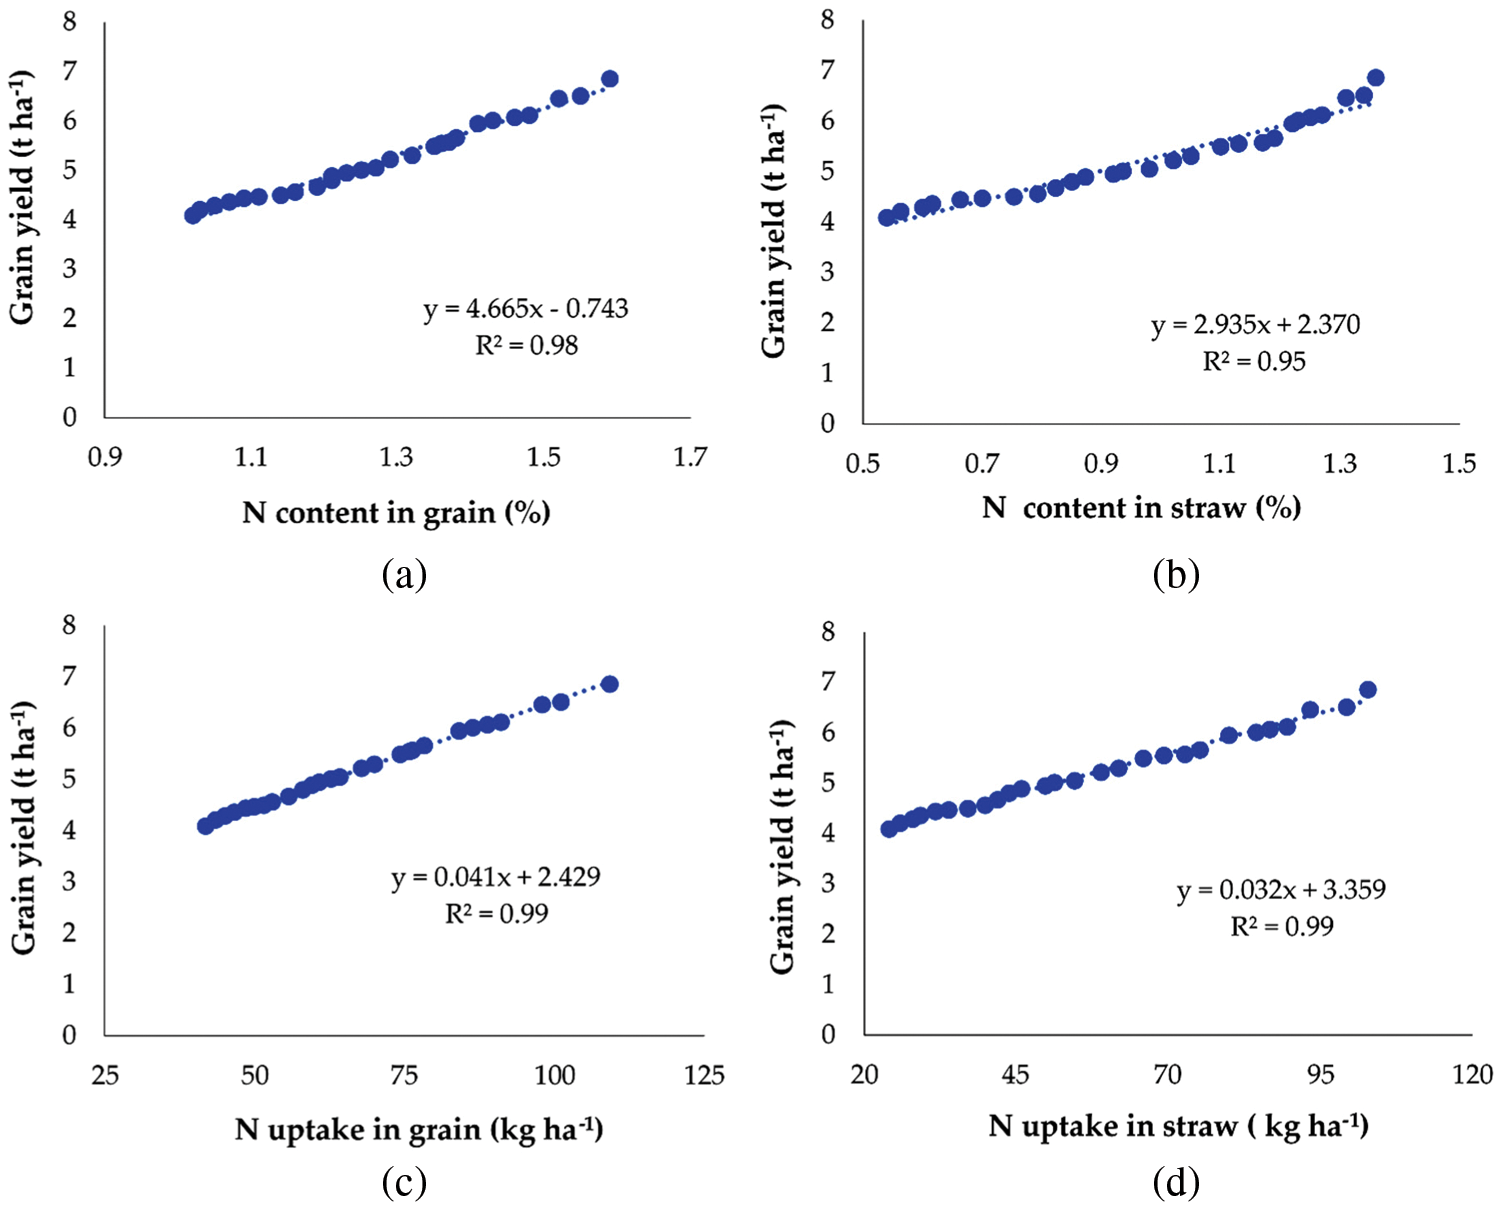
Figure 6: Relationship between GY and N content in grain (a), N content in straw (b), N uptake in grain (c) and N uptake in straw (d)
3.6 N Use Efficiencies Indicators
The analyzed data of internal N use efficiency was presented in Table 13. INUEY and INUEDM were affected by cultivar, water and nitrogen management. The INUEY varied from 34.75 to 55.13 kg grain/kg N and INUEDM from 47.04 to 50.63 kg biomass/kg N. INUEY and INUEDM were declined due to more use of water. Similarly, INUEY and INUEDM tended to decrease with application of POM with PU. Combinations of water and nitrogen management interacted significantly along with these parameters (Table 14).
Study on individual effect of cultivar, irrigation scheduling and nitrogen management on diverse interference in rice is well recognized in the literature. Studies on physiological development, yield, water productivity and NUE of exclusively high yielding cultivars in relation to different water and nitrogen management are still inadequate. In fact, the effect of water and N source on high yielding rice subsisted in production. According to association between water and nitrogen management, appropriate rate of water and source of N use aiming at improving water productivity, NUE could be increased by N utilization and amplify rice GY. In our study, cultivars varied in respect of performance under different water and nitrogen management. The dissimilarity in the performance may be connected to crop length, growth, TDM and NUE indicators variation.
In our study grain filling time influenced GY. The involvement of grain filling period to rice GY exhibited that GY of diverse cultivars was fixed by grain-filling period [24]. The rice cultivars having loner grain filling time have created higher yield. The maximum days (34) from anthesis to physiological maturity were required for Binadhan-8 which has influence in accomplishing supreme GY. Utilization of more climatic parameters like temperature and light for extended grain grow this related with extension of more grain-filling period.
Our study revealed that plant height, LAI, CGR, RGR and NAR improved distinctly in crop grown at 8-DAD and 10-DAD over those of severe AWD. Moisture insufficiency raised from severe AWD and rice plant suffered from water stress in dry season. Thus it declined maximum growth attributes at different developmental stages. It specified that rice crop desires optimal saturation rather than AWD for its optimum growth in dry season. For improving growth parameters of summer rice, use of irrigation at saturation might produce positive condition compared to AWD [25].
In our study, the growth variables of boro (irrigated) rice were greatly influenced by sources of nitrogen. Use of 105 kg N from PU + 3 t ha-1 POM distinctly increase plant height, LAI, CGR, RGR and NAR of the crop compared to 83 kg N ha-1 from USG and 140 kg N ha-1 from PU. Integrated application of inorganic and organic N is superior than solitary inorganic source (PU) on rising rice yield components and GY [26–28]. This may be due to the truth that N is simply obtainable from chemical fertilizer at the early growth stage in rice and organic fertilizers are mineralized at the later growth stages in rice. The mutual application of organic and inorganic sources of N is better than sole application of urea as N source for grain and straw yield because organic manures can trim down N loss [27] and maintain the N supply to rice plants for longer period [26,28].
Effective tillers plant-1, grains panicle-1 and TDM were higher in Binadhan-8 contrasted to Binadhan-10 and BRRI dhan28. Binadhan-8 finally created higher GY over those of Binadhan-10 and BRRI dhan28. Differential production potentiality is accountable for differences in productivity of rice cultivars [29].
The crop grown at 8-DAD treatment results in more effective tillers plant-1, grains panicle-1, TDM, 1000 grain weight that these attributes produced influential role in producing higher grain and straw yield. 8-DAD increased GY by 39.32% over AWD. Decline in tillering at AWD directed to decrease panicle fabrication, grain formation and development which ultimately reduced crop yield under dry condition.
Our study reflected significant variation on growth, yields attributes and yield due to combined application of water and N source. In the highest irrigation treatment (8-DAD), using 105 kg N from PU + 3 t ha-1 POM provided significantly higher yield. However, use of 105 kg N from PU + 3 t ha-1 POM with the lower irrigation treatments 10-DAD and AWD gave significantly lower yield. The considerable and reliable interactions between irrigation and N might be due to the little variation among the water management treatments and the low level of soil moisture stress [30]. The system in which high yielding rice showed improved yield performance and higher WUE under water-saving irrigation is not completely understood. A number of probable clarifications could be made based on previous findings. Firstly, it is assumed that a large root biomass of high yielding cultivars of rice is responsible for large aboveground biomass production [31–34]. Secondly, higher dry matter produced by high yielding rice showed mid and late growth periods. We observed that, CGR from PI to FL (flowering) and FL to PM, were significantly different under various DAD and AWD-based irrigation. It is proposed that a high dry matter production capability at the mid growth stage can generate large sink size by encouraging spikelet differentiation, declining spikelet degeneration, and escalating proliferation of endosperm cells at the early seed-development stage [35–38]. Therefore, better yield performance and higher WUE for high-yielding rice are the outcome of stronger ability of dry-matter production during the mid- and late-growth stage under various DAD and AWD-based irrigation. Combined effect between cultivar and N management was non significant for most of the parameters. This might be due to similar type of N necessities of the cultivars under studied. Finally, interaction among cultivars, water and N management was significant for GY. The higher yield was come with higher LAI, effective tillers plant-1, grains panicle-1 and higher TDM.
The levels of internal crop N use-efficiency for high-yielding irrigated rice were determined by our study. The use of N fertilizer must be optimized to maximize economic returns although farmers are struggling for higher N use-efficiency. Hence, use of 140 kg N ha-1 fertilizer produced a INUEY level of 47.85 kg grain/kg crop N uptake and INUEDM level of 50.10 kg biomass/kg crop N uptake. It was reported INUEY of 46 kg rice grain/kg crop N uptake was found [39]. In comparison, 105 kg N from PU + 3 t ha-1POM application recorded INUEY level of 40.47 kg grain/kg crop N uptake and INUEDM level of 47.68 kg biomass/kg crop N uptake. Low INUEY and INUEDM resulted from extreme N fertilizer utilization [40].
Results from the research exposed that boro rice yield differed significantly (P < 0.05) across the various N and water treatments. Physiological and yield contributing parameters were more influential for 8-DAD treatments compared to 10-DAD and AWD. The highest water productivity was also observed in 8-DAD treatment. N application through PU along with POM was found more advantageous in terms of higher yield components, yield and N use efficiency. 8-DAD treatment showed more water productivity and yield increase over AWD and it was more efficient to produce rice than the rest of the water management methods. This indicates that continuous submergence is not a requirement in rice production and farmers could apply 8-DAD treatment and PU along with poultry manure to decrease water use, enhance water and N productivity which will reduce cost of production. So, it may be accomplished that Binadhan-8 at 8-DAD with 105 kg N from PU + 3 t ha-1 POM be adapted for improving growth and productivity of boro rice under sub-tropical condition of Bangladesh.
Acknowledgement: The authors would like to thank Department of Agronomy, Bangladesh Agricultural University and Bangladesh Agricultural Research Council (BARC), Bangladesh. The authors also extend their appreciation to the Taif University Researchers Supporting Project number (TURSP-2020/85), Taif University, Taif, Saudi Arabia for funding.
Funding statement: This research was funded by Bangladesh Agricultural Research Council (BARC), Bangladesh and the Taif University Researchers Supporting Project No. (TURSP-2020/85), Taif University, Taif, Saudi Arabia.
Conflicts of Interest: The authors declare that they have no conflicts of interest to report regarding the present study.
1. Yakubu, A., Ofori, J., Amoatey, C., Kadyampakeni, D. (2019). Agronomic, water productivity and economic analysis of irrigated rice under different nitrogen and water management methods. Agricultural Sciences, 10(1), 92–109. DOI 10.4236/as.2019.101008. [Google Scholar] [CrossRef]
2. Datta, A., Ullah, H., Ferdous, Z. (2017). Water management in rice, pp. 255–277. Springer International Publishing. [Google Scholar]
3. Ethan, S., Odunze, A. C., Abu, S. T., Iwuafor, E. N. O. (2012). Field water management and N-rates to save water and control iron toxicity in lowland rice. Academic Research International, 3(2), 184–201. [Google Scholar]
4. Kima, A. S., Chung, W. G., Wang, Y. (2014). Improving irrigated lowland rice water use efficiency under saturated soil culture for adoption in tropical climate conditions. Water, 6(9), 2830–2846. DOI 10.3390/w6092830. [Google Scholar] [CrossRef]
5. Wang, Y. M., Namaona, W., Traore, S., Zhang, Z. C. (2009). Seasonal temperature-based models for evapotranspiration estimation under semi-arid conditions of Malawi. African Journal of Agricultural Research, 4(9), 878–886. [Google Scholar]
6. Samonte, S. O. P. B., Wilson, L. T., Medley, J. C., Pinson, S. R. M., McClung, A. M. et al. (2006). Nitrogen utilization efficiency: Relationships with grain yield, grain protein, and yield-related traits in rice. Agronomy Journal, 98(1), 168–176. DOI 10.2134/agronj2005.0180. [Google Scholar] [CrossRef]
7. Kamruzzaman, M., Kayum, M. A., Hasan, M. M., Hasan, M. M., Hasan, M. M. (2013). Effect of split application of nitrogen fertilizer on yield and yield attributes of transplanted aman rice (Oryza sativa L.). Bangladesh Journal of Agricultural Research, 38(4), 579–587. [Google Scholar]
8. Ata-Ul-Karim, S. T., Liu, X., Lu, Z., Yuan, Z., Zhu, Y. et al. (2016). In-season estimation of rice grain yield using critical nitrogen dilution curve. Field Crops Research, 195, 1–8. [Google Scholar]
9. Fageria, N. K., Stone, L. F., Manejo do nitrogênio (2003). Manejo da fertilidade do solo para o arroz irrigado. Santo Antônio de Goiás, Embrapa Arroz e Feijão, pp. 51–94. [Google Scholar]
10. Fageria, N. K., Santos, A. B. D., Oliveira, J. P. (2013). Nitrogen-use efficiency in lowland rice genotypes under field conditions. Communications in Soil Science and Plant Analysis, 44(17), 2497–2506. [Google Scholar]
11. Fageria, N. K., de Morais, O. P., Santos, A. B. D. (2013). Nitrogen use efficiency in upland rice genotypes. Journal of Plant Nutrition, 33(11), 1696–1711. [Google Scholar]
12. Fageria, N. K., Baligar, V. C., Jones, C. A. (2011). Growth and mineral nutrition of field crops (3rd edition). pp. 560. Boca Raton: CRC Press. [Google Scholar]
13. Fageria, N. K., Santos, A. B. D. (2014). Lowland rice genotypes evaluation for nitrogen use efficiency. Journal of Plant Nutrition, 37(9), 1410–1423. [Google Scholar]
14. Fageria, N. K., Santos, A. B. D., Cutrim, V. D. A. (2008). Dry matter and yield of lowland rice genotypes as influence by nitrogen fertilization. Journal of Plant Nutrition, 31(4), 788–795. DOI 10.1080/01904160801928471. [Google Scholar] [CrossRef]
15. Ramasamy, S. H., Berge, F. M., Purushothaman, S. (1997). Yield formation in response to drainage and nitrogen application. Field Crops Research, 51(1–2), 65–82. DOI 10.1016/S0378-4290(96)01039-8. [Google Scholar] [CrossRef]
16. Belder, P., Bouman, B. A. M., Cabangon, R., Guoan, L., Quilang, E. J. P. et al. (2004). Effect of water-saving irrigation on rice yield and water use in typical lowland conditions in Asia. Agriculture Water Management, 65(3), 193–210. DOI 10.1016/j.agwat.2003.09.002. [Google Scholar] [CrossRef]
17. Yang, X. G., Bouman, B. A. M., Wang, H. Q., Wang, Z. M., Zhao, J. F. et al. (2005). Performance of temperate aerobic rice under different water regimes in North China. Agriculture Water Management, 74(2), 107–122. DOI 10.1016/j.agwat.2004.11.008. [Google Scholar] [CrossRef]
18. Zhang, H., Xue, Y. G., Wang, Z. Q., Yang, J. C., Zhang, J. H. (2009). An alternate wetting and moderate soil drying regime improves root and shoot growth in rice. Crop Science, 49(6), 2246–2260. DOI 10.2135/cropsci2009.02.0099. [Google Scholar] [CrossRef]
19. Radford, P. J. (1967). Growth analysis formulae-their use and abuse. Crop Science, 7(3), 171–175. DOI 10.2135/cropsci1967.0011183X000700030001x. [Google Scholar] [CrossRef]
20. Hunt, R. (1978). Plant growth analysis. In: Studies in biology, vol. 41. Bedford Square, London: Edward Arnold (Publishes) Limited. [Google Scholar]
21. Michael, A. M. (1978). Irrigation theory and practice. New Delhi: Vika Publishing House. [Google Scholar]
22. Smart, R. E., Bingham, G. E. (1974). Rapid estimates of relative water content. Plant Physiology, 53(2), 258–260. DOI 10.1104/pp.53.2.258. [Google Scholar] [CrossRef]
23. Gomez, K. A., Gomez, A. A. (1984). Statistical procedure for agricultural research (2nd edition), pp. 204-207. Los Banos, Manila: International Rice Research Institute. [Google Scholar]
24. Yang, W., Peng, S., Dionisio-Sese, M. L., Laza, R. C., Visperas, R. M. (2014). Grain filling duration, a crucial determinant of genotypic variation of grain yield in field-grown tropical irrigated rice. Field Crops Research, 105(3), 221–227. DOI 10.1016/j.fcr.2007.10.006. [Google Scholar] [CrossRef]
25. Bhatnagar, P. R. (2002). Ground water utilization for irrigation. Indian Farming, 52(7), 40–44. [Google Scholar]
26. Fan, T. L., Young, W., Lue, J. J., Gao, Y. F. (2005). Long term fertilizer and water availability effect on cereal yield and soil chemical properties in North-West China. Soil Science Society of America Journal, 69(3), 842–855. DOI 10.2136/sssaj2004.0150. [Google Scholar] [CrossRef]
27. Yaduvanshi, N. P. S., Swarap, A. (2005). Effect of continuous use of sodic irrigation water with and without gypsum, farm yard maunre, pressmud and fertilizer on soil properties and yields of rice and wheat in a longterm experiment. Nutrient Cycling in Agroecosystems, 73(2–3), 111–118. DOI 10.1007/s10705-005-3361-1. [Google Scholar] [CrossRef]
28. Shah, A., Shah, S. M., Mohammad, W., Shafi, M., Nawaz, H. et al. (2010). Effect of integrated use of organic and inorganic N sources on wheat yield. Sarhad Journal of Agriculture, 26(4), 559–563. [Google Scholar]
29. Thakur, A. C., Borah, R., Bhagwati, P. C. (2002). Performance of summer rice varieties under different dates of transplanting in rice (winter)-rice (summer) system. Journal of Agriculture and Science Society in Northeast India, 15, 79–81. [Google Scholar]
30. Cabangon, R. J., Tuong, T. P., Castillo, E. G., Bao, L. X., Lu, G. A. et al. (2004). Effect of irrigation method and N-fertilizer management on rice yield, water productivity and nutrient-use efficiencies in typical lowland rice conditions in China. Paddy Water Environment, 2(4), 195– 206. DOI 10.1007/s10333-004-0062-3. [Google Scholar] [CrossRef]
31. Garnett, T., Conn, V., Kaiser, B. N. (2009). Root based approaches to improving nitrogen use efficiency in plants. Plant Cell and Environment, 32(9), 1272–1283. DOI 10.1111/j.1365-3040.2009.02011.x. [Google Scholar] [CrossRef]
32. Yang, J. C., Zhang, H., Zhang, J. H. (2012). Root morphology and physiology in relation to the yield formation of rice. Journal of Integrative Agriculture, 11(6), 920–926. DOI 10.1016/S2095-3119(12)60082-3. [Google Scholar] [CrossRef]
33. Ju, C. X., Buresh, R. J., Wang, Z. Q., Zhang, H., Liu, L. J. et al. (2015). Root and shoot traits for rice varieties with higher grain yield and higher nitrogen use efficiency at lower nitrogen rates application. Field Crops Research, 175, 47–59. DOI 10.1016/j.fcr.2015.02.007. [Google Scholar] [CrossRef]
34. Chu, G., Wang, Z. Q., Zhang, H., Yang, J. C., Zhang, J. H. (2016). Agronomic and physiological performance of rice under integrative crop management. Agronomy Journal, 108(1), 117–128. DOI 10.2134/agronj15.0310. [Google Scholar] [CrossRef]
35. Horie, T., Shiraiwa, T., Homma, K., Katsura, K., Maeda, Y. et al. (2005). Can yields of lowland rice resume the increases that showed in the 1980s? Plant Production Science, 8(3), 259–274. DOI 10.1626/pps.8.259. [Google Scholar] [CrossRef]
36. Fageria, N. K. (2007). Yield physiology of rice. Journal of Plant Nutrition, 30(6), 843–879. DOI 10.1080/15226510701374831. [Google Scholar] [CrossRef]
37. Fu, J., Huang, Z. H., Wang, Z. Q., Yang, J. C., Zhang, J. H. (2011). Pre anthesis non-structural carbohydrate reserve in the stem enhances the sink strength of inferior spikelets during grain filling of rice. Field Crops Research, 123(2), 170–182. DOI 10.1016/j.fcr.2011.05.015. [Google Scholar] [CrossRef]
38. Zhang, Z. J., Chu, G., Liu, L. J., Wang, Z. Q., Wang, X. M. et al. (2013). Mid-season nitrogen application strategies for rice varieties differing in panicle size. Field Crops Research, 150, 9–18. DOI 10.1016/j.fcr.2013.06.002. [Google Scholar] [CrossRef]
39. Naklang, K., Harnpichitvitaya, D., Amarante, S. T., Wade, L. J., Haefele, S. M. (2006). Internal efficiency, nutrient uptake, and the relation to field water resources in rainfed lowland rice of northeast Thailand. Plant and Soil, 286(1–2), 193–208. DOI 10.1007/s11104-006-9037-z. [Google Scholar] [CrossRef]
40. Snyder, C. S., Bruulsema, T. W., Jensen, T. L. (2007). Greenhouse gas emissions from cropping systems and the influence of fertilizer management–A literature review. Norcross, Georgia, USA: International Plant Nutrition Institute. [Google Scholar]
 | This work is licensed under a Creative Commons Attribution 4.0 International License, which permits unrestricted use, distribution, and reproduction in any medium, provided the original work is properly cited. |