| Phyton-International Journal of Experimental Botany |
DOI: 10.32604/phyton.2022.020518
ARTICLE
G × E Analysis of Growth Traits of Betula platyphylla Clones at Three Separated Sites in Northeastern China
1College of Forestry and Grassland, Jilin Agricultural University, Changchun, 130118, China
2State Key Laboratory of Tree Genetics and Breeding, Northeast Forestry University, Harbin, 150040, China
*Corresponding Authors: Chunli Zhao. Email: zcl8368@163.com; Xiyang Zhao. Email: zhaoxyphd@163.com
Received: 28 November 2021; Accepted: 10 January 2022
Abstract: To select elite materials, the growth traits of 32 Betula platyphylla clones at three separated northern sites in Northeast China were investigated and analyzed. The results showed that there were significant differences among all variation sources in the different investigated traits (P < 0.01). Except for the carbon contents, all the coefficients of phenotypic variation of the other investigated traits were higher than 10%. The repeatability of different traits ranged from 0.760 to 0.998. Correlation analysis showed that tree height were significantly correlated with diameter at breast height, but neither was significantly correlated with leaf traits nor element contents. Additive main effects and multiplicative interaction analysis showed that genotype, environment and genotype × environment interactions were significantly different in diameter at breast height, which indicated that environment had a significant effect on genotype. Comprehensive assessment results showed that three clones with high and stable diameters at breast height were selected, and the genetic gains of diameter at breast height on sites Maoershan, Qingan, and Yongji were 21.24%, 20.58%, and 38.65%, respectively. The results could provide a theoretical basis for elite clone selection in B. platyphylla and other broad leaved species.
Keywords: Betula platyphylla; growth traits; genetic; variation; AMMI; stability
Betula platyphylla is an important broad-leaved timber species which is widely distributes in northern and southwestern mountain forest regions in China [1]. Due to its quick growth rate, strong adaptability, and high quality of wood traits, B. platyphylla is widely used in furniture, building materials, paper and other applications [2] with high ecological and economic value. Research on B. platyphylla has mainly been conducted on the evaluation and selection of growth traits [3], cross breeding [4], molecular breeding [5], etc. [6]. Due to the difficulty of vegetative propagation by cutting or other asexual methods, elite families estimated and selected were the most important methods in the breeding of B. platyphylla [7]. Tissue culture has provided a method for the propagation of B. platyphylla, and many clonal contrast test forests have been constructed in recent years [8]. However, little research has been conducted on the evaluation and selection of birch clones, which is of great significance to the genetic improvement of B. platyphylla.
Growth traits are quantitative characteristics in trees and have complex expression patterns during different growth phases, especially in various environments [9]. Separate genotypes may perform differently in the same environment, and the same genotype may express discrepancies in various environments [10]. The existence of G × E interactions make it impossible to interpret the main effects of genotype and environment and to predict the performance of genotypes in changing environments [11]. It is essential to evaluate the importance of this interaction in developing breeding programs so that appropriate decisions can be made about testing and selection strategies [12]. Currently, there are a large number of statistical tools available to decompose and interpret the G × E interaction by using either uniparametric or multiparametric approaches [11]. In general, the environment can act clonally in three distinct ways: (1) the G × E interaction is not significant; (2) the G × E interaction is significant due to changes in differences among genotypes but not changes in genotype ranking; (3) the G × E interaction is significant due to changes in genotype ranking from one environment to another [13]. Only the last case will cause problems for the breeder because a growth vigor selected genotype will not necessarily be vigorous if grown in a separate environment. The additive main effects and multiplicative interaction model for estimating stability and adaptability based on the genotype, environment and their interactions were more efficient than other stratification methods [14].
In this study, 32 B. platyphylla clones at three separate sites were used as materials. Several growth traits and element contents of leaves of different clones were investigated to quantify genetic variations among different clones at separate sites, and the selection of superior clones was performed to provide materials for promotion and application in Northeastern China.
2.1 Experiment Sites and Materials
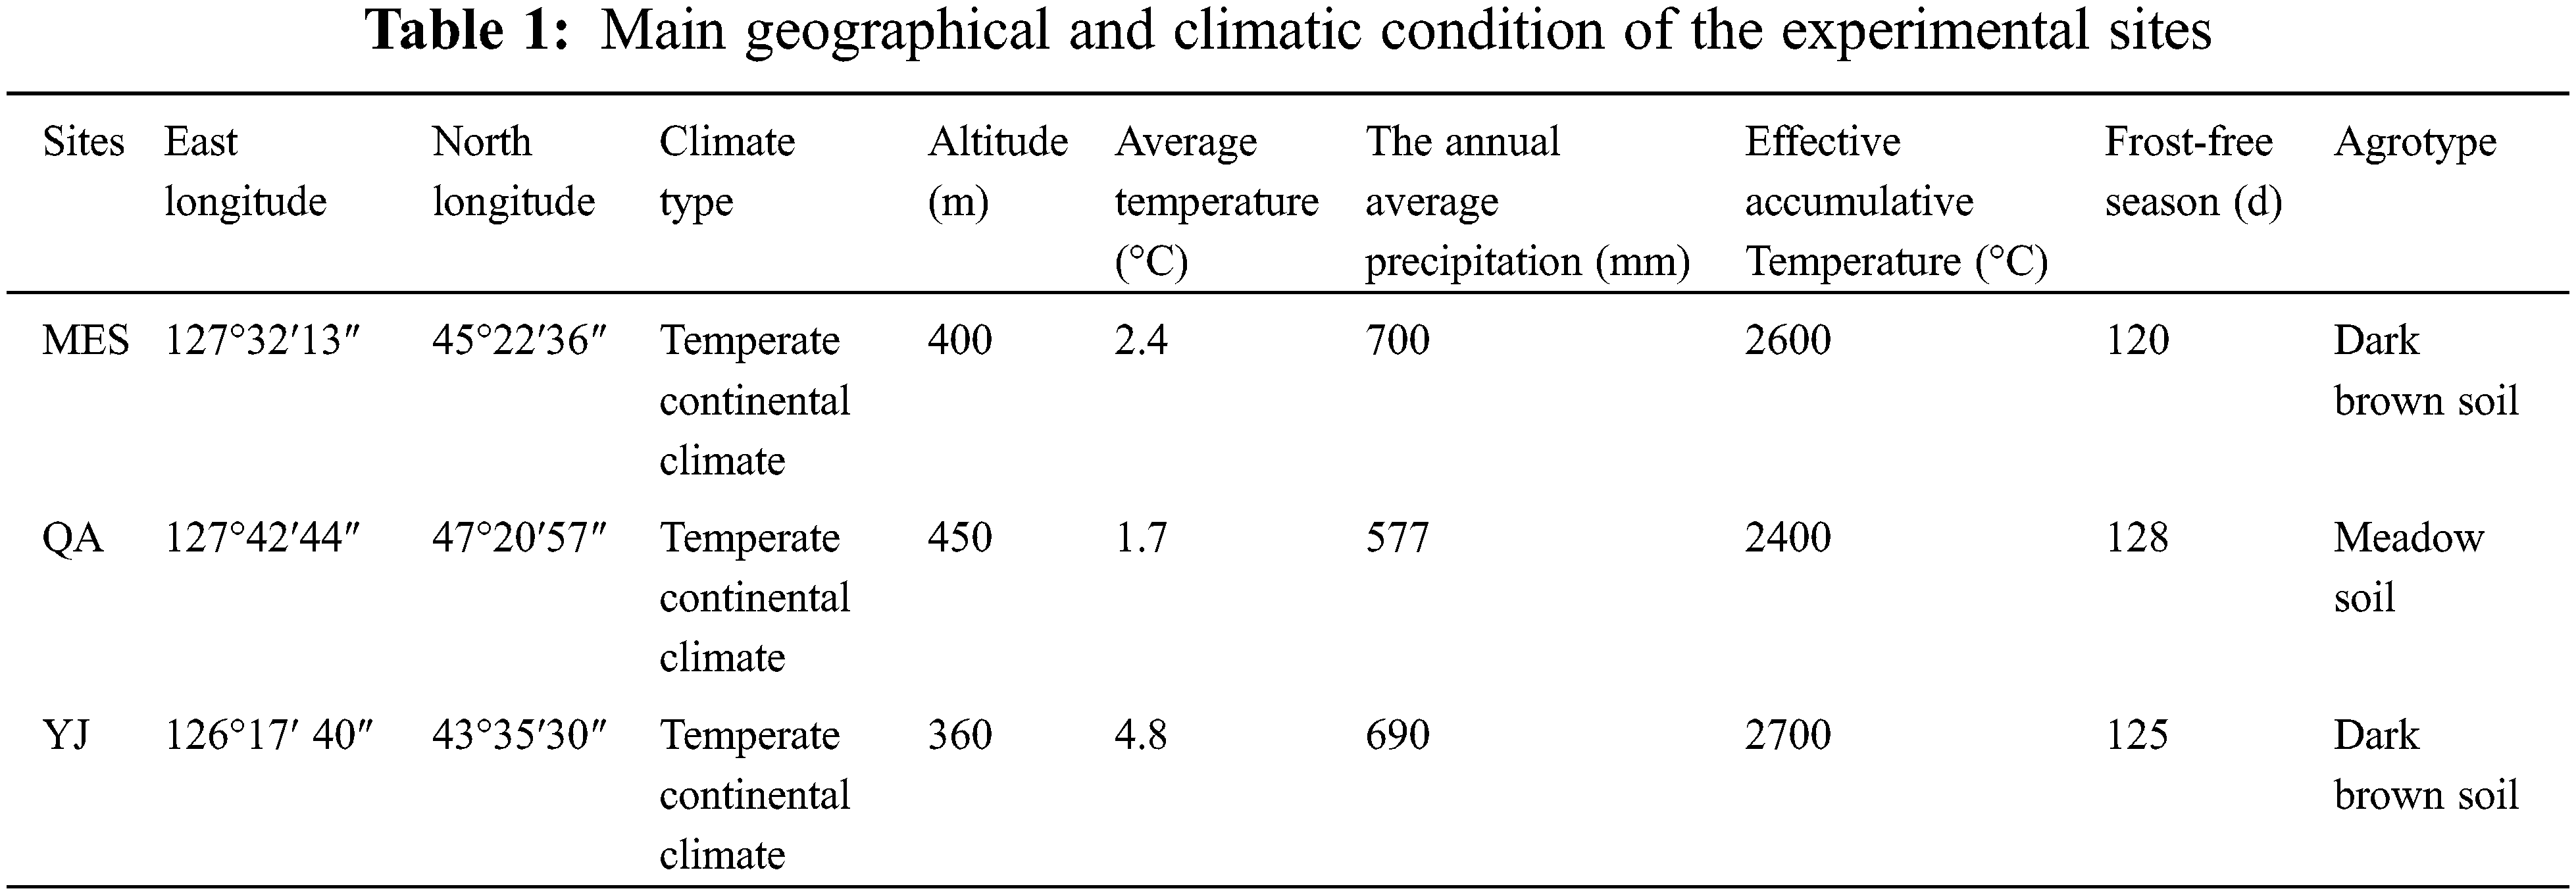
The experiments were conducted at three different sites in Northeast China: Maoershan (MES) and Qing’an (QA) in Heilongjiang Province and Yongji (YJ) in Jilin Province. The geographical and climatic conditions of the separate sites are shown in Table 1. The tree height and diameter at breast height of thirty-two open-pollinated elite trees of half-sib families (BP1, BP2, BP3, BP4, BP5, BP7, BP8, BP9, BP10, BP11, BP12, BP13, BP14, BP15, BP16, BP17, BP18, BP19, BP20, BP21, BP22, BP24, BP25, BP27, BP29, BP30, BP31, BP32, BP33, BP34, BP35, BP37) of B. platyphylla in an intensitive seed orchard of birch at Northeast Forestry University were measured by using tower ruler (WK-E3205, vico, China) and vernier caliper (PD-151, Pro skit, China). B. platyphylla were selected based on growth traits (tree height and diameter at breast height). Tissue culture was used for propagation, and one-year-old plants were used to establish the clonal comparative test forest at three different sites in the spring of 2015. A completely random block design was used with 3 blocks and 4 replicates in each plot. Each plot had 32 clones planted in rows with single tree at 2.0 × 2.0 m spacing.
2.2 Growth Traits Investigated
Eight individual trees (two trees in each block) were selected for each clone at each site in July 2019. Twenty healthy and mature leaves free of pests and diseases were randomly selected at the periphery of each individual tree crown and brought back to the laboratory in an incubator filled with ice bags. Ten leaves were measured for growth traits, and the other leaves were investigated for element content. Leaf length (LL) and leaf width (LW) were measured by a stainless steel ruler, and leaf area was investigated by a leaf area meter (LI-3000C). Specific leaf weights (SLWs) were calculated based on the leaf dry weight by the leaf area. Leaf element contents (C, N, P and K) were measured according to the method of Yin et al. [15]. Tree height (H) and diameter at breast height (DBH) of all common trees (no diseases, insect pests or wind breaks) were measured by box staff and diameter tape at different sites in October 2019, respectiely.
2.3 Statistical Analysis Methods
Statistical analysis was conducted using SPSS version 19.0 software (IBM Corp., Armonk, NY, USA). The significance of fixed effects was tested by analysis of variance (ANOVA) F test. The block effect should be considered for tree height and diameter at breast height. The linear model for joint analysis of the three sites was as follows [16]:
where yijkl is the performance of individual l of clone k growing in block j of site i, μ is the overall mean, Si is the effect of site i (i = 1, …, 3), Bj(i) is the effect of block j within site i (j = 1, …, 4), Ck is the effect of clone k (k = 1, …, 32), CSik is the interactive effect of clone k and site i, BCj(i)k is the interactive effect of clone k and block j (within site i) and εijkl is the random error.
For leaf characteristics and element contents, block effects were not considered. The linear model was as follows [17]:
where μ is the overall mean, Ci is the clonal effect, Sj is the site effect, SCij is the interaction effect between clone i and site j, and eijk is the environmental error.
The coefficient of phenotypic variation (PCV) was calculated using the formula [18]:
where S is the standard deviation of the phenotype,
The individual repeatability (R) was calculated as follows [19]:
where
The phenotypic corelation rA(xy) of traits x and y in the same site was calculated according to Wang et al. [20]:
where rA(xy) is the covariance between traits,
An additive main effects and multiplicative interaction (AMMI) model of diameter at breast height (DBH) was calculated following Zobel et al. [21] as follows:
where μ is the grand mean, αi is the clone mean deviation with i = 1, …, 32, βj is the site effect with j = 1, …, 3, λk is the singular value for Axis k with k = 1, …, n, ψik is the clone eigenvector value for Axis k, δjk is the site eigenvector for Axis k, ρij is the residual, εijr is the error with r = 1, …, 4 replications, εijr = Yijr minus the mean μij, and εijr is distributed normally with mean zero and standard deviation σ.
Genetic gain estimation is based on the following formula [22]:
where W is the difference in selection, R is the repetition force of a trait, and
3.1 Variance and Genetic Variation Parameters of All Trees at Different Sites
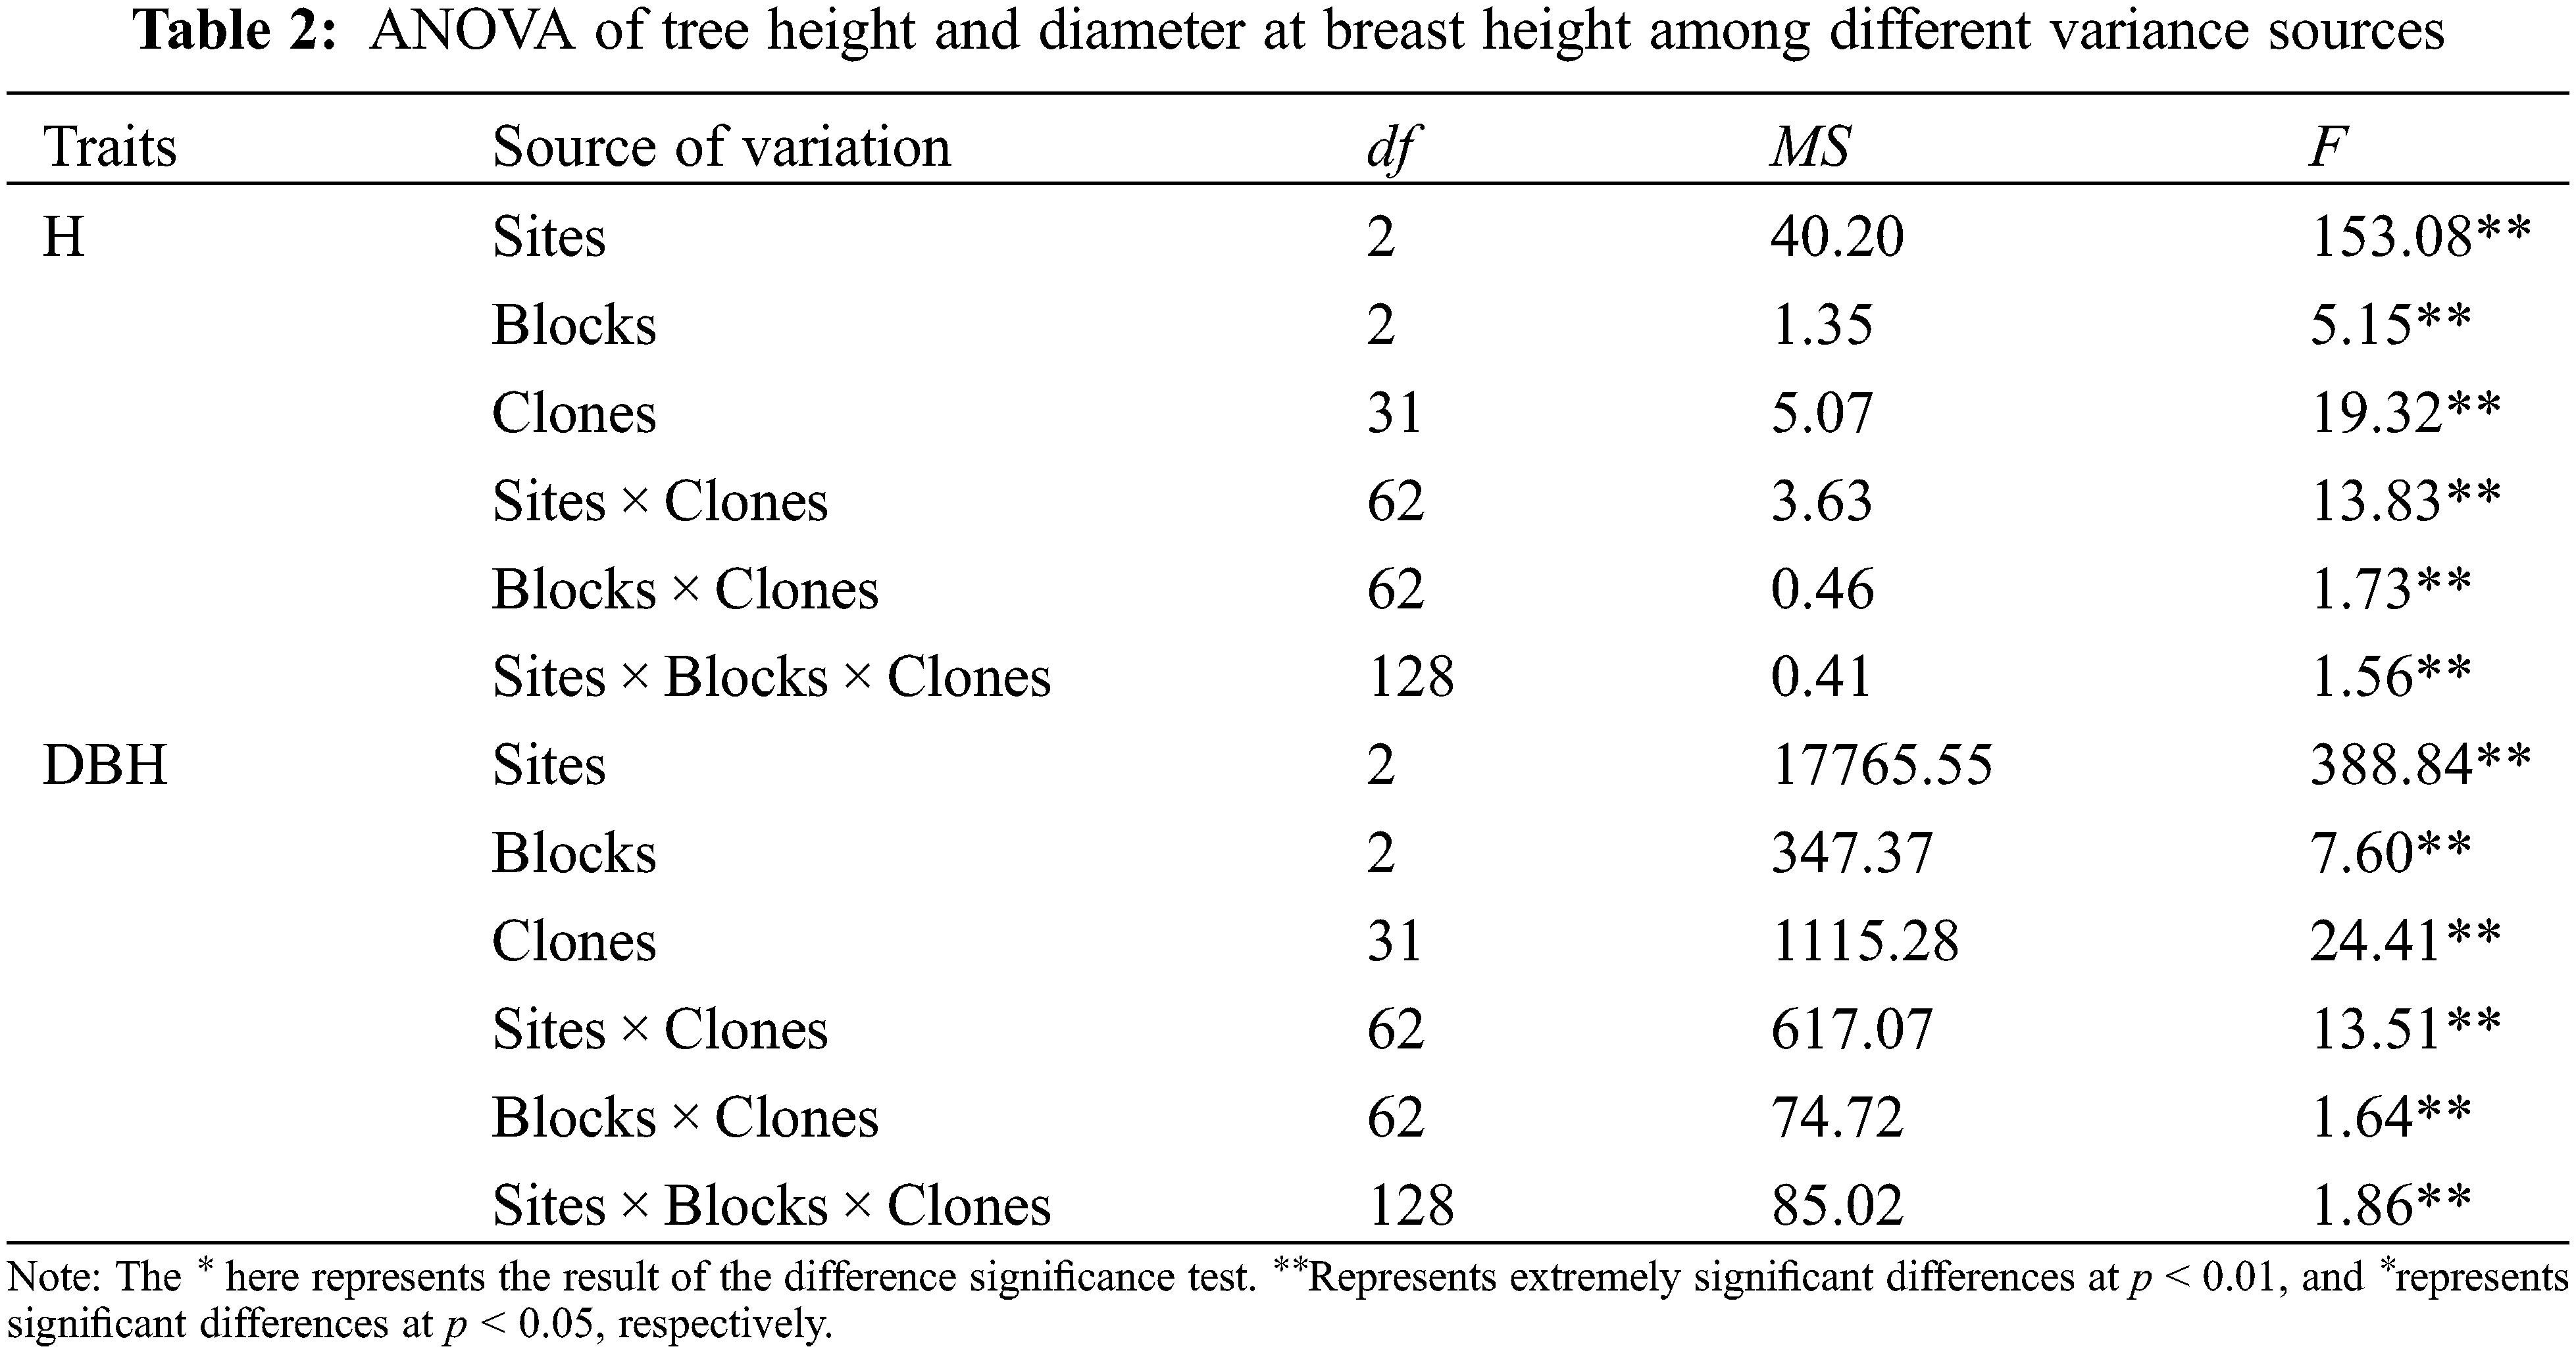
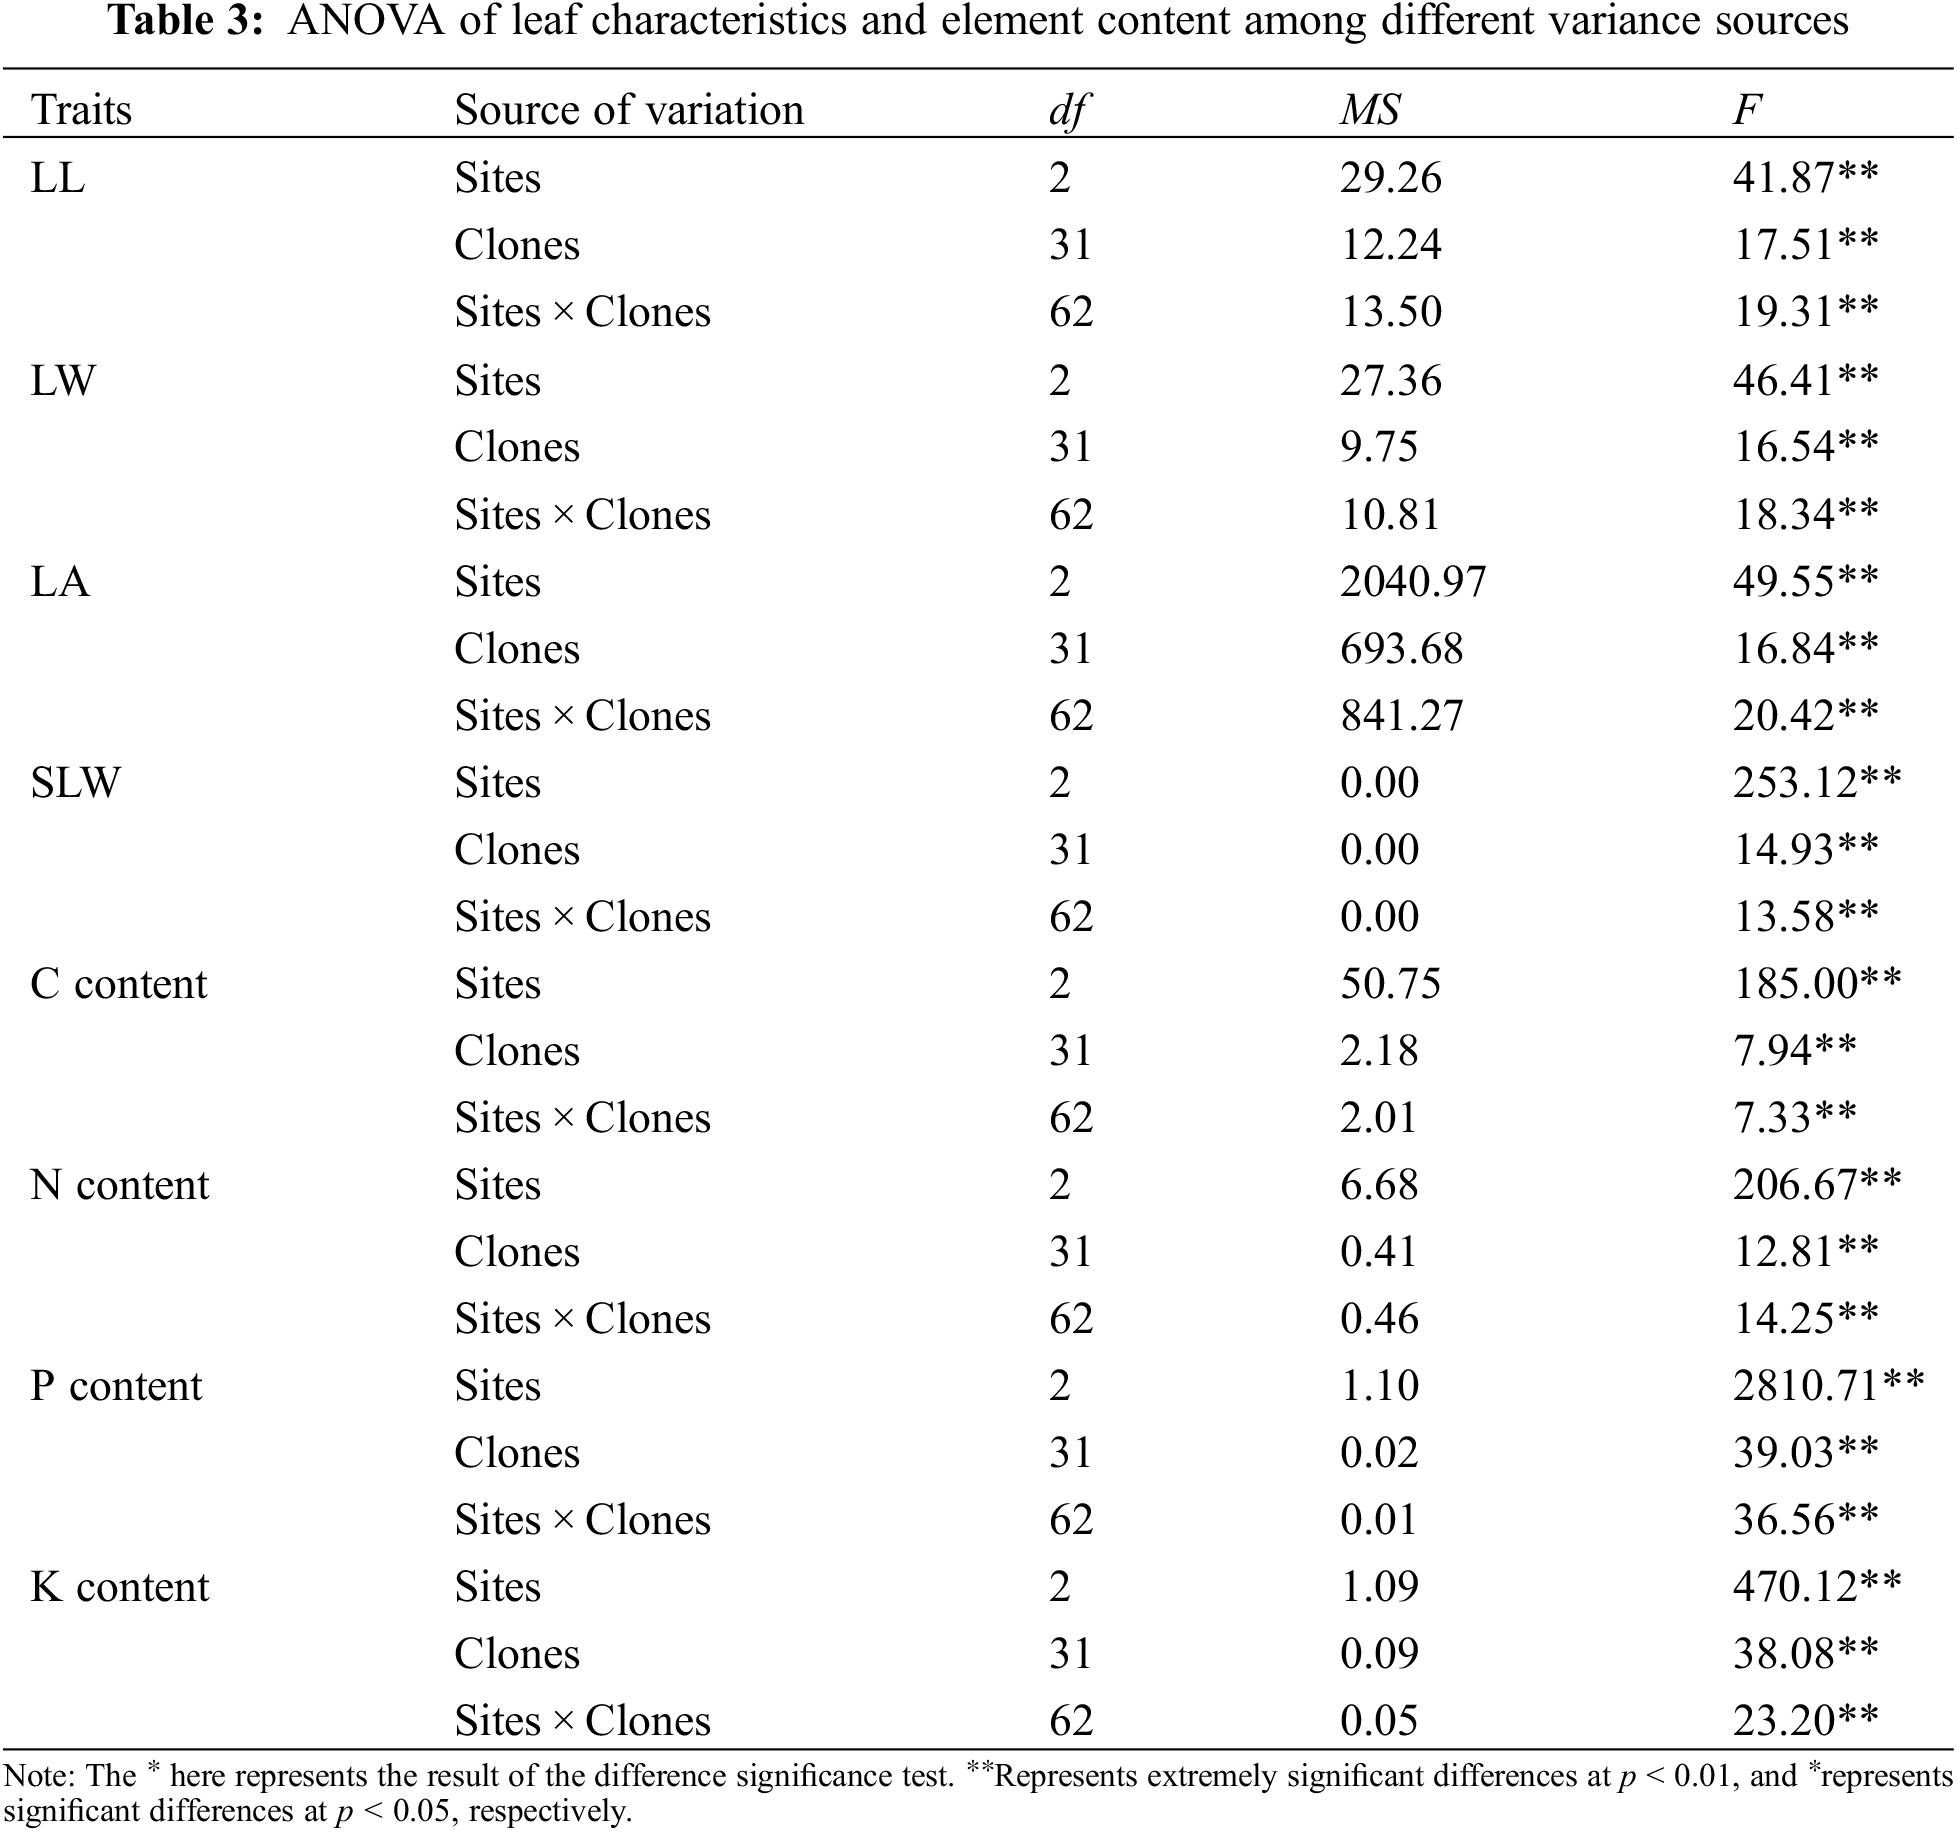
ANOVA results of the investigated traits of B. platyphylla clones are shown in Tables 2 and 3. All the traits showed significant differences among distinct variance sources based on the F test (P < 0.01).
The average values of all the investigated traits at separate sites are shown in Table 4. The average H, DBH, LL, LW, LA and SLW of B. platyphylla clones at the different sites ranged from 3.68 to 4.33 m, 28.50 to 41.58 mm, 7.07 to 7.56 cm, 5.58 to 6.06 cm, 24.54 to 28.66 cm2 and 0.029 to 0.035 g cm−2, respectively. B. platyphylla clones in MES showed higher average H and DBH values but lower average LA and SLW values than QA and YJ. For leaf element content, MES showed slightly higher average C content but remarkably higher average N content than sites QA and YJ, relatively, QA showed higher average P and K content than sites MES and YJ.
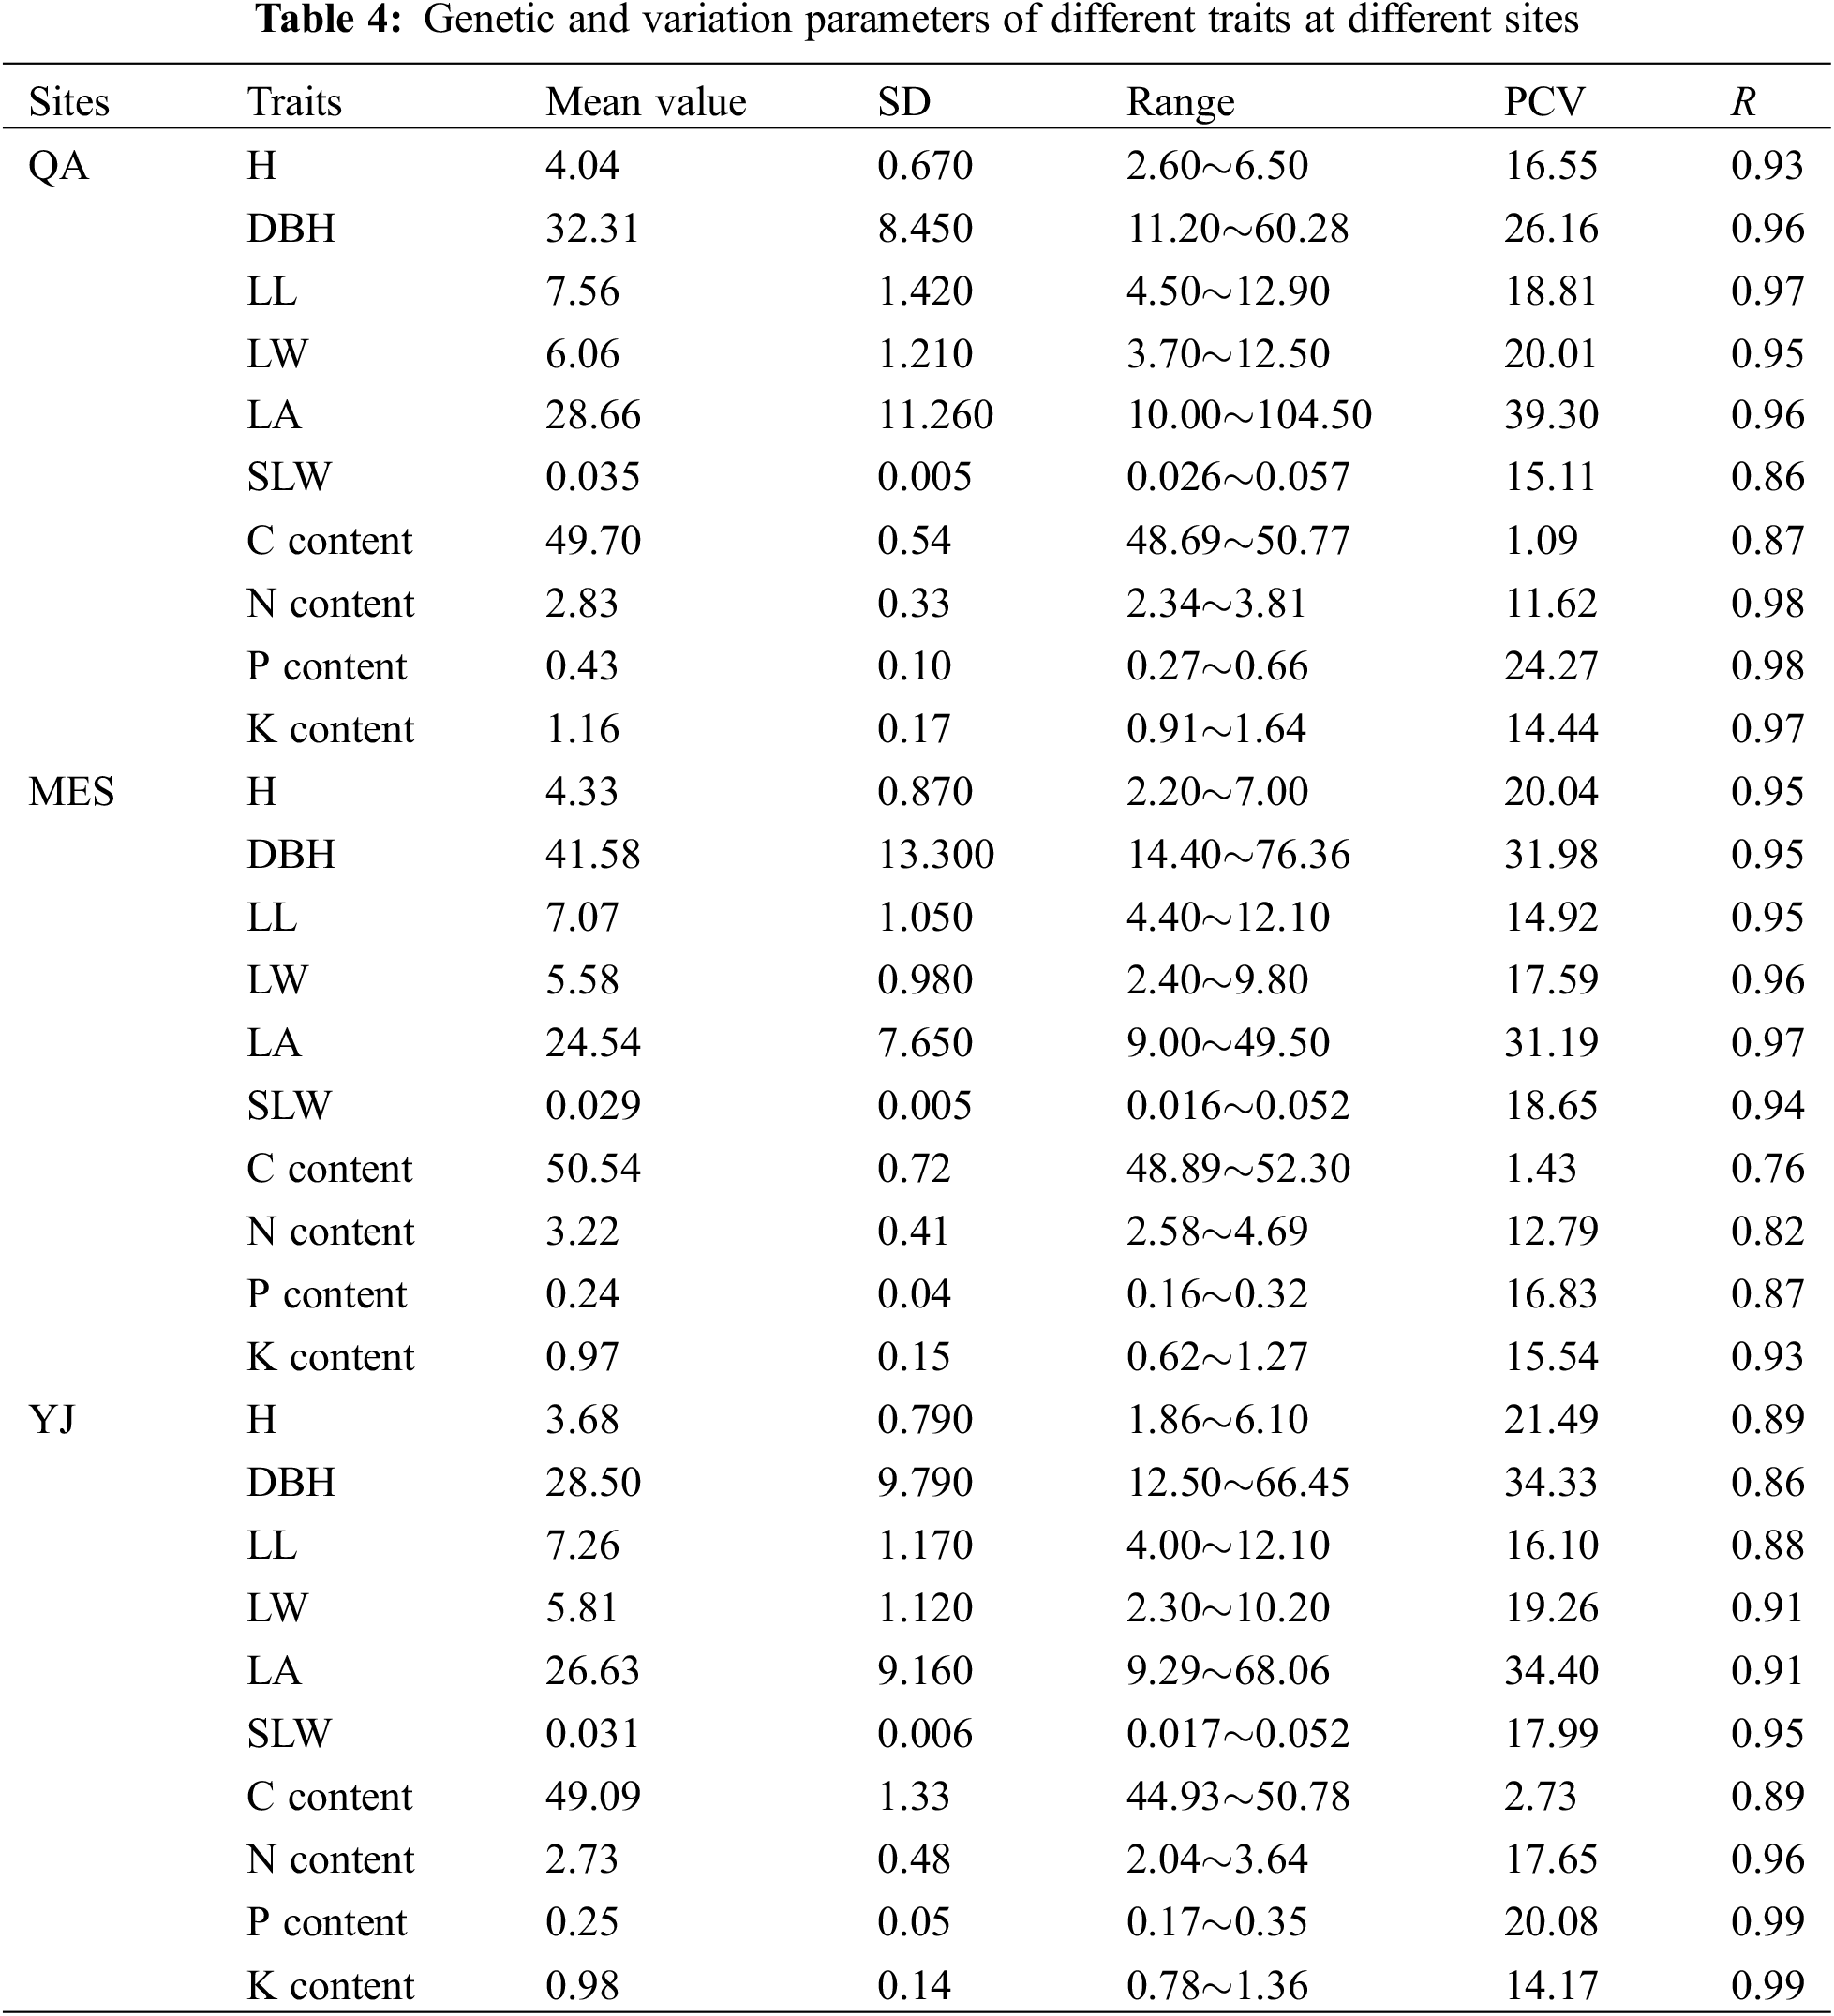
The genetic variation parameters of all traits are also shown in Table 4. Except for the PCV values of trait C content, the PCV values of other traits were higher than 10%, ranging from 11.26% (N content in QA) to 39.30% (LA in QA). Trait LA and DBH showed higher PCV values than other traits, with values higher than 25%. The PCVs of the C content showed the lowest values, which ranged from 1.09% to 2.73% at the separate sites. The repeatability of different traits all showed higher values, which were higher than 0.76.
3.2 Correlation Analysis of Different Traits at the Same Site
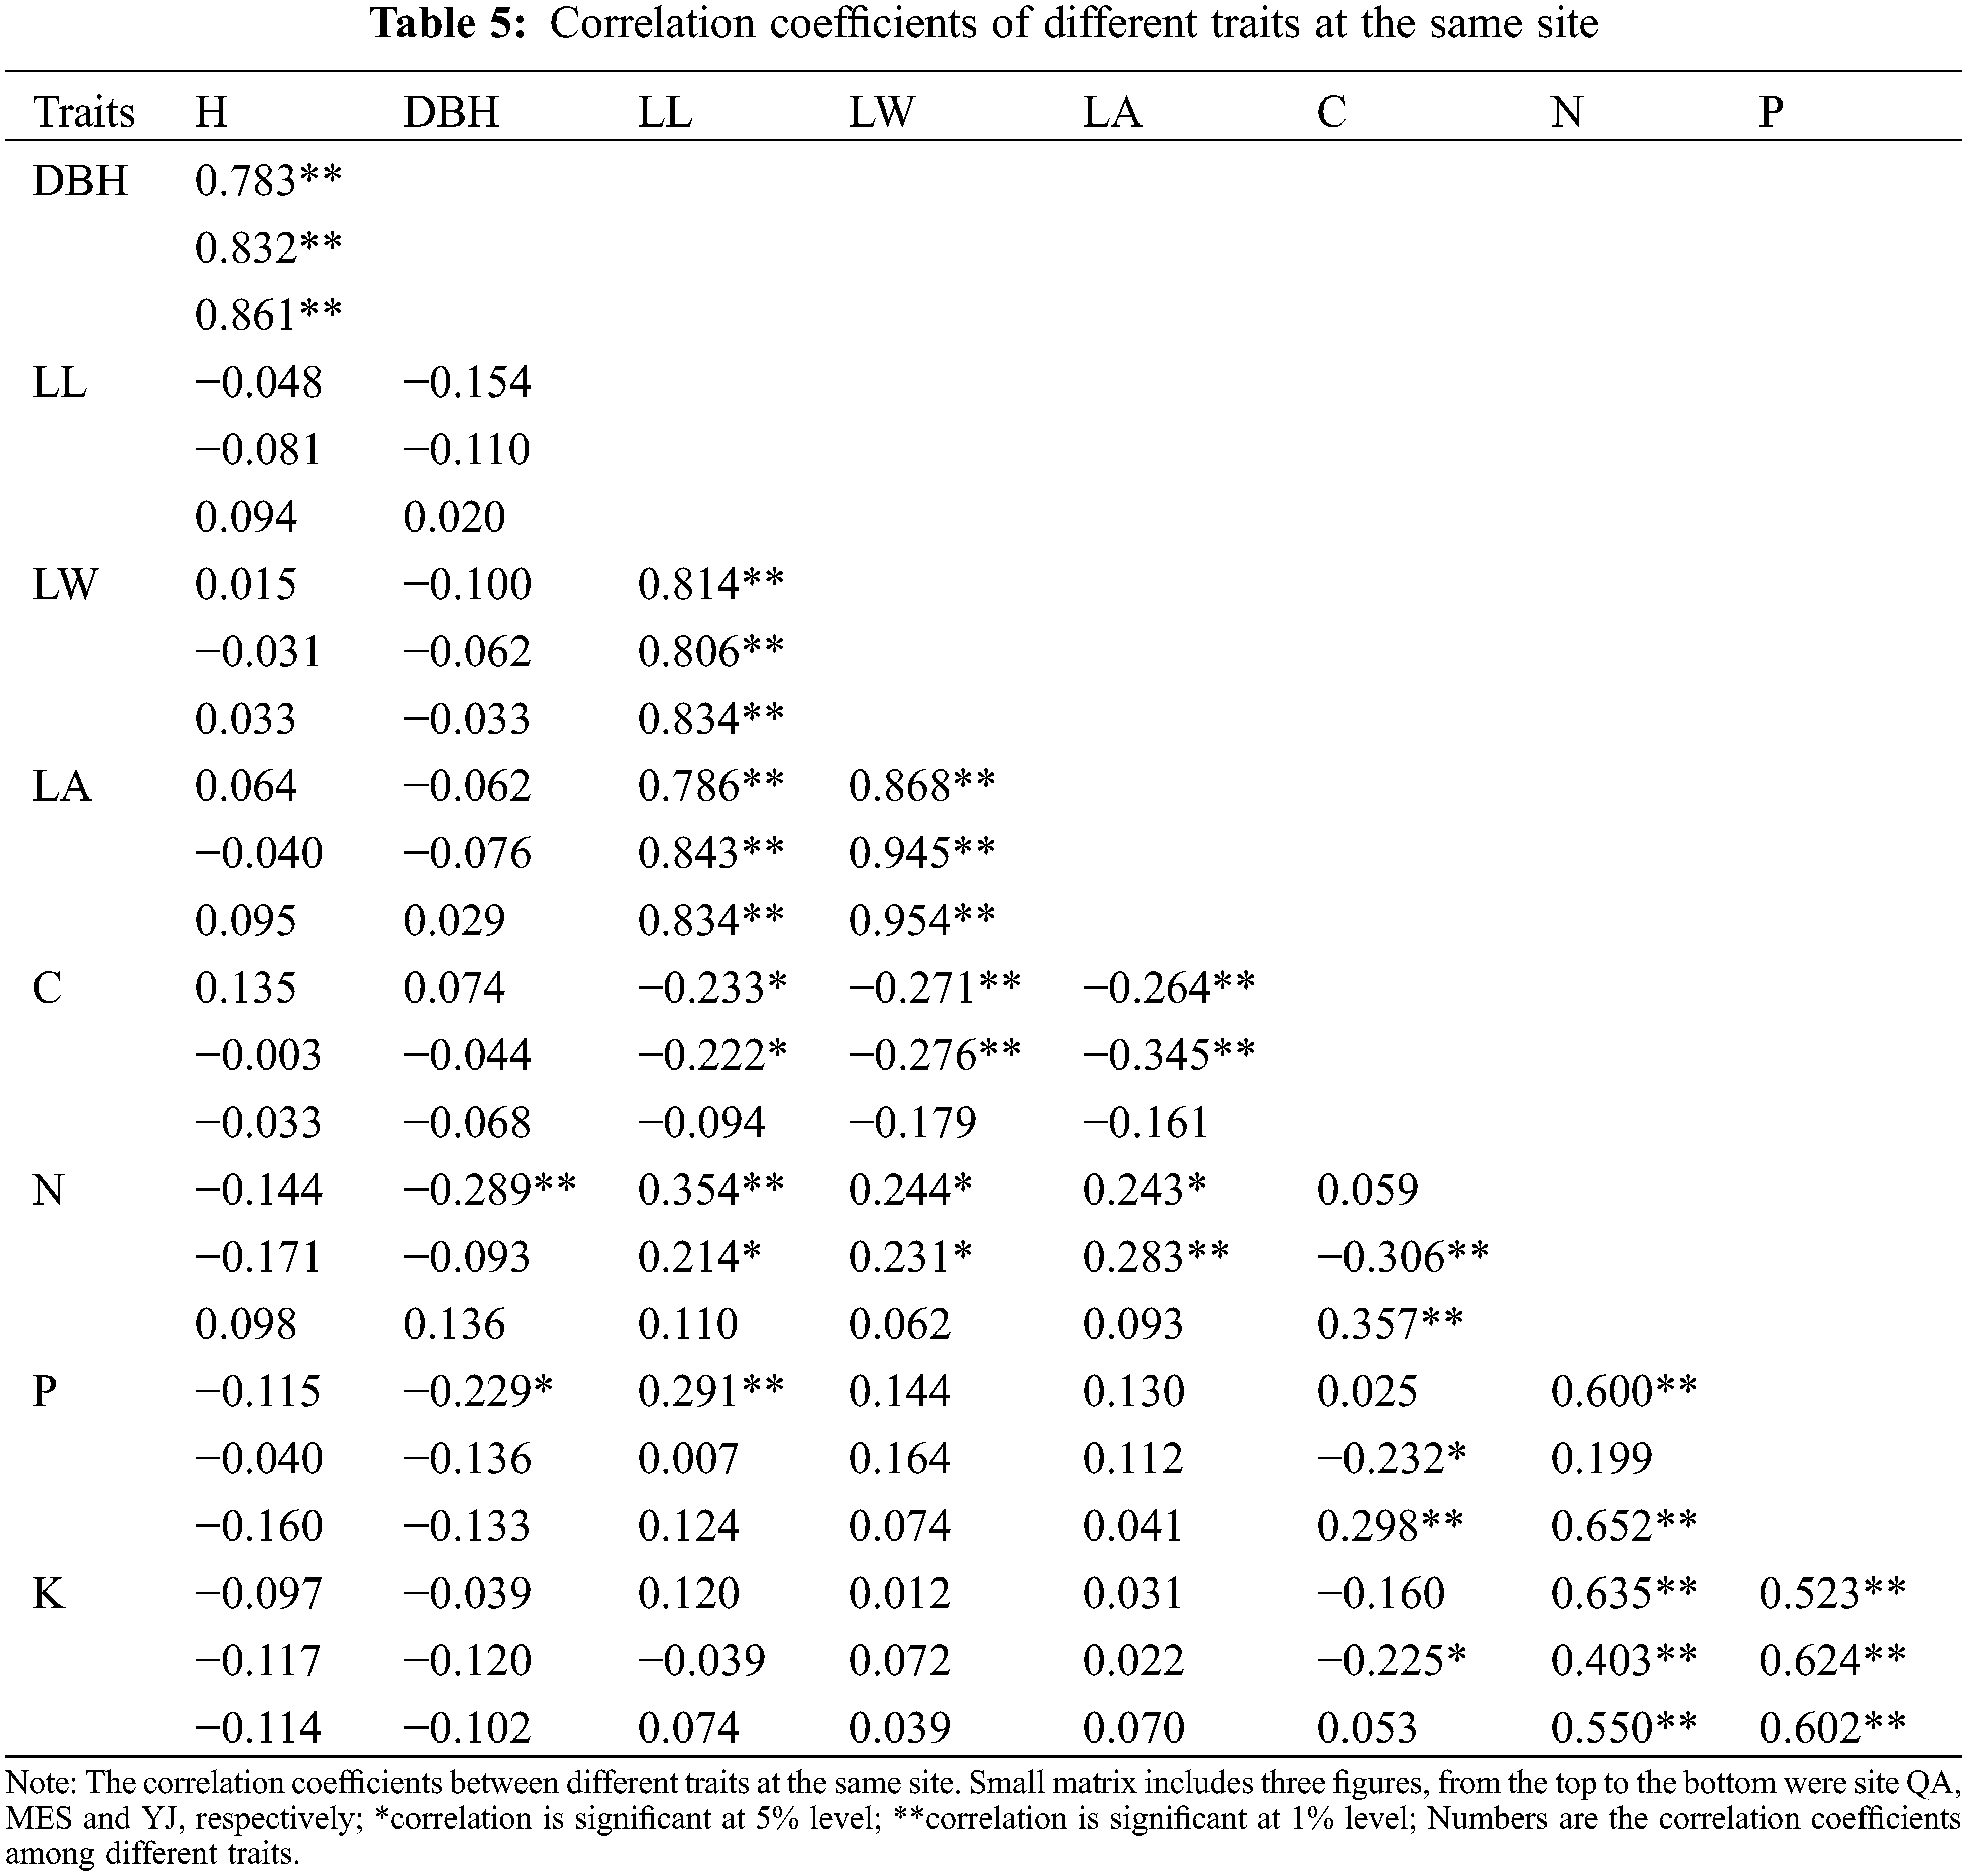
The correlation analysis results of all traits are shown in Table 5. H was positively correlated with DBH (0.861 > r > 0.783), and LL, LW, and LA showed positive correlations with each other (0.954 > r > 0.786) within the same site. Except for the correlation coefficient between the N and P contents in the MES, the correlation coefficients among the N, P and K contents all showed positive correlations with each other. Most correlation coefficients among element contents and growth traits were weak, but N content was significantly correlated with leaf traits and DBH at site QA.
3.3 AMMI Analysis of Different B. platyphylla Clones at the Three Sites
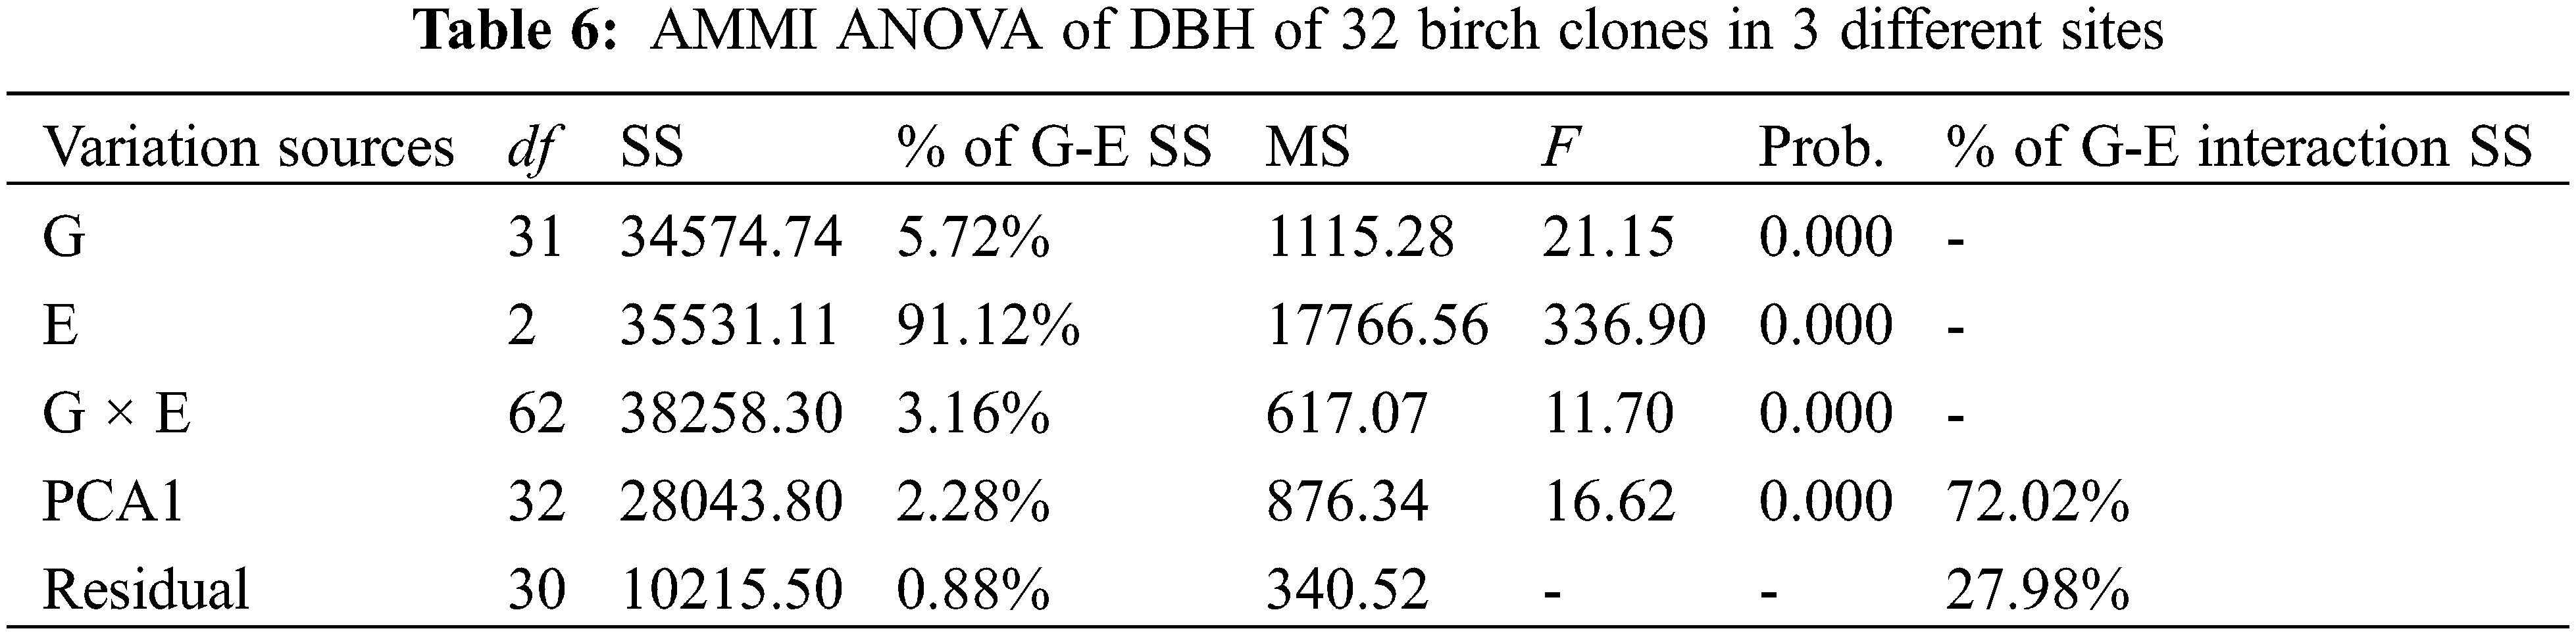
AMMI ANOVA for DBH of 32 birch clones under three different sites is shown in Table 6. All the three components, i.e., genotype (G), environment (E), and genotype × environment, were highly significant (P < 0.01). The main effects of G and E accounted for 5.72% and 91.12% of the total variation, respectively, while the G × E interaction accounted for 3.16% of the total variation in DBH. The G × E interaction was further partitioned into improved principal component analysis 1 (IPCA 1) and residual components. The IPCA1 component was significant and accounted for 72.02% of the total G × E interaction sum of squares (Table 6). The main effects (G and E) accounted for 96.84%, and IPCA1 accounted for 2.28% of the total variation in the G× E data. The AMMI model (Fig. 1) thus jointly gave a model fit of 99.12%.
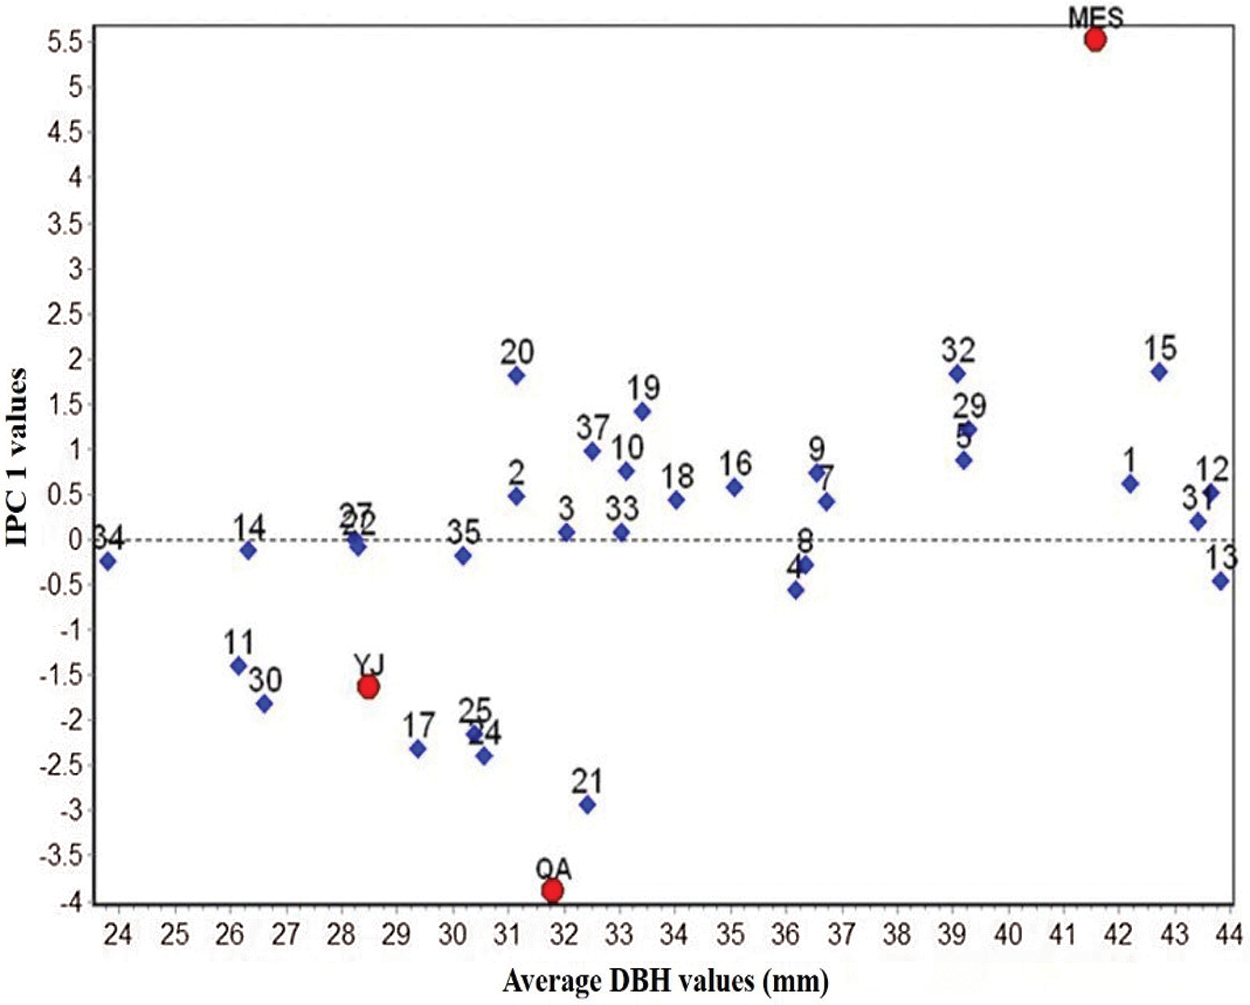
Figure 1: Biplot of DBH of 32 B. platyphylla clones at three different sites
3.4 Biplot of Genotype-Environment Interaction
A biplot generated from the AMMI analysis captured 99.12% of the treatment sum of squares. Because IPCA1 scores of genotypes close to zero had little interaction across environments, the overall mean rankings were extraordinarily reliable. In contrast, the ranking of genotypes with large IPCA1 scores (either positive or negative overall rankings) was less reliable. Genotypes and locations combined with IPCA1 scores of the same sign produced positive specific interaction effects, whereas combinations of positive signs had negative specific interactions. From the AMMI model (Fig. 1), we determined that site MES had positive values for clones BP20, BP19, BP32, BP15, BP29, etc., for which IPC1 values were higher than zero. Similarly, QA and YJ had positive interactions with families 21, 24, 25, 17, etc., for which IPC1 values were lower than zero. The mean DBH at site MES was clearly the highest, but its IPC1 absolute values were higher than those at sites YJ and QA, which indicated that site MES was more unstable than the other two sites. Although site YJ had a low IPC1 value, its mean DBH values were stable, but from the abscissa, we found that the average DBH values were also the lowest.
AMMI analysis allowed us to determine the total G × E interaction effect of each genotype, which was then further divided into interaction effects of individual environments. A genotype showing a low G × E interaction is stable over a range of environments. A genotype showing high positive interactions in an environment obviously has the ability to exploit the natural conditions of a specific environment and is therefore the genotype most adapted to that environment. When examining the IPC1 values of various clones on the biplot (Fig. 1), we observed that the IPCA1 values of clones BP21, BP24, BP17 and BP25 were distant from the horizontal ordinate (−2.15 > IPCA1 > −2.92), suggesting that these clones were more unstable than other clones. In contrast, clones BP33, BP3, BP22 and BP27 showed lower IPCA1 absolute values than other clones (0.08 > IPCA1 > −0.07), which indicated that these clones were more stable than other clones. For the average DBH of distinct clones, clones BP13, BP12, BP31, BP15 and BP1 showed higher DBH values than the other clones, with values of 43.82, 43.63, 43.41, 42.73 and 42.18 mm, respectively. Clone BP34 showed the lowest DBH values in the investigated clones, which was only 23.78 mm.
In this research, based on AMMI analysis, according to a 10% selection rate, clones BP12, BP13 and BP31 were selected as elite clones among the three sites because of their high DBH values and stability. The genetic gains of DBH of the selected clones on sites MES, QA, and YJ were 21.24%, 20.58%, and 38.65%, respectively.
Interestingly, due to the G × E interaction, various clones showed different ranks at separate sites. For site MES, clones BP15, BP32 and BP29 showed higher DBH values than the other clones, which were 60.91, 56.18 and 54.94 mm, respectively. At site QA, clones BP12, BP8 and BP24 showed higher DBH values than the other clones, with values of 41.97, 40.86 and 40.39 mm, respectively. At site YJ, clones BP13, BP31 and BP1 showed higher DBH values than the other clones, with values of 47.47, 42.17 and 40.45 mm, respectively.
ANOVA is a data analysis method of great utility and flexibility [23]. The mean growth performances and element contents showed a significant difference among clones, sites and sites × clones, indicating that the effects of clone genotypes and sites were significant and suggesting that the selection of B. platyphylla clones was effective. The same results were also reported in many tree species, which indicated that selection based on phenotypic variation results is feasible [24–26].
4.2 Genetic and Variation Parameters
Phenotypic variation and repeatability are the most important genetic and variation parameters in clonal selective breeding [27]. In this study, the C contents displayed lower PCV values (1.09% to 2.73%) than other investigated traits, and the results were the same as those of Na [28], in which the PCV of the C content among B. platyphylla families was 3.18%. Except for the C content, the PCVs of all other traits ranged from 11.62% to 39.30%, and trait LA showed higher PCV values (31.19% to 39.30) than the other traits at the separate sites. The results agreed with research on different birch families at separate sites [4,9], which indicated that the evaluation and selection of elite clones were feasible [29].
Repeatability magnitude indicates the reliability with which the genotype will be recognized by its phenotype expression [13]. In this research, the repeatability of different traits ranged from 0.76 to 0.99, which indicated that a great deal of variation in these clones was repeatable. These results agree with Yang et al. [25] for Eucalyptus and Martins et al. [30] for Casuarina. High repeatability estimates indicate that the selection for these traits is effective and less influenced by environmental effects [31].
Correlation analysis is complex but important to researchers to understand the relationships among different investigated traits, which could help us to reveal the principles of growth and development in trees [32]. In this research, high correlation coefficients between H and DBH were found at the same site, and the results were similar to those reported in many studies [33], which indicated that selecting elite clones with high DBH values could be beneficial for H improvement. Leaves are an important organ for photosynthesis and respiration of plants, and leaf area is directly related to plant growth and development [34]. In this research, although the correlation coefficients were significant among leaf traits, all the leaf traits were negatively correlated or weakly correlated with tree H or DBH at different sites, and the results were the same as those of Li et al. [35], which may be because leaf number differences lead to the opposite effect. Nitrogen, phosphorus and potassium are essential nutrients that could affect morphology and phenology during plant growth and development [36]. In this research, only the nitrogen content in leaves was positively correlated with leaf traits at site QA, and most of the other correlation coefficients among element contents and growth traits were weakly correlated, which indicated that plant growth, growth rate and phenology were all affected by N availability more than by other fertilizers. Similarly, Guillemette and Desrochers [37] observed that N was the most limiting nutrient in a hybrid poplar plantation.
4.4 G × E Interaction Effected
Tree growth status is affected by genetic factors (genotype) and environmental factors (edaphic and local regional climatic conditions) [38]. Because of phenotypic plasticity, the same genotype may display different phenotypes in separate environments [10]. Therefore, when evaluating the suitability of trees at separate sites, the interaction between genotype and environment should be considered emphatically [39]. In this research, the three sites represent different climate types and environmental conditions, especially agrotype, altitude, temperature, and annual average precipitation. The significant differences in H and DBH among the same clone at different sites indicated that the environment strongly influenced tree growth [40]. At the YJ site, although the average temperature and effective accumulative temperature were higher than those at the other sites, low altitude led to the lowest average H and DBH. The same results were found at the MES site where the altitude was 400 m, and the trees had the highest average H and DBH, indicating that, in this experiment, altitude was more important than other climate factors.
The AMMI model has been widely used to analyze regional data of plant varieties, especially for stand stability analysis [41]. By combining principal component analysis and variance analysis, the model can effectively decompose the interaction between genotypes and the environment, thus improving the accuracy of stability analysis of the tested clones [42]. The model analysis generates a graphic representation (biplot) of the major effects of the interaction (PCA1) of both genotypes and environments concurrently [43]. In an AMMI biplot, genotypes that are distributed near the origin have minimal interactions with the environment, but those away from the origin are more sensitive to interactions with the environment [9]. In this study, site MES was more favorable for the growth of these clones because of their high DBH values. This may be because, according to the materials that were selected in city Harbin and not far away from MES, similar conditions led to better growth traits of each clone. Different clones also displayed unique DBH values and stabilities (Fig. 1). Clones BP13, BP12 and BP31 exhibited superior DBH values and low IPC1 absolute values at all three sites, which indicated that these clones exhibited elite DBH regardless of environmental conditions. Overall, yield stability data are consequently useful for concurrently selecting high-yielding and stable genotypes [44].
Breeding objectives determine selection methods. B. platyphylla is a commercial tree species, and diameter at breast height is one of the most important traits for elite clone evaluation and selection [45]. Although different clones express various DBH values in separate environments and different clones (BP15, BP32 and BP29 in MES; BP12, BP8 and BP24 in QA; BP13, BP31 and BP1 in YJ) were selected at separate sites, elite clone selection should be based on multipoint comprehensive analysis, and stability and adaptation should be considered emphatically. In this research, according to AMMI analysis, at a selected rate of 10%, clones BP12, BP13 and BP31 were selected as elite clones among the three sites because of their high DBH values and stability. The genetic gains of DBH of the selected clones on sites MES, QA, and YJ were 21.24%, 20.58%, and 38.65%, respectively. The results were higher than those of other research on birch [3,9], which may be due to different materials. Elite clone selection should result in higher genetic gain than elite family selection.
This study used Maoershan (MES), Qing’an (QA) in Heilongjiang Province and Yongji (YJ) in Jilin Province as materials to construct 32 birch clones as a comparative test forest. Determination of growth traits and element content of six-year-old clones were measured. The results showed that there were significant differences among all variation sources in the different investigated traits (P < 0.01). The repeatability of each trait in different sites was higher than 0.76, which was beneficial to the selection of elite clones. Three clones with high and stable yield were selected by AMMI analysis with 10% selection rate, the genetic gain of DBH of the selected clones in all three sites exceeded 20%. It can provide basis for popularization and application of B. platyphylla clones in Northeast China.
Author Contributions: Conceptualization, XYZ and XNP; methodology, YXL and QHZ; validation, XYL; resources, XXZ and RH; writing-original draft preparation, XYL and CLZ; writing-review and editing, XYZ, SQS and XQH.; supervision, XYZ; project administration, XYZ; funding acquisition, XYZ. All authors have read and agreed to the published version of the manuscript.
Acknowledgement: We acknowledge all the members of the research group.
Funding Statement: This work was funded by the Fundamental Research Funds for the Central Universities (2572020DR01, 2572020DY24).
Conflicts of Interest: The authors declare that they have no conflicts of interest to report regarding the present study.
1. Li, Z. X., Li, R., Jiang, G. Y., Li, F., Liang, J. X. et al. (2019). Comprehensive evaluation of multipe-traits of Betula platyphylla half-sib family seedlings. Molecular Plant Breeding, 17(8), 2667–2674. DOI 10.13271/j.mpb.017.002667. [Google Scholar] [CrossRef]
2. Xu, H. W., Liu, Y., Jiang, J., Liu, G. F., Zhao, X. Y. (2016). Progeny test of tetraploid Betula platyphylla and preliminary selection of hybrid parents. Journal of Forestry Research, 27(3), 665–674. DOI 10.1007/s11676-015-0202-1. [Google Scholar] [CrossRef]
3. Liang, D. Y., Zhang, X. X., Wang, C., Wang, X. W., Li, K. L. et al. (2018). Evaluation of Betula platyphylla families based on growth and wood property traits. Forest Science, 64(6), 663–670. DOI 10.1093/forsci/fxy027. [Google Scholar] [CrossRef]
4. Zhao, X. Y., Bian, X. Y., Li, Z. X., Wang, X. W., Yang, C. J. et al. (2014). Genetic stability analysis of introduced Betula pendula, Betula kirghisorum, and Betula pubescens families in saline-alkali soil of Northeastern China. Scandinavian Journal of Forest Research, 29(7), 639–649. DOI 10.1080/02827581.2014.960892. [Google Scholar] [CrossRef]
5. Chen, S., Lin, X., Zhang, D. W., Li, Q., Zhao, X. Y. et al. (2019). Genome-wide analysis of NAC gene families in Betula pendula. Forests, 10(9), 741. DOI 10.3390/f10090741. [Google Scholar] [CrossRef]
6. Yang, C. P., Liu, G. F., Wei, Z. G., Wu, Y. L., Zhou, Y. M. (2004). Study on intensive breeding technique of accelerating Betula platyphylla flowering and seedling early. Scientia Silvae Sincae, 40(6), 75–78. DOI 10.3321/j.issn:1001-7488.2004.06.013. [Google Scholar] [CrossRef]
7. Liu, Y., Xu, H. W., Teng, W. H., Jiang, J., Liu, G. F. (2017). Full-sib progeny test and early selection in superior families of Betula platyphylla. Journal of Beijing Forestry University, 39(2), 1–8. DOI 10.13332/j.1000-1522.20160138. [Google Scholar] [CrossRef]
8. Zhan, A. Y., You, X. L., Zhan, Y. G. (2009). The selection of Betula platyphylla parent clones by plant vitro culture technique. Forestry Science and Technology, 34(5), 1–4. [Google Scholar]
9. Zhao, X. Y., Xia, H., Wang, X. W., Wang, C., Liang, D. Y. et al. (2016). Variance and stability analyses of growth characters in half-sib Betula platyphylla families at three different sites in China. Euphytica, 208(1), 173–186. DOI 10.1007/s10681-015-1617-7. [Google Scholar] [CrossRef]
10. Pei, X. N., Jiang, L. P., Ahmed, A. K. M., Yu, H. Y., Chong, R. Z. et al. (2021). Growth variations and stability analyses of seven poplar clones at three sites in Northeast China. Journal of Forestry Research, 32(4), 1673–1680. DOI 10.1007/s11676-020-01210-x. [Google Scholar] [CrossRef]
11. Marron, N., Ceulemans, R. (2006). Genetic variation of leaf traits related to productivity in a Populus deltoides × Populus nigra family. Canadian Journal of Forest Research, 36(2), 390–400. DOI 10.1139/x05-245. [Google Scholar] [CrossRef]
12. Codesido, V., Fernández-López, J. (2009). Implication of genotype × site interaction on Pinus radiata breeding in Galicia. New Forests, 37(1), 17–34. DOI 10.1007/s11056-008-9105-8. [Google Scholar] [CrossRef]
13. Zhao, X. Y., Hou, W., Zheng, H. Q., Zhang, Z. Y. (2013). Analyses of genotypic variation in white poplar clones at four sites in China. Silvae Genetica, 62(4), 187–195. DOI 10.1515/sg-2013-0023. [Google Scholar] [CrossRef]
14. Oliveira, R. L., von Pinho, R. G., Balestre, M., Ferreira, D. V. (2010). Evaluation of maize hybrids and environmental stratification by the methods AMMI and GGE biplot. Crop Breeding and Applied Biotechnology, 10, 247–253. DOI 10.1590/s1984-70332010000300010. [Google Scholar] [CrossRef]
15. Yin, L. M., Wang, L. H., Liu, B. (2009). Dynamic variation and resorption of nutrient elements in the leaves of Xanthoceras sorbifolia bunge. Bulletin of Botanical Research, 29(6), 685–691. [Google Scholar]
16. Dhillon, G. P. S., Singh, A., Sidhu, D. S., Brar, H. S. (2013). Variation among poplar clones for growth and crown traits under field conditions at two sites of North-Western India. Journal of Forestry Research, 24(1), 61–67. DOI 10.1007/s11676-012-0269-x. [Google Scholar] [CrossRef]
17. Zhang, X. Y., Ji, X. Y., Wang, L., Zhang, Q. W., Nervo, G. et al. (2020). Genetic variation in growth traits at different sites and correlationship among growth traits and leaf traits of section Aigeiros clones. Journal of Nanjing Forestry University (Natural Sciences Edition), 44(3), 65–73. DOI 10.3969/j.issn.1000-2006.201907041. [Google Scholar] [CrossRef]
18. Munilla, I., Guitián, J. (2014). Long-term individual-level variation of reproductive features in Sorbus aucuparia, a fleshy-fruited tree. Trees, 28(5), 1489–1496. DOI 10.1007/s00468-014-1052-8. [Google Scholar] [CrossRef]
19. Hansen, J. K., Roulund, H. (1997). Genetic parameters for spiral grain, stem form, pilodyn and growth in 13 years old clones of Sitka spruce (Picea sitchensis (BONG.) CARR.). Silvae Genetica, 46(2), 107–113. [Google Scholar]
20. Wang, J. J., Weng, Y. H., Krasowski, M., Yan, G. H., Fullarton, M. (2018). Genetic parameters of growth and stem forking for black spruce progeny tested in New Brunswick, Canada. New Forests, 49(2), 265–277. DOI 10.1007/s11056-017-9618-0. [Google Scholar] [CrossRef]
21. Zobel, R. W., Wright, M. J., Gauch Jr, H. G. (1988). Statistical analysis of a yield trial. Agronomy Journal, 80(3), 388–393. DOI 10.2134/agronj1988.00021962008000030002x. [Google Scholar] [CrossRef]
22. Xie, X. M., Li, J. T., Zhao, H. E., Liu, J. J., Duan, C. L. et al. (2008). Willow clonal seedling genetic determination and selection. Journal of Jiangsu Forestry Science and Technology, 35(3), 6–14. DOI 10.3969/j.issn.1001-7380.2008.03.002. [Google Scholar] [CrossRef]
23. Armstrong, R. A., Slade, S. V., Eperjesi, F. (2000). An introduction to analysis of variance (ANOVA) with special reference to data from clinical experiments in optometry. Ophthalmic and Physiological Optics, 20(3), 235–241. DOI 10.1046/j.1475-1313.2000.00502.x. [Google Scholar] [CrossRef]
24. Xiao, Y., Ma, W. J., Lu, N., Wang, Z., Wang, N. et al. (2019). Genetic variation of growth traits and genotype-by-environment interactions in clones of Catalpa bungei and Catalpa fargesii f. duclouxii. Forests, 10(1), 57. DOI 10.3390/f10010057. [Google Scholar] [CrossRef]
25. Yang, H. Y., Weng, Q. J., Li, F. G., Zhou, C. P., Li, M. et al. (2018). Genotypic variation and genotype-by-environment interactions in growth and wood properties in a cloned Eucalyptus urophylla × E. tereticornis family in Southern China. Forest Science, 64(3), 225–232. DOI 10.1093/forsci/fxx011. [Google Scholar] [CrossRef]
26. Kaviriri, D. K., Zhang, Q. H., Zhang, X. X., Jiang, L. P., Zhang, J. P. et al. (2020). Phenotypic variability and genetic diversity in a Pinus koraiensis clonal trial in Northeastern China. Genes, 11(6), 673. DOI 10.3390/genes11060673. [Google Scholar] [CrossRef]
27. Mwase, W. F., Savill, P. S., Hemery, G. (2008). Genetic parameter estimates for growth and form traits in common ash (Fraxinus excelsior, L.) in a breeding seedling orchard at Little Wittenham in England. New Forests, 36(3), 225–238. DOI 10.1007/s11056-008-9095-6. [Google Scholar] [CrossRef]
28. Na, X. Y. (2016). High carbon storage family selection of Betula platyphylla Suk. (Master Thesis). Northeast Forestry University, Harbin. [Google Scholar]
29. Liang, D. Y., Jin, Y. Z., Zhao, G. H., Dong, Y. H., Leng, W. W. et al. (2016). Variance analyses of growth and wood characteristics of 50 Pinus koraiensis clones. Journal of Beijing Forestry University, 38(6), 51–59. DOI 10.13332/j.1000-1522.20150465. [Google Scholar] [CrossRef]
30. Martins, F. B., Soares, C. P. B., Silva, G. F. (2014). Individual tree growth models for eucalyptus in Northern Brazil. Scientia Agricola, 71(3), 212–225. DOI 10.1590/S0103-90162014000300006. [Google Scholar] [CrossRef]
31. Maniee, M., Kahrizi, D., Mohammadi, R. (2009). Genetic variability of some morpho-physiological traits in durum wheat (Triticum turgidum var. Durum). Journal of Applied Sciences, 9(7), 1383–1387. DOI 10.3923/jas.2009.1383.1387. [Google Scholar] [CrossRef]
32. Fukatsu, E., Hiraoka, Y., Matsunaga, K., Tsubomura, M., Nakada, R. (2015). Genetic relationship between wood properties and growth traits in Larix kaempferi obtained from a diallel mating test. Journal of Wood Science, 61(1), 10–18. DOI 10.1007/s10086-014-1436-9. [Google Scholar] [CrossRef]
33. Xia, H., Zhao, G. H., Zhang, L. S., Sun, X. Y., Yin, S. P. et al. (2016). Genetic and variation analyses of growth traits of half-sib Larix olgensis families in Northeastern China. Euphytica, 212(3), 387–397. DOI 10.1007/s10681-016-1765-4. [Google Scholar] [CrossRef]
34. Liu, Y., Xu, H. W., Bian, X. Y., Liu, G. F., Zhao, X. Y. (2013). Selection of seedling growth and photosynthetic traits assistant evaluated factors in Betula playphylla half-sib families. Acta Botanica Boreali-Occidentalia Sinica, 33(5), 963–969. DOI 10.3969/j.issn.1000-4025.2013.05.015. [Google Scholar] [CrossRef]
35. Li, Z. X., Pei, X. N., Yin, S. P., Lang, X. B., Zhao, X. Y. et al. (2019). Plant hormone treatments to alleviate the effects of salt stress on germination of Betula platyphylla seeds. Journal of Forestry Research, 30(3), 779–787. DOI 10.1007/s11676-018-0661-2. [Google Scholar] [CrossRef]
36. Pitre, F. E., Cooke, J. E. K., Mackay, J. J. (2007). Short-term effects of nitrogen availability on wood formation and fibre properties in hybrid poplar. Trees, 21(2), 249–259. DOI 10.1007/s00468-007-0123-5. [Google Scholar] [CrossRef]
37. Guillemette, T., DesRochers, A. (2008). Early growth and nutrition of hybrid poplars fertilized at planting in the boreal forest of Western Quebec. Forest Ecology and Management, 255(7), 2981–2989. DOI 10.1016/j.foreco.2008.02.004. [Google Scholar] [CrossRef]
38. Pliura, A., Zhang, S. Y., Mackay, J., Bousquet, J. (2007). Genotypic variation in wood density and growth traits of poplar hybrids at four clonal trials. Forest Ecology and Management, 238(1–3), 92–106. DOI 10.1016/j.foreco.2006.09.082. [Google Scholar] [CrossRef]
39. Yu, Q. B., Pulkkien, P. (2003). Genotype-environment interaction and stability in growth of aspen hybrid clones. Forest Ecology and Management, 173(1–3), 25–35. DOI 10.1016/S0378-1127(01)00819-2. [Google Scholar] [CrossRef]
40. Liu, M. R., Yin, S. P., Si, D. J., Shao, L. T., Li, Y. et al. (2015). Variation and genetic stability analyses of transgenic TaLEA poplar clones from four diferent sites in China. Euphytica, 206(2), 331–342. DOI 10.1007/s10681-015-1471-7. [Google Scholar] [CrossRef]
41. Zhao, X. Y. (2010). Study on hybridization and evaluation of multiple characters of hybrid clone white poplar (Ph.D. Thesis). Beijing Forestry University, Beijing. [Google Scholar]
42. Lin, Y. Z. (2019). Research methodologies for genotype by environment interactions in forest trees and their applications. Science Silvae Sinicae, 55(5), 142–151. DOI 10.11707/j.1001-7488.20190516. [Google Scholar] [CrossRef]
43. Kempton, R. A. (1984). The use of the biplots in interpreting variety by environment interactions. The Journal of Agricultural Science, 103(1), 123–135. DOI 10.1017/S0021859600043392. [Google Scholar] [CrossRef]
44. Kang, M. S., Pham, H. N. (1991). Simultaneous selection for high yielding and stable crop genotypes. Agronomy Journal, 83(1), 161–165. DOI 10.2134/agronj1991.00021962008300010037x. [Google Scholar] [CrossRef]
45. Liang, D. Y., Wang, B. Y., Song, S. L., Wang, J. Y., Wang, L. F. et al. (2019). Analysis of genetic effects on a complete diallel cross test of Pinus koraiensis. Euphytica, 215(5), 1–12. DOI 10.1007/s10681-019-2414-5. [Google Scholar] [CrossRef]
 | This work is licensed under a Creative Commons Attribution 4.0 International License, which permits unrestricted use, distribution, and reproduction in any medium, provided the original work is properly cited. |