| Phyton-International Journal of Experimental Botany |
DOI: 10.32604/phyton.2022.021062
ARTICLE
Age-Related Alterations in DNA Methylation and APETALA2 (AP2) Levels in Herbaceous Peony (Paeonia lactiflora Pall.)
1Joint International Research Laboratory of Agriculture and Agri-Product Safety, The Ministry of Education of China, Institutes of Agricultural Science and Technology Development, Yangzhou University, Yangzhou, 225009, China
2Jiangsu Key Laboratory of Crop Genetics and Physiology, College of Horticulture and Plant Protection, Yangzhou University, Yangzhou, 225009, China
*Corresponding Author: Jun Tao. Email: taojun@yzu.edu.cn
Received: 25 December 2021; Accepted: 18 January 2022
Abstract: The ornamental and commercial values of herbaceous peony (Paeonia lactiflora Pall.) are directly related to its flower pattern. However, the molecular mechanisms underlying the type formation of P. lactiflora flowers have not been studied in great detail. Previous studies identified, using integrated multipleomics analysis, revealed that APETALA2 (AP2) is an important candidate gene that modulates type formation of P. lactiflora flowers. To further reveal the expression mechanism of AP2 in P. lactiflora petals, we examined the profile of AP2 expression in the inner and outer petals of ‘ZiFengyu’ at various developmental stages using qRT-PCR and BSP+Miseq methylation analysis. Based on our data, the AP2 levels in the outer petals were obviously increased, relative to the inner petals. In addition, the S3 levels at the bloom stage were significantly higher than at the flower-bud stage S1, thereby promoting bloom stage S2, while declining stage S4. Using chromosome walking, the 2000 bp of the 5′-end upstream promoter region was achieved. This region harbored a CpG island (−665∼−872 bp), with multiple essential transcription factor binding sites (TFBS) such as NF-kappa B, GATA-1, Sp1, and C/EBP. Methylation sequencing revealed 7 methylated CpG sites in the CpG island region of the AP2 promoter, thereinto, the methylation ratio of the CpG-3 site in the inner petals was significantly higher than in the outer petals. Correlation analysis revealed a negative association between the level of methylation (CpG-3, CpG-6), and AP2 mRNA expression. CpG-3 was located on the Sp1 transcription factor binding site. Thus, we speculated that the CpG-3 methylation may inhibit transcription factor Sp1 binding to the gene promoter, thereby regulating AP2 expression. Herein, we examined the role of AP2 in the determination of flower patterns in P. lactiflora. Our conclusion will provide theoretical guidance for the molecular breeding of the flower pattern in P. lactiflora.
Keywords: Herbaceous peony; APETALA2 (AP2); developmental expression; DNA methylation
Herbaceous peony (Paeonia lactiflora Pall.) belongs to the plant genus Paeonia of the Paeoniaceae family. P. lactiflora is a traditional flower and it has the reputation of being the “the prime minister of flowers”. Flower organs are an optimal model system for the examination of associations among plant growth, genes, and evolution. At present, there are extensive researches on the molecular pathway of the P. lactiflora flower color formation, along with the systematic analysis of anthocyanin components of the flower. In prior work, we employed RNA sequencing (RNA-Seq) technology to analyze the molecular network that regulates P. lactiflora flower color chimera ‘Jin Hui’ (with characteristic red outer petal and yellow inner petal), and screened for important candidate genes related to flower color, including phenylalanine ammonia-lyase (PAL), flavonol synthase (FLS), and anthocyanidin synthase (ANS) [1]. Petal formation patterns of ornamental plants, like P. lactiflora, are key indicators of their ornamental value. As a result, its underlying molecular mechanism has garnered much attention in recent times. Current research on the molecular mechanisms regulating flower pattern is mainly focused on model organisms like snapdragon, arabidopsis, and tobacco [2–6]. An ABCDE molecular model has been proposed for the regulation of flower pattern development [7]. However, the molecular mechanism related to the development and formation of P. lactiflora petals remains unclear. Therefore, it is urgent to elucidate the molecular mechanism of peony petal regulation from a genetic background as well as to provide theoretical guidance for resolving the problems of cultivating new varieties of P. lactiflora with diverse flower patterns. Therefore, our previous studies performed a combined analysis of transcriptomes and iTRAQ proteomics using the inner and outer petals of ‘ZiFengyu’ P. lactiflora, and identified a key candidate gene APETALA2 (AP2) as a primary target [8]. The flower-meristem-identity gene APETALA2 (AP2), as one of class-A genes, is involved in the establishment of the floral meristem and the forming of sepals and petals. To further explore the relationship between P. lactiflora AP2 levels and development of floral organs, the inner and outer petals at varying developmental stages of the P. lactiflora anemone type ‘ZiFengyu’ (i.e., flower-bud stage S1, initiating bloom stage S2, bloom stage S3, and decline stage S4) were selected as study materials. The expression differences of AP2 at varying developmental stages and between the inner and outer petals were detected using qRT-PCR. Our findings will provide a theoretical reference for the in-depth study of the functional mechanism of AP2 expression in P. lactiflora.
Gene expression is not only regulated by genetic factors but also by epigenetic modifications [9]. Among all epigenetic modifications, DNA methylation is the most common regulatory mechanism involved in the conversion of 5’-cytosine dinucleotide at the CpG site to 5’-methylcytosine via DNA methyltransferase [10]. In general, the CpG island-rich areas within the gene promoter are prone to DNA methylation, and the methylation sites tend to discourage transcription factors interaction with the gene promoter, thereby suppressing gene transcription and expression [11]. Multiple reports suggest that DNA methylation serves an essential role in regulating cell physiology, development, and disease [12,13]. Till date, there is a lack of in-depth research on the molecular mechanisms regulating flower pattern in P. lactiflora. Hence, this study employed bioinformatics analysis to predict the CpG island of P. lactiflora AP2 promotor region, then, used bisulfite sequencing PCR (BSP)-Miseq Sequencing to assess the methylation status of the AP2 promoter CpG island region in the petal tissues from varying developmental stages. We also explored the outcome of methylated AP2 promotor region on AP2 gene expression. Our findings will lay the foundation of the significance of AP2 expression in P. lactiflora flower pattern regulation. This will provide a theoretical basis for silencing or activating genes via epigenetic modification in order to regulate the development and formation of P. lactiflora petals in the future.
P. lactiflora anemone type cultivar ‘ZiFengyu’ was selected as the test object in this study. The inner and outer petal tissues (3 samples each) at four different developmental stages were collected (i.e., flower-bud stage S1, initiating bloom stage S2, bloom stage S3 and decline stage S4). The samples were obtained from the P. lactiflora germplasm resource nursery of our laboratory. All materials were flash-frozen in liquid nitrogen and sent to the laboratory where they were stored in an ultra-low temperature refrigerator of −80°C (Fig. 1).
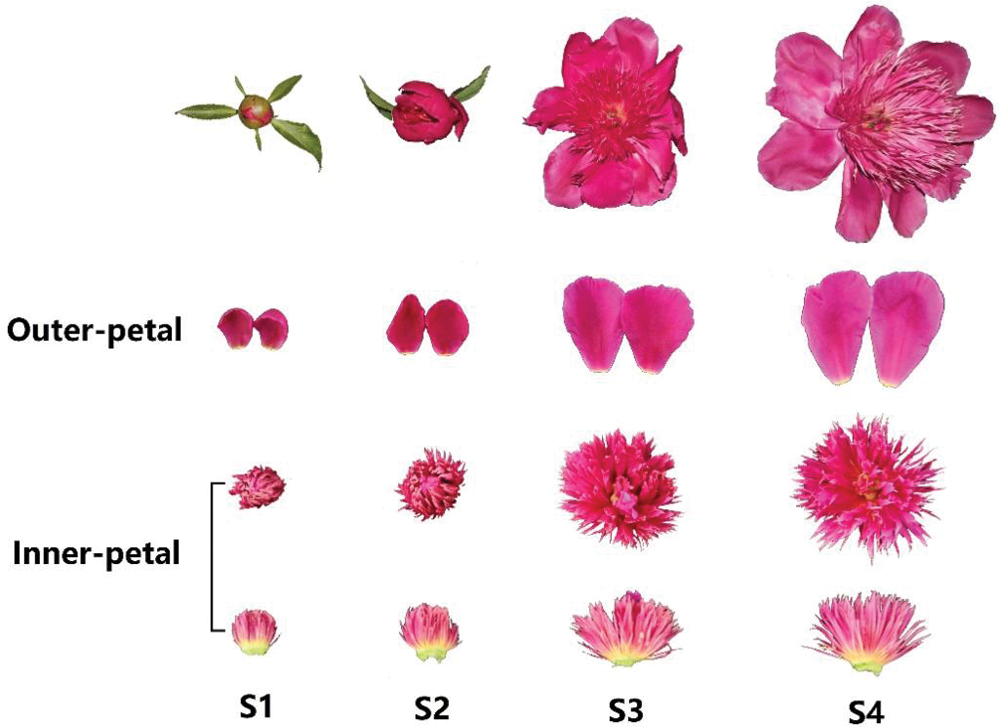
Figure 1: Outer- and inner-petals of P. lactiflora ‘ZiFengyu’ at four distinct developmental stages. S1: flower-bud stage, S2: initiating bloom stage, S3: bloom stage, and S4: decline stage
DL2000, DNTP, PCR Buffer, RNA Purification Kit DNase I and the Genome Walking Kit were purchased from TaKaRa Company. Both primer synthesis and DNA sequencing were completed by Sangon Biotech (Shanghai) Co., Ltd., China.
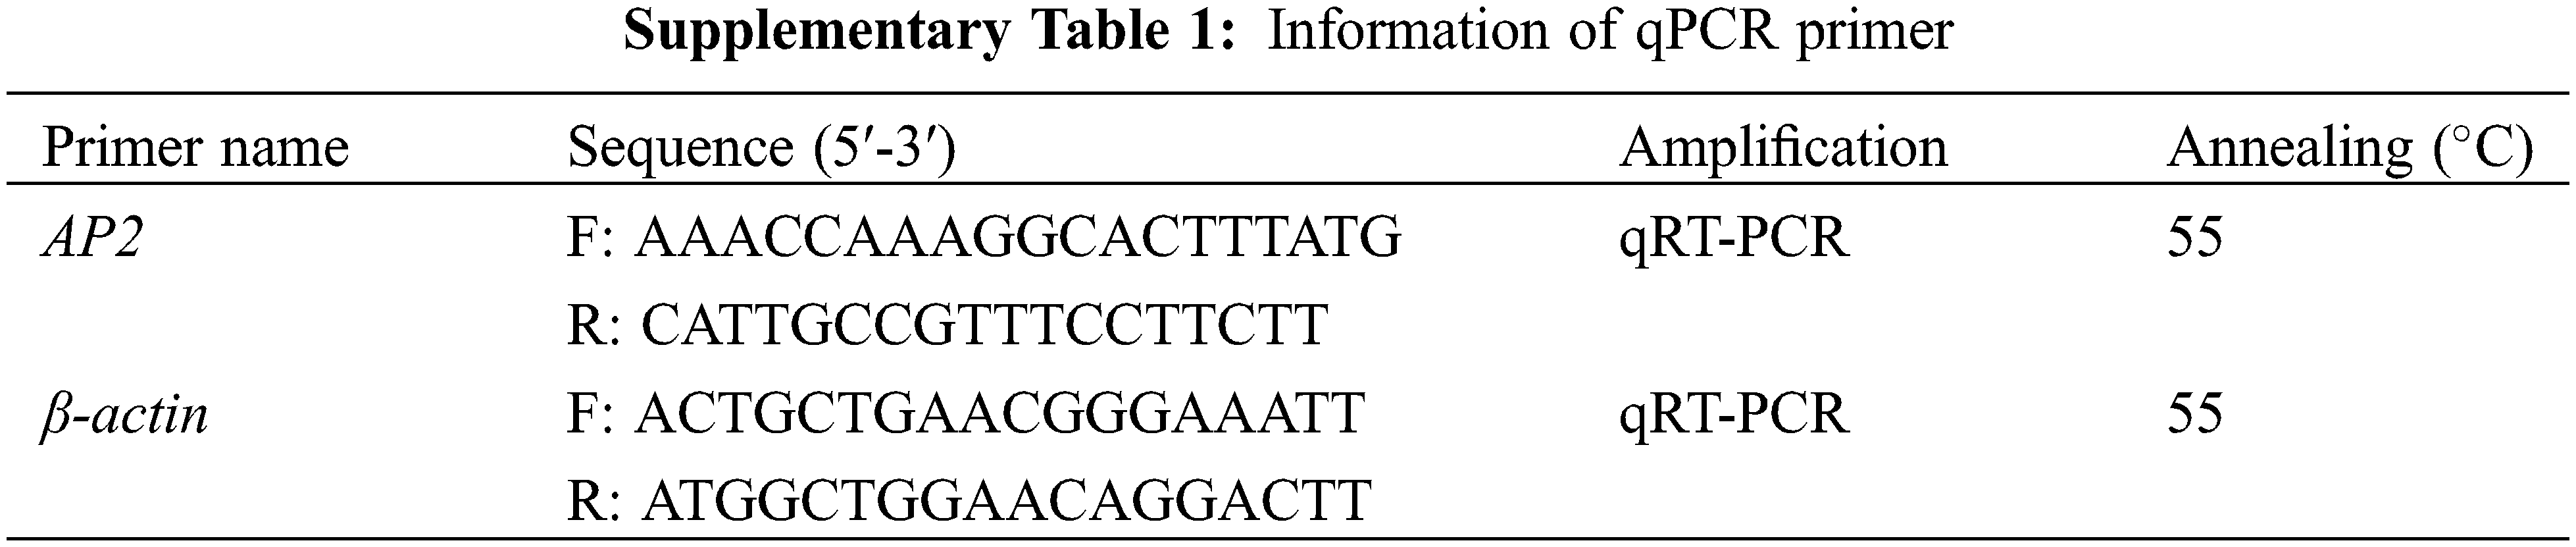
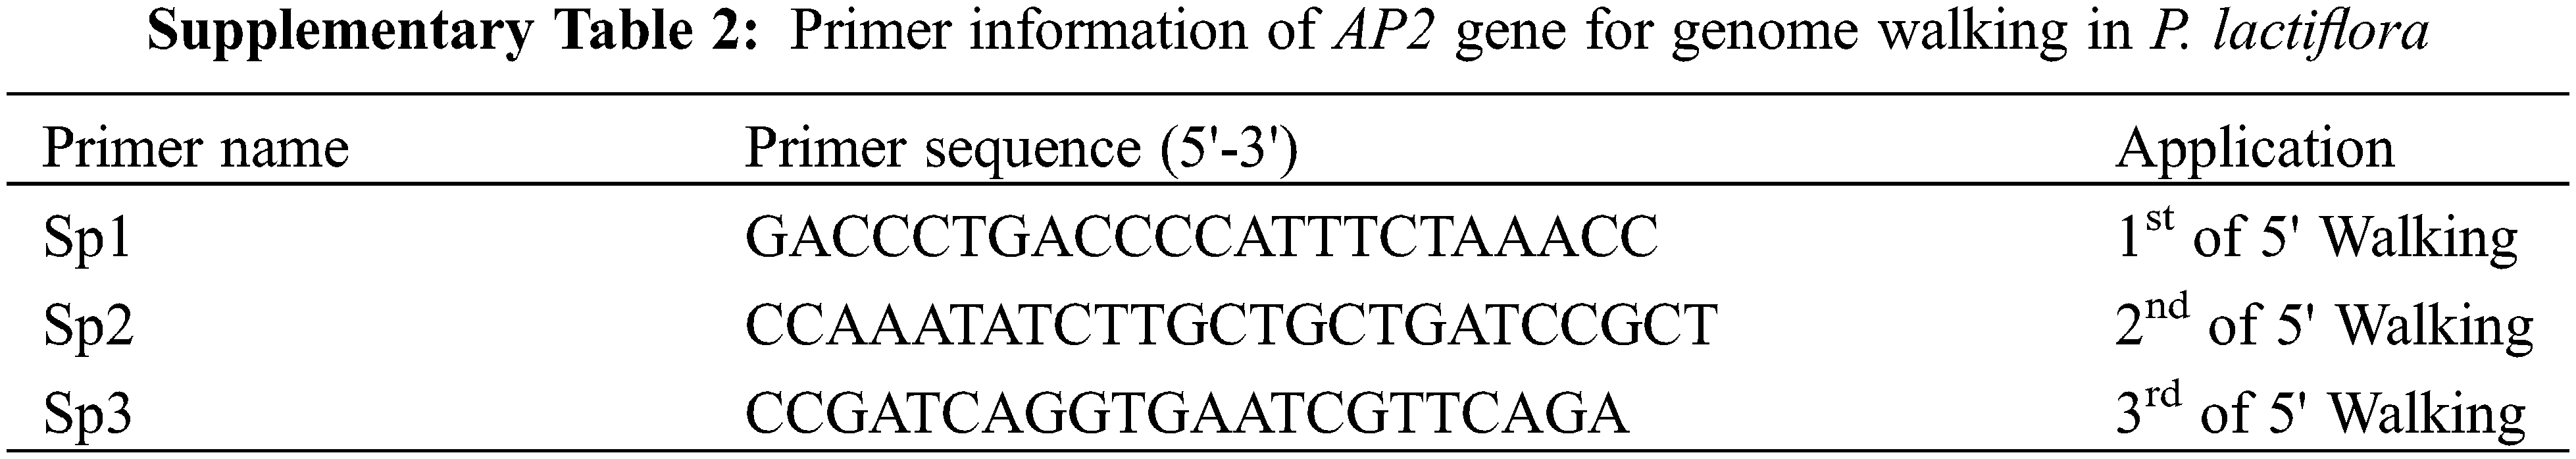
The fluorescence quantification primer (Supplementary Table 1) was designed based on the mRNA sequence of P. lactiflora AP2 obtained from a previous report [8] on P. lactiflora ‘ZiFengyu’ petals. On this basis, we further designed specific primers with reference to the manufacturer of Genome Walking Kit (Code: D316, TaKaRa) for chromosome walking. A list of employed primer sequences is provided in Supplementary Table 2. All primers were synthesized using the Shanghai Biotechnology Engineering Service Co., Ltd., China.
The genomic DNA of P. lactiflora petals was extracted as per the slightly improvised CTAB method [14]. The nested PCR amplification was performed according to the Genome Walking Kit instructions, and the PCR products were finally DNA sequenced.
2.5 Promotor Region Bioinformatics Analysis
The MethPrimer methylation analysis software (http://www.gene-regulation.com/pub/programs/alibaba2/index.html?) and the AliBaba software (http://www.gene-regulation.com/pub/programs/alibaba2/index.html?) were employed to estimate the GpG and CpG islands, respectively, within the 2000-bp 5’-upstream promotor region of the P. lactiflora AP2 gene.
2.6 Quantitative Real Time PCR Detection
Reverse transcription cDNA synthesis was accomplished according to the reverse transcription kit instructions (Takara, Code No. RR047A). The synthesized cDNA was compared with the internal reference gene β-actin upon quantitative PCR proliferation. Briefly, 20 μL of the Real-Time PCR reaction system included 10 μL of the reagent mixture, 0.5 μL each of the upstream and downstream primers (10 μM each), 1 μL of the cDNA template, and 8 μL of sterile double distilled water (ddH20) under the reaction criteria as follows: 95°C for 30 s, 1 cycle and 95°C for 5 s, 40 cycles.
Genomic DNA was isolated from porcine tissues via routine phenol/chloroform extraction, prior to bisulfite conversion via the EpiTect Bisulfite Kit (Qiagen, Valencia, CA, USA), following kit guidelines. Touchdown PCR amplified the bisulfite-treated DNA (BST-DNA) using the following AP2 primer sequences: (Forward) 5´-GGAGTTAGGGAGTTGAATAAGGTTA-3´ and (Reverse) 5´-ATTCAAAAAAACATCACAAAAAAAA-3´. Subsequently, the NGS library was created according to the TruSeq DNA PCR-free library construction technical manual (Illumina, San Diego, CA, USA), followed by sequencing with the Illumina MiSeq Benchtop Sequencer. The Illumina Experiment Manager (Illumina) was used to generate the FASTQ format file. Moreover, 600-cycle MiSeq v.3 reagent cartridges (Illumina) were used for two-tailed end sequencing library. The raw sequencing data was subjected to data quality control to remove low-quality and ambiguous base sequences. The methylated and unmethylated reads were counted separately. Finally, the methylated and unmethylated reads were combined, and the methylation status of each CpG site was calculated as the degree of methylated reads.
The quantitative data analysis was processed by the 2−ΔΔCt method [15]. Each sample was subjected to 3 real-time PCR detections, and the average value was used for further analysis. The SPSS18.0 software was used to perform one-way analysis of variance (ANOVA) based on the General Linear Model (GLM) of different species, different developmental stages, and differences in AP2 expression between the inner and outer petals. The methylation sequencing data were compared with the QUMA online analysis software (http://quma.cdb.riken.jp/). The correlation analysis of the AP2 gene expression and methylation status in P. lactiflora petals employed the Pearson Correlation test within the SPSS18.0 statistical software.
3.1 Analysis of AP2 Expression in the Outer Petals of P. lactiflora ‘ZiFengyu’ at Varying Developmental Stages
We examined differences in AP2 expression in the outer petal tissues of the ‘ZiFengyu’ variety at varying developmental stages, using qPCR. Based on our results (Fig. 2), during the S3 stage, the outer petal AP2 levels were markedly elevated, compared to the inner petals AP2 levels (P < 0.05). Moreover, the AP2 expression in the outer flap of the S4 stage was substantially higher than the inner flap at the decay stage (P < 0.01). In addition, the S3 stage AP2 expression in the petal tissues of the ‘ZiFengyu’ variety was significantly higher than other stages of development (P < 0.05). Thus, in this study, we noted significant differences in the ‘ZiFengyu’ outer petals AP2 expression at varying stages, and the AP2 expression within the outer petal tissues was significantly larger, compared to the inner petals. Lastly, the AP2 expression at S3 was relatively higher during the blooming period.
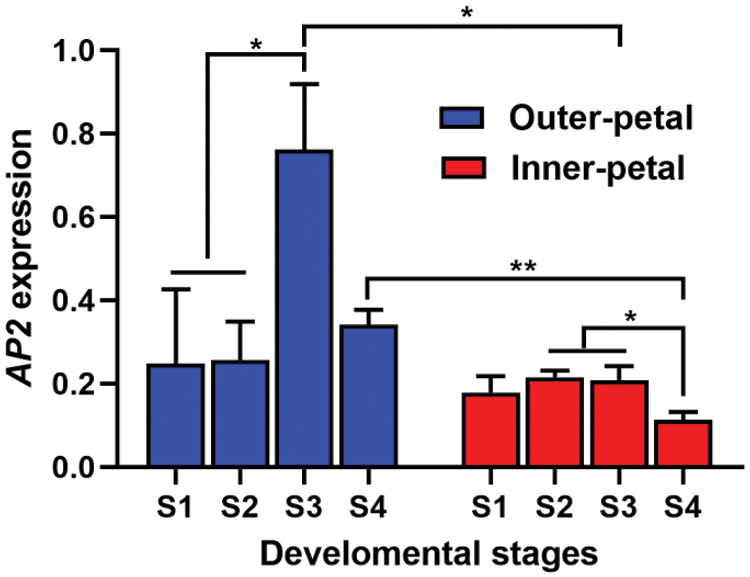
Figure 2: Differential expression analysis of AP2 expression in petals of ‘Zi Fengyu’. Stage 1 (S1), flower-bud stage; stage 2 (S2), initiating bloom stage; stage 3 (S3), bloom stage; and stage 4 (S4), decline stage, *P < 0.05, **P < 0.01
3.2 Cloning of the P. lactiflora AP2 5′ Upstream Promotor Region and CpG Prediction
In this study, we employed chromosome walking to clone the 5’-upstream promotor region of the AP2 gene, detected by agarose gel electrophoresis (AGE) (Supplementary Fig. 1). The 2000-bp upstream promoter was successfully cloned with sequencing (Supplementary Fig. 2). The CpG prediction of this region (Supplementary Fig. 3) indicated the presence of a CpG island region (−665∼−872 bp) in the AP2 promoter, which could be used for methylation detection.
3.3 Methylation Status Analysis of the CpG Island Region of the AP2 Promoter in P. lactiflora
A methylated primer was used to conduct PCR amplification of the target AP2 fragment and fragment detection was done using 1% AGE (Supplementary Fig. 4). The amplified fragment sizes met our expectations, and they were directly analyzed via methylation sequencing (BSP+Miseq) to detect amount of AP2 methylation in the outer and inner petals at varying stages of development, namely, flower-bud stage S1, initiating bloom stage S2, bloom stage S3, and decline stage S4. Our results revealed 7 CpG sites (i.e., CpG-1, CpG-2, CpG-3, CpG-4, CpG-5, CpG-6, and CpG-7) within the CpG island of the AP2 promoter, with varying degrees of methylation (19.73–65.78%) (Fig. 3). Further analysis of the degree of methylation between the inner and outer petals (Fig. 4) revealed that the methylation ratio (45.37%) of the CpG-3 site in the inner petals was significantly higher than the outer petals (35.85%) (P < 0.01). Analysis of the degree of methylation at varying developmental stages (Fig. 5) revealed that the methylation ratio of the CpG-2 sites at the S4 stage (57.01%) was significantly higher than the S3 stage (40.62%), S1 stage (45.49%), and S2 stage (45.85%) (P < 0.05). Moreover, the methylation ratio of the CpG-3 sites at the S3 stage (32.36%) was significantly lower than the S1 stage (42.99%), S2 stage (43.71%), and S4 stage (43.37%) (P < 0.05).
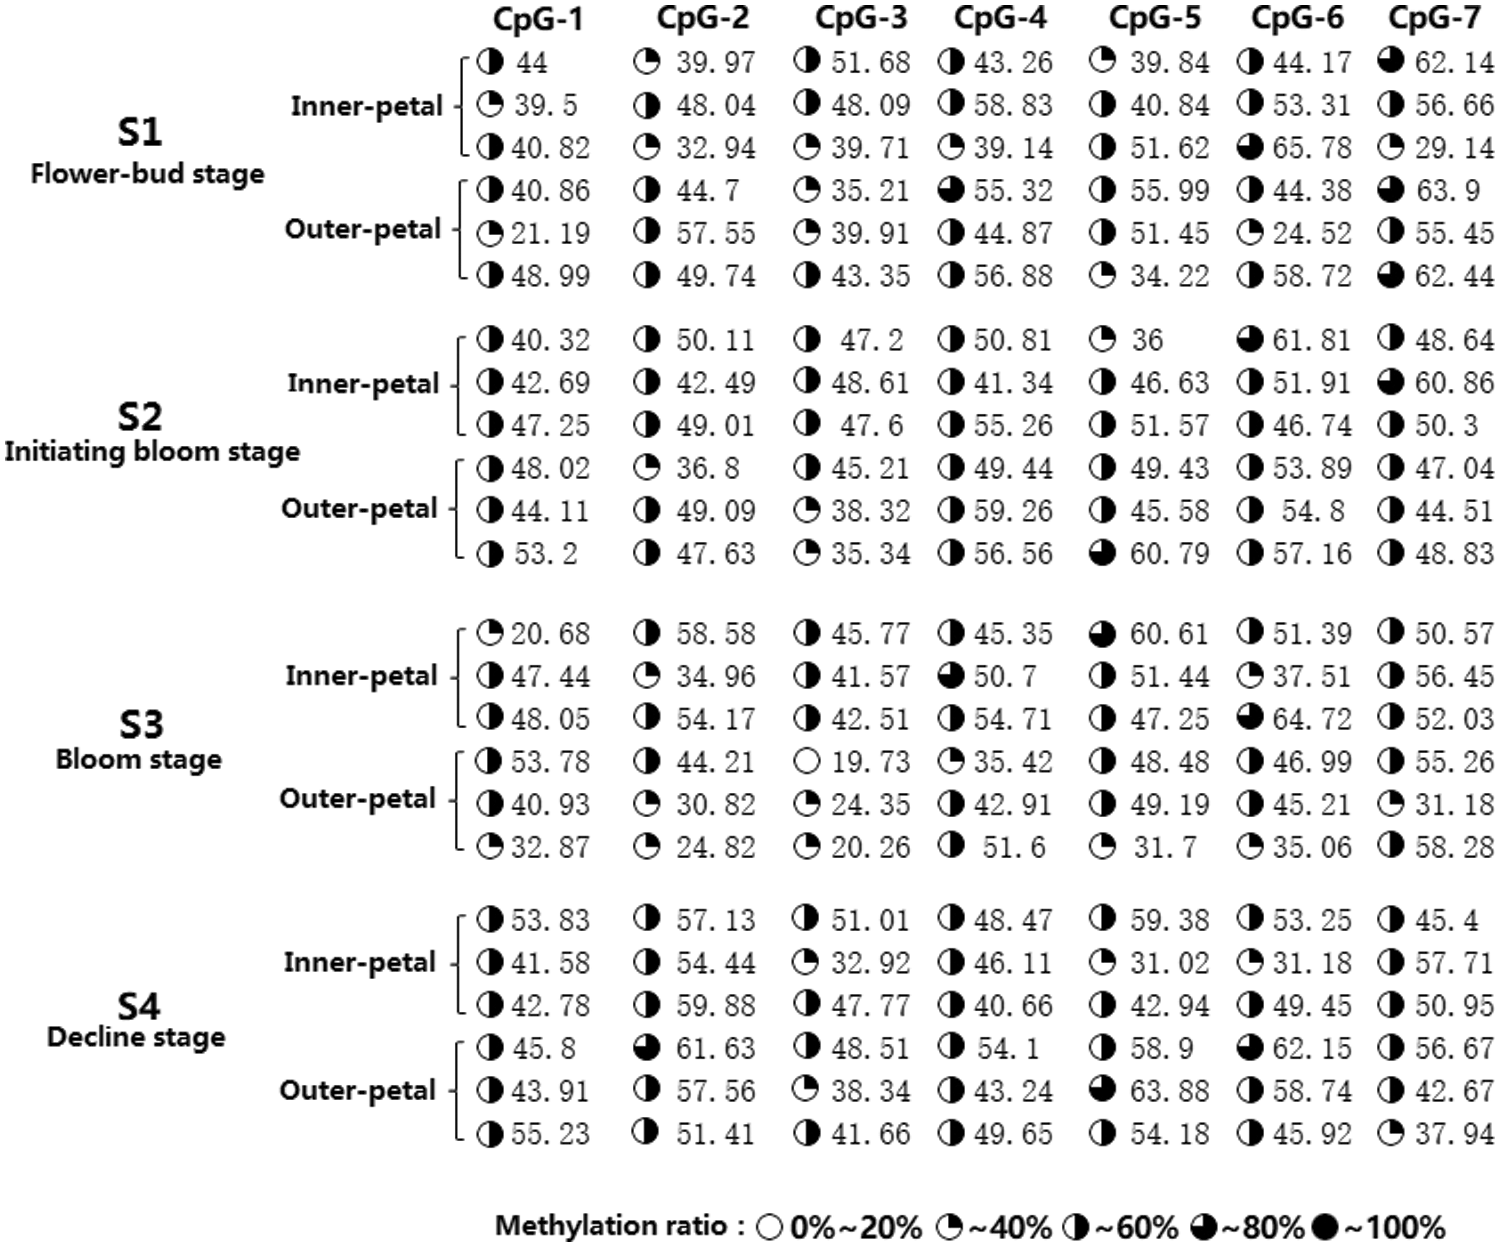
Figure 3: Methylation amplification products of the CpG island in P. lactiflora AP2 gene
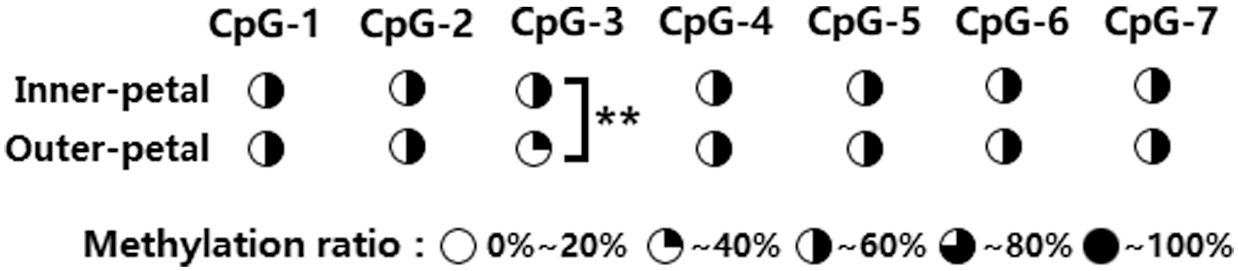
Figure 4: Differential analysis of the AP2 gene methylation level between the inner- and outer-petals of P. lactiflora. ** represents P < 0.01
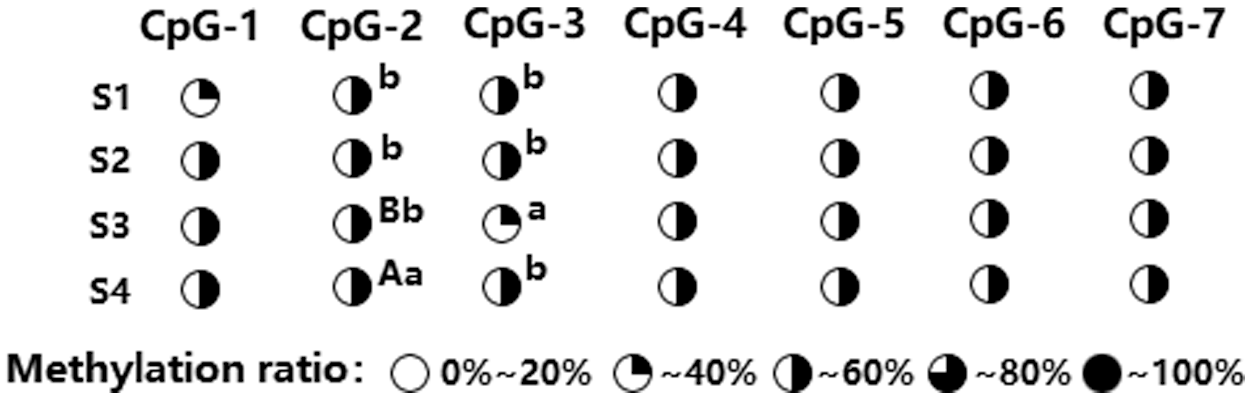
Figure 5: Differential analysis of AP2 gene methylation level among different developmental stages in P. lactiflora. Uppercase superscripts represent extremely significant difference (P < 0.01). Lowercase superscripts represent significant difference (P < 0.05)
3.4 Association between AP2 Methylation Status and mRNA Expression in P. lactiflora
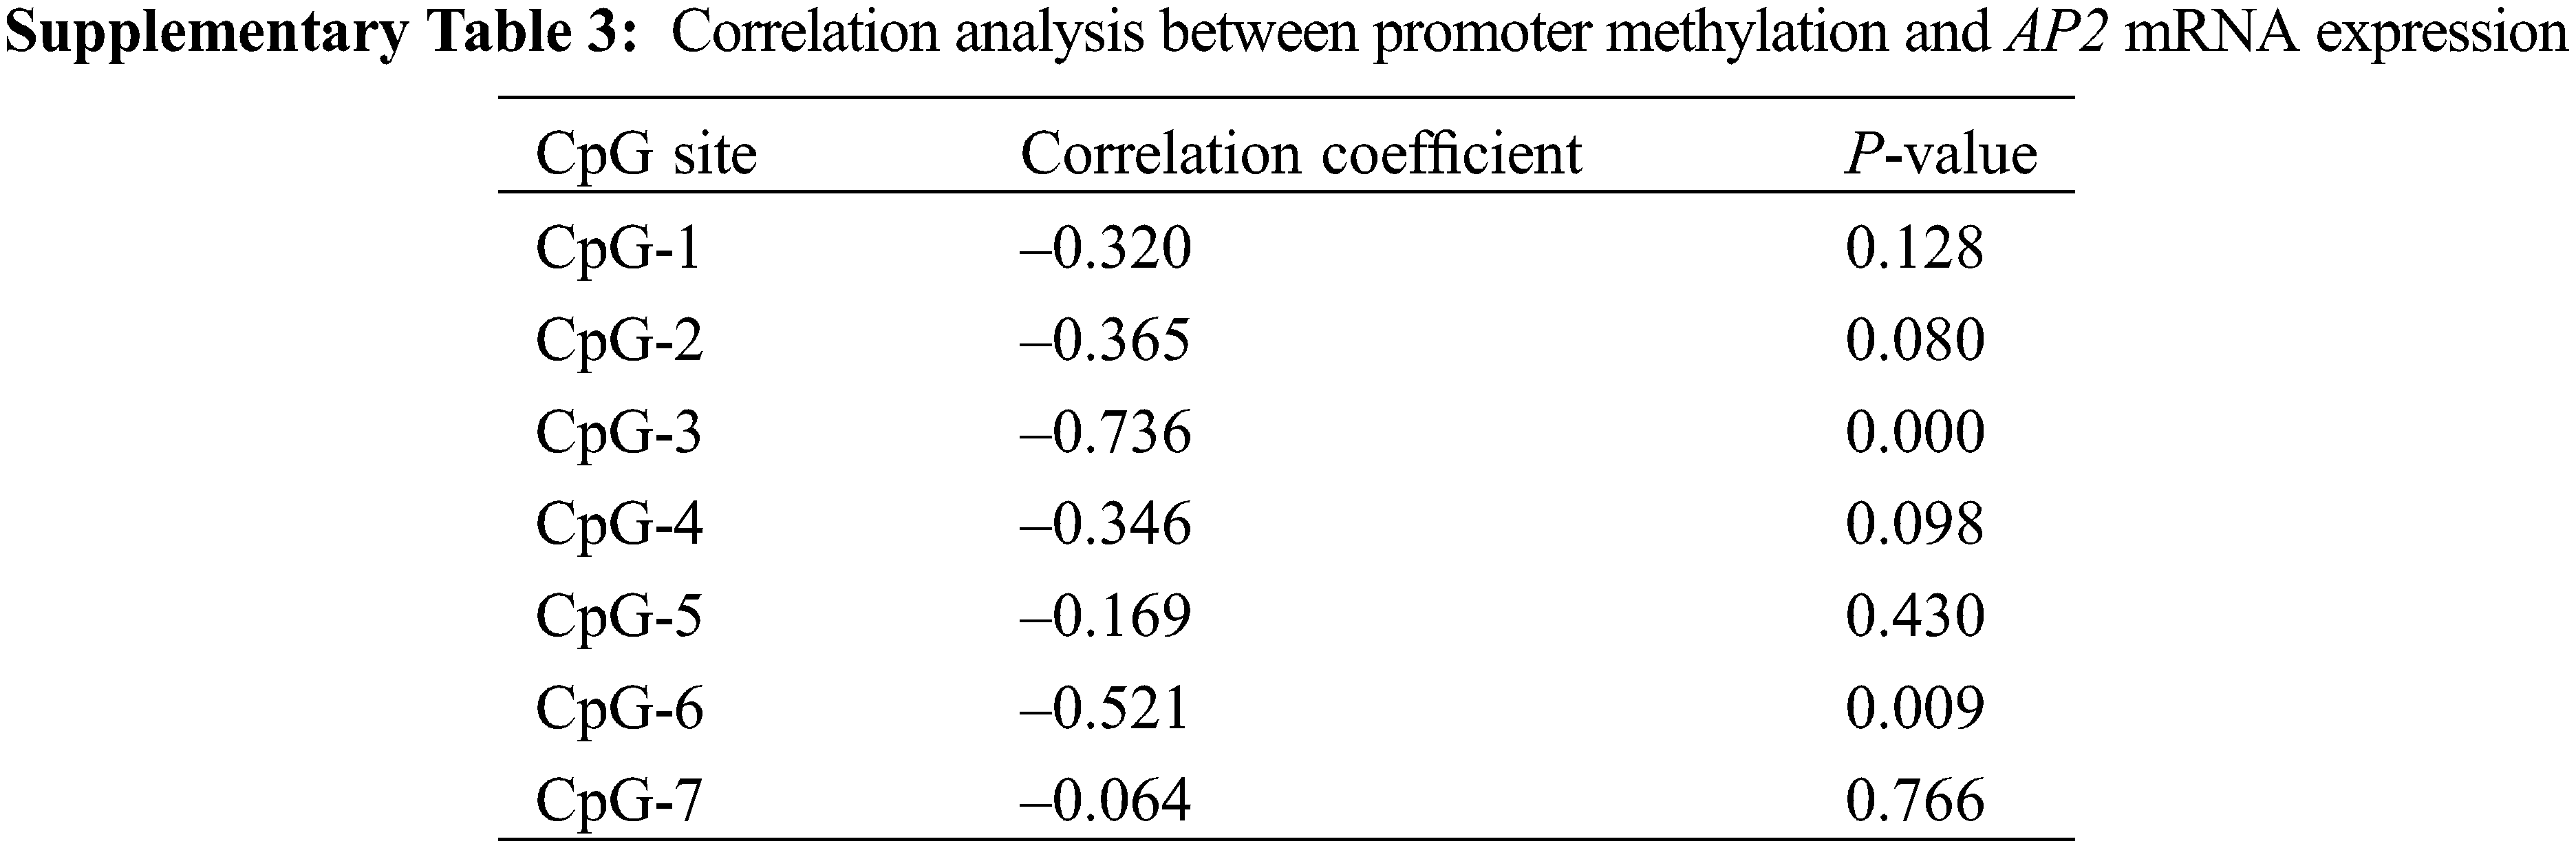
Based on the expression levels of AP2 at different developmental stages of ‘ZiFengyu’, a Pearson’s correlation analysis was performed to assess the relationship between methylation status and mRNA expression. Our results (Supplementary Table 3) indicated a negative association between the overall methylation status and mRNA levels of P. lactiflora AP2, with the CpG-3 and CpG-6 sites depicting a significant negative correlation with the AP2 mRNA expression (CpG-3, r = –0.736, P < 0.01; CpG-6, r = –0.521, P < 0.01).
3.5 Screening of the Transcription Factor Binding Site in P. lactiflora AP2 Promoter
In this study, bioinformatics analysis was performed to identify a critical CpG island region (−665∼−872 bp) of the P. lactiflora AP2 promoter, which was further predicted to harbor certain important transcription factor binding sites (TFBS), using the AliBaba software. Based on our results (Fig. 6), 11 potential TFBS were predicted in the CpG island region of the AP2 promoter, including NF-kappaB, GATA-1, Sp1, C/EBP, and so on. Moreover, given that the methylation degree at the CpG-3 and CpG-6 sites were significantly inversely proportional to AP2 mRNA expression (Supplementary Table 3), we found that the CpG-3 site was located at the binding site of the Sp1 transcription factor.
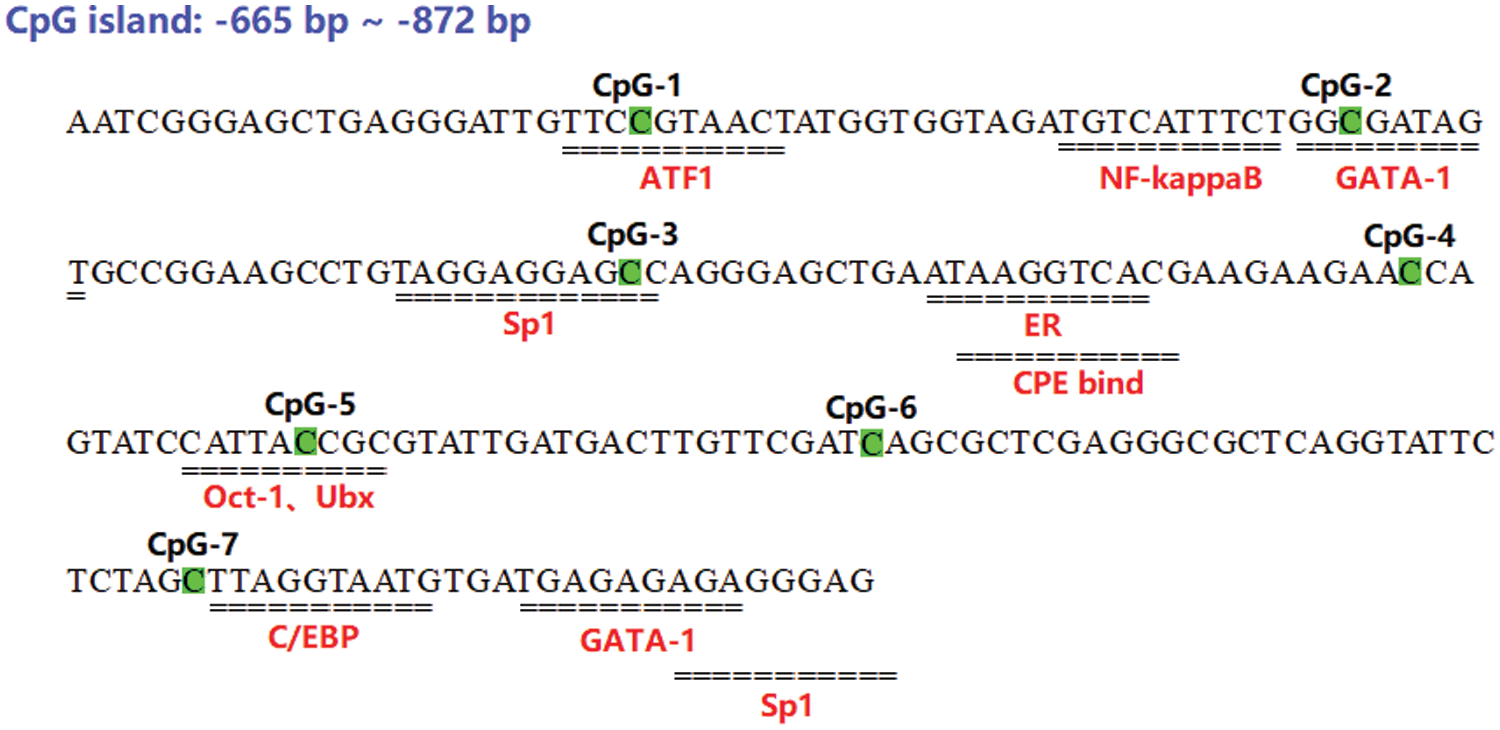
Figure 6: Prediction of transcription factor binding sites (TFBS) in the CpG region for methylation of the AP2 gene promoter
Being a class-A gene that regulates plant floral organ development, the flower-meristem-identity gene APETALA2 (AP2) contributes to the development of floral meristem, sepals, and petals [16]. In this study, we demonstrated obvious alterations in AP2 expression in the inner and outer petals of P. lactiflora at varying development stages. Numerous studies reported that heavily methylated CpG islands in the promotor region results in the downregulation of gene expression [17–19]. To clearly elucidate the underlying mechanisms regulating AP2 levels in P. lactiflora petals, we employed RACE cloning, chromosome walking, and bioinformatics analysis to identify one potential CpG island (−665∼−872 bp) in the AP2 promoter with multiple TFBS (NF-kappa B, GATA-1, Sp1, and C/EBP). There are, at present, three possible mechanisms that explain transcriptional inhibition via DNA methylation. First, promoter methylation directly renders the TFBS unavailable to transcription factors. Second, promoter methylation alters chromatin structure which, in turn, negatively affects transcription factor binding to DNA. Third, promoter methylation attracts specific transcription factor repressors which, in turn, prevents transcription factor binding to DNA [20]. Gene expression is generally modulated by transcription factors that interact with the cis-acting element of the respective gene promoters. Once interaction is established, a specific mechanism is initiated for gene expression. In addition, using bioinformatics analysis, it is possible to predict the presence of multiple effector elements within a promoter CpG island, indicating a great importance of the region in regulating subsequent gene expression.
Meissner et al. [21] reported that, in most organisms’ gene coding sequences, the CpG islands are sparsely distributed and are methylated under normal conditions. The methylation ratio declines with increasing age, which is negatively correlated with the expression of associated genes. Since the methylation rate of each CpG site can be accurately measured using BSP+Miseq, we used this method to study the methylation status of the CpG island region of the AP2 promoter. We detected 7 CpG sites, with varying degrees of methylation (average methylation > 40%). Among them, the methylation levels of the CpG-3 sites were significantly different between the inner and outer petals at varying stages of development, and they were all negatively correlated to one another. In terms of the CpG-3 site, methylation was observed on the Sp1 effector. We, therefore, speculated that, when the C on the CpG residue at this site was methylated, the binding of the effector to the transcription factor was inhibited. Barrera et al. [22] reported that the CpG islands in the promoter region contain multiple genomics elements, which play a wide variety of roles and functions in regulating gene transcription. Moreover, some specific CpG sites in this region play a key role as determinants of DNA methylation. Although the CpG island of each gene promoter contains multiple CpG sites, not all site methylation lead to changes in gene expression. It is possible that only CpG methylation located in the binding sites of essential transcription factors inhibits gene transcription and expression, thereby affecting gene function [23]. In this study, we revealed that the AP2 CpG-3 site interacts with the Sp1 transcription factor and its methylation negatively impacts AP2 gene expression. Hence, this site may be used as a key functional site for future research, as the methylation of the remaining 5 CpG sites showed no direct correlation with AP2 expression and may only play a supporting role. Interestingly, some studies also identified methylation-dependent transcription factors like hypoxia-inducible factor (HIF)-1α (HIF1A) [24], cAMP response element-binding proteins (CREB) [25], upstream transcription factor (USF) [26], and CCAAT/enhancer-binding protein β (C/EBPβ) [27]. Sp1-DNA interaction stimulates gene expression and its binding sequences can be found in multiples within gene promoters or enhancers [28,29]. In this study, we identified the methylation-regulated modulation of AP2 expression and identified its important functional cis-elements (CpG-3, Sp1). Our findings will provide theoretical guidance in the creation of new P. lactiflora varieties using gene-directed editing techniques and transgenic engineering. However, the transgenic process is often affected by the genome or gene-codon usage pattern and preferences, which makes it necessary to conduct relevant researches on the codon usage characteristics of the P. lactiflora AP2 modulation.
In conclusion, our study revealed the developmental expression pattern of the AP2 gene in P. lactiflora petals and obtained one CpG region (–665∼–872 bp) in the AP2 core promoter. Besides, our findings indicated that the methylation of CpG-3 sites has certain inhibitory effect on AP2 expression and affect the type formation of P. lactiflora flower. This study will enhance the knowledge of regulation of AP2 gene expression and its effect on P. lactiflora flower pattern development.
Author Contributions: J.T. and D.Z. planned and designed the experiments. Y.W., J.L. and Y.T. performed the experiments. Y.W. analyzed the data and wrote the manuscript. All authors carefully read and approved the final manuscript.
Funding Statement: This work was supported by the National Natural Science Funds (32102411), the Natural Science Foundation of Jiangsu Province of China (BK20200924), the Natural Science Foundation of Jiangsu Higher Education Institutions of China (20KJB210005), Jiangsu Association for Science and Technology Young Scientific and Technological Talents Project-Supported by Yanqing Wu, the Agricultural Science & Technology Independent Innovation Fund of Jiangsu Province (CX[20]3021), the Graduate Innovation Program of Jiangsu Province (XKYCX19_119) and the Excellent Doctoral Dissertation Fund of Yangzhou University.
Conflicts of Interest: The authors declare that they have no conflicts of interest to report regarding the present study.
1. Zhao, D. Q., Jiang, Y., Ning, C. L., Meng, J. S., Lin, S. S. et al. (2014). Transcriptome sequencing of a chimaera reveals coordinated expression of anthocyanin biosynthetic genes mediating yellow formation in herbaceous peony (Paeonia lactiflora Pall.). BMC Genomics, 15, 689. DOI 10.1186/1471-2164-15-689. [Google Scholar] [CrossRef]
2. Colombo, L., Franken, J., Koetje, E., Went, J., Dons, H. J. et al. (1995). The petunia MADS box gene FBP11 determines ovule identity. Plant Cell and Environment, 7(11), 1859–1868. DOI 10.1105/tpc.7.11.1859. [Google Scholar] [CrossRef]
3. Pelaz, S., Ditta, G. S., Baumann, E., Wisman, E., Yanofsky, M. F. (2000). B and C floral organ identity functions require sepallata MADS-box genes. Nature, 405(6783), 200–203. DOI 10.1038/35012103. [Google Scholar] [CrossRef]
4. Pelaz, S., Gustafson-Brown, C., Kohalmi, S. E., Crosby, W. L., Yanofsky, M. F. (2001). APETALA1 and Sepallata3 interact to promote flower development. Plant Journal, 26(4), 385–394. DOI 10.1046/j.1365-313x.2001.2641042.x. [Google Scholar] [CrossRef]
5. Jofuku, K. D., den Boer, B. G., van Montagu, M., Okamuro, J. K. (1994). Control of arabidopsis flower and seed development by the homeotic gene APETALA2. Plant Cell and Environment, 6(9), 1211–1225. DOI 10.2307/3869820. [Google Scholar] [CrossRef]
6. Liljegren, S. J., Ditta, G. S., Eshed, Y., Savidge, B., Bowman, J. L. et al. (2000). Shatter proof MADS-box genes control seed dispersal in Arabidopsis. Nature, 404, 766–770. DOI 10.1038/35008089. [Google Scholar] [CrossRef]
7. Moschin, S., Nigris, S., Ezquer, I., Masiero, S., Cagnin, S. et al. (2021). Expression and functional analyses of nymphaea caerulea MADS-box genes contribute to clarify the complex flower patterning of water lilies. Frontiers in Plant Science, 12, 730270. DOI 10.3389/fpls.2021.730270. [Google Scholar] [CrossRef]
8. Wu, Y., Tang, Y., Jiang, Y., Zhao, D., Shang, J. et al. (2018). Combination of transcriptome sequencing and iTRAQ proteome reveals the molecular mechanisms determining petal shape in herbaceous peony (Paeonia lactiflora Pall.). Bioscience Reports, 38(6), BSR20181485. DOI 10.1042/BSR20181485. [Google Scholar] [CrossRef]
9. Flores, E. M., Woeller, C. F., Falsetta, M. L., Susiarjo, M., Phipps, R. P. (2018). Thy1 (CD90) expression is regulated by DNA methylation during adipogenesis. FASEB Journal, 33(3), 3353–3363. DOI 10.1096/fj.201801481R. [Google Scholar] [CrossRef]
10. Bender, J. (2004). DNA methylation and epigenetics. Annual Review of Plant Biology, 55, 41–68. DOI 10.1146/annurev.arplant.55.031903.141641. [Google Scholar] [CrossRef]
11. Wang, R. X., Xu, J. H. (2004). Genomic DNA methylation and histone methylation. Yi Chuan, 36(3), 191–199 (in Chinese). DOI 10.3724/SP.J.1005.2014.0191. [Google Scholar] [CrossRef]
12. Zeng, Y., Chen, T. (2019). DNA methylation reprogramming during mammalian development. Genes, 10, 257. DOI 10.3390/genes10040257. [Google Scholar] [CrossRef]
13. Greenberg, M. V. C., Bourc’his, D. (2019). The diverse roles of DNA methylation in mammalian development and disease. Nature Reviews Molecular Cell Biology, 20(10), 590–607. DOI 10.1038/s41580-019-0159-6. [Google Scholar] [CrossRef]
14. Guo, L. D., Hyde, K. D., Liew, E. C. Y. (2000). Identification of endophytic fungi from livistona chinensis based on morphology and rDNA sequences. New Phytologist, 147(3), 617–630. DOI 10.1046/j.1469-8137.2000.00716.x. [Google Scholar] [CrossRef]
15. Livak, K. J., Schmittgen, T. D. (2001). Analysis of relative gene expression data using real-time quantitative PCR and the 2(-Delta delta C(T)) method. Methods, 25(4), 402–408. DOI 10.1006/meth.2001.1262. [Google Scholar] [CrossRef]
16. Maes, T., van de Steene, N., Zethof, J., Karimi, M., D’Hauw, M. et al. (2001). Petunia AP2-like genes and their role in flower and seed development. Plant Cell, 13(2), 229–244. DOI 10.1105/tpc.13.2.229. [Google Scholar] [CrossRef]
17. Ghosh, N., Gyory, I., Wright, G., Wood, J., Wright, K. L. et al. (2001). Positive regulatory domain I binding factor 1 silences class II transactivator expression in multiple myeloma cells. Journal of Biological Chemistry, 276(18), 15264–15268. DOI 10.1074/jbc.M100862200. [Google Scholar] [CrossRef]
18. Kanaseki, T., Ikeda, H., Takamura, Y., Toyota, M., Hirohashi, Y. et al. (2003). Histone deacetylation, but not hypermethylation, modifies class II transactivator and MHC class II gene expression in squamous cell carcinomas. Journal of Immunology, 170, 4980–4985. DOI 10.4049/jimmunol.170.10.4980. [Google Scholar] [CrossRef]
19. Satoh, A., Toyota, M., Ikeda, H., Morimoto, Y., Akino, K. et al. (2004). Epigenetic inactivation of class II transactivator (CIITA) is associated with the absence of interferon-gamma-induced HLA-DR expression in colorectal and gastric cancer cells. Oncogene, 23(55), 8876–8886. DOI 10.1038/sj.onc.1208144. [Google Scholar] [CrossRef]
20. Momparler, R. L., Bovenzi, V. (2000). DNA methylation and cancer. Journal of Cellular Physiology, 183, 145–154. DOI 10.1002/(SICI)1097-4652(200005)183:2<145::AID-JCP1>3.0.CO;2-V. [Google Scholar] [CrossRef]
21. Meissner, M., Reichert, T. E., Kunkel, M., Gooding, W., Whiteside, T. L. et al. (2005). Defects in the human leukocyte antigen class I antigen processing machinery in head and neck squamous cell carcinoma: Association with clinical outcome. Clinical Cancer Research, 11(7), 2552–2560. DOI 10.1158/1078-0432.CCR-04-2146. [Google Scholar] [CrossRef]
22. Barrera, V., Peinado, M. A. (2012). Evaluation of single CpG sites as proxies of CpG island methylation states at the genome scale. Nucleic Acids Research, 40(22), 11490–11498. DOI 10.1093/nar/gks928. [Google Scholar] [CrossRef]
23. Xie, X. L., Yu, Y., Yuan, Z. F., Yang, J., Ma, P. P. et al. (2012). Comparative analysis on content and distribution of CpG sites in milk production traits and mastitis-related genes in dairy cattle. Hereditas, 34(4), 437–444. DOI 10.3724/SP.J.1005.2012.00437. [Google Scholar] [CrossRef]
24. Walczak-Drzewiecka, A., Ratajewski, M., Pułaski, Ł, Dastych, J. (2010). DNA Methylation-dependent suppression of HIF1A in an immature hematopoietic cell line HMC-1. Biochemical and Biophysical Research Communications, 391(1), 1028–1032. DOI 10.1016/j.bbrc.2009.12.011. [Google Scholar] [CrossRef]
25. Kim, H. P., Leonard, W. J. (2007). CREB/ATF-dependent T cell receptor-induced FoxP3 gene expression: A role for DNA methylation. Journal of Experimental Medicine, 39(1), 1543–1551. DOI 10.1084/jem.20070109. [Google Scholar] [CrossRef]
26. Fujii, G., Nakamura, Y., Tsukamoto, D., Ito, M., Shiba, T. et al. (2006). CpG methylation at the USF-binding site is important for the liver-specific transcription of the chipmunk HP-27 gene. Biochemical Journal, 395, 203–209. DOI 10.1042/BJ20051802. [Google Scholar] [CrossRef]
27. Sun, L., Wang, J., Yin, X. M., Sun, S. Y., Zi, C. et al. (2016). Identification of a 5-methylcytosine site that may regulate C/EBPβ binding and determine tissue-specific expression of the BPI gene in piglets. Scientific Reports, 6(1), 28506. DOI 10.1038/srep28506. [Google Scholar] [CrossRef]
28. Zhu, W. G., Srinivasan, K., Dai, Z., Duan, W., Druhan, L. J. et al. (2003). Methylation of adjacent CpG sites affects Sp1/Sp3 binding and activity in the p21Cip1 promoter. Molecular and Cellular Biology, 23(12), 4056–4065. DOI 10.1128/MCB.23.12.4056-4065.2003. [Google Scholar] [CrossRef]
29. Isomura, H., Stinski, M. F., Kudoh, A., Daikoku, T., Shirata, N. et al. (2005). Two Sp1/Sp3 binding sites in the major immediateearly proximal enhancer of human cytomegalovirus have a significant role in viral replication. Journal of Virology, 79, 9597–9607. DOI 10.1128/JVI.79.15.9597-9607.2005. [Google Scholar] [CrossRef]
Supplemental Information
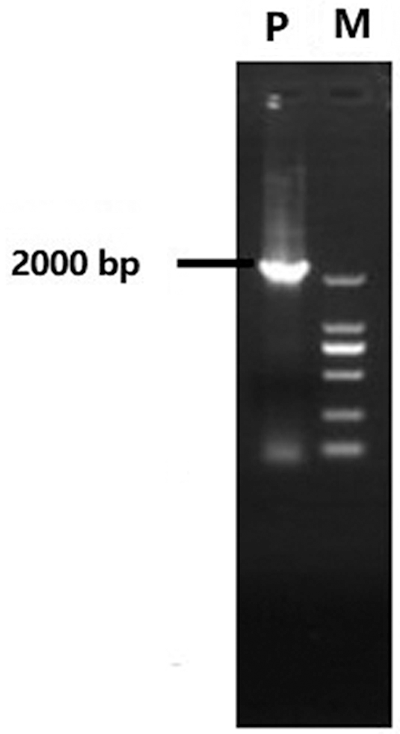
Supplementary Figure 1: Genome walking of AP2 gene promoter region in P. lactiflora. P: PCR product of promoter; M: DL2000
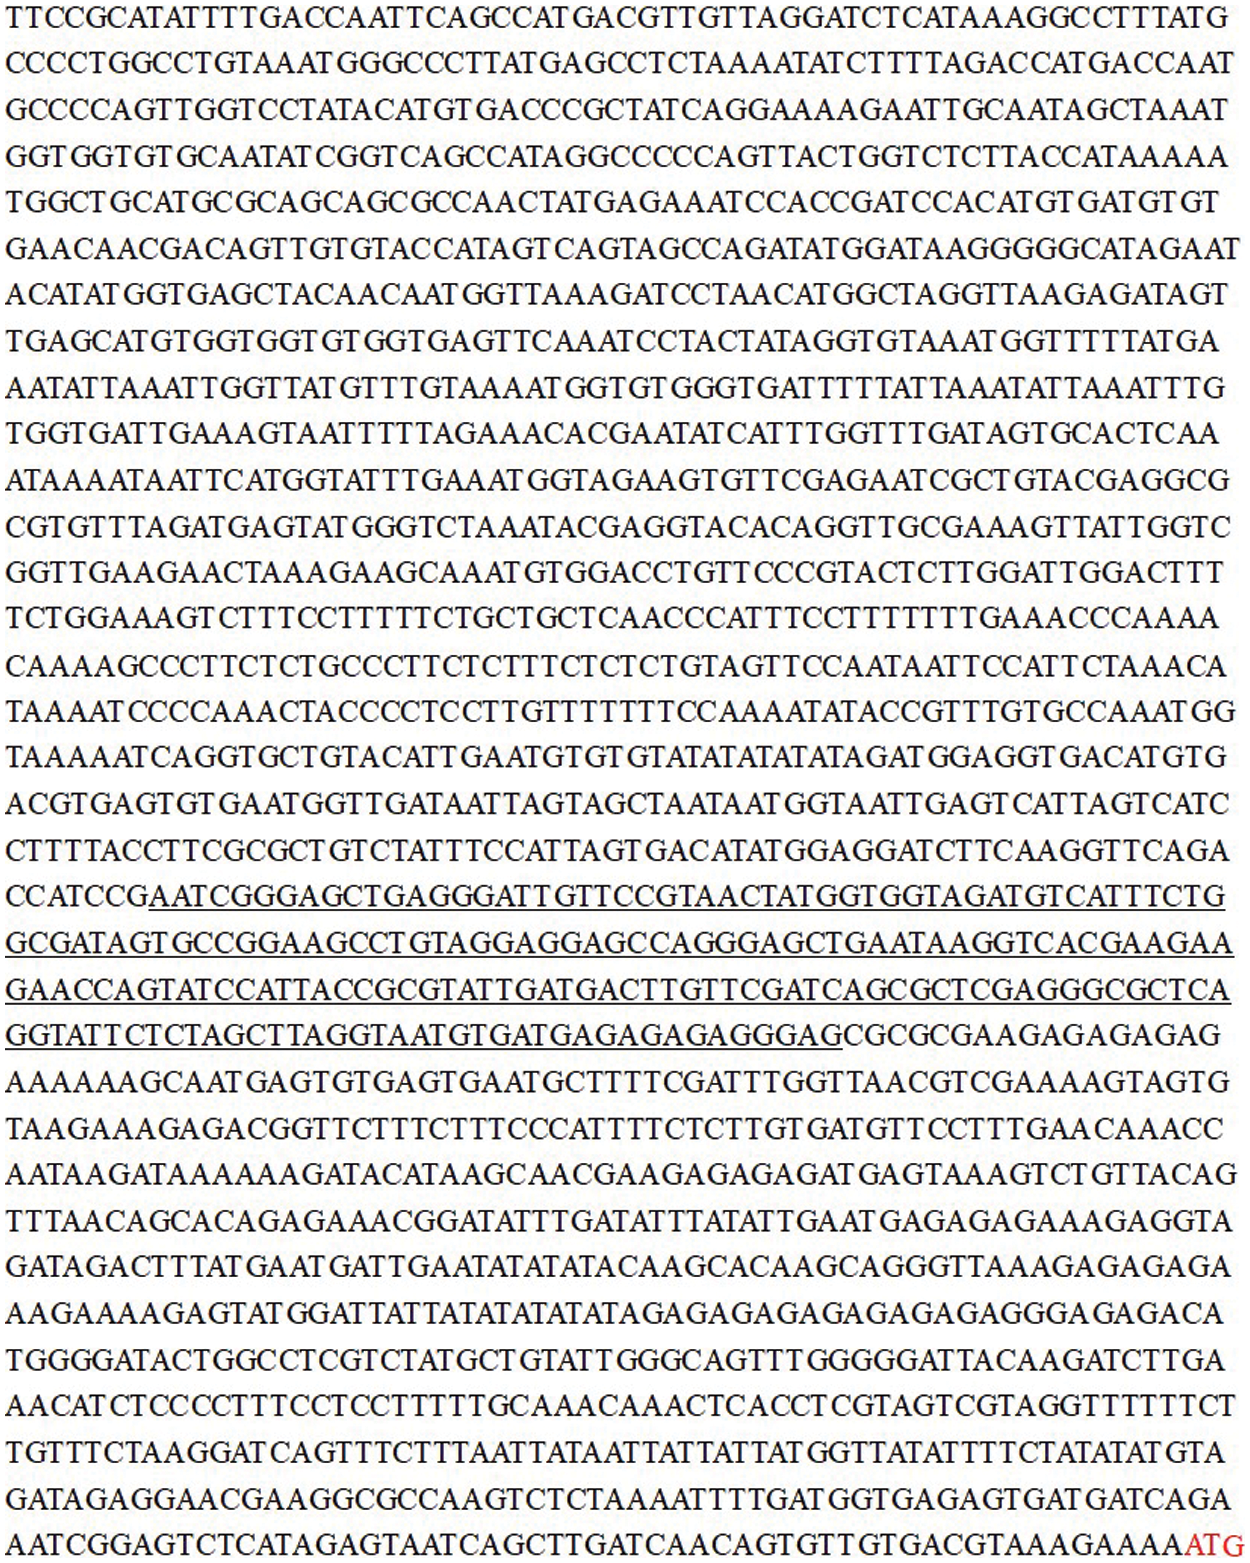
Supplementary Figure 2: Promoter region of AP2 gene in P. lactiflora. Sequence with underline represents the CpG island; Red ATG represents initiation codon
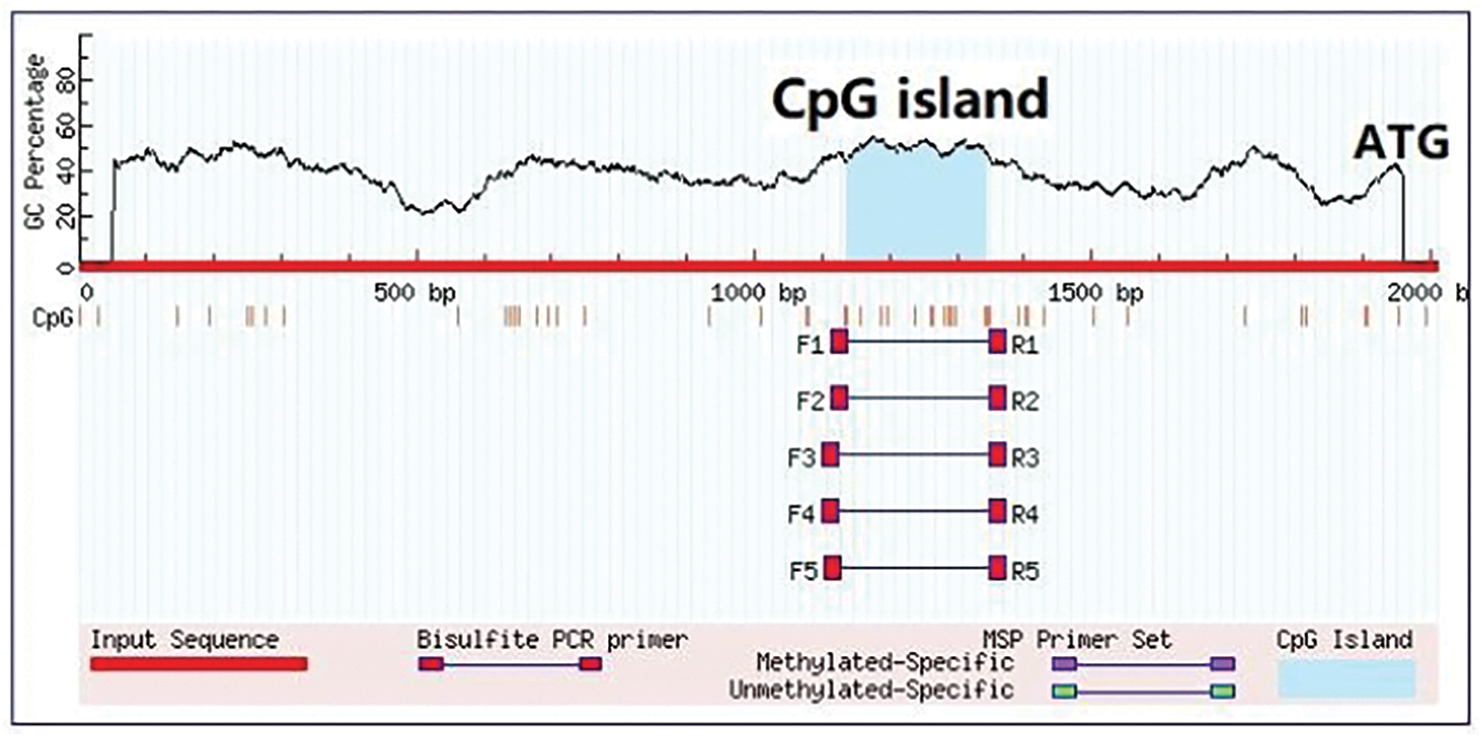
Supplementary Figure 3: CpG-island prediction and primer design of P. lactiflora AP2 gene
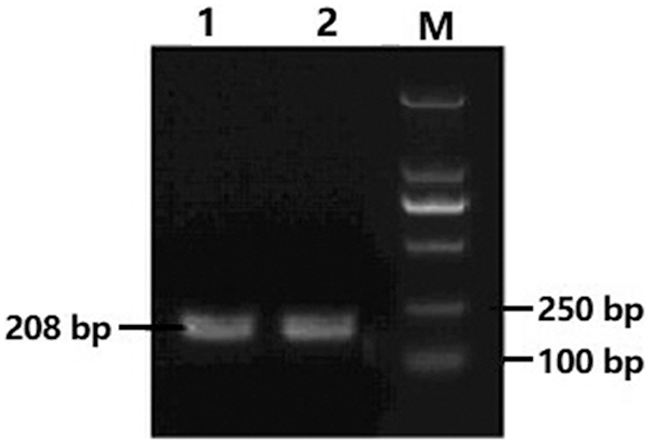
Supplementary Figure 4: Methylation amplification products of CpG island of P. lactiflora AP2 gene. 1, 2: PCR product; M: DL2000
 | This work is licensed under a Creative Commons Attribution 4.0 International License, which permits unrestricted use, distribution, and reproduction in any medium, provided the original work is properly cited. |