| Structural Durability & Health Monitoring |
DOI: 10.32604/sdhm.2021.013737
ARTICLE
Guided Wave Based Damage Detection Method for Aircraft Composite Structures under Varying Temperatures
1Sun Yat-Sen University, Guangzhou, 510275, China
2China Academy of Launch Vehicle Technology, Beijing, 100076, China
3Dalian University of Technology, Dalian, 116024, China
*Corresponding Author: Zhanjun Wu. Email: wuzhj@dlut.edu.cn
Received: 19 August 2020; Accepted: 30 September 2020
Abstract: Guided waves based damage detection methods using base signals offer the advantages of simplicity of signal generation and reception, sensitivity to damage, and large area coverage; however, applications of the technology are limited by the sensitivity to environmental temperature variations. In this paper, a Spearman Damage Index-based damage diagnosis method for structural health condition monitoring under varying temperatures is presented. First, a PZT sensor-based Guided wave propagation model is proposed and employed to analyze the temperature effect. The result of the analysis shows the wave speed of the Guided wave signal has higher temperature sensitivity than the signal fluctuation features. Then, a Spearman rank correlation coefficient-based damage index is presented to identify damage of the structure under varying temperatures. Finally, a damage detection test on a composite plate is conducted to verify the effectiveness of the Spearman Damage Index-based damage diagnosis method. Experimental results show that the proposed damage diagnosis method is capable of detecting the existence of the damage and identify its location under varying temperatures.
Keywords: Structure health monitoring; Guided wave; temperature effect; Spearman rank correlation coefficient; damage index
Structural damage to aircraft under varying temperatures not only significantly reduces the performance of aircraft but also increases the thermal loads, resulting in structural failure [1]. Therefore, it is necessary to detect damage to aircraft structures under varying temperatures. In recent years, PZTs-Guided waves based damage detection methods have shown great potential in Structural Health Monitoring (SHM) applications for aircraft structures [2]. The damage diagnosis method which is based on the comparison of Guided wave signals representing base condition and the damaged condition is the most widely used damage identification method in the Guided waves-based SHM technology [3,4]. However, temperature variations of aircraft structures have significant effects on guided wave propagation and therefore increase the detection uncertainty of the guided wave-based structural health monitoring system [5].
Many attempts have been made towards the temperature effects in Guided wave-based SHM technology and the temperature compensation method [6–9]. Salamone et al. [10] performed health monitoring of fiber-reinforced composite panels using ultrasonic guided waves and flexible piezoelectric composite transducer patches in the environment of a varying temperature corresponding to normal aircraft operations. Santoni-Bottai et al. [11] presented an experimental evaluation of the structural health monitoring capability of piezoelectric wafer active sensors on composite structures at cryogenic temperatures. Marzani et al. [12] proposed a numerical approach based on a Semi-Analytical Finite Element (SAFE) model to predict temperature effects on guided waves generated and received by PZT transducers. Konstantinidis et al. [13] investigated the robustness of the signal processing used in a structural health monitoring system utilizing permanently attached guided wave sensors. Dao et al. [14] demonstrated how to remove the undesired temperature effect from Guided wave data. The method is based on the concept of counteraction that is partially built on the analysis of the non-stationary behavior of time series. Gao et al. [15] presents optimal operating modes for the factors to maximize the detection capability of a given SHM technology in a service environment. The effectiveness of the SHM techniques for aircraft composite structure applications in the real world is verified by the experimental results. Michaels et al. [16,17] presented a methodology for applying diffuse ultrasonic waves to the problem of detecting structural damage in the in-situ environment. Clarke et al. [18] investigated how a temperature compensation method can be used to reduce the number of signals required in the database, and an airframe panel was tested by using a temperature compensation strategy. Raghavan et al. [19] presented the guided-wave SHM method using surface-bonded piezoelectric wafer transducers in metallic plates for the temperature range encountered in internal spacecraft structures (20–150°C). Mazzeranghi et al. [20] describe some procedures aimed at minimizing the effects of disturbance on AU signals caused by temperature variation, allowing the use of AU for monitoring over extended periods or when the component is subjected to heating. Richard et al. [21] examine the hypothesis that the phase drifts are due to temperature fluctuations by theoretical analysis and experimental research. Konstantinidis et al. [22] investigate a system for the SHM of plate-like structures using guided waves in the variation of environmental conditions. Wang et al. [23] developed a novel temperature compensation technique combining an adaptive filter and optimal baseline selection to enhance the robustness and effectiveness of guided wave-based damage detection.
In this paper, a Spearman rank correlation coefficient-based damage detection method for aircraft structures under varying temperatures is developed. The proposed method is capable of detecting the damage location in a varying temperature environment, and each base signal could cover a temperature range of 18°C. First, temperature effects in the propagation characteristic of guided waves are investigated by a modeling analysis. A model which includes the PZT sensor, a shear lag model of the adhesive layer and substrate structure is proposed to predict guided wave signal features with a minimum sensitivity of the temperature. Then, a signal Spearman damage index-based damage diagnosis method is developed for damage detection under changing environmental temperature. Finally, a damage detection experiment was performed on a composite plate under varying temperatures environment. The experimental results show that the proposed damage diagnosis method is capable of detecting the existence of damage and identifying its location under changing environmental temperature. Each base signal could cover a wider range of temperature by using the Spearman DI-based damage diagnosis method.
2 Thermal Sensitivity of Guided Waves from Excitation, Propagation to Collection
The temperature sensitivity of Guided Wave signal features is investigated by a model that accounts for temperature effects on the transducer piezoelectric-mechanical properties, the transducer panel interaction, and the panel wave dispersion properties. The analysis was performed in the simplified case of S0 mode Guided waves, which is an important method in SHM applications.
In the excitation process of guided waves, the electrical energy of the input voltage applied to the PZT actuator is converted through piezoelectric transduction into mechanical energy that activates the expansion-contraction model of the PZT receiver [24]. This motion is then propagated into the underlying structure through the shear stress in the adhesive layer at the actuator structure interface. As a result, the guided waves are excited into the plate.
The PZT actuator transfers the electrical signal into the mechanical signal through the inverse piezoelectric effect. Assuming no external mechanical stresses
According to the literature [25], the Rayleigh–Guided dispersion equation:
Dispersion is the phenomenon in which the phase velocity of a wave depends on its frequency and material property. Apparently, dispersion characteristics of a Guided wave depend on environment temperature.
The attenuation of Guided waves is essentially due to the viscoelastic damping properties of composite [26].
According to the Rayleigh damping model, the ratio of strains of two points that are ‘x’ apart on the plate is:
where,
where,
When propagating waves reach the receiver, the mechanical energy is converted to electrical energy by the PZT receiver.
The sensor strain
where,
where,
Correlative references [26–28] showed the parabolic relationship between parameters and temperature. The changing trends are shown as follows:
where,
A 5-count Hanning window tone-burst signal is applied to the actuator.
where A is the amplitude of excitation signal, f is the frequency of excitation signal. The distance between actuator and sensor is 0.15 m.
The dispersion curves regarding the phase velocity and the group velocity are shown in Fig. 1, for the two temperatures of 10°C and 60°C.
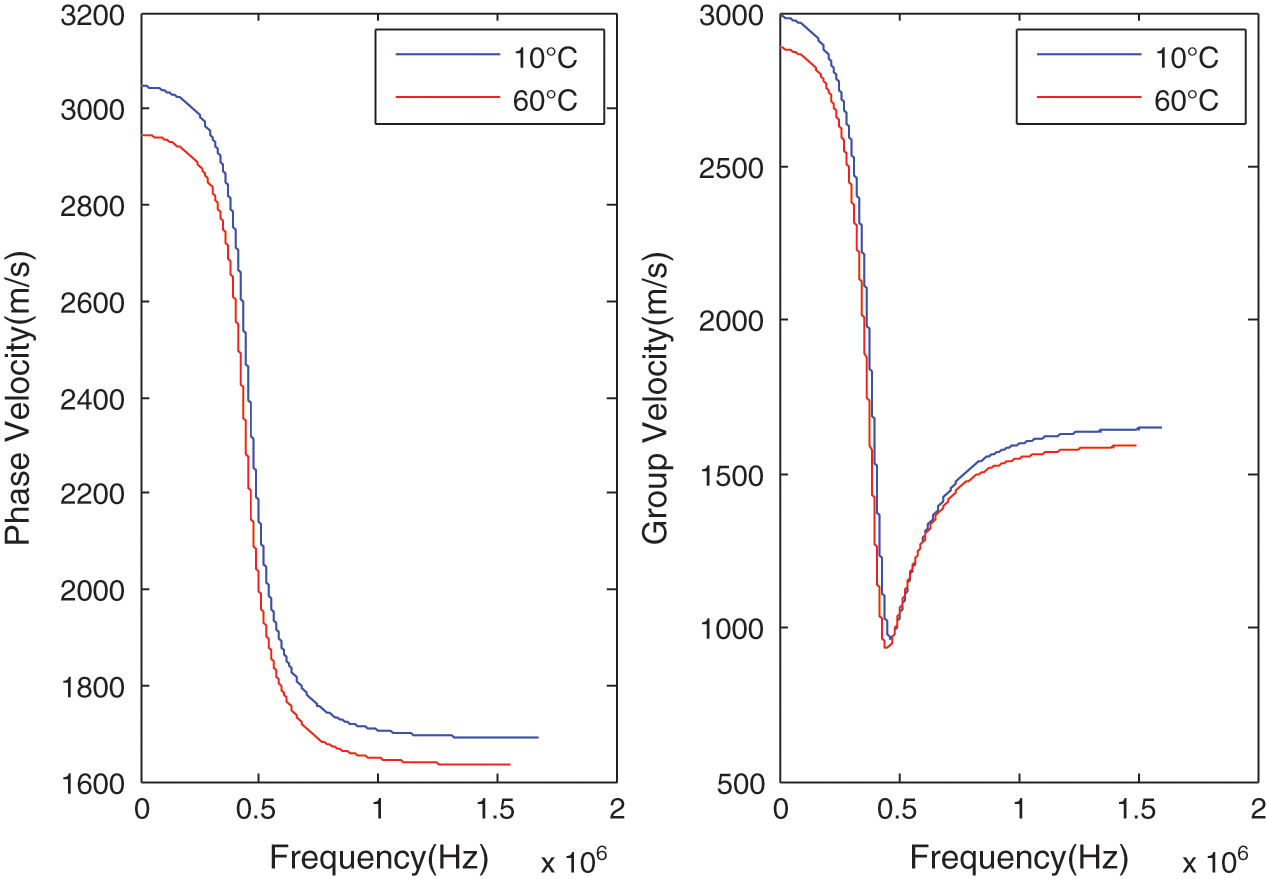
Figure 1: Phase velocity and the group velocity of Guided wave under changed temperatures
As shown in Fig. 1, the phase velocity and group velocity of the Guided Wave decrease with the increase of the temperature. Varying temperatures induced variation of the modulus of resin matrix composite plate led to a reduction of the speeds of bulk waves and propagation velocities of Guided waves.
The first peak of the response signals was considered as the response amplitude of the PZT receiver. Fig. 2 describes the results of the parameter study for response amplitudes under varying temperature and frequency environment. The resulting relative response amplitudes plots are presented as 3D mesh plot.
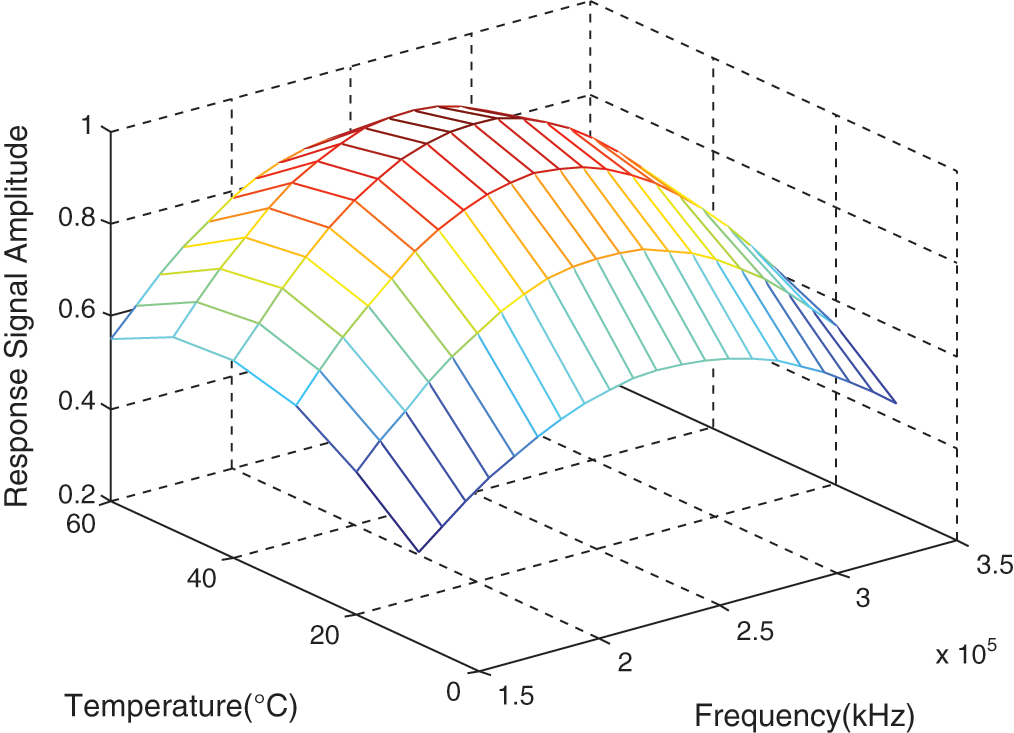
Figure 2: Theoretical response amplitude of PZT receiver under varying temperatures and frequencies
As shown in Fig. 2, these results are clarifying: The optimal frequency for actuator output decreases from 240 kHz to 220 kHz when the temperature increases from 10°C to 60°C.
Temperature-dependent parameters are substituted into the numerical model of guided waves. Theoretical S0 mode signals of 250 kHz under varying temperatures are shown in Fig. 3.
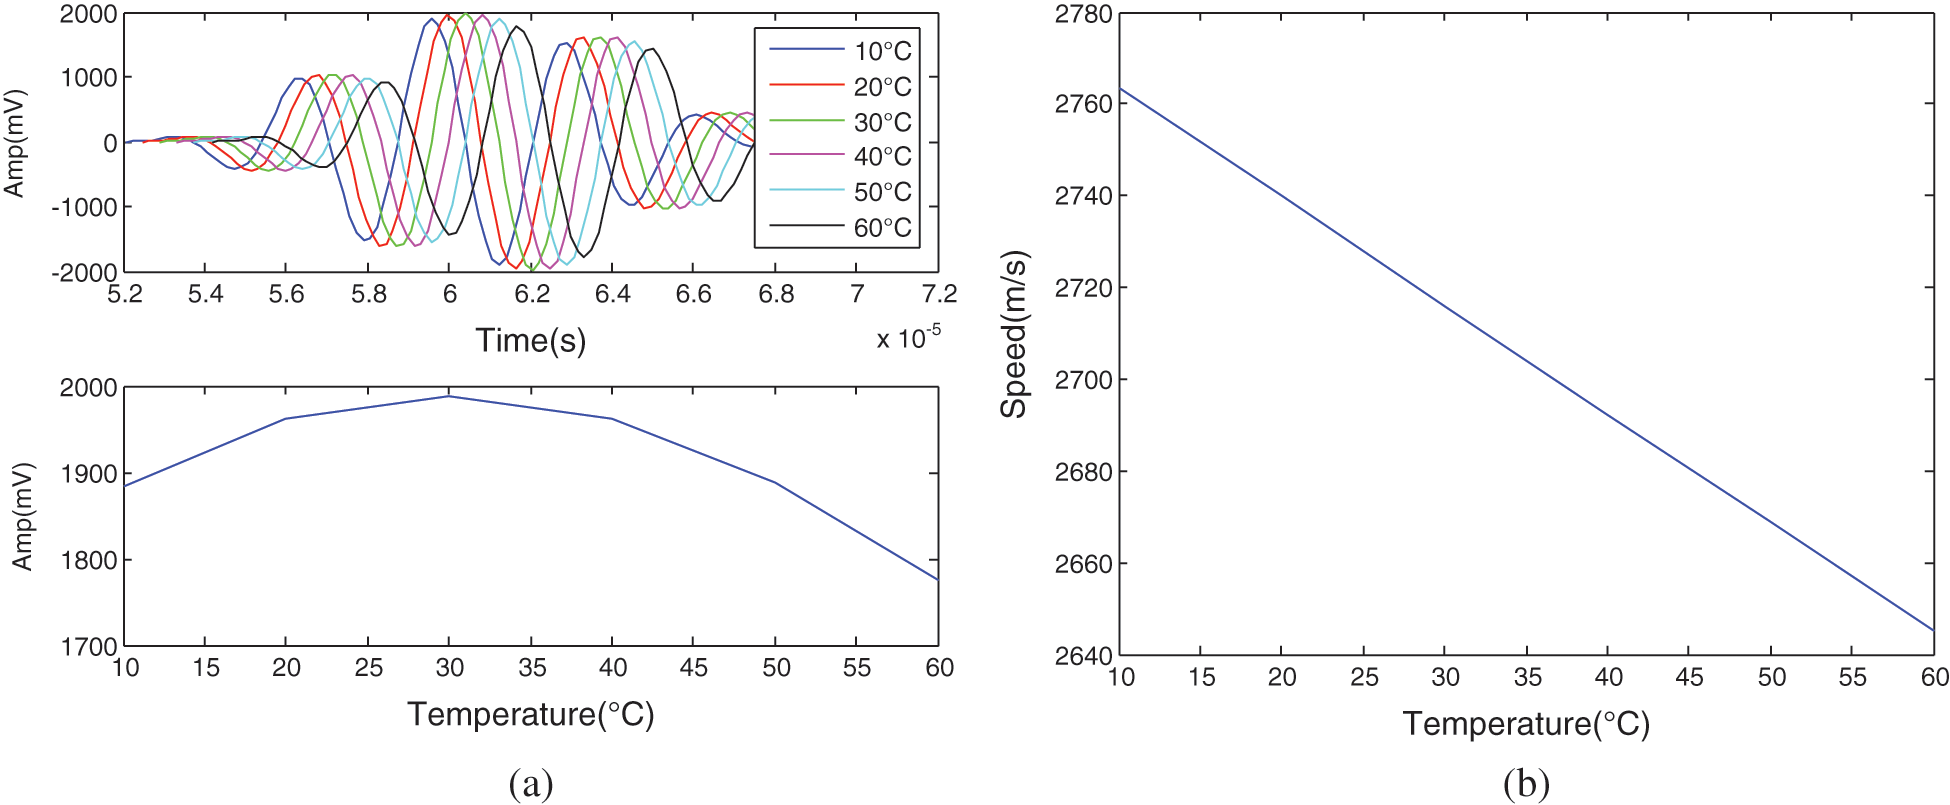
Figure 3: Theoretical signal under varying temperatures (10°C~60°C) (a) Signal waveform of S0 mode (b) Group velocity of S0 mode
As shown in Figs. 3a and 3b, as the modification of temperature phase delay will appear, the group velocity of S0 mode linearly decreases with increasing temperature. As shown in Fig. 3a, The signal amplitudes will increase with the increase of temperature when the temperature below 30°C. When the temperature exceeds 30°C, the amplitudes will decline with increasing temperature. That’s because below 30°C activity increasing of PZT sensors play a dominant role while exceeding 30°C, performance degradation of the adhesive layer plays a dominant role. As expected, the result of modeling analysis shows that a temperature increase causes a reduction in the wave speed of the Guided wave signal, and wave speed shows higher temperature sensitivity than signal fluctuation. That’s because the elasticity modulus of the plate decreases linearly with the increase of temperature.
Therefore, the signal swing features are more suitable to be the damage index than the signal wave speed such features, such as covariance.
3 Spearman DI-Based Damage Diagnosis Method
In the Guided wave-based damage diagnosis method, temperature variations have significant effects on guided wave propagation and therefore increase the detection uncertainty of the guided wave-based structural health monitoring system [5]. So this is necessary to use a signal feature with minimum sensitivity to the temperature variations as the damage index of the damage identification method.
Damage imaging diagnosis is divided into three steps: Preprocessing step, damage feature extraction step, and imaging diagnosis step. In the first step, the monitored region is discrete into pixels. Then, damage indexes (DIs) of different paths are obtained by comparing the base signal with a current signal which is collected after load. In the last step of the method, the probability damage region was delineated by the probability-based damage diagnosis imaging method combined with an empirical threshold value. Finally, damage shape and severity were outputted as the result of the damage imaging diagnosis stage.
Pearson correlation coefficient between two variables is defined as the covariance of the two variables divided by the product of their standard deviations. The form of the definition involves a “product moment,” that is, the mean (the first moment about the origin) of the product of the mean-adjusted random variables; hence the modifier product-moment in the name.
Pearson’s correlation coefficient is commonly represented as follows:
where,
The Spearman correlation coefficient is defined as the Pearson correlation coefficient between the ranked variables. Ranked variables mean that identical values (rank ties or value duplicates) are assigned a rank equal to the average of their positions in the ascending order of the values. For a sample of size n, the n raw scores
In this stage, the monitored region is discretized into a grid of pixels based on the required resolution in X and Y directions. The interpolation coefficient of for pixel D is shown as follows:
Scaling parameter h is employed to control the area influenced by the
n is the number of signal paths. The probability of damage presence at node D is defined by Eq. (12), and the pixel value field will be projected onto XY plane in form of the damage distribution diagram of monitoring region. Color distribution in the imaging represents local damage severity. The damage area is highlighted by the red patch.
Delamination extension determination is performed in a full-scale composite horizontal tail under static load to illustrate the detection capability of the damage diagnosis strategy.
4 Damage Identification Experiments on Composite under Varying Temperatures
A realistic damage (countersink) detection experiment on the composite plate has been performed to verify the robustness of the Spearman DI damage diagnosis method under varying temperature.
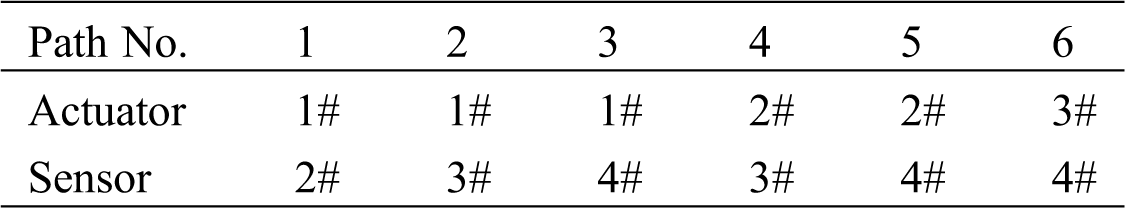
A glass fiber composite plate (400 × 400 × 3 mm) with a sensors network was used as an experiment specimen. As an active sensor network, four circular PZT sensors (
The experimental equipment and specimen were shown in Fig. 4.
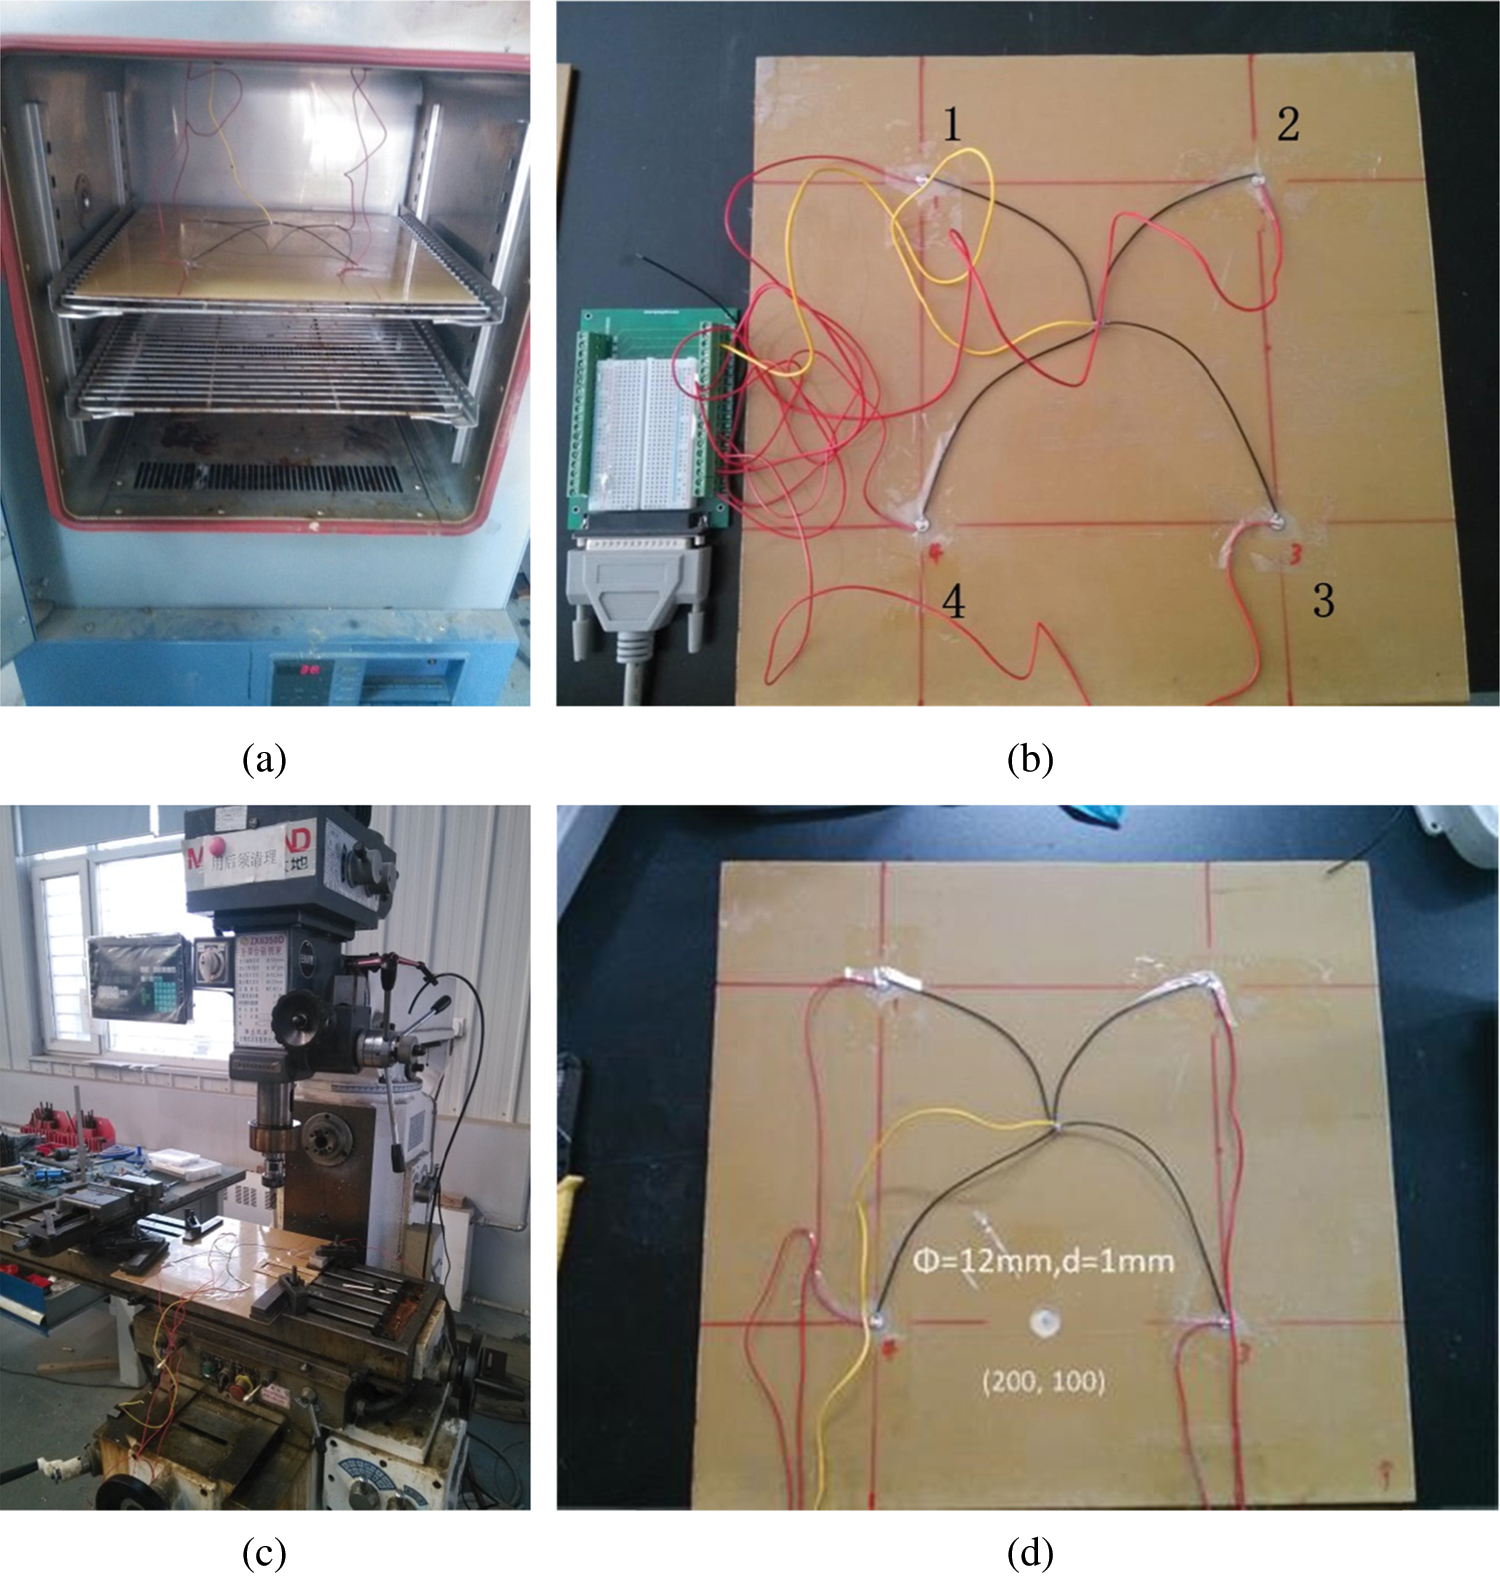
Figure 4: Experiments setup of damage diagnosis on composite plate under variable temperature environment. (a) The oven with the specimen (b) The specimen with 4 sensors (c) The Miller and specimen (d) The specimen with a countersink
As shown in Fig. 4a, the environment temperature was controlled by a constant temperature oven, cables were to the connector through the vent. As shown in Fig. 4b, four sensors were bonded on the face of the specimen; as shown in Figs. 4c and 4d, a countersink damage was machined on the specimen near the 3-4# path by a miller. The central coordinate of the countersink damage is (200 mm, 100 mm).
In this experiment, a five-cycle Hanning window modulated sinusoid tone bursts waveforms (center frequency: 250 kHz) were generated on each PZT actuator to excite the Guided Wave. Signals were generated and collected by a damage diagnostic system at a sampling rate of 24 MHz and a sampling point of 4000. The signal path setup is shown in Tab. 2.
Table 2: Signal path setup in the experiment
In this experiment, first, base signals at different temperatures (20°C~60°C, based on 2°C step) were collected. Then, the countersink damage was machined, current signals of different temperatures (20°C~60°C, based on 2°C step) were collected in damaged condition. Finally, damage identification was performed using the Spearman DI damage diagnosis method.
4.2 Temperature and Damage Effects on the Signal
The temperature and damage effects on the signal were investigated by comparing signals under different temperature and health conditions. Temperature and damage effects on the signal of the 3#-4# path were shown in Fig. 5.
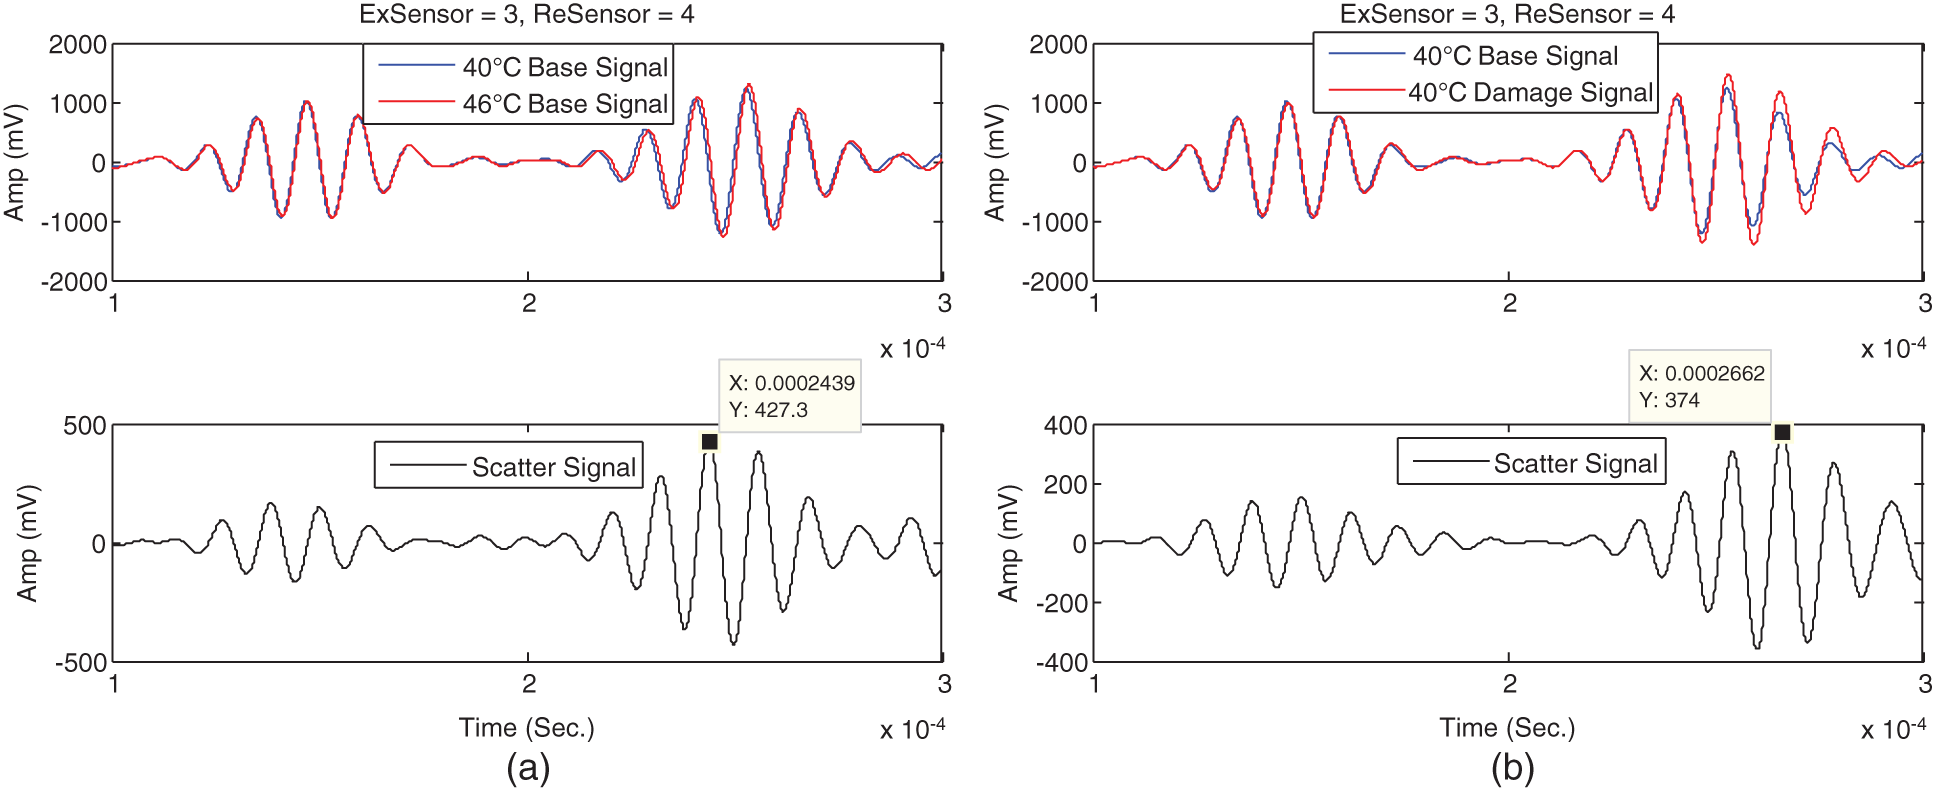
Figure 5: Influence of damage and temperature on Guided wave signal (a) Comparison of base signals under 40°C and 46°C (b) Comparison of base and damage signals under 40°C
In the Fig. 5a, the red and blue lines respectively represent base signal (the signal before the countersink damage was machined) under 40°C and 46°C, the black line represents the scatter signal between base signals. In Fig. 5b, the red and blue lines respectively represent the base and damage signal which both under 40°C, the black line represents the scatter signal between the base and damage signal.
As shown in Fig. 5a, an apparent delay of the Guided wave is caused by rising temperature, and the peak of the scatter signal between base signals under 40°C and 46°C is 427.3 mV. As shown in Fig. 5b, an amplitude change of the Guided wave signal is caused by damage, while the influence of wave velocity is slight, the peak of scattering signal between base signal and damage signal under 40°C is 374 mV. Therefore, the scatter signal which is caused by damage may be covered by the scatter signal as a result of varying temperatures.
The variation tendencies of Spearman DI and Covariance DI of 1-2#Path signals under varying temperatures (base temperature is 40°C) were shown in Fig. 6.
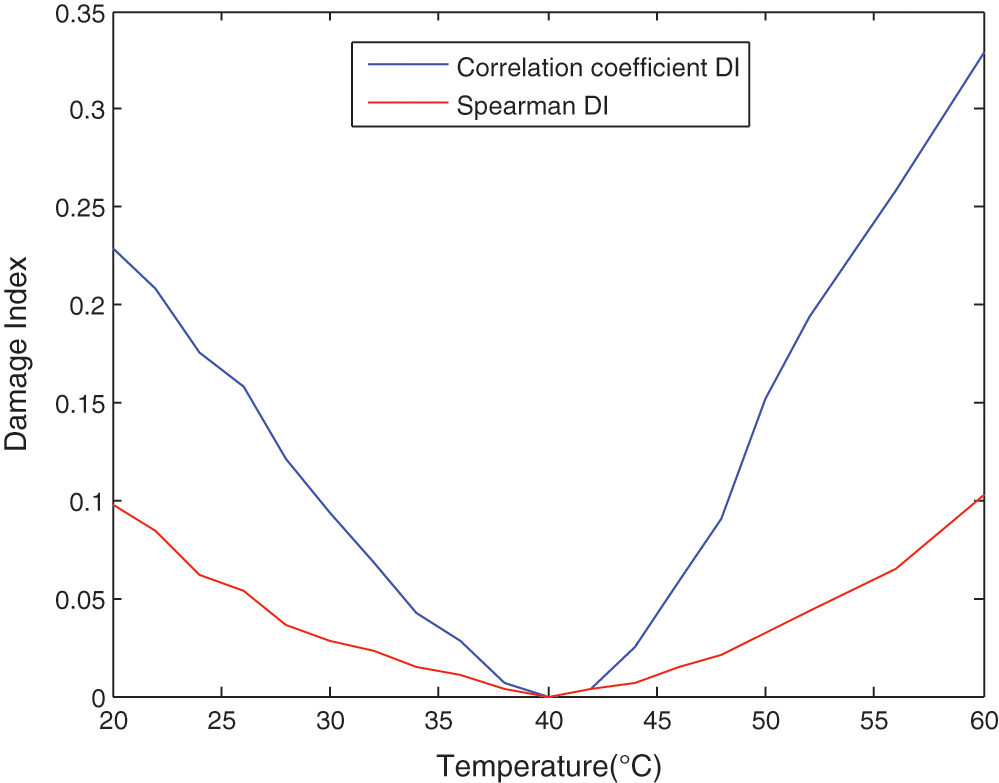
Figure 6: The variation tendencies of DIs under varying temperature
In Fig. 6, the blue line represents the variation trends of Covariance DI, while the red line represents the variation tendencies of Spearman DI.
As shown in Fig. 6, the Covariance DI is more sensitive than the Spearman DI to temperature variations. That means the baseline signal of given temperature can cover a wider range of temperature by using of Spearman DI.
4.3 Damage Identification Result under Varying Temperatures
To show the robustness of the Spearman DI-based damage diagnosis method, the countersink damage identification results were demonstrated with damage probability imaging.
In the damage probability imaging, the base (Bi) and current (Di) signals of signal path(i) are converted to ranks and obtain the spearman damage index SDI(i) following Eqs. (9) and (10). The mesh imaging weight distribution
In the damage probability imaging results, a set of necessary figures is shown while excessive result figures which seem alike with each other are omitted. Fig. 7 illustrated the damage probability imaging using Spearman DI-based methods under changing current temperature. In Fig. 7 the base signals are collected under 40°C, the current signals are collected under 28°C~50°C.
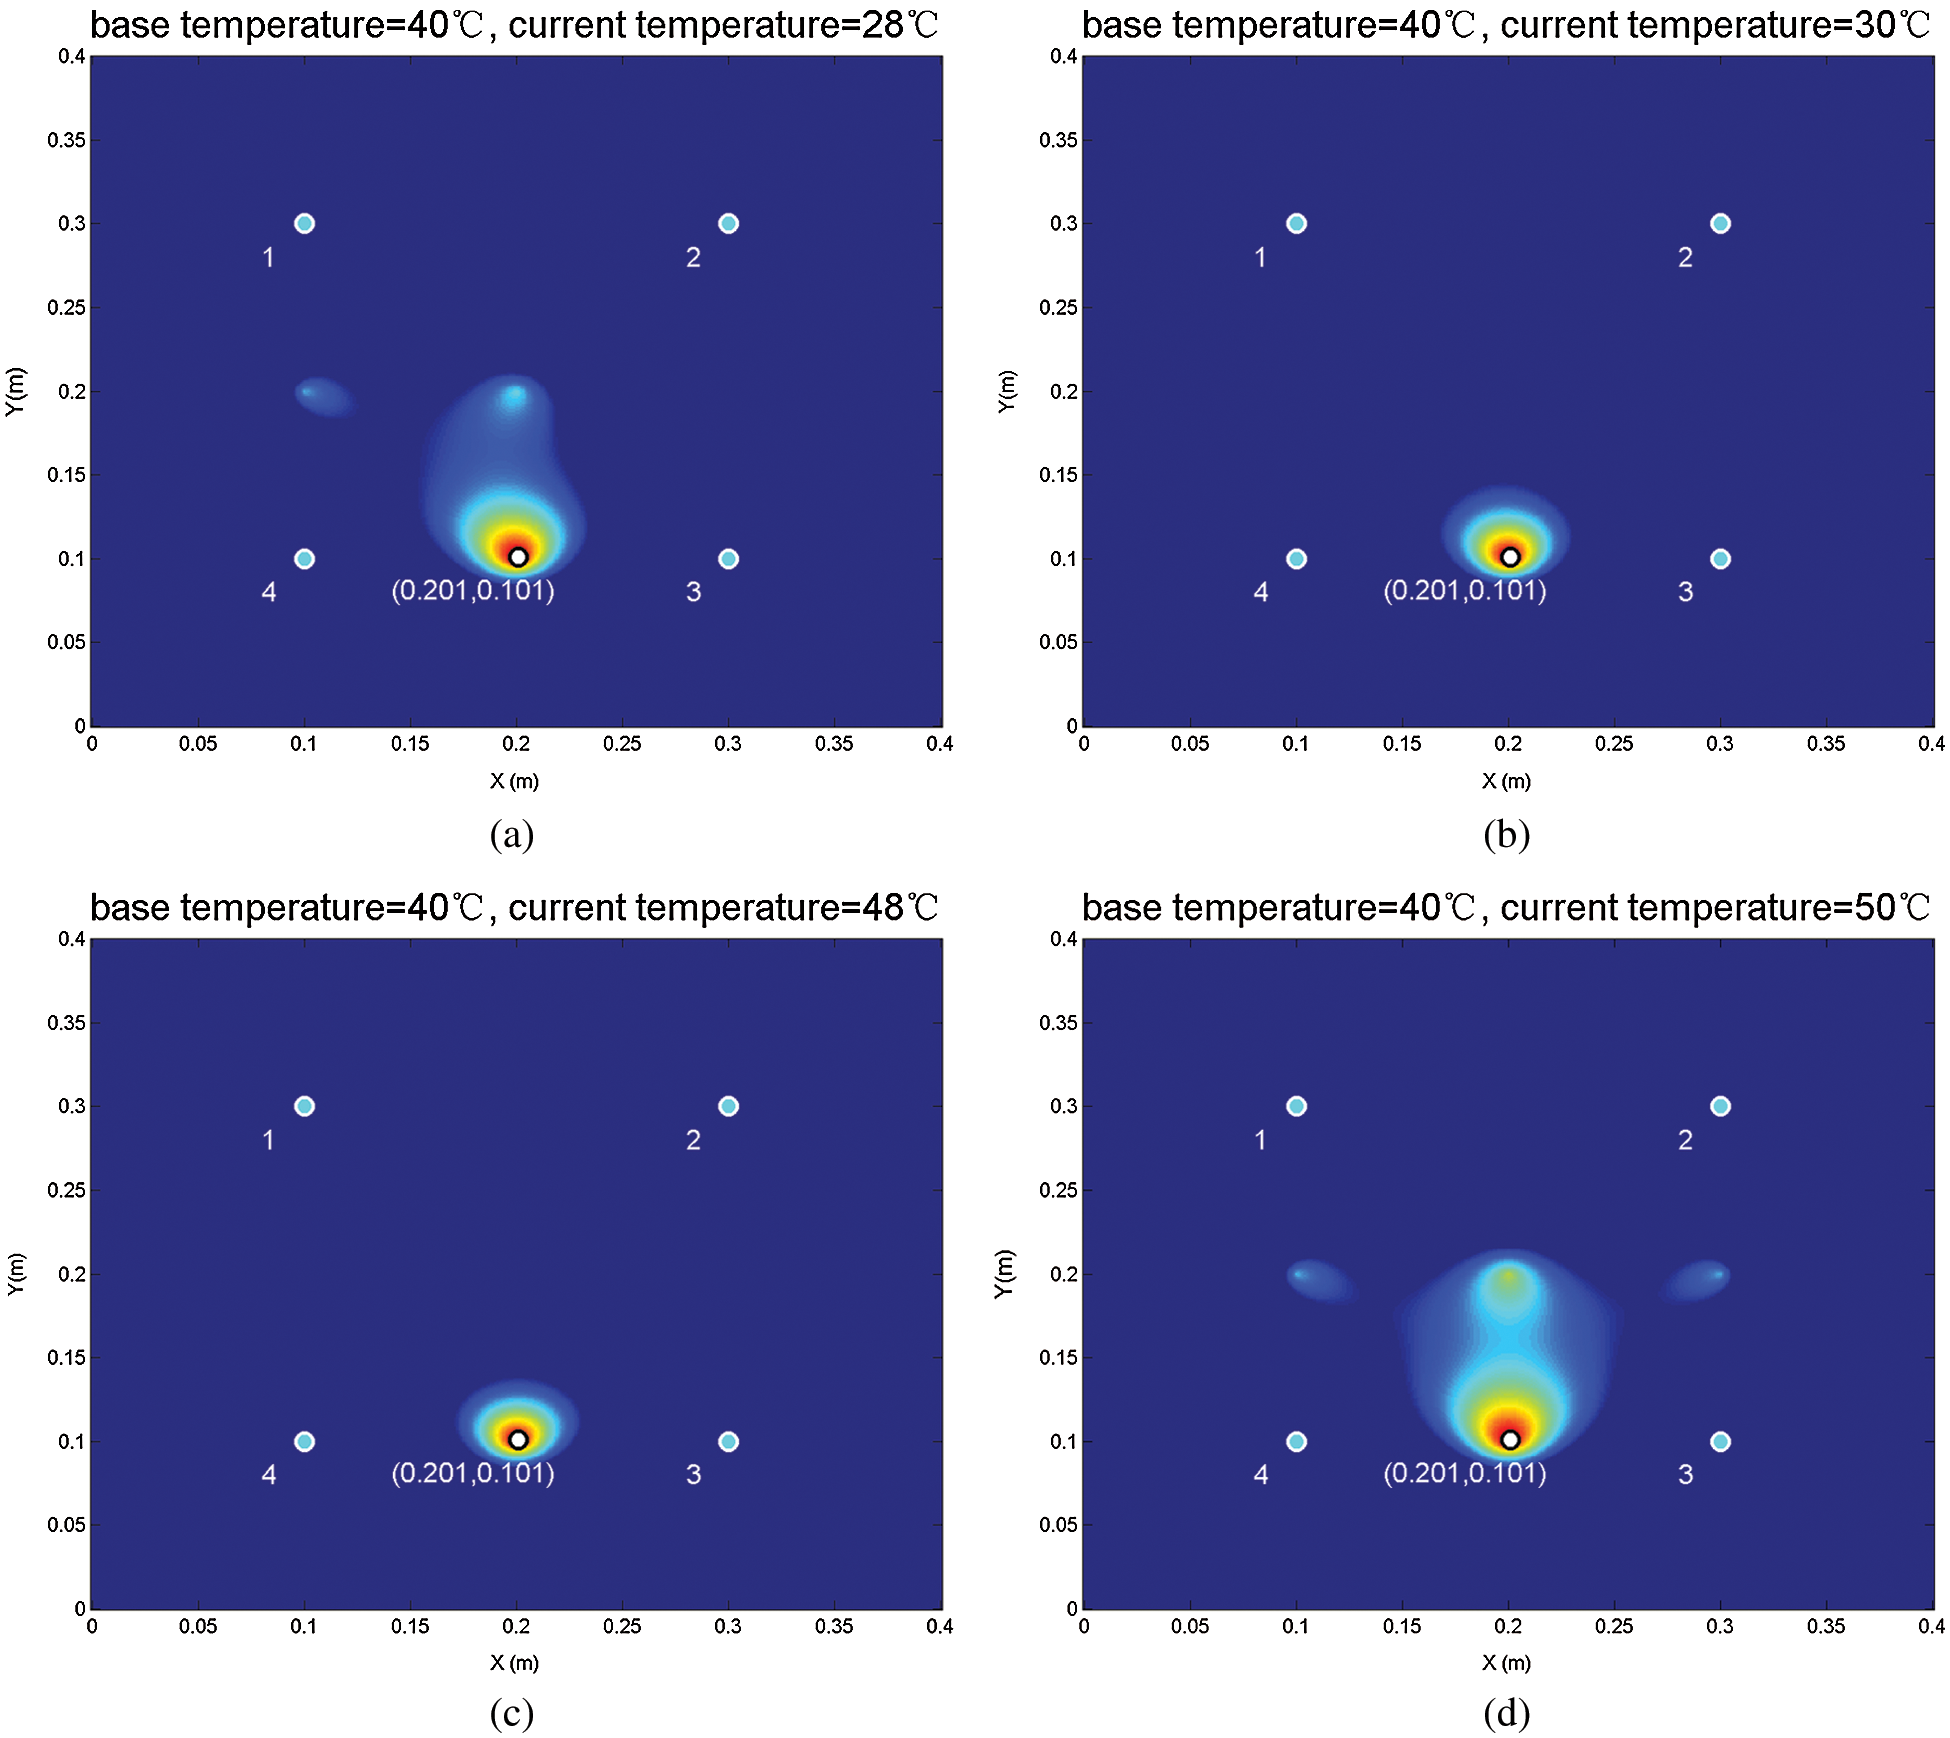
Figure 7: The imaging results of Spearman DI damage diagnosis method under changing current temperature (a) Current temperature = 28°C (b) Current temperature = 30°C (c) Current temperature = 48°C (d) Current temperature = 50°C
Fig. 7 shows the results of the Spearman DI damage diagnosis method using the base signals of 40°C. The temperature range of damage signals is 20°C~60°C by step of 2°C.
In Fig. 7, the blue circles express sensors, and their number was marked below the circles; white circle marks the central location of countersink damage; the damage was expressed by the red region.
As Figs. 7b and 7c shown, the identification area of countersink damage was in the center of Path3-4#. As Figs. 7a and 7d shown, there are highlights in between 1-4# path, 2-3# path, and center of the sensor network. It means that multicenter errors began to appear in the diagnosis result of the method under the temperature of 28 and 50°C.
In the Covariance DI-based damage diagnosis method, the covariance between the base and current signals is used as a damage index. The damage probability distribution is obtained by superimposing all the signal paths as
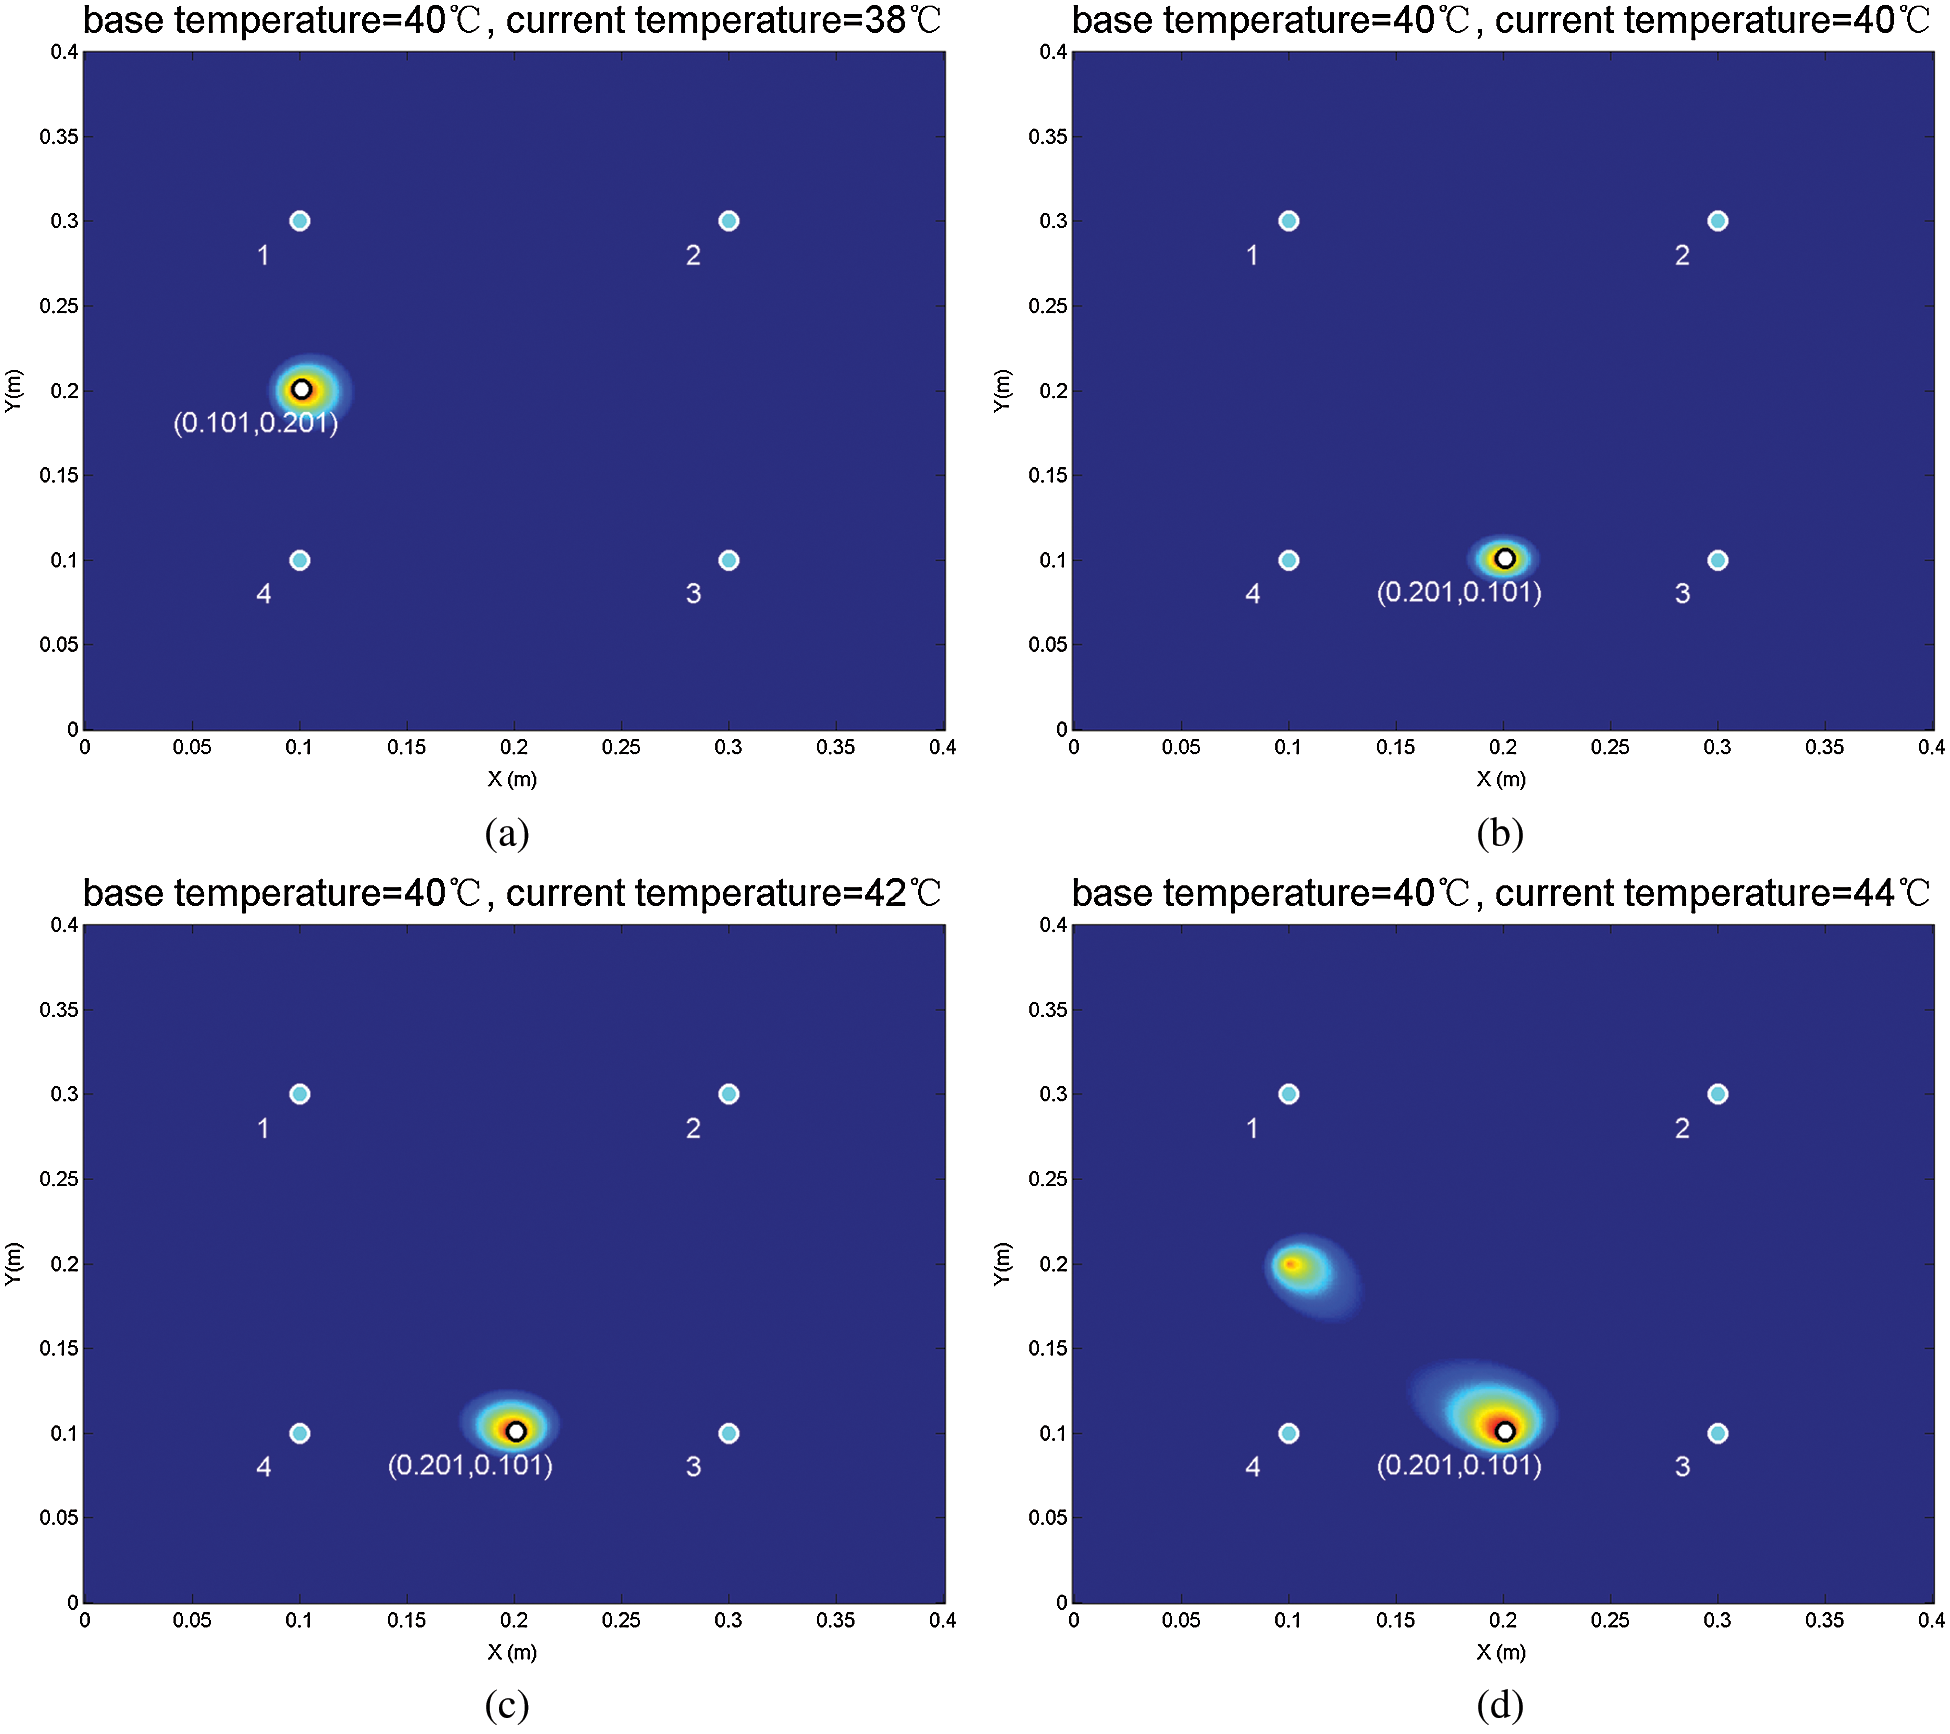
Figure 8: The imaging results of Covariance DI-based damage diagnosis method under changing current temperature (a) Current temperature = 38°C (b) Current temperature = 40°C (c) Current temperature = 42°C (d) Current temperature = 44°C
As shown in Figs. 8b and 8c, the identification location of countersink damage was in the center of Path3-4# under the temperature of 40°C and 42°C. As shown in Figs. 8a and 8d, there are highlights in between 1-4# path. It means the multicenter errors began to appear in the diagnosis result of the method under the temperature of 38°C and 44°C.
The imaging results showed that the baseline signal (under 40°C) could cover a temperature range less than 6°C (38°C~44°C) by using of Covariance DI-based damage diagnosis method.
The location error of damage diagnosis methods under different current temperature (base temperature is 40°C) is shown in Fig. 9.
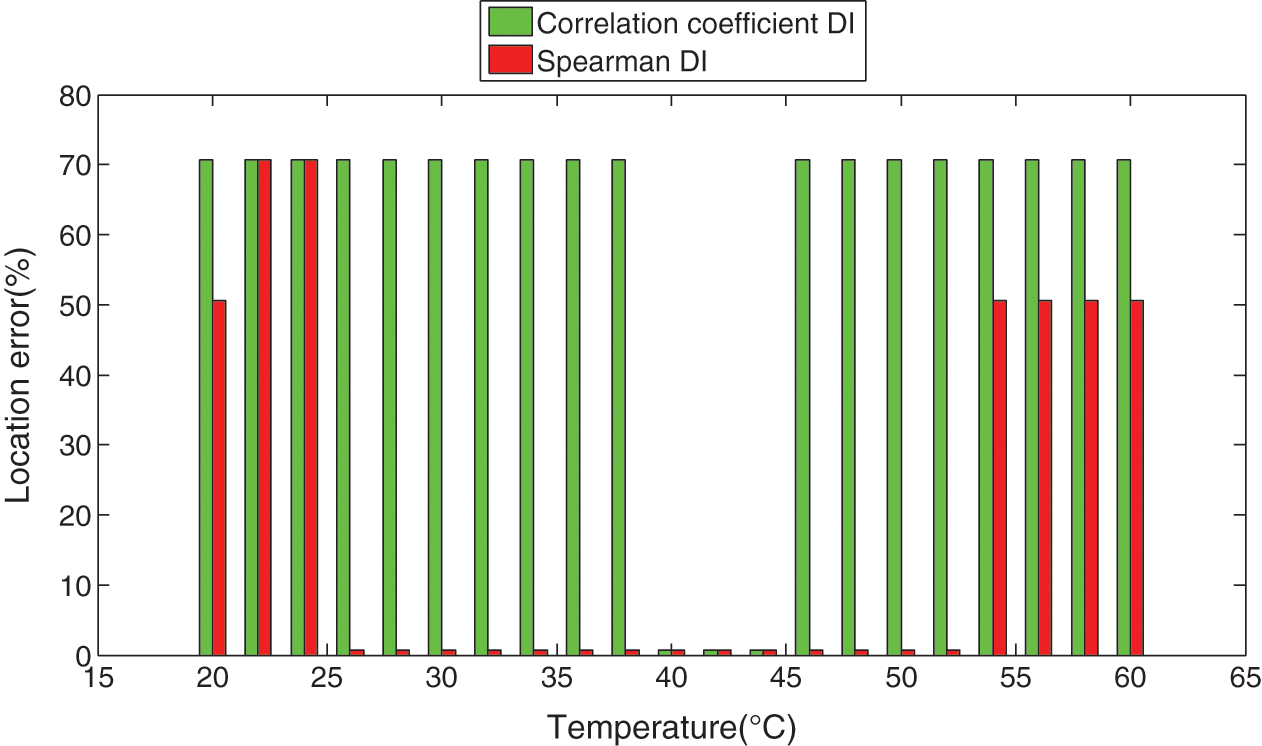
Figure 9: Location error of damage diagnosis methods under changing current temperature
In Fig. 9, the green and red bars represent the Location error of Covariance DI and Spearman DI-based damage diagnosis method under changing current temperature. As shown in Fig. 9, in most current temperature situations, Covariance DI-based damage diagnosis method has a big location error, while the baseline signal of 40°C can cover a wider range of temperature by using of Spearman DI-based damage diagnosis method.
Two reasons cause the result distortions of the damage diagnosis methods:
1. The temperature dependence of the damage index
When the temperature difference reaches a certain level, the phase delay caused by varying temperatures will cover the scatter signal change. Therefore, some of the distortion identification results have shown the damage in the central of the monitoring region.
2. Inhomogeneous temperature field of the monitoring region
In this experiment, the heat producer of the oven nears the 1-4# Path. Therefore, the damage was located in the central of the 1-4# Path in some of the distortion identification results.
This paper developed a Spearman rank correlation coefficient-based damage detection method of low-temperature sensibility. First, a model that includes the piezoelectric model of the PZT sensor, a shear lag model of the adhesive layer, and a Guided wave propagation model of substrate structure is proposed to predict the Guided wave signal feature with minimum sensitivity to the temperature. Then, a signal Spearman rank correlation coefficient-based damage index is presented for damage under varying temperatures. Finally, an experiment was performed on a composite plate with countersink damage under varying temperatures.
The damage identification experiment results show that each base signal could cover a temperature range of 18°C at least using Spearman DI-based damage diagnosis method. Experimental results show that the proposed damage diagnosis method is capable of detecting the existence of the damage and identify its location under varying temperatures.
Funding Statement: This work was supported by the National Key Research and Development Program of China (2018YFA0702800) and the National Natural Science Foundation of China (51805068).
Conflicts of Interest: The authors declare that they have no conflicts of interest to report regarding the present study.
1. Ng, W. H., Friedmann, P. P., Waas, A. M., Mcnamara, J. J. (2011). Thermomechanical behaviour of a damaged thermal protection system: Experimental correlation and influence of hypersonic flow. Aeronautical Journal, 115(1164), 69–82. DOI 10.1017/S0001924000005467. [Google Scholar] [CrossRef]
2. Ihn, J. B., Chang, F. K. (2008). Pitch-catch active sensing methods in structural health monitoring for aircraft structures. Structural Health Monitoring, 7(1), 5–19. DOI 10.1177/1475921707081979. [Google Scholar] [CrossRef]
3. Haidarpour, A., Tee, K. F. (2020). Finite element model updating for structural health monitoring. Structural Durability & Health Monitoring, 14(1), 1–17. DOI 10.32604/sdhm.2020.08792. [Google Scholar] [CrossRef]
4. Chan, E., Francis Rose, L. R., Wang, C. H. (2016). A comparison and extensions of algorithms for quantitative imaging of laminar damage in plates. II. Non-monopole scattering and noise tolerance. Wave Motion, 66, 220–237. DOI 10.1016/j.wavemoti.2016.04.004. [Google Scholar] [CrossRef]
5. Zhang, J., Liu, K., Gao, C., Wu, Z., Gao, D. (2019). Multi-mode guided waves based reference-free damage diagnostic imaging in plates. Structural Durability & Health Monitoring, 13(1), 41–59. DOI 10.32604/sdhm.2019.05142. [Google Scholar] [CrossRef]
6. Joshuva, A., Sugumaran, V. (2019). Crack detection and localization on wind turbine blade using machine learning algorithms: A data mining approach. Structural Durability & Health Monitoring, 13(2), 181–203. DOI 10.32604/sdhm.2019.00287. [Google Scholar] [CrossRef]
7. Chang, C. Y., Yuan, F. G. (2018). Extraction of guided wave dispersion curve in isotropic and anisotropic materials by Matrix Pencil method. Ultrasonics, 89, 143–154. DOI 10.1016/j.ultras.2018.05.003. [Google Scholar] [CrossRef]
8. Wu, J., Tang, Z., Lü, F., Yang, K. (2018). Ultrasonic guided wave focusing in waveguides with constant irregular cross-sections. Ultrasonics, 89, 1–12. [Google Scholar]
9. Fan, Z., Jiang, W., Cai, M., Wright, W. M. D. (2016). The effects of air gap reflections during air-coupled leaky Lamb wave inspection of thin plates. Ultrasonics, 65(4), 282–295. DOI 10.1016/j.ultras.2015.09.013. [Google Scholar] [CrossRef]
10. Salamone, S., Bartoli, I., Scalea, F. L. D., Coccia, S. (2009). Guided-wave health monitoring of aircraft composite panels under changing temperatures. Journal of Intelligent Material Systems and Structures, 20(9), 1079–1090. DOI 10.1177/1045389X08101634. [Google Scholar] [CrossRef]
11. Santoni-Bottai, G., Giurgiutiu, V. (2012). Damage detection at cryogenic temperatures in composites using piezoelectric wafer active sensors. Structural Health Monitoring: An International Journal, 11(5), 510–525. DOI 10.1177/1475921712442441. [Google Scholar] [CrossRef]
12. Marzani, A., Salamone, S. (2012). Numerical prediction and experimental verification of temperature effect on plate waves generated and received by piezoceramic sensors. Mechanical Systems and Signal Processing, 30, 204–217. DOI 10.1016/j.ymssp.2011.11.003. [Google Scholar] [CrossRef]
13. Konstantinidis, G., Drinkwater, B. W., Wilcox, P. D. (2006). The temperature stability of guided wave structural health monitoring systems. Smart Materials and Structures, 15(4), 967–976. DOI 10.1088/0964-1726/15/4/010. [Google Scholar] [CrossRef]
14. Dao, P. B., Staszewski, W. J. (2013). Cointegration approach for temperature effect compensation in Lamb-wave-based damage detection. Smart Materials and Structures, 22(9), 095002. DOI 10.1088/0964-1726/22/9/095002. [Google Scholar] [CrossRef]
15. Gao, D., Wang, Y., Wu, Z., Rahim, G. (2014). Structural health monitoring technology for a full-scale aircraft structure under changing temperatures. Aeronautical Journal, 118(1210), 1519–1537. DOI 10.1017/S0001924000010174. [Google Scholar] [CrossRef]
16. Michaels, J. E., Lee, S. J., Michaels, T. E. (2011). Impact of applied loads on guided wave structural health monitoring. AIP Conference Proceedings, USA, 1335(1), 1515–1522. [Google Scholar]
17. Eybpoosh, M., Berges, M., Noh, H. Y. (2015). Temperature variation effects on sparse representation of guided-waves for damage diagnosis in pipelines. Structural Health Monitoring and Inspection of Advanced Materials, Aerospace, and Civil Infrastructure 2015. International Society for Optics and Photonics. vol. 9437. USA. [Google Scholar]
18. Clarke, T., Simonetti, F., Cawley, P. (2010). Guided wave health monitoring of complex structures by sparse array systems: Influence of temperature changes on performance. Journal of Sound and Vibration, 329(12), 2306–2322. [Google Scholar]
19. Raghavan, A., Cesnik, C. E. S. (2008). Effects of elevated temperature on guided-wave structural health monitoring. Journal of Intelligent Material Systems and Structures, 19(12), 1383–1398. DOI 10.1177/1045389X07086691. [Google Scholar] [CrossRef]
20. Mazzeranghi, A., Vangi, D. (1999). Methodology for minimizing effects of temperature in monitoring with the acousto-ultrasonic technique. Experimental Mechanics, 39(2), 86–91. DOI 10.1007/BF02331110. [Google Scholar] [CrossRef]
21. Weaver, R. L., Lobkis, O. I. (2000). Temperature dependence of diffuse field phase. Ultrasonics, 38(1–8), 491–494. DOI 10.1016/S0041-624X(99)00047-5. [Google Scholar] [CrossRef]
22. Konstantinidis, G., Wilcox, P. D., Drinkwater, B. W. (2007). An investigation into the temperature stability of a guided wave structural health monitoring system using permanently attached sensors. IEEE Sensors Journal, 7(5), 905–912. DOI 10.1109/JSEN.2007.894908. [Google Scholar] [CrossRef]
23. Wang, Y., Gao, L., Yuan, S., Qiu, L., Qing, X. (2014). An adaptive filter-based temperature compensation technique for structural health monitoring. Journal of Intelligent Material Systems and Structures, 25(17), 2187–2198. DOI 10.1177/1045389X13519001. [Google Scholar] [CrossRef]
24. Giurgiutiu, V., Xu, B., Liu, W. (2010). Development and testing of high-temperature piezoelectric wafer active sensors for extreme environments. Structural Health Monitoring, 9(6), 513–525. DOI 10.1177/1475921710365389. [Google Scholar] [CrossRef]
25. Giurgiutiu, V. (2016). Tuned lamb wave excitation and detection with piezoelectric wafer active sensors for structural health monitoring. Journal of Intelligent Material Systems and Structures, 16(4), 291–305. DOI 10.1177/1045389X05050106. [Google Scholar] [CrossRef]
26. Ramadas, C., Hood, A., Balasubramaniam, K., Joshi, M., Krishnamurthy, C. V. (2010). Modeling of attenuation of Lamb waves using Rayleigh damping. Proceedings of Vibration Engineering and Technology of Machinery. VETOMAC, 2020–2025. [Google Scholar]
27. Sherrit, S., Yang, G., Wiederick, H. D., Mukherjee, B. K. (1999). Temperature dependence of the dielectric, elastic and piezoelectric material constants of lead zirconate titanate ceramics. Proceedings of the International Conference on Smart Materials, Structures and Systems. pp. 121–126. USA. [Google Scholar]
28. Karbhari, V. M., Rivera, J., Zhang, J. J. (2002). Low-temperature hygrothermal degradation of ambient cured E-glass/vinylester composites. Journal of Applied Polymer Science, 86(9), 2255–2260. DOI 10.1002/app.11205. [Google Scholar] [CrossRef]
 | This work is licensed under a Creative Commons Attribution 4.0 International License, which permits unrestricted use, distribution, and reproduction in any medium, provided the original work is properly cited. |