Health Monitoring
| Structural Durability & Health Monitoring |
DOI: 10.32604/sdhm.2021.011127
ARTICLE
Characterization and Prediction of Nonlinear Stress-Strain Relation of Geostructures for Seismic Monitoring
1Faculty of Architecture and Civil Engineering, Huaiyin Institute of Technology, Huai’an, China
2Environmental Quality, Atmospheric Science and Climate Change Research Group, Ton Duc ThangUniversity, Ho Chi Minh City, Vietnam
3Faculty of Environment and Labour Safety, Ton Duc Thang University, Ho Chi Minh City, Vietnam
*Corresponding Author: Abdoullah Namdar. Email: abdoullah.namdar@tdtu.edu.vn
Received: 21 April 2020; Accepted: 25 December 2020
Abstract: The nonlinearity of the strain energy at an interval period of applying seismic load on the geostructures makes it difficult for a seismic designer to makes appropriate engineering judgments timely. The nonlinear stress and strain analysis of an embankment is needed to evaluate by using a combination of suitable methods. In this study, a large-scale geostructure was seismically simulated and analyzed using the nonlinear finite element method (NFEM), and linear regression method which is a soft computing technique (SC) was applied for evaluating the results of NFEM, and it supports engineering judgment because the design of the geostructures is usually considered to be an inaccurate process owing to high nonlinearity of the large-scale geostructures seismic response and such nonlinearity may induce the complexity for decision making in geostructures seismic design. The occurrence of nonlinear stress and nonlinear strain probability distribution can be observed and density of stress and strain are predicted by using the histogram. The results of both the simulation from the NFEM and the linear regression method confirm the nonlinearity of strain energy and stress behavior have a close value of R2 and root-mean-square error (RMSE). The linear regression and histogram simulation shows the accuracy of NFEM results. The outcome of this study guides to improve engineering judgment quality for seismic analysis of an embankment through validating results of NFEM by employing appropriate soft computing techniques.
Keywords: NFEM; geostructure; stress; strain; linear regression model; histogram
Applying nonlinear strain energy on geostructures cases the unexpected excitation owing to internal and external loads interaction, under this situation nonlinear stress and nonlinear strain are developing. The concept of strain energy and the effect of the mechanical properties of the materials on nonlinear displacement development were studied in the geotechnical earthquake engineering field by using the nonlinear finite element method (NFEM) [1,2]. The ABAQUS has been applied to solve several geotechnical and structural earthquake engineering problems [3–12]. From these presented research works to minimize the gap between theoretical concepts with practical engineering problems, advanced mathematical modeling techniques are needed to apply in results of numerical simulation, on the other hand, advance mathematical modeling is a cost-effective, fast performable, and trustable technique for application in practical engineering problems.
The nonlinear stress and strain were investigated using numerical simulation and experimental work [3,13–22], and the linear regression model has been used for the prediction of the different phenomenon in many fields including medical science, pollution description, construction material, and mapping [23–26], the histogram is a technique has been used to evaluate the noise spectrum was produced by the 110 kV power transformer [27], the histogram mainly is applying for frequency versus interval certain value of the probability. The histogram was applied for endometrial cancer, segmentation vegetation, and soil and soil texture [28–31], the histogram can be applying in all problems of science and technology. In the present work histogram model and linear regressions were used, and the model was applied for prediction nonlinear stress and nonlinear strain have been calculated by the NFEM in the numerical simulation.
There is necessary to study the application of advanced mathematical modeling for NFEM results validate in seismic geotechnical infrastructure design improvement. Apply the linear regression model and the histogram model on NFEM results were developed from the ABAQUS has not been found in the literature. In this study, to evaluate the accuracy of NFEM results and characterization of the nonlinearity stress and strain, a large-scale geostructure was seismically simulated and analyzed using the nonlinear finite element method, and linear regression method and histogram which are soft computing techniques (SC) were applied for evaluating the results of NFEM and support engineering judgment.
An elasto-plastic clay cohesive soil type [1] was used for the subsoil and embankment modeling. The external eigenfrequency and the acceleration (m/s2) are applied to simulating large-scale geostructure. The nonlinear strain energy is applied to the embankment-subsoil model in both positive and negative directions. The accuracy of the nonlinear strain and stress was evaluated using soft computing techniques.
The mechanical properties of the construction material are effective factor in the seismic design of each infrastructure, and the construction material plays one of the main functions in provide strength and stiffness of the geostructure. The mechanical properties of the soil are indicated in Tabs. 1 and 2. The elastic properties of the soil show in Tab. 1 and the plastic properties of the soil are illustrated in Tab. 2. The young’s modulus, Poisson’s ratio, and unit weight of 24 MPa, 0.2 and 18.5 kN/m3 respectively mentioned in Tab. 1, and cohesion of 17 kPa, internal friction angle of 40 deg, and dilatancy angle of 2 deg are plastic properties of the soil and were presented in Tab. 2. The subsoil and embankment are made of the same selected elasto-plastic soil.
The nonlinear acceleration is applied to the geostructure, and it develops nonlinear strain and stress. The acceleration characteristics are shown in Fig. 1. The acceleration is depicted in two shapes, in the first part, the acceleration is the same as that is reported in the literature, and the second part for realizing the nature of the acceleration, from the 4th seconds till the 9th second was zoomed. At the 6.62 seconds +5.9242 m/s2 and at 6.295 seconds the −9.10367 m/s2 are maximum acceleration m/s2 in the positive and negative direction, respectively. The occurrence of two consequent acceleration peaks at a close time causes a high level of nonlinearity on the embankment-subsoil model.
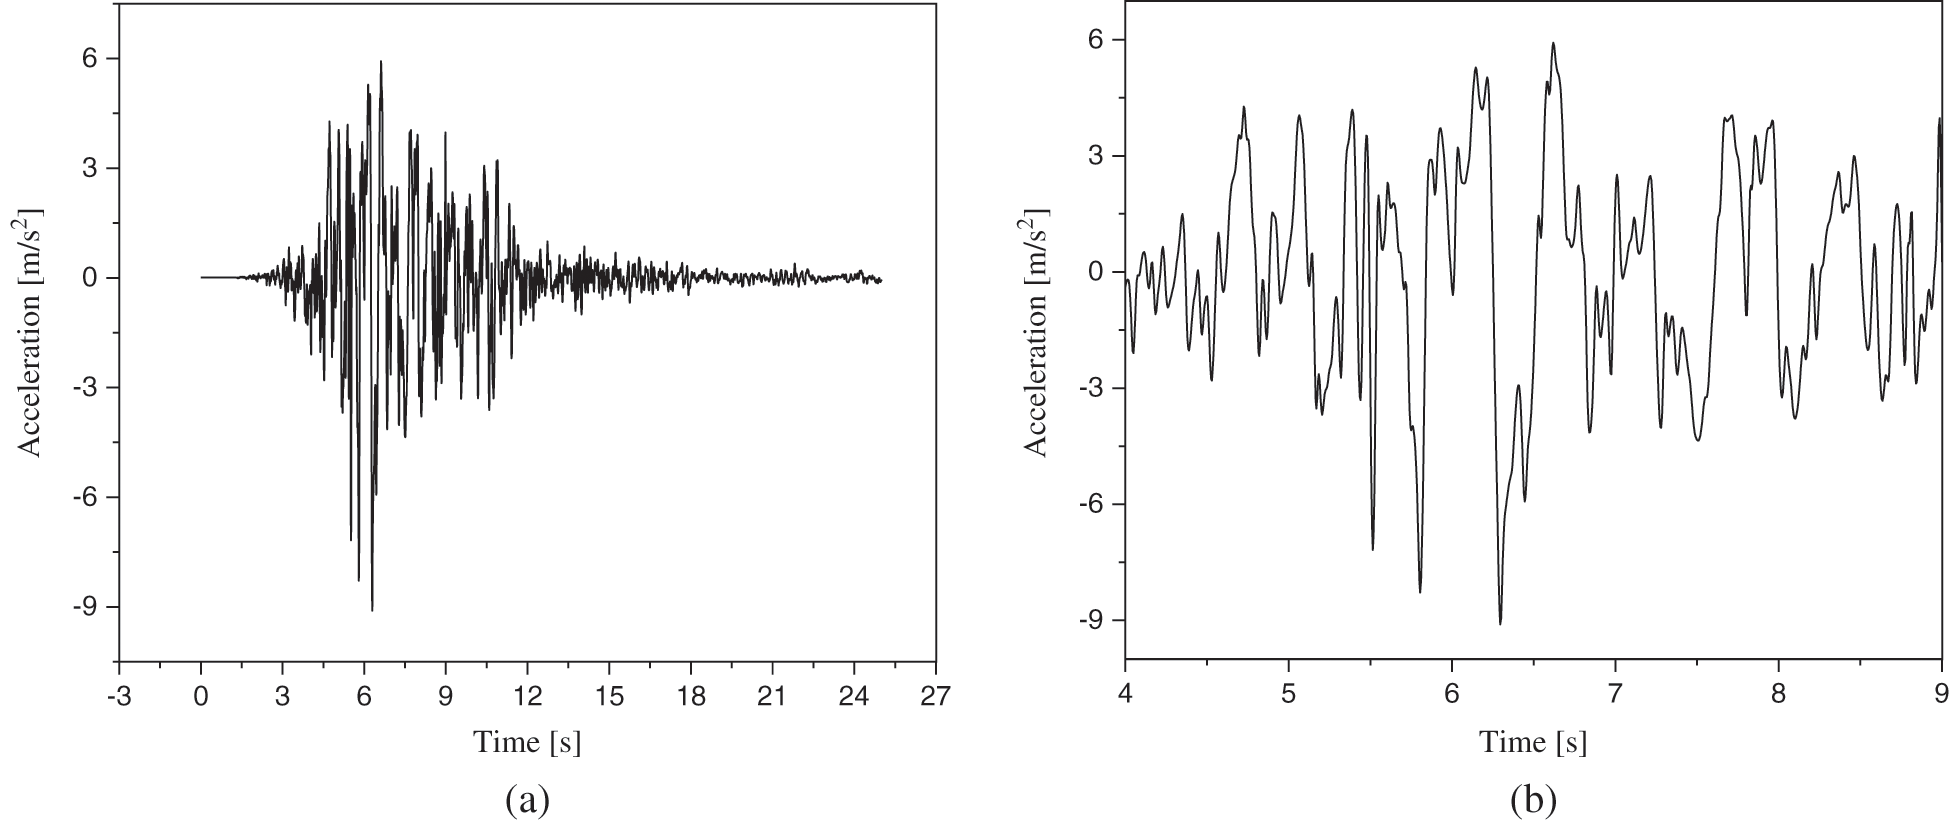
Figure 1: The acceleration (m/s2) applied to the geostructure [32]. (a) Report in literature, (b) Zoomed
Table 1: Elastic properties of soil [31]
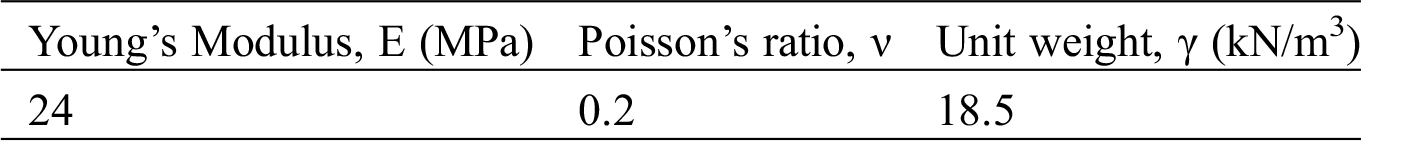
Table 2: Plastic properties of soil [31]

The developing nonlinear strain and stress relate to modeling geometry and the nonlinear acceleration were applied to the geostructure. The geometry of a large-scale geostructure model is shown in Fig. 2 and the dimensions of the embankment and subsoil were described in Fig. 2. The subsoil size was 81 m in length and 6 m in height. The embankment is made of 6 m height and 21 m of crest length size and 45 m length from the toe-to-toe in location embankment is rest on the subsoil. The width of 30 m for both embankment and subsoil was selected. The geomorphology of each region requires the construction of a specific embankment, in the present work, large-scale geostructure is modeled for understanding nonlinear strain and stress are associated with large-scale geostructure. The mesh shape was used in the nonlinear numerical analysis is shown in Fig. 3. The external eigenfrequency and seismic acceleration have been applied to the large-scale geostructure model in two different stages. The model has been subjected to acceleration in the horizontal direction and the eigenfrequency is applied to the model in all possible directions according to the boundary condition of the model. It was assumed the subsoil is rested on a rigid surface and the embankment can move in six directions. Fig. 4 shows the boundary condition in two steps of the numerical analysis, in the first step, the external eigenfrequency was applied to the model and in the second step, the seismic acceleration was applied to the model. In the numerical analysis, the combination of the first and second steps at each stage are the results of the numerical simulation.
The external eigenfrequency and seismic acceleration initiate are applying to the model beneath the subsoil. Owing to using the same construction material in modeling embankment and subsoil, it is assumed embankment and subsoil interaction was occurred due to geometry and there is not any influence of construction material in the embankment-subsoil interaction, has been considered. After applying the external eigenfrequency and seismic acceleration to the model, the results of the NFEM were reported in 80 stages, and the maximum and minimum value of the stress and strain have been selected from each stage for modeling by using linear regression and histogram. In the linear regression analysis, 80 maximum stress and 80 maximum strain have been selected for analysis of the R2 and RMSE, and to evaluate the accuracy of NFEM results, the R2 and RMSE were considered. The 80 minimum stress and strain, and 80 maximum stress and strain have been selected to depict histogram graphs. The histogram is depicted for assessing the probability distribution of stress and strain.
To study nonlinear stress and strain distribution on the large-scale geostructure, only maximum and minimum levels of 80 stages at numerical analysis were selected. The acceleration was applied to the large-scale geostructure model for simulation nonlinear strain and stress using the nonlinear finite element method (NFEM), and linear regression method which is a soft computing technique (SC). The flowchart for the entire study process is shown in Fig. 5.
To establish a nonlinear stress-strain classification and prediction geostructure seismic monitoring, the histogram was developed with different intervals and the frequency. The histogram supports stress-strain characterization. In using NFEM, with using the 80 stages of the numerical simulation, the histogram was developed, it made because the whole stages of the numerical simulation reveal the embankment-subsoil model seismic response. To discover the intensity of reiterating stress-strain at the specified presented interval, the Central Limit Theorem was used.
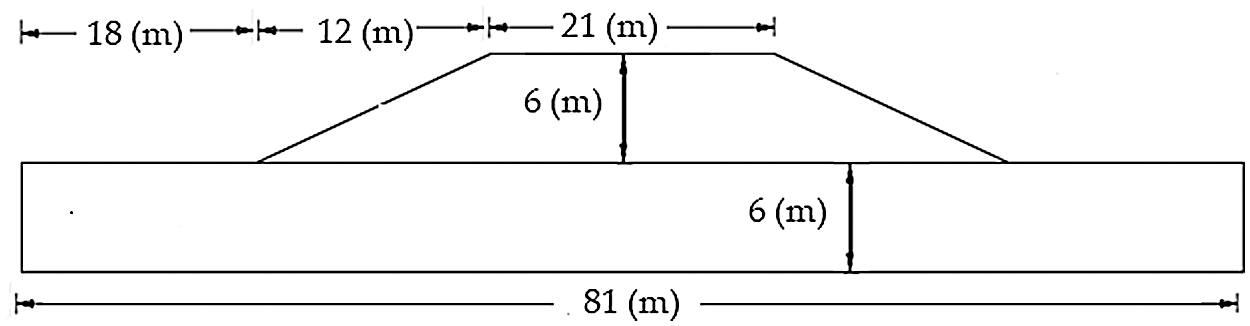
Figure 2: The geometry of the geostructure model
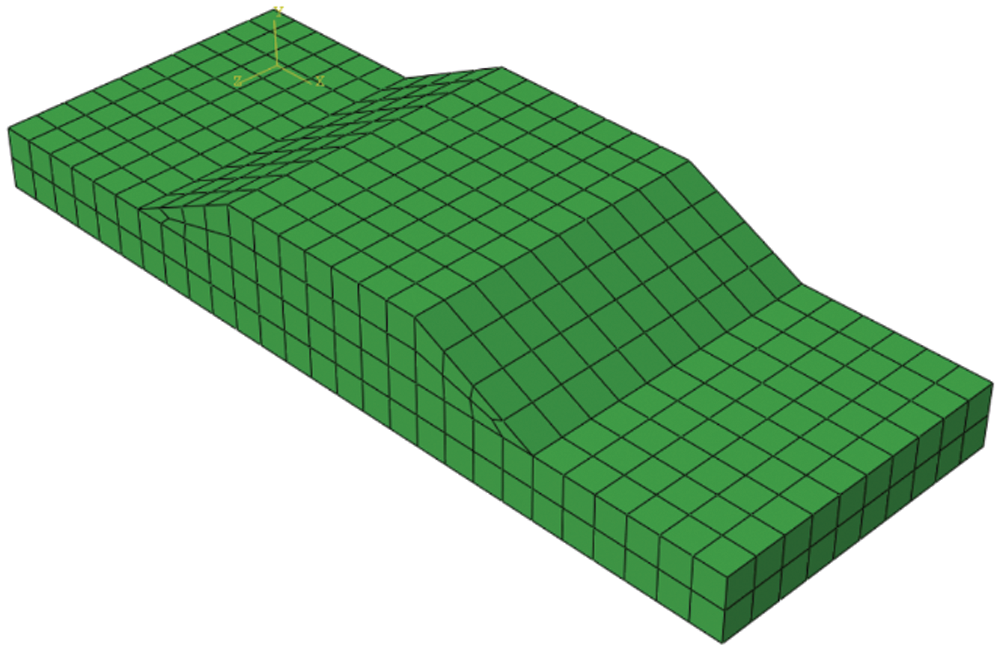
Figure 3: The mesh characteristics were used in the nonlinear numerical analysis
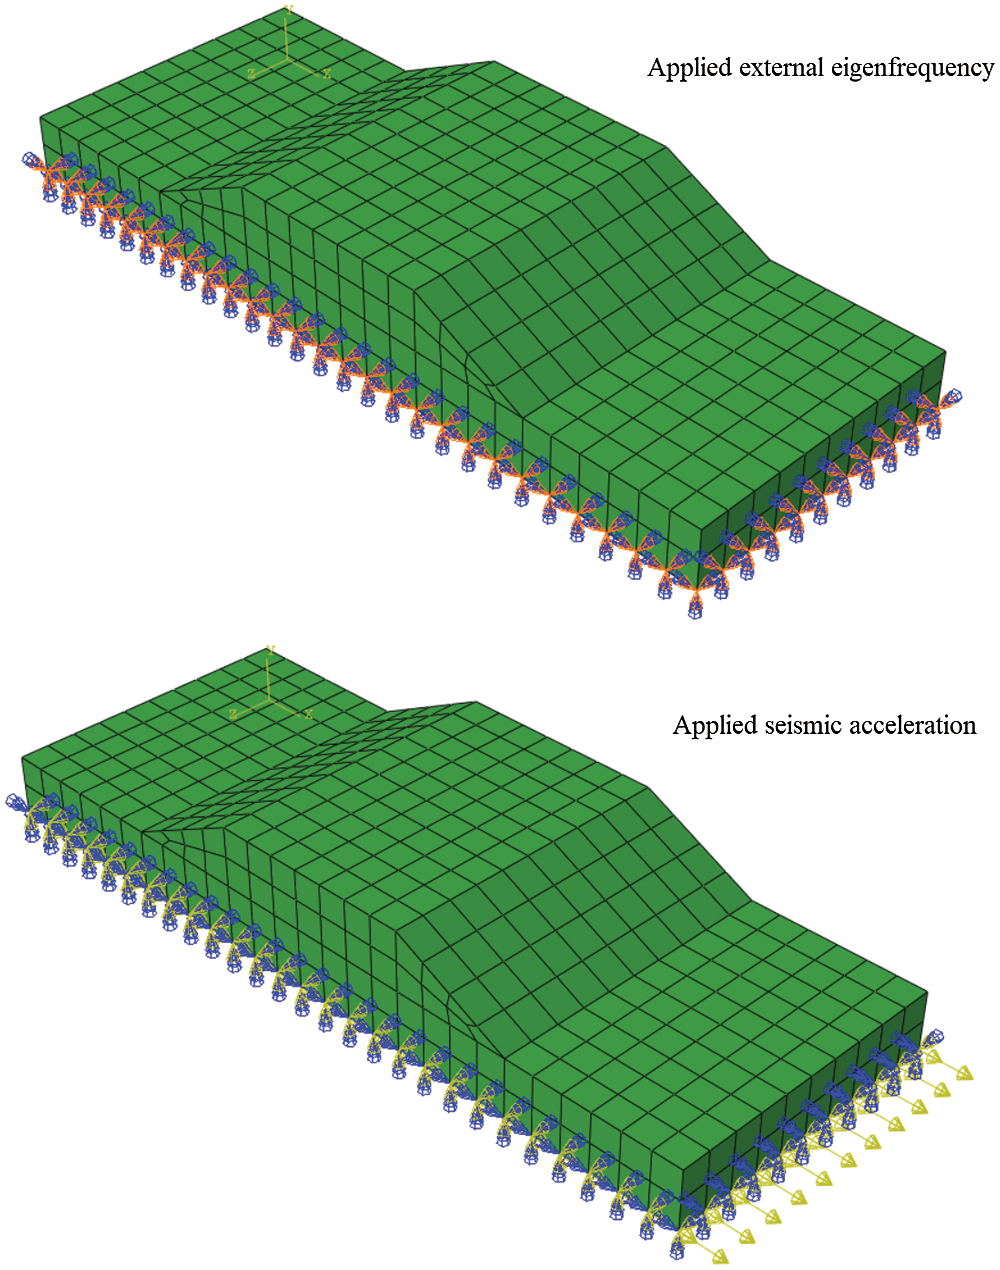
Figure 4: The boundary condition at two steps of the nonlinear numerical analysis
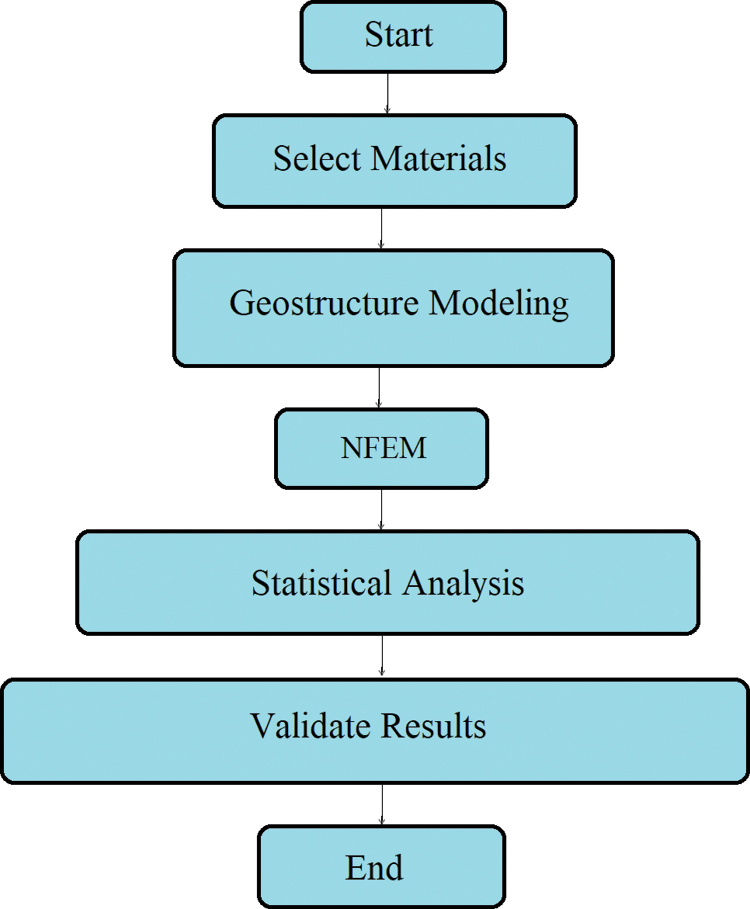
Figure 5: The entire study process
To improve the seismic safety of the large-scale geostructures, a seismic design was performed, and suitable methods from the mathematical field were introduced to geotechnical engineering to enhancing decision making. The questions are, “do the results of the numerical simulation from NFEM is trustable for large-scale geostructures seismic design? And which methods are required to validate the results of the numerical simulation produced by the NFEM”?
The 13th continuous range of nonlinear maximum principal stress (MPa) and the nonlinear maximum principal strain were showed in Figs. 6a and 6b, Figs. 7a and 7b, respectively, these entire ranges of the stress and strain belong to the first stage of executing numerical simulation using NFEM. In this study, 80 stages of the numerical simulation have been considered, and owing to the huge number of figures for showing all stages of the numerical simulation, the selected figure is shown in this study. The mesh was selected for this numerical simulation was showed stress and strain development. The results of the numerical simulation were showed the maximum nonlinear stress and strain were developed in the bottom of the subsoil beneath the embankment’s toe. The nonlinear stress in two different directions is applied to the embankment crest. The slope of the embankment is sliding because of the seismic excitation, it is depicted in Figs. 6a and 6b, Figs. 7a and 7b. The nonlinear vibration of the large-scale geostructures causes initiating collapse on the one side of the embankment’s toe, and the second toe of the embankment failed following the first toe was collapsed. To apply results of the nonlinear numerical simulation in seismic designing a large-scale geostructure, the recorded nonlinear stress (MPa) and strain are needed to be evaluated by using the linear regression model and histogram, these two methods are soft computing techniques (SC) and are supporting validate results of the numerical simulation before application in the geotechnical earthquake engineering design. However, in this study, one large-scale geostructure seismic analysis is subjected to NFEM and two soft computing techniques (SC) are performed for introducing simulation techniques to the field of geotechnical earthquake engineering and support engineering judgment.
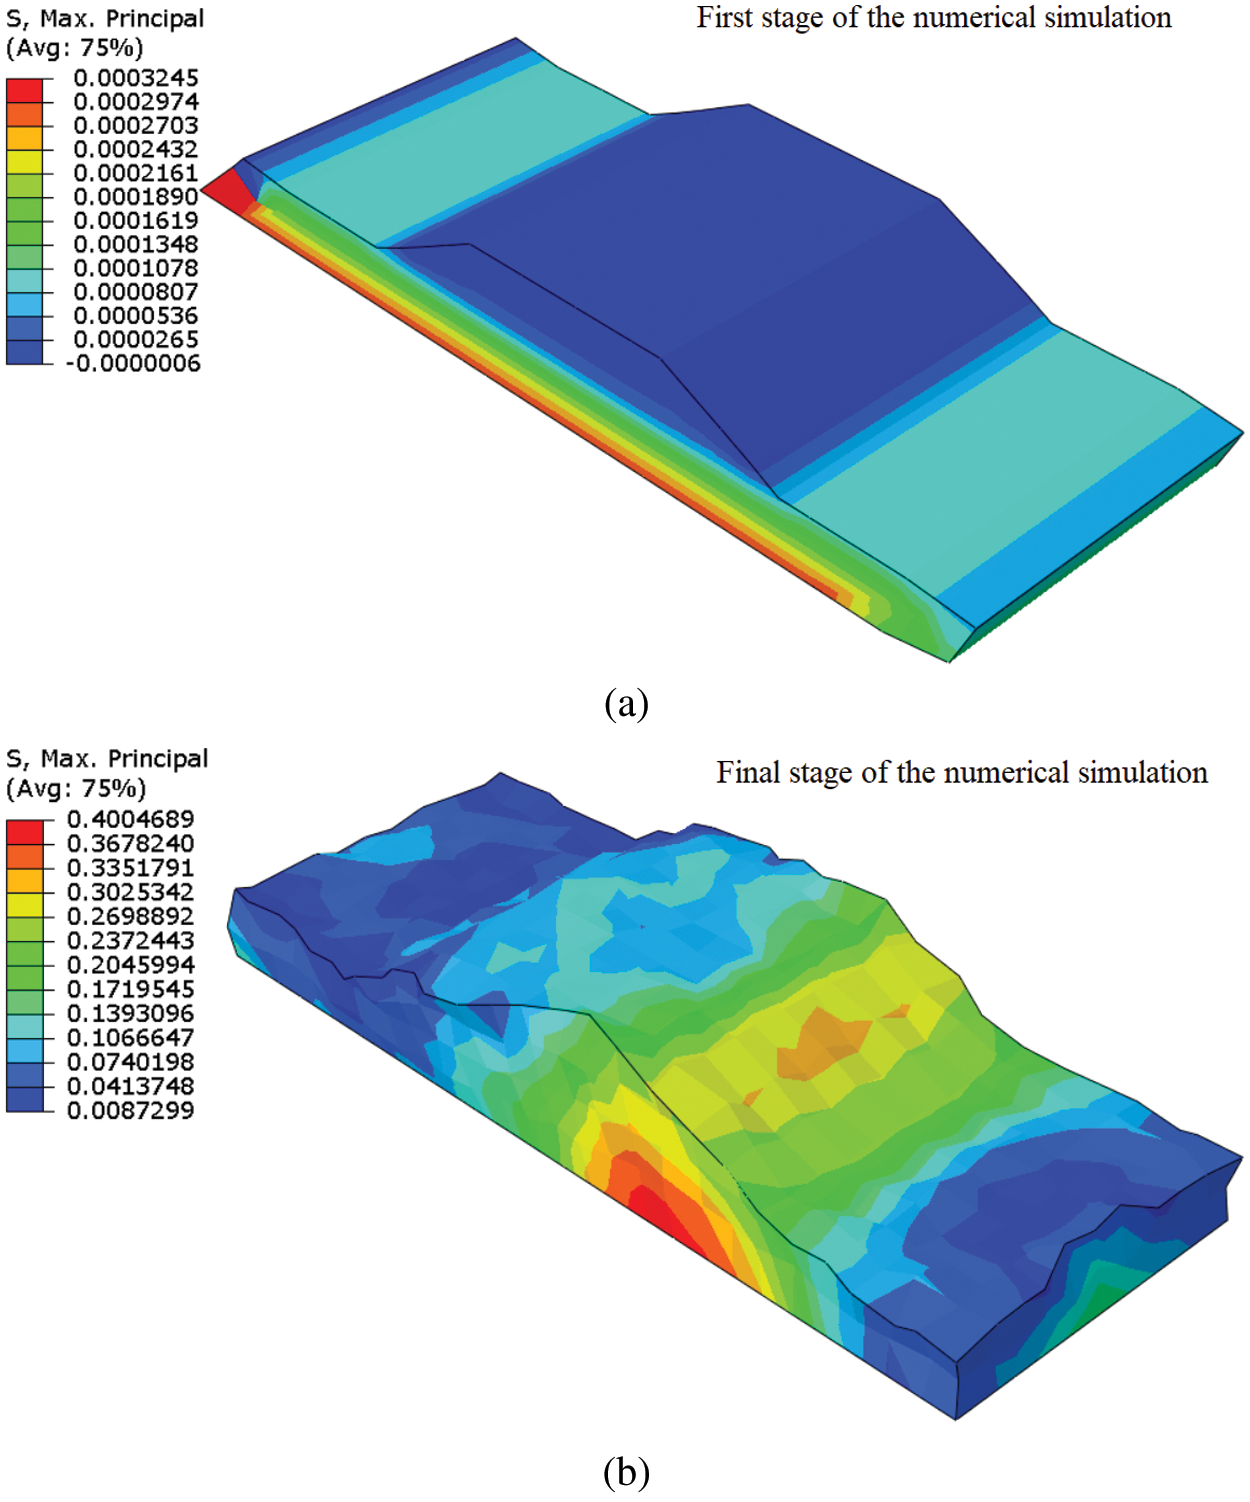
Figure 6: (a) The stress in the first stage of nonlinear numerical simulation (b) The stress (MPa) in the final stage of nonlinear numerical simulation
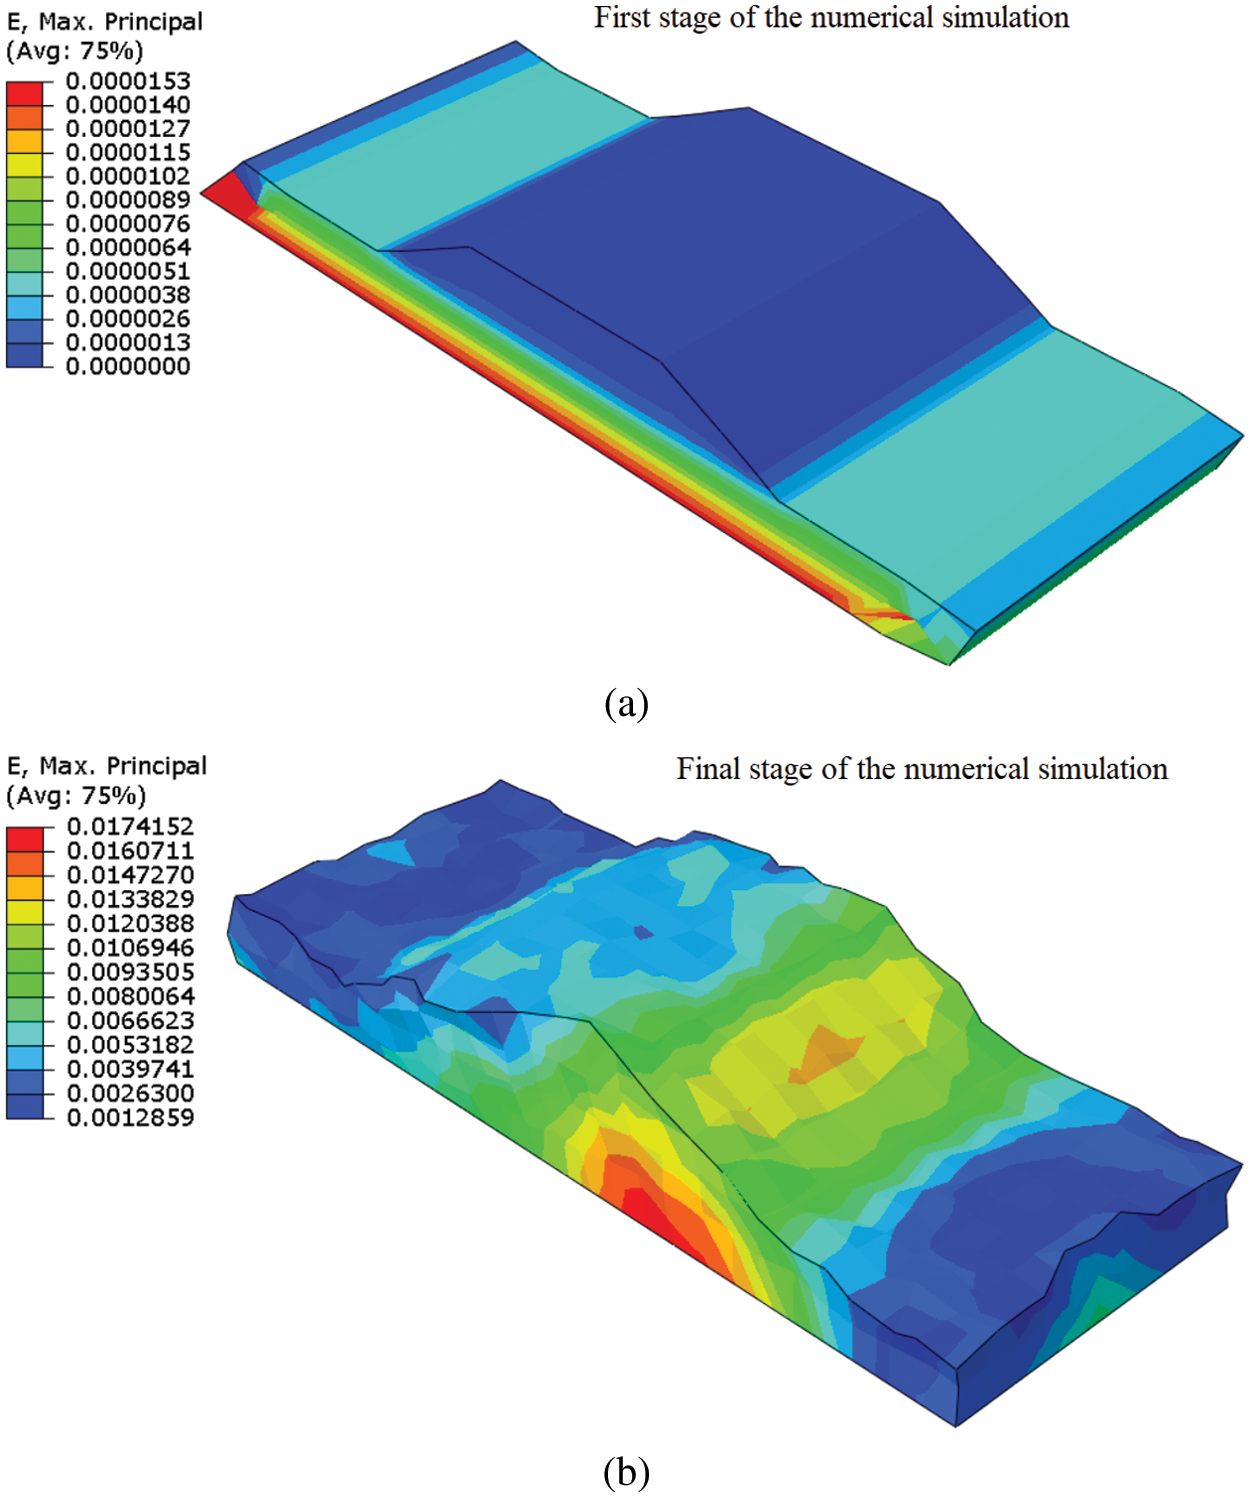
Figure 7: (a) The strain in the first stage of nonlinear numerical simulation (b) The strain in the final stage of nonlinear numerical simulation
The entire range of the stress and strain value are presented in Fig. 8. The histogram graphs were developed to study the distribution minimum and maximum nonlinear stress, and minimum and maximum nonlinear strain which are obtained from the NFEM analysis. The entire range of the stress and strain value were shown in the histogram graphs, it was depicted with a series interval of the stress and strain occurrence. The negative and positive nonlinear stress and strain proportion were depicted, by using the histograms. In comparing strain and stress histograms, both are symmetric and bell-shaped, it is because of the nonlinearity of stress and strain, and there are few differences between stress histogram with strain histogram. The histograms show the probability occurrence and density of the nonlinear stress strain. The probability distribution of nonlinear stress and strain and frequency of the nonlinear stress and strain in unexpected behavior occurrence were analyzed. The symmetric and bell-shaped histograms are presenting normal distribution for the prediction of nonlinear stress and strain. The determination of the nonlinear stress and strain distribution on the large-scale geostructure is supporting decision-making in geostructures seismic design. According to the histogram is depicted in Fig. 8, the nonlinear stress and strain distribution in the loading stage is not the same as reloading. The change in stress and strain distribution were observed at each interval. In the reloading phase, the distribution stress and strain are less nonlinear compared to the loading stage. The strain energy has a high concentration in the loading phase and strain energy in the loading phase more is appeared at the maximum level, the strain energy was reduced in the opposite direction on the large-scale geostructure movement. The histogram shows the unexpected release of elastic strain energy in the form of probability distribution occurs and it supports in density prediction of the strain energy. However, the large elastic strain and large stress range during loading are governing main seismic excitation on the large-scale geostructure, on the other hand in the histogram is shown, the nonlinear strain distribution was appeared in a more symmetric shape compared to the nonlinear stress distribution.
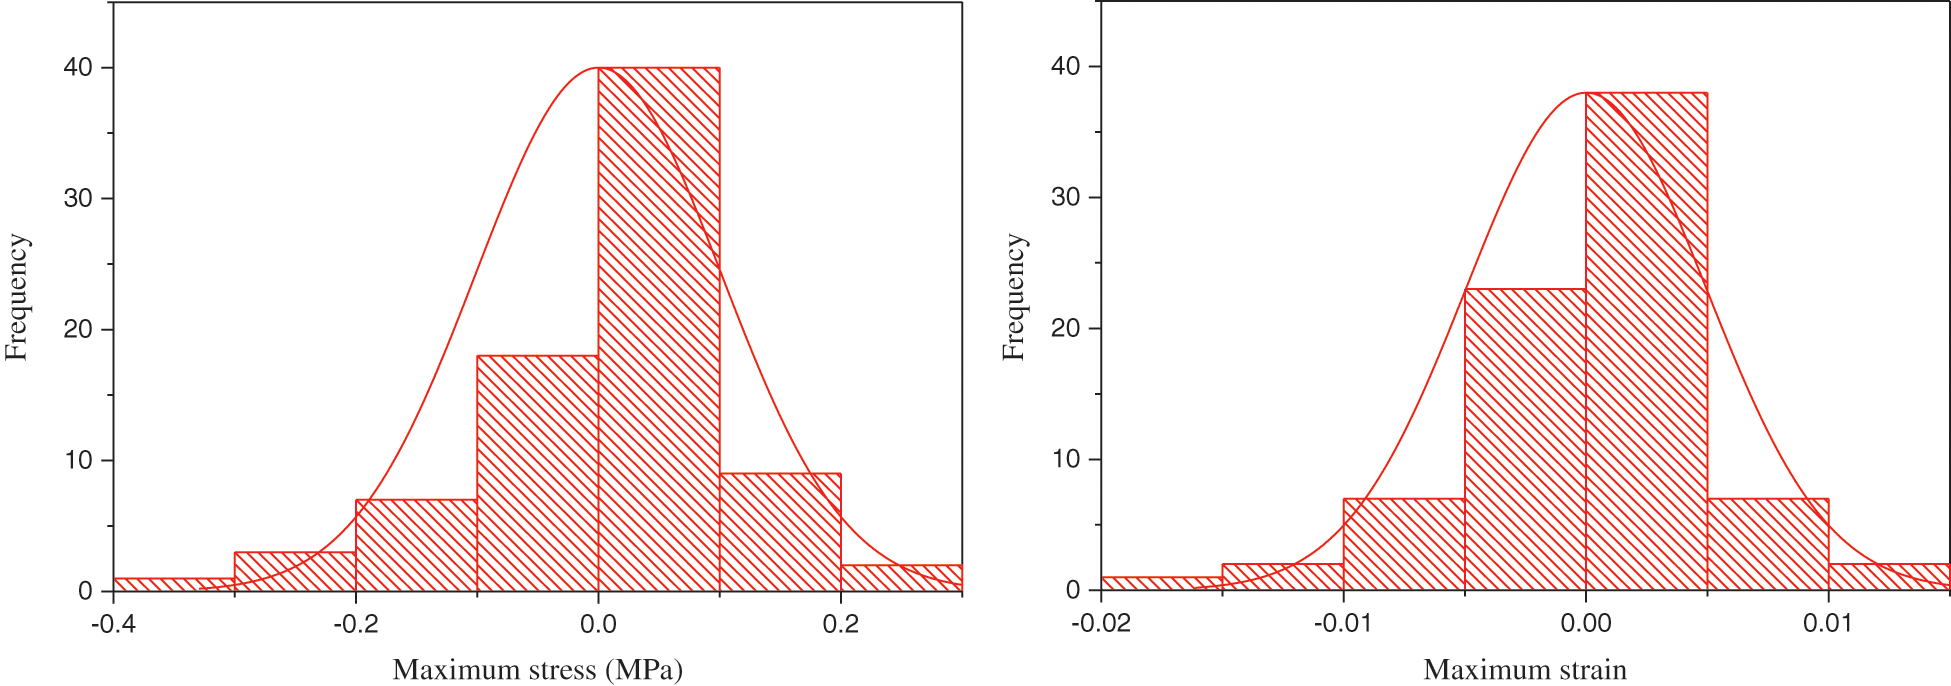
Figure 8: The stress versus number of occurrences and strain versus the number of occurrences
To focus on a large-scale geostructure seismic response and analysis, the linear regression model was applied to predict nonlinear maximum stress and nonlinear maximum strain for 80 stages of the nonlinear finite element method results. The maximum stress versus maximum acceleration and maximum strain versus maximum acceleration were depicted in Fig. 9. The R2 and RMSE for maximum stress and maximum strain indicate in Tab. 3. From the linear regression model results, the value of R2 for maximum stress and maximum strain are 0.869 and 0.853, respectively. The value of RMSE for maximum stress and maximum strain are 0.102 and 0.005, respectively. The R2 and RMSE for maximum stress and maximum strain have confirmed the accuracy of the prediction made by the histogram model.
With considering nonlinear stress data and nonlinear strain data distribution which are presented in Fig. 9. The linear regression model is an appropriate soft computing technique (SC) for evaluating the results of NFEM. The plotted line by linear regression model shows a linear curve pattern for maximum stress and maximum strain is spread relatively homogeneous throughout the range of maximum acceleration.
Table 3: The R2 and RMSE for maximum stress versus maximum acceleration and maximum strain versus maximum acceleration
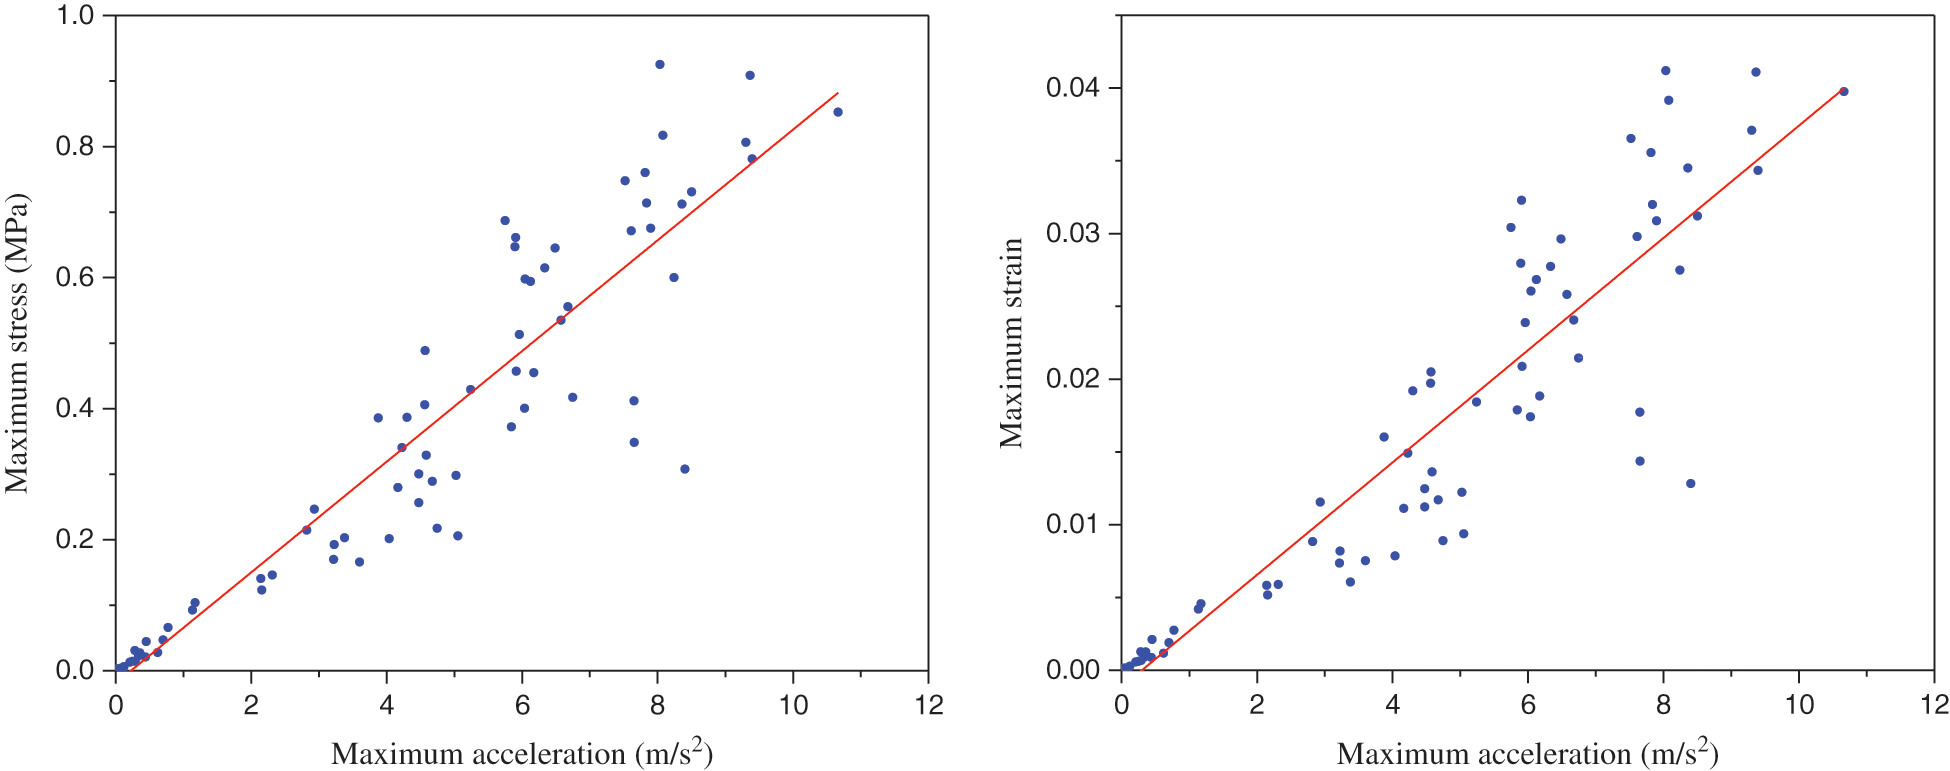
Figure 9: Explain stress-strain versus acceleration using linear regression analysis
The nature of the seismic loads interaction influences the stress and strain distribution and causes the model excitation with different magnitude and shape. The resultants of the nonlinear stress distribution acting on the embankment-subsoil model and causes developing nonlinear deformation on the model in the period of excitation. When the nonlinear stress and strain distribution in loading and reloading stages are distributed at a high level of nonlinearity, higher model excitation is expected. Basis of the stress and strain evaluation by using histogram, the excitation, nonlinear deformation, and displacement of the model can be predicted.
In the histogram, the nonlinear strain has a more symmetric shape compared to the nonlinear stress, this phenomenon was occurred owing to embankment and subsoil have the same material. And more the nonlinear strain energy is expected in a model with multi-materials. The symmetric and bell-shaped histogram is presented normal distribution for stress and strain. With attention to the shape of the histogram, it makes more convenient for appropriate engineering judgment in a large-scale geostructure seismic design. This study supports the improvement of engineering judgment quality for seismic analysis of an embankment through validating results of NFEM by employing an appropriate soft computing technique. The close value of R2 and RMSE from the linear regression results show accuracy NFEM for the characterization of nonlinear stress and strain behavior. The R2 value from the linear regression model obtained for maximum stress and the maximum strain was confirmed the histogram prediction is applicable for simulation of the nonlinear finite element method results in the seismic design of a large-scale geostructure. The fitting line in a regression model which is presented in Fig. 10, it shows the nonlinear stress and strain distribution during seismic excitation of the large-scale geostructure, the validity of the present work is confirmed concerning the linear regression model results and histogram, it is because of the maximum nonlinear stress and nonlinear strain using histogram were depicted in the symmetric and bell-shaped.
With consider of the nonlinear stress-strain relationship and distribution which are presented in Figs. 10–14, the linear regression model is an appropriate soft computing technique (SC) for evaluating the results of NFEM. The R2 and RMSE for maximum stress and maximum strain nonlinear relationship are indicated in Tab. 4. The R2 and RMSE have been obtained 0.99365 and 0.02245, respectively. These values are indicated the linear regression model was showed the accuracy of NFEM results. The stress-strain relationships for the embankment-subsoil model are shown from initial the stress-strain is not more nonlinear, while with increasing time of applying nonlinear load the nonlinearity of the stress-strain was increased.
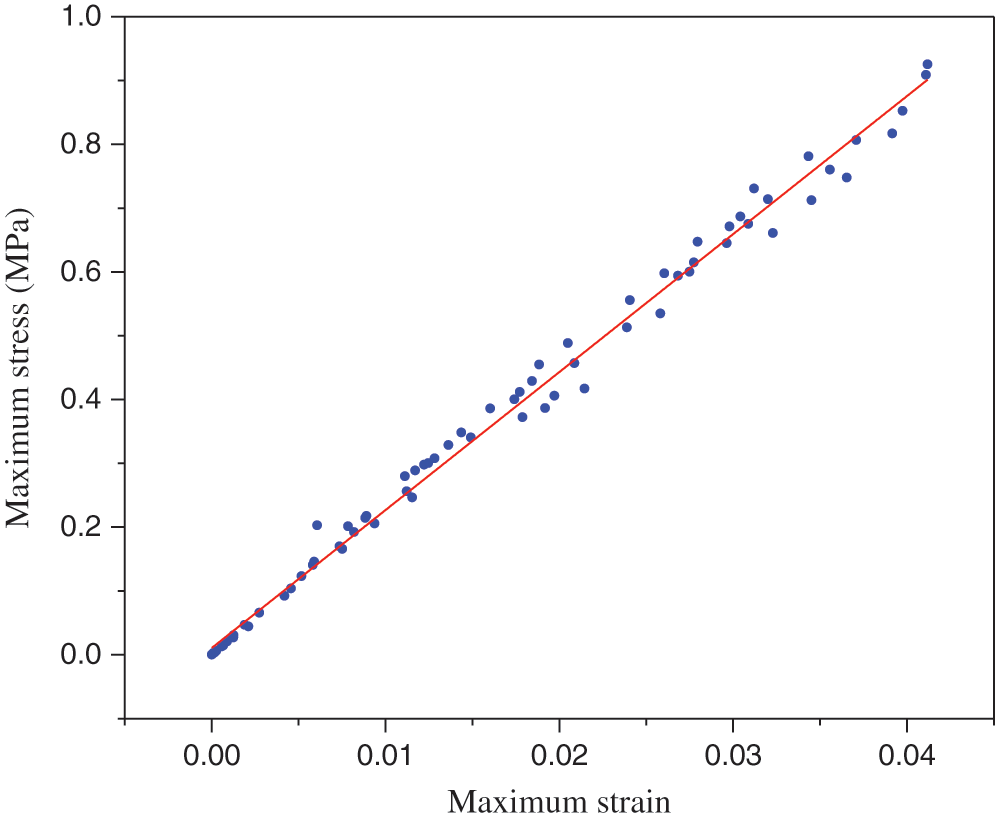
Figure 10: Explain maximum stress vs. maximum strain using linear regression analysis
Table 4: The R2 and RMSE for maximum stress vs. maximum strain
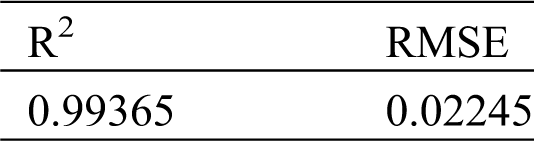
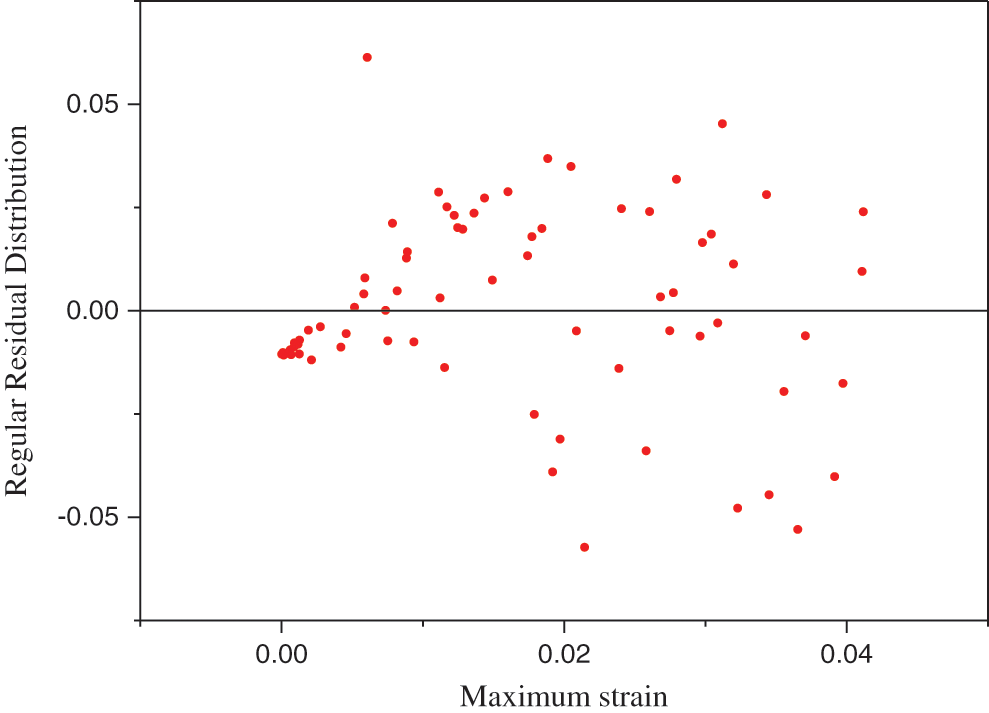
Figure 11: Maximum strain shown in the regular residual distribution
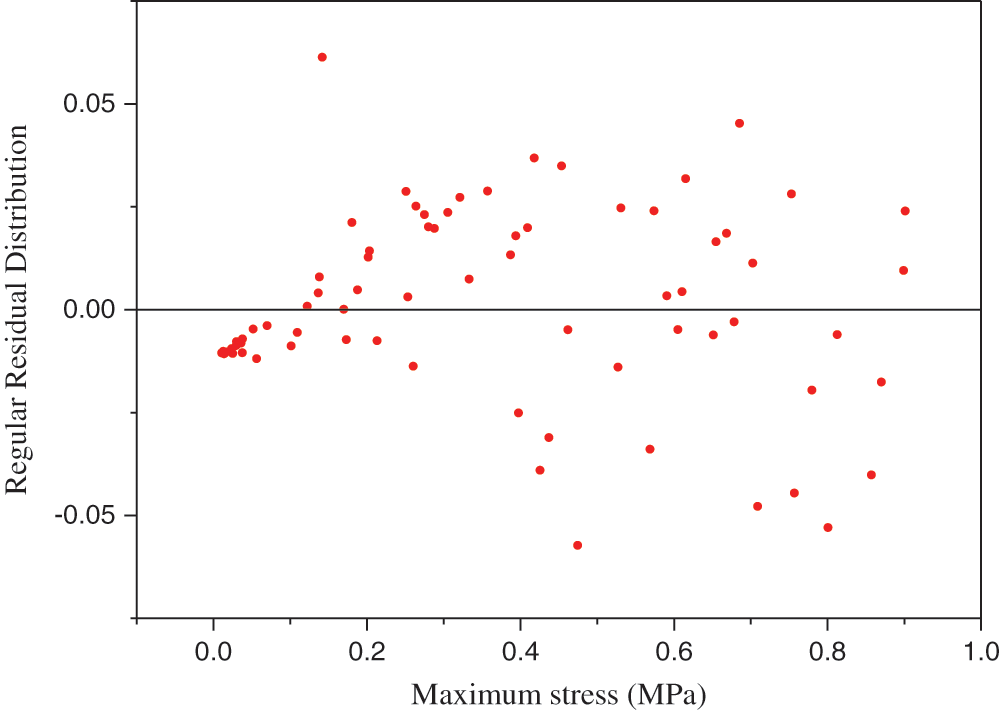
Figure 12: Maximum stress shown in the regular residual distribution
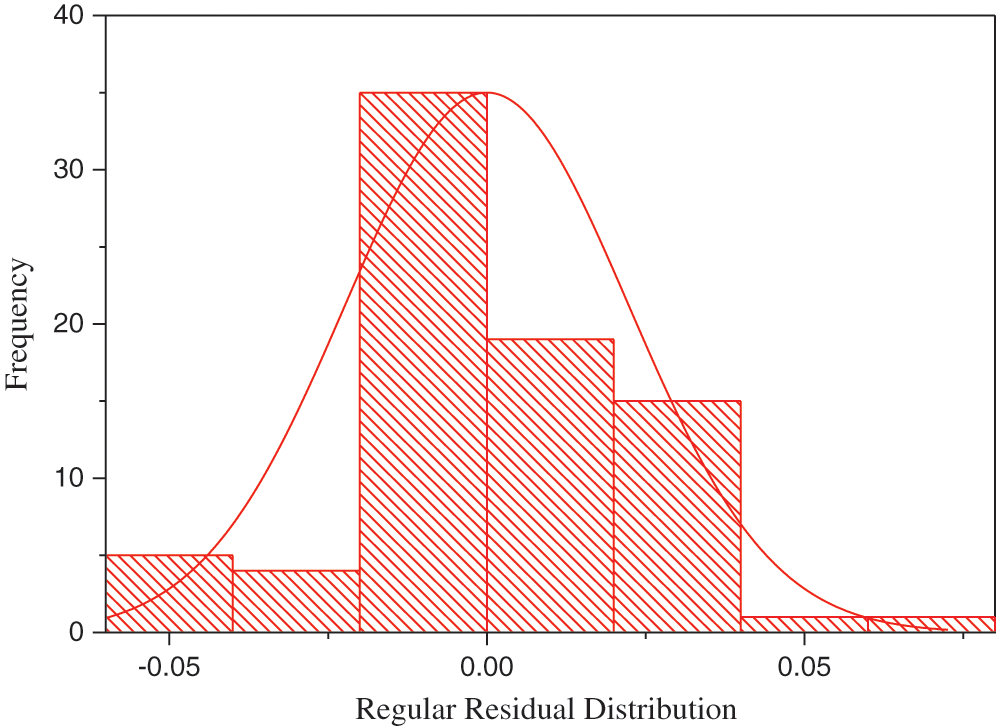
Figure 13: Histogram for the stress-strain relationship in large-scale geostructure seismic response
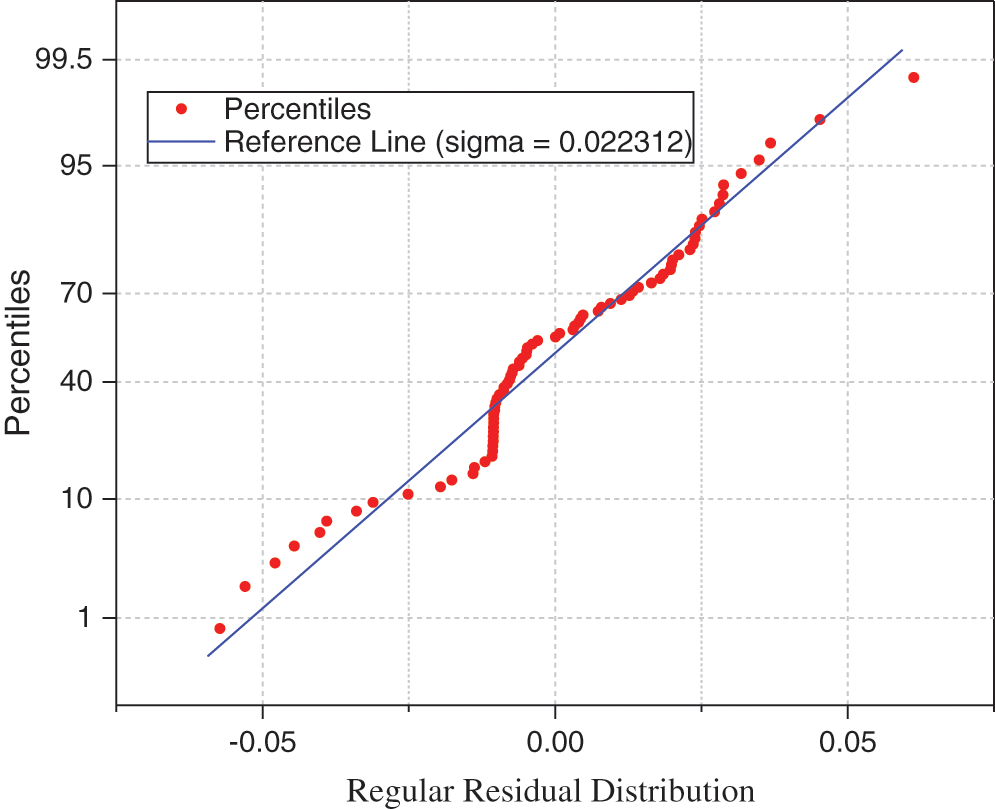
Figure 14: The stress-strain relationship regular residual distribution
5 Apply a Linear Regression Model to Related Work
The application of the linear regression model in the prediction of the seismic embankment was studied. The stress-strain relationship is changed, was showed by linear regression model. The histogram shows the regression model is adequate for validating NFEM results in the large-scale geostructure seismic design.
The elastic-plastic finite element analysis was performed to assess the local stress-strain reactions of the notch-root [33], to predict the fatigue of cylinder block was subjected to vibration, the finite element modeling was employed [34]. The Abaqus was used to analyzes cantilever beam [35], thermal stress analysis [36], composite material [37], substructure [38], fracture of steels [39] and fluid-structure interaction [40], and also other NFEM software such as Ansys was used in tunneling stability assessment [41]. The linear regression model can apply for evaluating and validate all the mentioned research investigations.
The nonlinear stress-strain relationship was investigated to assess seismic stability of embankment [42], timber structure [43], constituents of Bio-Inspired [44], damage modeling of softening materials [45], crushable foam model [46], and several other problems have been reported in the literature using the shaking table for seismic embankment simulation [47,48]. The application linear regression model is not limited to NFEM and stress-strain relation; however, the linear regression model can applying in the vast field of science and technology for analysis stress-strain relationship.
Fig. 15 shown nonlinear acceleration was simulated using shaking table tests [49], because of experiments performing under laboratory conditions for obtaining nonlinear acceleration, the results are needed to verify using statistical analysis. The seismogram records the acceleration of an earthquake but the seismic waves travel the path to reach an infrastructure with modification of the seismic wave characteristics is a required analysis using statistical modeling as well. Fig. 15 shown nonlinear acceleration was simulated and traveling in the embankment-subsoil using shaking table test, three acceleration sensors were showed three different acceleration characteristics [49], apply nonlinear strain energy on geostructures cases the unexpected excitation owing to internal and external loads interaction, under this situation nonlinear stress and nonlinear strain is developing.
There are several problems are related to seismic and cycle fatigue that have excellently been solved and validate with different methods such as large-scale 3D simulations of seismic wave propagation [50], the damage probability matrix of the structure is subjected to the ground motion [51], seismic parameters of the bridge [52], liquefaction assessment [53], masonry tower and masonry buildings seismic analysis [54,55], considering cycle fatigue [56,57], however, the statistical model could be applied for all of these investigations.
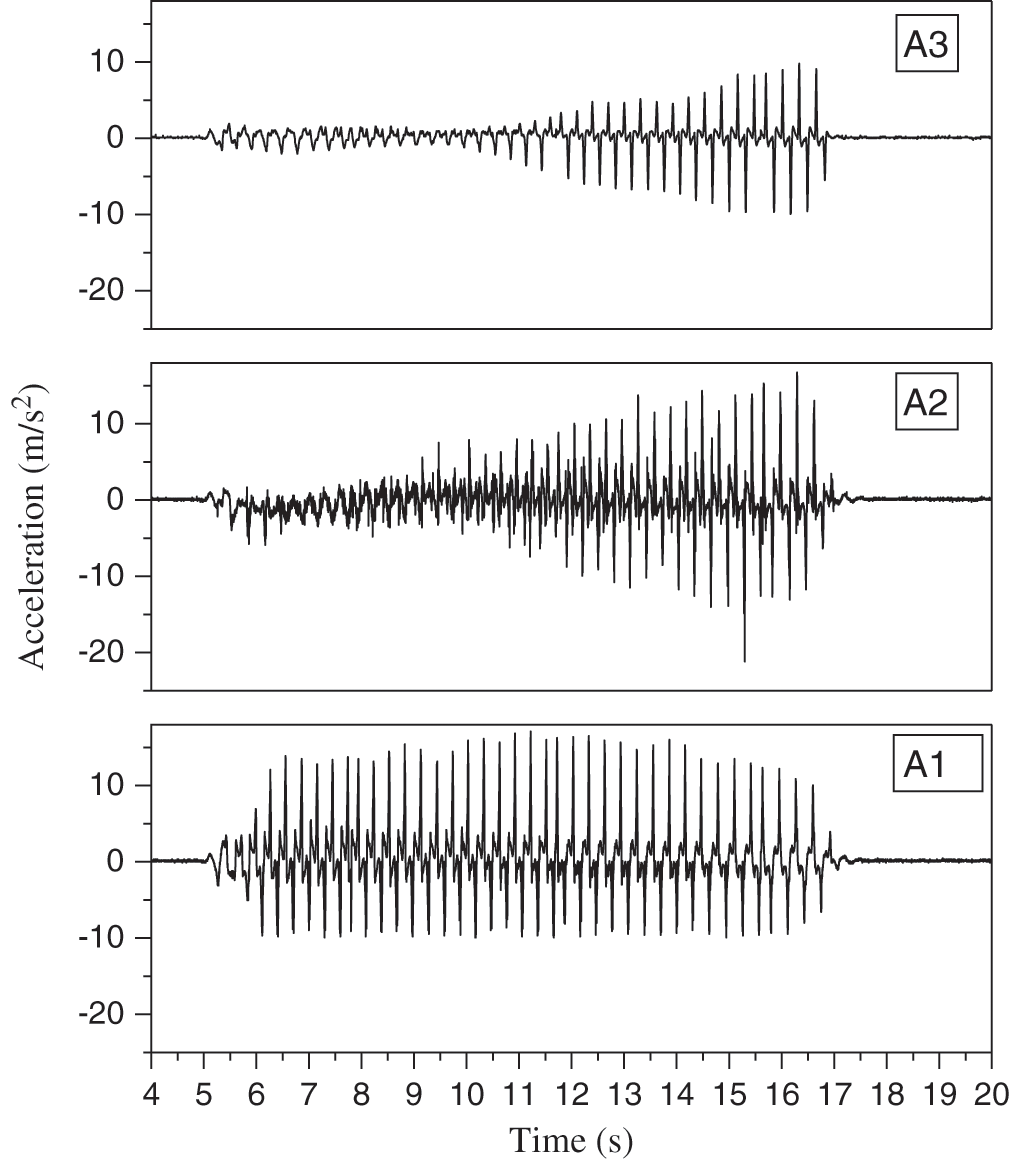
Figure 15: Nonlinear acceleration simulated using a shaking table test [49]
The large-scale geostructure was seismically simulated and analyzed using the nonlinear finite element method (NFEM) and the soft computing technique (SC) was applied for evaluating the results of NFEM. The nonlinear stresses and nonlinear strains probability distribution occurrence and density are predicted by using the histogram.
The nature of the load interaction influences the stress and strain distribution. The large elastic strain and large stress range during loading are governing the main seismic excitation and failure of the large-scale geostructure. The determination of the nonlinear stress and strain distribution on the large-scale geostructure is supported decision-making in geostructures seismic design. The nonlinear stress and nonlinear strain probability distribution occurrence and density of the stress and strain are predicted through the histograms which are symmetric and bell-shaped, and these histograms are presented the normal distribution of the predicted stress and strain.
The linear regression model has plotted a linear curve pattern for maximum stress and strain. The R2 value from the linear regression model has confirmed the histogram prediction is applicable for simulation of the nonlinear finite element method results in the seismic design of a large-scale geostructure. The shape of the histogram and linear regression model are confirming the accurate prediction of the NFEM results for the large-scale geostructure seismic design. The R2 and RMSE for maximum stress and strain have confirmed the prediction made by the histogram model. The outcome of this study guides the improvement of a large-scale geostructure engineering design quality through evaluation of the stress-strain relationship of the simulated model by using appropriate soft computing techniques.
Funding Statement:The author received no specific funding for this study.
Conflicts of Interest: The author declare that he has no conflicts of interest to report regarding the present study.
1. Zhang, X., Bi, J., Guo, D., Li, Z. (2019). Numerical simulation of stability analysis of soil slope using general particle dynamics with elastic-plastic constitutive model. Material Design & Processing Communications, e51, 1–7. [Google Scholar]
2. Namdar, A., Dong, Y. (2020). The embankment-subsoil displacement mechanism. Material Design & Processing Communications, e155, 1–4. [Google Scholar]
3. Namdar, A., Dong, Y. (2019). Seismic resistance and displacement mechanism of the concrete footing. Shock and Vibration, 1–9, 5498505. [Google Scholar]
4. Namdar, A., Dong, Y., Deyu, Y. (2019). The effect of concrete footing shape in differential settlement: A seismic design. Advances in Civil Engineering, 1–8. [Google Scholar]
5. Namdar, A. (2019). The concrete footing-soil foundation seismic interaction, strain energy and stress mechanism. IOP Conf. Series: Earth and Environmental Science, 289, 012009. [Google Scholar]
6. Namdar, A. (2020). The multilayered soil-structure seismic interaction and structure vibration mechanism. Frattura ed Integrità Strutturale, 51, 267–274. [Google Scholar]
7. Namdar, A. (2016). A numerical investigation on soil-concrete foundation interaction. Procedia Structural Integrity, 2, 2803–2809. [Google Scholar]
8. Namdar, A., Dong, Y., Liu, Y. (2019). The effect of nonlinearity of acceleration histories to timber beam seismic response. Material Design & Processing Communications, 1(2), 1–4. [Google Scholar]
9. Namdar, A., Dong, Y., Liu, Y. (2019). Timber beam seismic design – A numerical simulation. Frattura ed Integrità Strutturale., 47, 451–458. [Google Scholar]
10. Namdar, A., Darvishi, E., Feng, X., Zakaria, I., Yahaya, F. M. (2016). Effect of flexural crack on plain concrete beam failure mechanism-A numerical simulation. Frattura ed Integrità Strutturale., 36, 168–181. [Google Scholar]
11. Namdar, A., Darvishi, E., Feng, X., Ge, Q. (2016). Seismic resistance of timber structure - a state of the art design. Procedia Structural Integrity, 2, 2750–2756. [Google Scholar]
12. Namdar, A. (2016). Failure analysis of concrete frame-A numerical analysis. Procedia Structural Integrity, 2, 2796–2802. [Google Scholar]
13. Yoshida, F., Amaishi, T. (2020). Model for description of nonlinear unloading-reloading stress-strain response with special reference to plastic-strain dependent chord modulus. International Journal of Plasticity (In press). [Google Scholar]
14. Huang, D., Bian, Y., Zhou, A., Sheng, B. (2015). Experimental study on stress-strain relationships and failure mechanisms of parallel strand bamboo made from phyllostachys. Construction and Building Materials, 77, 130–138. [Google Scholar]
15. Li, H., Zhang, H., Qiu, Z., Su, J., Wei, D. et al. (2020). Mechanical properties and stress strain relationship models for bamboo scrimber. Journal of Renewable Materials, 8(1), 13–27. [Google Scholar]
16. Coulais, C. (2016). Periodic cellular materials with nonlinear elastic homogenized stress-strain response at small strains. International Journal of Solids and Structures, 97–98, 226–238. [Google Scholar]
17. Giannadakis, K., Varna, J. (2014). Analysis of nonlinear shear stress-strain response of unidirectional GF/EP composite. Composites Part A: Applied Science and Manufacturing, 62, 67–76. [Google Scholar]
18. Pytka, J., Da̧browski, J. (2001). Determination of the stress-strain relationship for sandy soil in field experiments. Journal of Terramechanics, 38(4), 185–200. [Google Scholar]
19. Cofie, P., Koolen, A. J., Perdok, U. D. (2000). Measurement of stress-strain relationship of beech roots and calculation of the reinforcement effect of tree roots in soil-wheel systems. Soil and Tillage Research, 57(1–2), 1–12. [Google Scholar]
20. Jang, E. R., Jung, Y. H., Chung, C. K. (2010). Stress ratio-fabric relationships of granular soils under axi-symmetric stress and plane-strain loading. Computers and Geotechnics, 37(7–8), 913–929. [Google Scholar]
21. Namdar, A., Feng, X. (2015). Economical considerations in the development of construction materials–A review. Engineering Review, 35(3), 291–297. [Google Scholar]
22. Namdar, A., Yahaya, F. M. (2014). Recent advances study on liquefaction and time to failure of sandy subsoil. Electronic Journal of Geotechnical Engineering, 19(Bund. G), 1501–1517. [Google Scholar]
23. Ghosal, S., Sengupta, S., Majumder, M., Sinha, B. (2020). Linear regression analysis to predict the number of deaths in India due to SARS-CoV-2 at 6 weeks from day 0 (100 cases-March 14th 2020). Diabetes & Metabolic Syndrome: Clinical Research & Reviews, 14, 1–5, 2020. [Google Scholar]
24. Nakamura, K., Yasutaka, T., Kuwatani, T., Komai, T. (2017). Development of a predictive model for lead, cadmium and fluorine soil-water partition coefficients using sparse multiple linear regression analysis. Chemosphere, 186, 501–509. [Google Scholar]
25. Khademi, F., Jamal, S. M., Deshpande, N., Londhe, S. (2016). Predicting strength of recycled aggregate concrete using artificial neural network, adaptive neuro-fuzzy inference system and multiple linear regression. International Journal of Sustainable Built Environment, 5, 355–369. [Google Scholar]
26. Zare, S., Fallah Shamsi, S. R., Abtahi, S. A. (2019). Weakly-coupled geo-statistical mapping of soil salinity to Stepwise Multiple Linear Regression of MODIS spectral image products. Journal of African Earth Sciences., 152, 101–114. [Google Scholar]
27. Ruan, X., Huang, W., Zhang, L., Gao, Y. (2019). Prediction of outdoor noise propagation induced by single-phase power transformers. Sound &Vibration, 53(1), 2–13. [Google Scholar]
28. Woo, S., Cho, J. Y., Kim, S. Y., Kim, S. H. (2014). Histogram analysis of apparent diffusion coefficient map of diffusion-weighted MRI in endometrial cancer: A preliminary correlation study with histological grade. Acta Radiol. vol. 55, pp. 1270–1277. London, England: SAGE Publications Sage UK. [Google Scholar]
29. Clément, A., Vigouroux, B. (2003). Unsupervised segmentation of scenes containing vegetation (Forsythia) and soil by hierarchical analysis of bi-dimensional histograms. Pattern Recognition Letters, 24(12), 1951–1957. [Google Scholar]
30. Barman, U., Choudhury, R. D. (2019). Soil texture classification using multi class support vector machine. Information Processing in Agriculture (in Press). [Google Scholar]
31. Valleti, D. P., Sathyam, N., Sivaranjani, S., Shahin, C., Mondal, S. (2018). Design of buried flexible pipelines during liquefaction. International Journal of Engineering & Technology, 2(21), 259–265. [Google Scholar]
32. https://strongmotioncenter.org/. [Google Scholar]
33. Savaidis, G., Pitatzis, N., Savaidis, A., Zhang, C. (2008). FE analysis of a notched cylinder under multiaxial cyclic loading using the multilayer model of besseling. Structural Durability & Health Monitoring, 4(3), 145–160. [Google Scholar]
34. Rahman, M. M., Ariffin, A. K., Abdullah, S., Rosli, A. B. (2008). Effect of nitriding treatment on fatigue life for free piston linear engine component using frequency response method: A finite element approach. Structural Durability & Health Monitoring, 3(4), 197–210. [Google Scholar]
35. Kshrisagar, S., Francis, A., Yee, J. J., Natarajan, S., Lee, C. K. (2019). Implementing the node based smoothed finite element method as user element in Abaqus for linear and nonlinear elasticity. Computers, Materials & Continua, 61(2), 481–502. [Google Scholar]
36. Anding, D. K. (2005). Constitutive equations in finite element codes: The INTERATOM model in ABAQUS. Structural Durability & Health Monitoring, 1(2), 95–105. [Google Scholar]
37. Hedayati, E., Vahedi, M. (2017). Numerical investigation of penetration in Ceramic/Aluminum targets using Smoothed particle hydrodynamics method and presenting a modified analytical model. CMES-Computer Modeling in Engineering & Sciences, 113(3), 295–323. [Google Scholar]
38. Li, B., Fang, H. Y., He, W., Sun, B. (2017). Stability analysis of cross-channel excavation for existing anchor removal project in subway construction. Computer Modeling in Engineering & Sciences, 113(1), 57–69. [Google Scholar]
39. Husain, A., Guniganti, M., Sehgal, D. K., Pandey, R. K. (2009). Identification of materials properties with the help of miniature shear punch test using finite element method and neural networks. Computer Modeling in Engineering & Sciences, 8(3), 133–149. [Google Scholar]
40. Du, X. H., Shen, X. P. (2010). Numerical simulation of fluid-structure interaction of LNG prestressed storage tank under seismic influence. Computer Modeling in Engineering & Sciences, 20(3), 225–241. [Google Scholar]
41. Su, D., Yong Kang, Y., Wang, X., Zheng, A., Li, D. et al. (2016). Analysis and numerical simulation for tunnelling through coal seam Assisted by water jet. CMES-Computer Modeling in Engineering & Sciences, 111(5), 375–393. [Google Scholar]
42. Namdar, A., Pelko, A. K. (2011). Embankment loading analysis in laboratory condition. Ingeniería E Investigación, 31(2), 48–51. [Google Scholar]
43. Namdar, A., Dong, Y., Deyu, Y. (2019). The effect of nonlinearly of acceleration histories to timber beam seismic response. Material Design & Processing Communications, 019, e53. [Google Scholar]
44. Lasko, G., Schäfer, I., Burghard, Z., Bill, J., Schmauder, S. et al. (2013). Derivation of the stress-strain behavior of the constituents of bio-inspired layered TiO2/PE-nanocomposites by inverse modeling based on FE-simulations of nanoindentation test. Molecular & Cellular Biomechanics, 10(1), 27–42. [Google Scholar]
45. Yang, Y., Misra, A. (2010). Higher-order stress-strain theory for damage modeling implemented in an element-free Galerkin formulation. Computer Modeling in Engineering & Sciences, 64(1), 1–36. [Google Scholar]
46. Joseph, J., Lu, Y. C. (2014). Finite element modeling of compressive deformation of super-long vertically aligned carbon nanotubes. Computers, Materials & Continua, 42(1), 63–74. [Google Scholar]
47. Gopalakrishna, G. S., Namdar, A. (2009). Stability analysis of the embankment model.Bulletin of the Polytechnic Institute of Jassy, Universitatea Tehnică, Gheorghe Asachi, din Iaşi,Secţia, Construcţii Ărhitectură.Tomul LV (LIXFasc. 4. [Google Scholar]
48. Namdar, A. (2009). Seismic evaluation of sandy embankment model.Bulletin of the Polytechnic Institute of Jassy, Universitatea Tehnică, Gheorghe Asachi, din Iaşi,Secţia, Construcţii Ărhitectură.Tomul LV (LIXFasc. 3. [Google Scholar]
49. Namdar, A., Gopalakrishna, G. S. (2008). Seismic mitigation of embankment by using dense zone in subsoil. Emirates Journal for Engineering Research, 13(3), 55–61. [Google Scholar]
50. Furumura, T., Chen, L. (2004). Large scale parallel simulation and visualization of 3D seismic wavefield using the earth simulator. Computer Modeling in Engineering & Sciences, 6(2), 153–168. [Google Scholar]
51. Liu, J., Zhang, L., Zhang, H., Liu, T. (2019). Seismic vulnerability analysis of single-story reinforced concrete industrial buildings with seismic fortification. Structural Durability & Health Monitoring, 13(2), 123–142. [Google Scholar]
52. Deng, T., Zhang, J., Bayat, M. (2018). Simplified method and influence factors of vibration characteristics of isolated curved girder bridge. Structural Durability & Health Monitoring, 12(3), 189–212. [Google Scholar]
53. Qiu, Z., Lu, J., Elgamal, A., Su, L., Wang, N. et al. (2019). Open sees three-dimensional computational modeling of ground-structure systems and liquefaction scenarios. Computer Modeling in Engineering & Sciences, 120(3), 629–656. [Google Scholar]
54. Facchini, L., Betti, M. (2014). An efficient Bouc & Wen approach for seismic analysis of masonry tower. Frattura ed Integrità Strutturale, 8(29), 139–149. [Google Scholar]
55. Guadagnuolo, M., Aurilio, M., Faella, G. (2019). Retrofit assessment of masonry buildings through simplified structural analysis. Frattura ed Integrità Strutturale, 14(51), 398–409. [Google Scholar]
56. Branco, R., Prates, P., Berto, F., Costa, J., Antunes, F. (2019). Mixed numerical-experimental method for generation of energy-life fatigue master curves. Material Design & Processing Communications, 1(e37), 1–7. [Google Scholar]
57. Viespoli, L. M., Berto, F. (2019). Rapid extrapolation of high-temperature low-cycle fatigue curves for a nickel superalloy. Material Design & Processing Communications, 1(e104), 1–4. [Google Scholar]
 | This work is licensed under a Creative Commons Attribution 4.0 International License, which permits unrestricted use, distribution, and reproduction in any medium, provided the original work is properly cited. |