| Structural Durability & Health Monitoring |
DOI: 10.32604/sdhm.2021.017720
ARTICLE
Fatigue Crack Detection in Steel Plates Using Guided Waves and an Energy-Based Imaging Approach
1Beijing Key Laboratory of Civil Aircraft Structures and Composite Materials, COMAC Beijing Aircraft Technology Research Institute, Future Science and Technology Park, Beijing, 102211, China
2College of Automation & College of Artificial Intelligence, Nanjing University of Posts and Telecommunications, Nanjing, 210023, China
*Corresponding Author: Mingyu Lu. Email: lumingyu@comac.cc
Received: 01 June 2021; Accepted: 21 June 2021
Abstract: The increasing use of ultrasonic guided waves (GWs) has been shown to have great potential for the detection of fatigue cracks and non-fatigue type damages in metallic structures. This paper reports on a study demonstrating an energy-based damage imaging approach in which signal characteristics identified through relative time differences by fatigue crack (RTD/f) through different sensor paths are used to estimate the location of fatigue crack in steel plates based on GWs generated by an active piezoceramic transducer (PZT) network. The propagation of GWs in the original 10 mm-thick plate was complicated due to its thick geometry, wave dispersion, boundary reflection and the existing boundary notch used to initiate the fatigue crack, resulting in diverse forms of interference with fatigue crack identification. Hence, RTD/fs were extracted from the wave energy spectrum with the aid of a wavelet transform (WT) and a correlation function. The series of tests carried out in this study include a fatigue test in which a fatigue crack was introduced to the steel plate, in addition to subsequent tensile and compressive tests designed to investigate the effect of loading on wave signals. Simultaneously, the proposed method was verified by finite element analysis and good agreement was obtained between the numerical and experimental results using the developed fatigue crack model. The results show that fatigue cracks can scatter GWs via discontinuous contact between crack surfaces under cyclic fatigue loadings, thus demonstrating the effectiveness of the proposed method for the real-time monitoring of fatigue cracks in metallic structures.
Keywords: PZT; damage detection; fatigue crack identification; energy-based imaging approach
The degradation of engineering materials due to the initiation of fatigue cracks is known to be one of the main reasons for the widespread failure of older engineering structures [1]. The risk from the propagation of cracks is in recent years considered a significant failure affecting structural integrity that is directly related to public safety. Fatigue cracks that appear under cyclic loads are the most common cause of failure in metallic structures in the vast majority of public transportation vehicles. There is no doubt that fatigue cracks that appear while such public transportation vehicles are being operated can lead to irreversible and catastrophic consequences. Therefore, it is especially important to detect and monitor fatigue cracks initiated by pitting to predict the remaining fatigue life of aging public transportation vehicles and ensure they are maintained in a timely manner. Structural health monitoring (SHM) is one of the major maintenance activities undertaken in a broad range of industries [2]. Heterogeneous detecting techniques have been developed for identification of fatigue cracks, including contact and non-contact sensing methods which have been employed with a view to locate or monitor fatigue cracks in variable material [3–6]. Laser-based technology (LBT) has received much attention and is a topic of considerable interest in metallic and composite structures [7,8] as a baseline-free technique.
The traditional GW method based on PZT transducers has some unique advantages over LBT. First, PZT-based monitoring strategies that employ the GW method rely solely on a series of actuator/sensor transducers for the generation and collection of GWs. Laser vibrometry systems involved in data acquisition also requires a PZT to generate GWs in order to obtain adequate results. Second, although LBT has been adopted and shown to be effective in a large number of applications, it seems more suitable for metallic or composite plate-like structures than for complex structures, due to the conditions in which it is applied [9,10]. However, welded structures with complex boundaries are ubiquitous across a wide range of industries. Moreover, the PZT-based GW method has been shown to be effective in detecting welds [11] and detecting damage in welded tubular steel structures [12]. The comparative practicability of the GW method over LBT is abundantly clear in terms of its use in the framework of a bogie system for a train carriage, located on the underside of a train. Third, the PZT-based GW method is capable of detecting damage remote from sensors that can be mounted permanently both easily and economically. In comparison with LBT, in which laser vibrometers must be used to scan the material surface directly for signs of damage, the PZT-based GW method involving active sensor networks in critical sections of structures and is a promising method for the online sensing and provision of data to reveal structural integrity status.
Fatigue crack detection is a subject that has received increasing attention in recent years. An ultrasonic GW technique has been used to inspect both metallic and composite structures subject to fatigue loadings [13–15]. In addition to linear GWs, nonlinear GWs can also be used to characterize fatigue damage, although the accurate experimental realization of nonlinear Lamb waves is generally difficult due to their dispersive and multi-mode nature [16–18].
The aim of the study reported in this paper was to demonstrate the application of a probability-based imaging approach based on GWs for detecting fatigue cracks and load effects, while eliminating the effect of adjacent notches. The rest of this paper is organized as follows. The next section describes how a fatigue crack was introduced into a thick steel plate with multiple boundaries due to two supporting holes and a notch. GWs generated by an active PZT transducer network were then combined with an imaging approach with the aid of the RTD/fs concepts to estimate the presence and location of the fatigue crack. The following section of the paper then describes a series of tensile tests and compressive tests employed to assess the different load effects of the fatigue crack. The paper concludes with a brief summary of the findings made and a discussion of their implications.
As shown in Fig. 1, the steel plate investigated was 555 mm × 200 mm in size and 10 mm in thickness, and was designed according to our previous study [12]. The detailed material properties of the specimen are reported in Tab. 1. Considering that most fatigue cracks in this kind of structure are initiated and propagated from edges between adjacent facets, an artificial notch 20 mm long and 5 mm wide was induced on one longer edge of the specimen to initiate a fatigue crack. Two 26-mm-diameter holes were drilled in the top and bottom close to the notched side of the plate to facilitate clamping in the fatigue machine.
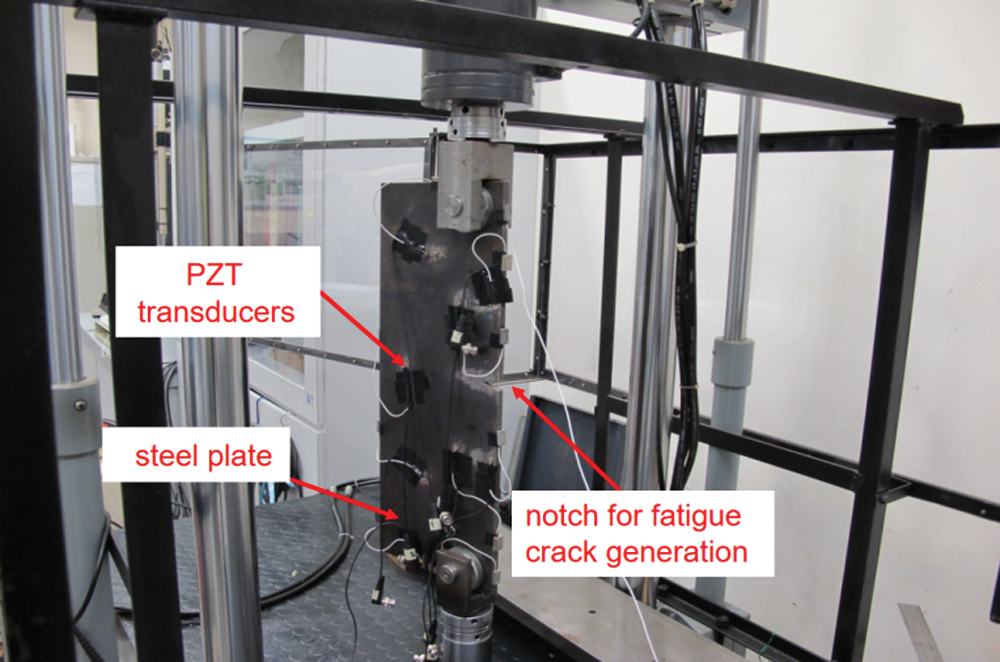
Figure 1: Specimen used in experiments
Seven circular PZT transducers with the same dimensions of 6.9 mm in diameter and 0.5 mm in thickness were surface-mounted to the plate to function as an active sensor network. Each PZT transducer with the properties shown in Tab. 2 could function as either an actuator or a sensor according to the layout illustrated in detail in Fig. 2. The reason for installing this kind of sensor network was to generate an available and isolated wave component and negate the effect of intricate boundaries. The excitation frequency of GWs should be restricted to within a low range according to the dispersive properties of GWs in steel and to avoid the emergence of higher order GW modes which complicate the signal representation and make it hard to extract signal features. However, low frequencies result in comparatively long wavelengths and accordingly low time resolutions for signals. According to our previous study [12], the PZT actuators were excited at 150 kHz by a series of burst signals comprising five cycles of sine waves with the Hanning window envelope in the course of our experiments. The excitation signals were generated in MATLAB® and downloaded to an arbitrary waveform generator (HIOKI® 7075) in which D/A conversion was performed. An amplifier (PiezoSys® EPA-104) was then used to amplify the analog signal to 80 Vp-p, which was then applied to each PZT wafer in turn to activate the GWs. When one of the PZT transducers was activated, the rest of them served as sensors to monitor the propagation of GWs in the steel plate using an oscilloscope (HP® Infinium 54810A) at a sampling rate of 10 MHz.
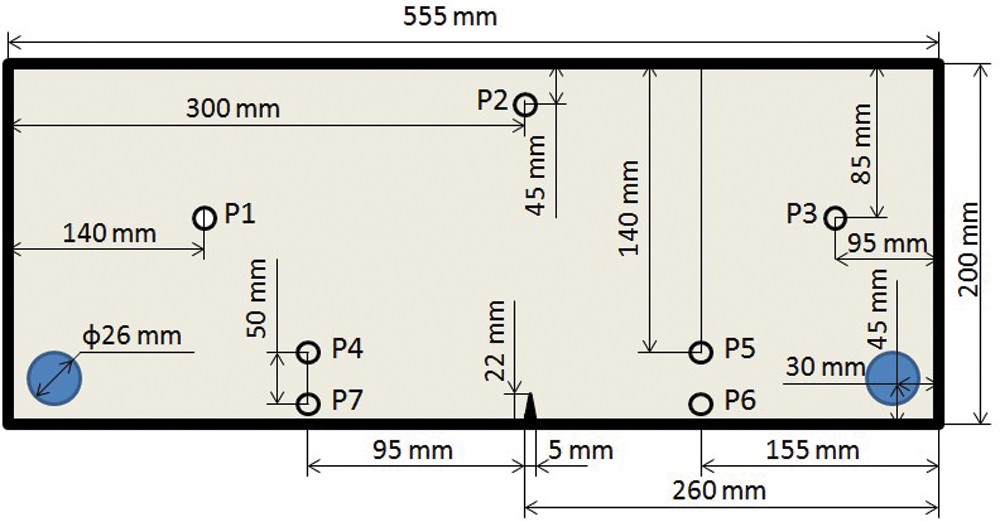
Figure 2: Layout of PZT sensor network
Although it is clear that multiple wave modes cannot be avoided in captured signals, the excitation frequency was strictly restricted to 150 kHz due to the multiple boundaries of the plate. Moreover, the wave packages scattered by the fatigue crack were likely to overlap with those reflected from boundaries because the crack was located particularly close to the physical edges of the plate and to the notch. Based on these conditions, the key points in defining the location of the fatigue crack were a suitable sensor network, an outstanding dominant wave component and a useful set of signal post-processing methods.
3 Fatigue Experiment and Fatigue Crack Identification
The steel plate described above was clamped in a 100 kN MTS fatigue-testing machine in the force-controlled mode via an MTS load unit controller (as shown in Fig. 1). The shorter edges of the plate were symmetrically clamped by inserting two wedges through the two holes. The fatigue test was undertaken through a series of tension-tension tests designed to initiate and grow a crack along the notch. A dynamic cyclic loading of 5–50 kN was employed in the fatigue test. A fatigue crack formed by creating an initial notch before cyclically loading the plate was then introduced to the specimen. The length of the fatigue crack after the fatigue test was 15 mm. The crack was located along the sharp angle of the notch and was parallel to the shorter edges of the plate. A zoom view of the fatigue crack resulting from this fatigue test is shown in Fig. 3.
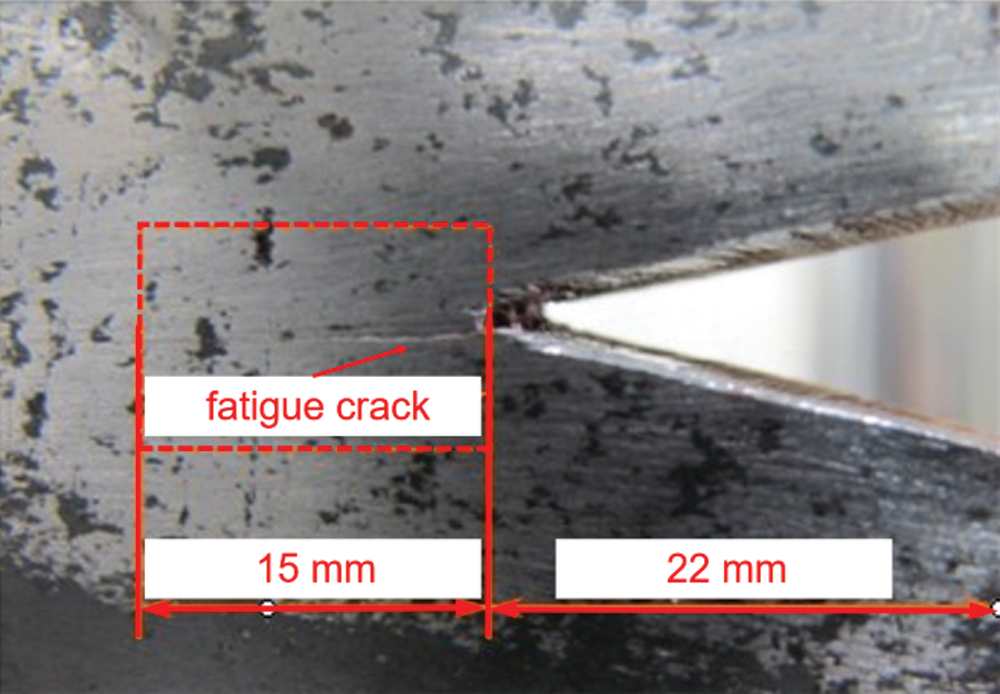
Figure 3: Zoom view of fatigue crack introduced
3.2 Fatigue Crack Identification
3.2.1 Wavelet Transform-Based Signal Processing
In comparison with other GW transducers, PZT transducers can serve as both actuators and sensors, and their portability enables them to be permanently mounted onto the structure to facilitate automated online structural health monitoring through an appropriate sensor network. However, PZTs generally excite multi-mode GWs simultaneously, after which the waves reflected, transmitted or converted at the boundaries cause damage, thus producing complicated wave signals. In addition to the diverse forms of interference caused by materials and natural vibration, fatigue cracks make it more difficult to detect damage due to the characteristics of fatigue failure. In light of the above complications, appropriate high-grade signal processing methods must be applied to discriminate between wave signals and extract wave characteristics. Using advanced signal processing algorithms that have now become prevalent, wavelet transform (WT) technology including a discrete wavelet transform (DWT) and a continuous wavelet transform (CWT) was applied to process the signals obtained in this study. Wavelet analysis can be used to transfer guided-wave signals from the time domain to the time-frequency domain. In numerical analysis and functional analysis, a DWT is any wavelet transform for which the wavelets are discretely sampled. As with other wavelet transforms, one of its key advantages over Fourier transforms lies in temporal resolution: it captures both frequency and location information (location in time). In this study, the DWT defined by Eqs. (1) and (2) was adopted for signal coding to represent a discrete signal in a more redundant form as a precondition for data compression [19]:
where n, m and ak are the dyadic time-scale integers and wavelet amplitudes. The aims of the DWT procedure were to decompose and rebuild the signals using the Mallat algorithm at different levels of frequency for multi-resolution analysis and to reduce the number of redundant coefficients of equal magnitude.
A CWT has the ability to construct a time-frequency representation of a signal that offers very good time and frequency localization, which is then used to divide a continuous-time function into wavelets. In mathematical terms, the CWT of a continuous, square-integrable function x(t) of scale a > 0 is expressed by the following integral.
where a, b,
where the wavelet coefficients stand for the energy density of the relevant signal in the time-frequency domain [21,22].
According to the principles of WT, the scale representative in the WT is proportional to its reciprocal as a substitute for frequency. Thus, after transformation, each previous scale in terms of the time domain bears an equivalence to homologous frequencies in the time-frequency domain. As a result, signal differences due to reflections from a fatigue crack pertaining to an induced notch can be isolated in a specific sub-domain. The fatigue crack can be separated from the signal rebuilt in the sub-domain corresponding to the excitation frequency via the DWT with a combination of wave energy spectrums based on the CWT by extracting the RTD/fs.
A typical signal obtained in the course of the experiment by the actuator-sensor path P12 (No. 1 as the actuator and No. 2 as the sensor) in the time domain before and after initiating the fatigue crack is illustrated in Fig. 4.
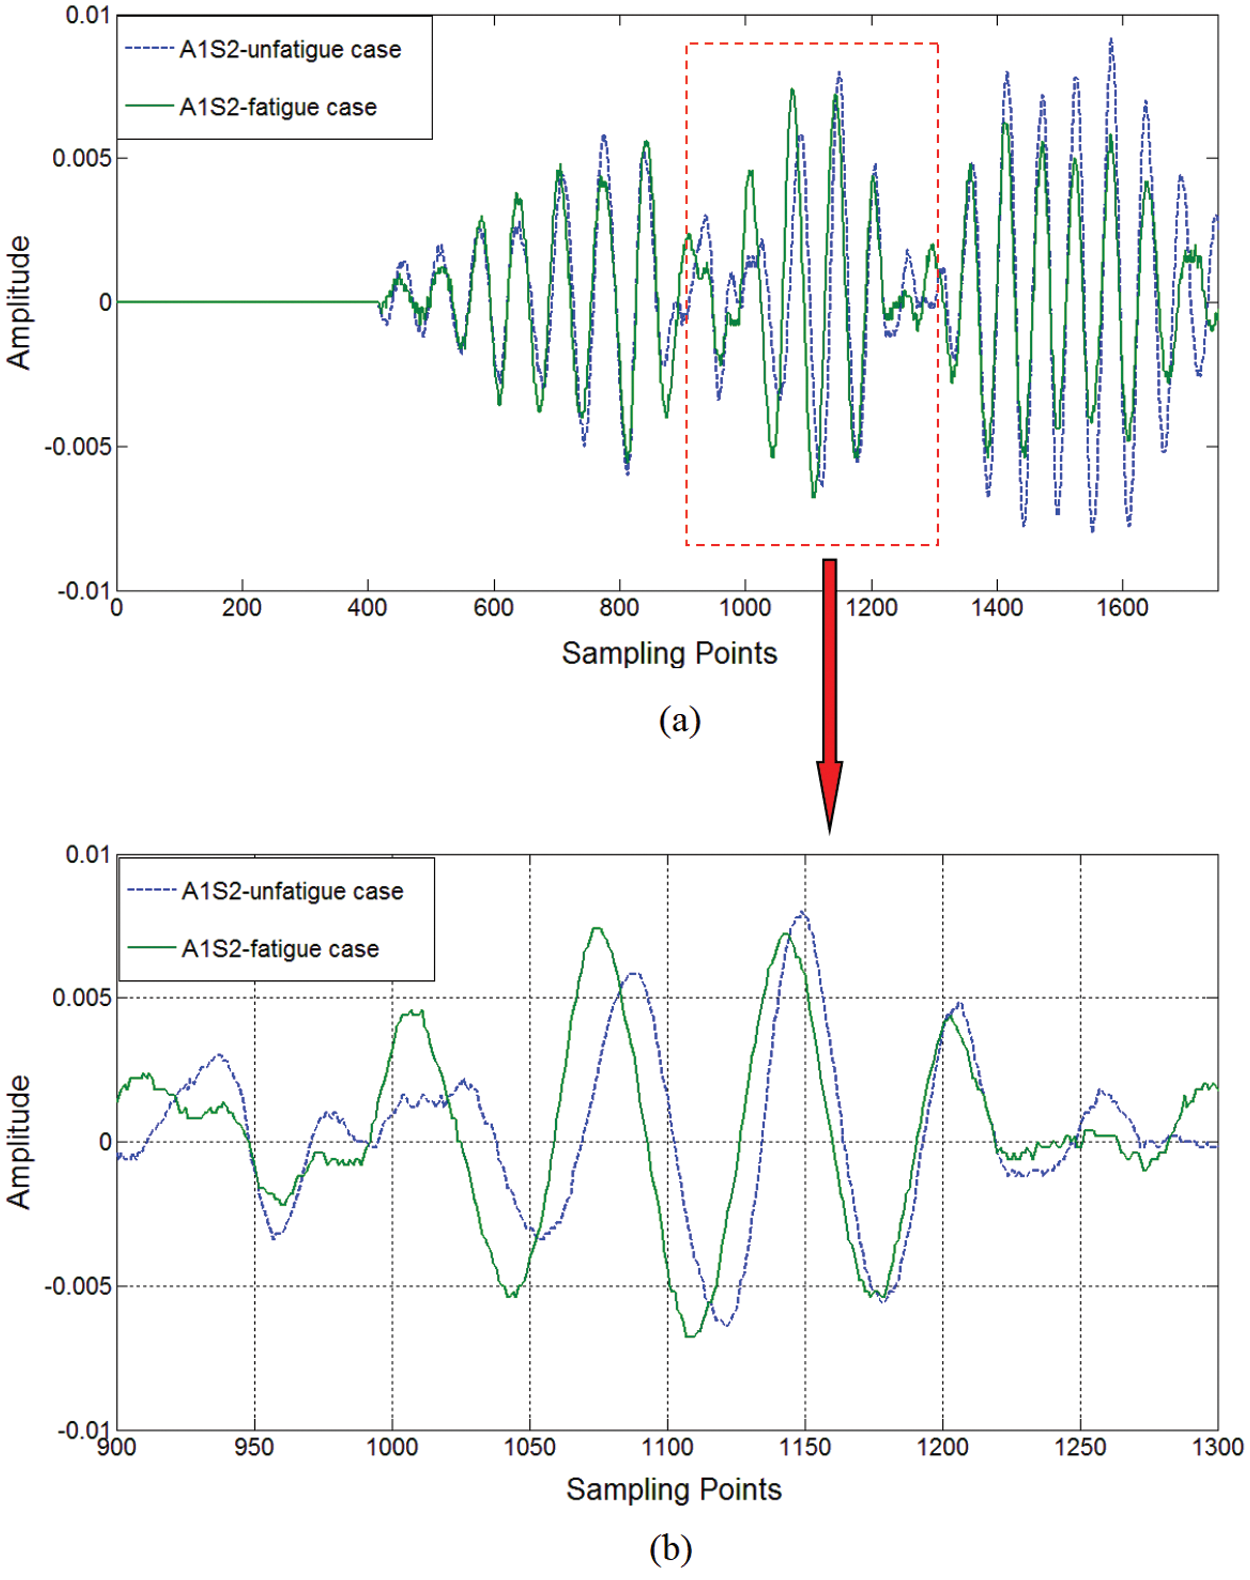
Figure 4: Original signal derived from path P12 (a) boundary reflected and damage (notch/notch + fatigue crack) scattered wave components; (b) zoom view of wave components including fatigue information
Identifying the fatigue crack in the plate purely on the basis of these original signals would have been extremely difficult. Thus, to obtain information that would be useful for detecting the fatigue crack, the raw signals were decomposed into multiple frequency segments using the DWT procedure, and the corresponding level including the excited frequency of 150 kHz was selected, with outside noises from other frequency bands being filtered out. The purified signals were then transformed into wavelet coefficients in the time-scale domain using the CWT procedure. To obtain and extract signal characteristics for fatigue crack detection, it is better to enhance the signals of waves scattering from the fatigue crack and concentrate the information they convey into a narrow band of the excited frequency. Thus, the energy spectrum based on the wavelet coefficients was integrated along the scale axis. In comparison with the raw signals shown in Fig. 4, Fig. 5 shows that the different levels of wave energy induced by the fatigue crack could be observed clearly in the wavelet-reconstructed signals.
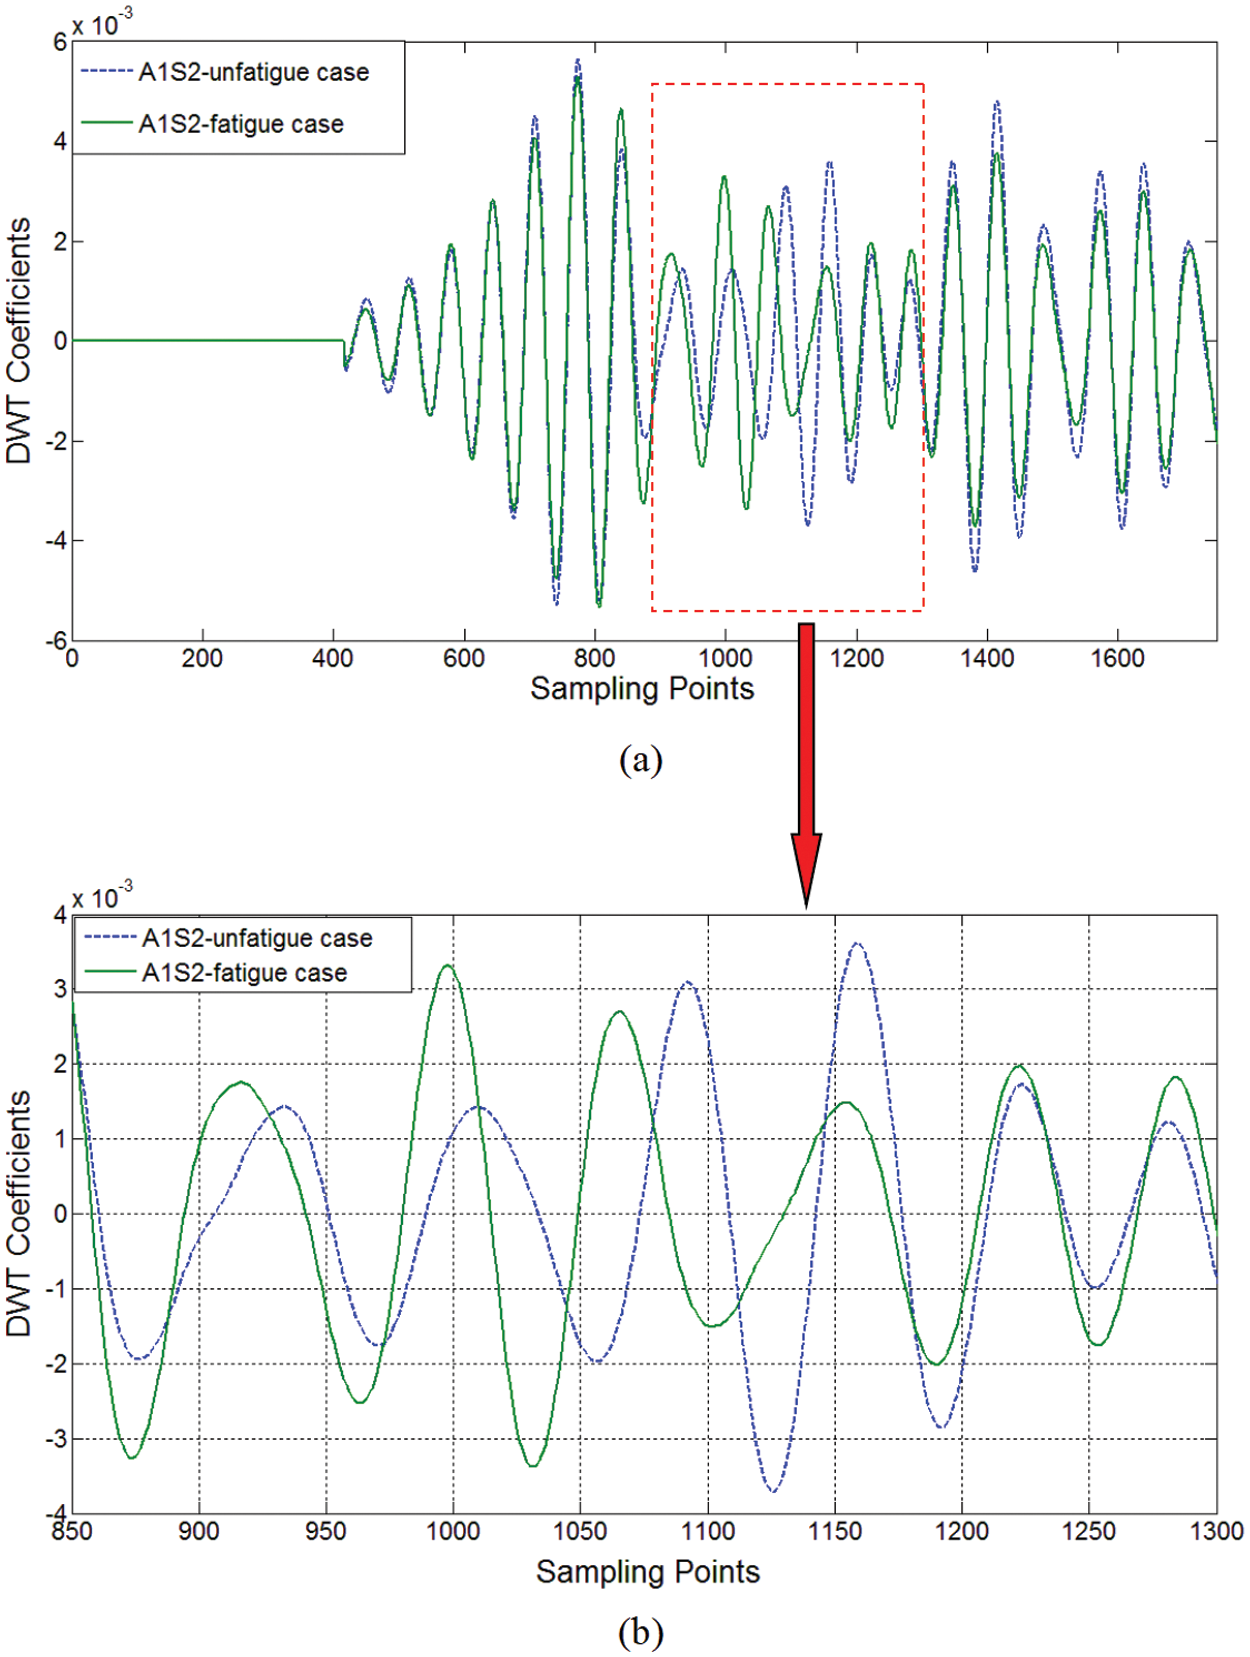
Figure 5: Signal compression result of signal from path P12 (a) boundary reflected and damage (notch/notch + fatigue crack) scattered wave components; (b) zoom view of wave components including fatigue information
A similar phenomenon can also be seen from the wavelet coefficient distribution in the time-scale domain constructed through the CWT analysis as shown in Fig. 6.
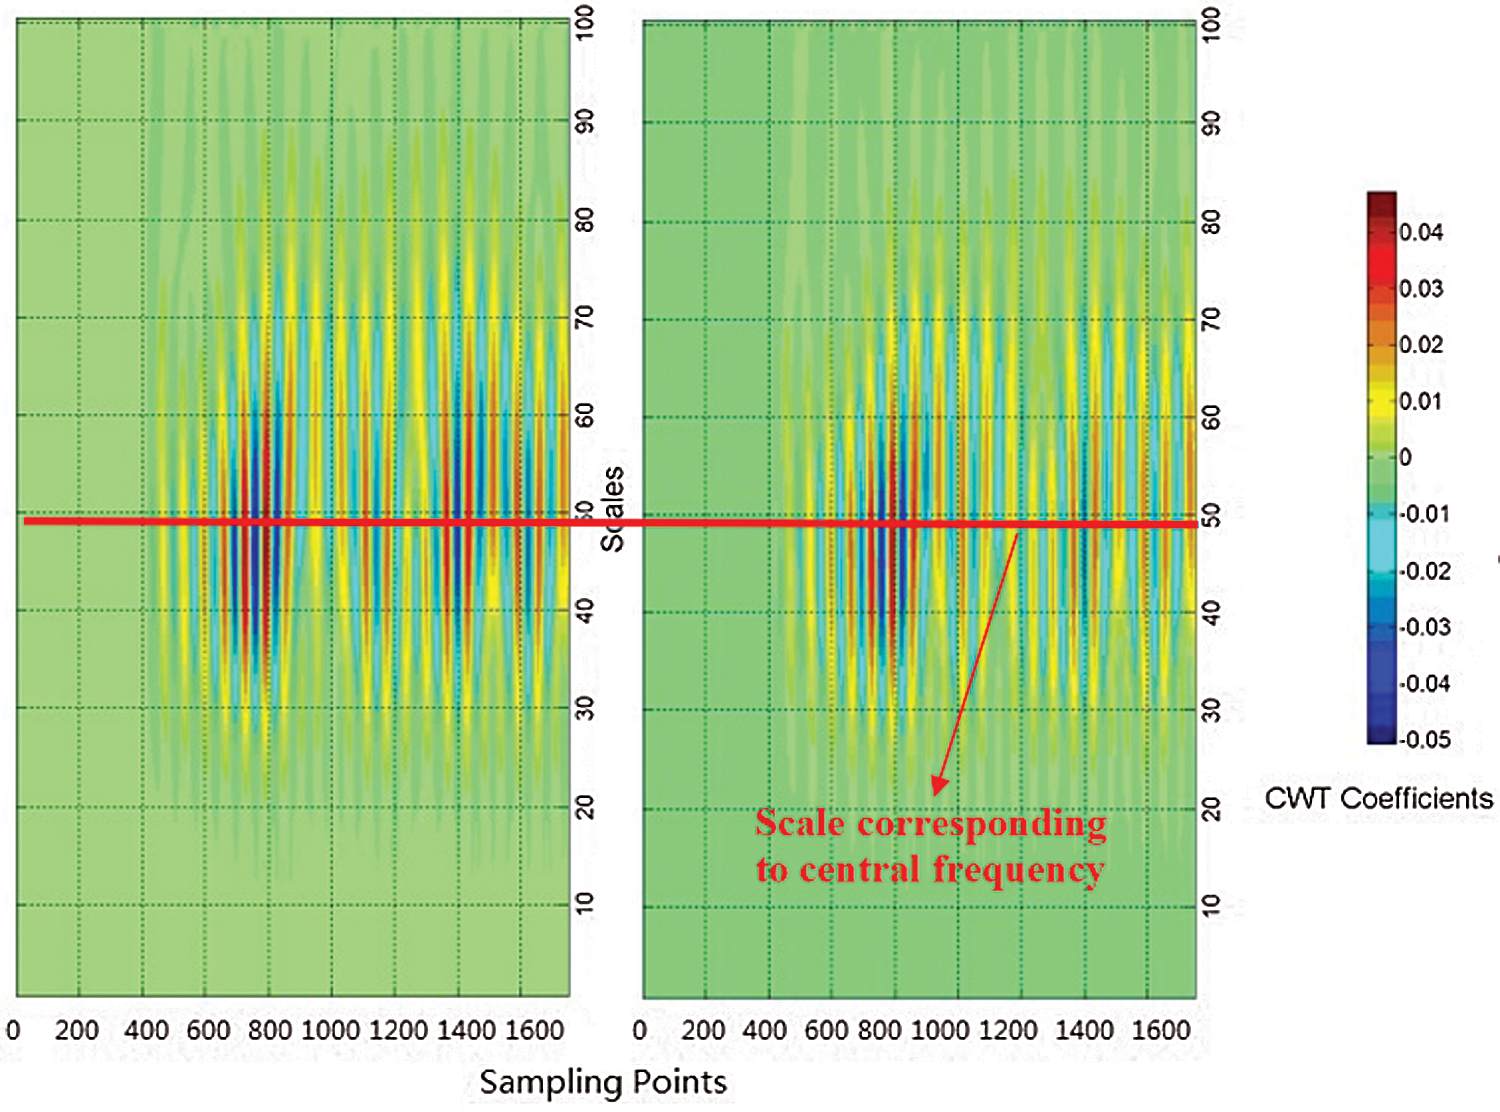
Figure 6: CWT spectrum in scale obtained from (a) pre-fatigue case through sensing path P12; (b) post-fatigue case through sensing path P12
The changes in wave energy represent the early waves scattered by the fatigue crack rather than those scattered by the initial notch. As shown in Fig. 7, the energy profile in the time domain was obtained after integrating the CWT coefficients along the scale axis according to Eq. (4). These energy spectrum coefficients were then purified with low pass filters to obtain the slick wave signal shown in Fig. 8. The difference between the signals emitted by the pre-fatigue plate and those scattered by the fatigued plate then became perceptible and was clearly discerned.
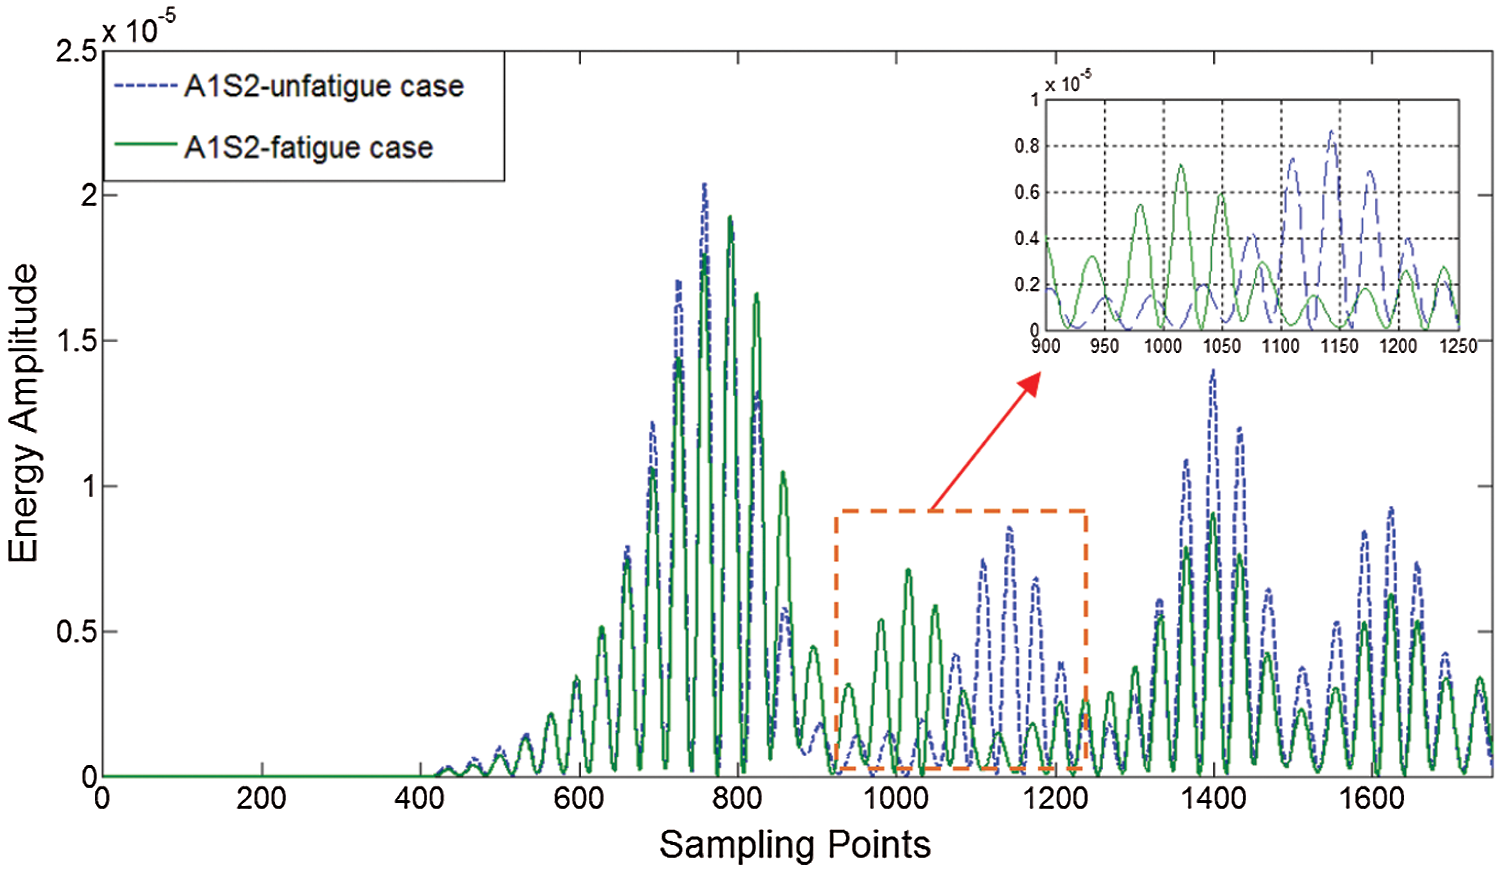
Figure 7: CWT-based energy spectrum of signal from sensing path P12
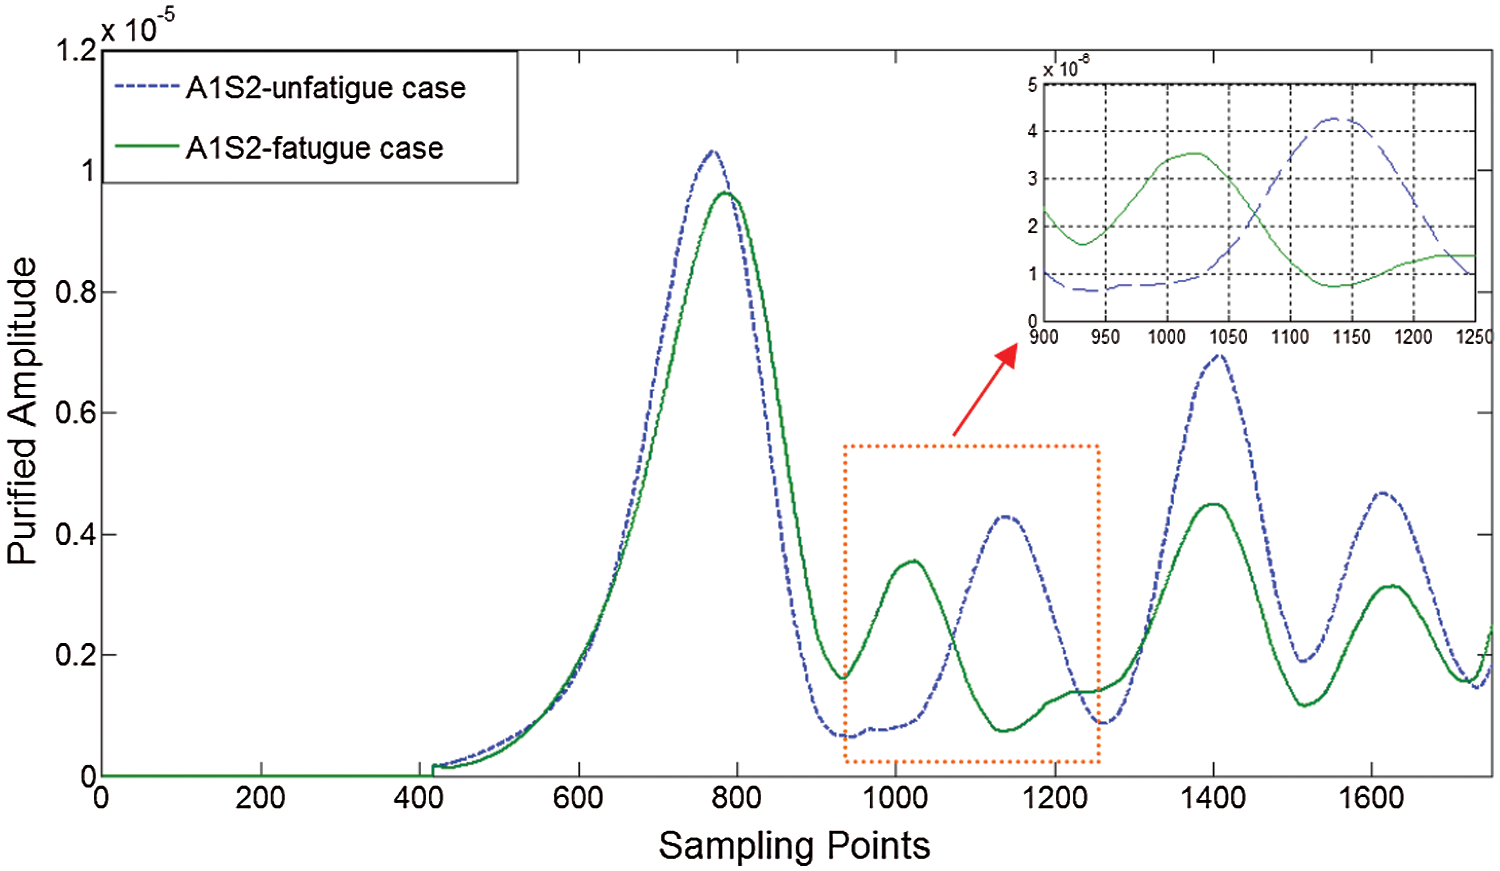
Figure 8: Purified energy spectrum of signal from sensing path P12
In this study, the key point in detecting the fatigue crack was to identify the difference caused by GW interactions with the fatigue crack when incidental GWs propagated through it. According to the wave scattering rule, the signal collected from the sensor network must include a wave component that differs from the baseline and represents the signal scattering from the fatigue crack. The arrival time of the wave component can also be used to locate the fatigue crack. The direct transmission, reflection and possible mode conversion of the dominant mode are monitored to identify the fatigue crack due to its high level of wave energy [12]. In this study, with the dominant wave velocity of about 3249 m/s (Vd) obtained in the experiment, we employed a correlation function to extract the RTD/fs between the signal packets [23]:
where xn and yn are correlated time series. There will be a peak in the correlation coefficient curve, and the corresponding time lag represents the difference in the arrival time of these two peak values when the peak values in the two signals are correlated with each other. In this study, xn and yn served as the time responses of the purified energy envelope obtained from the wavelet analysis in the autocorrelation function. They were used to establish the correlation coefficient curves of the intact plate and the fatigued plate shown in Fig. 9.
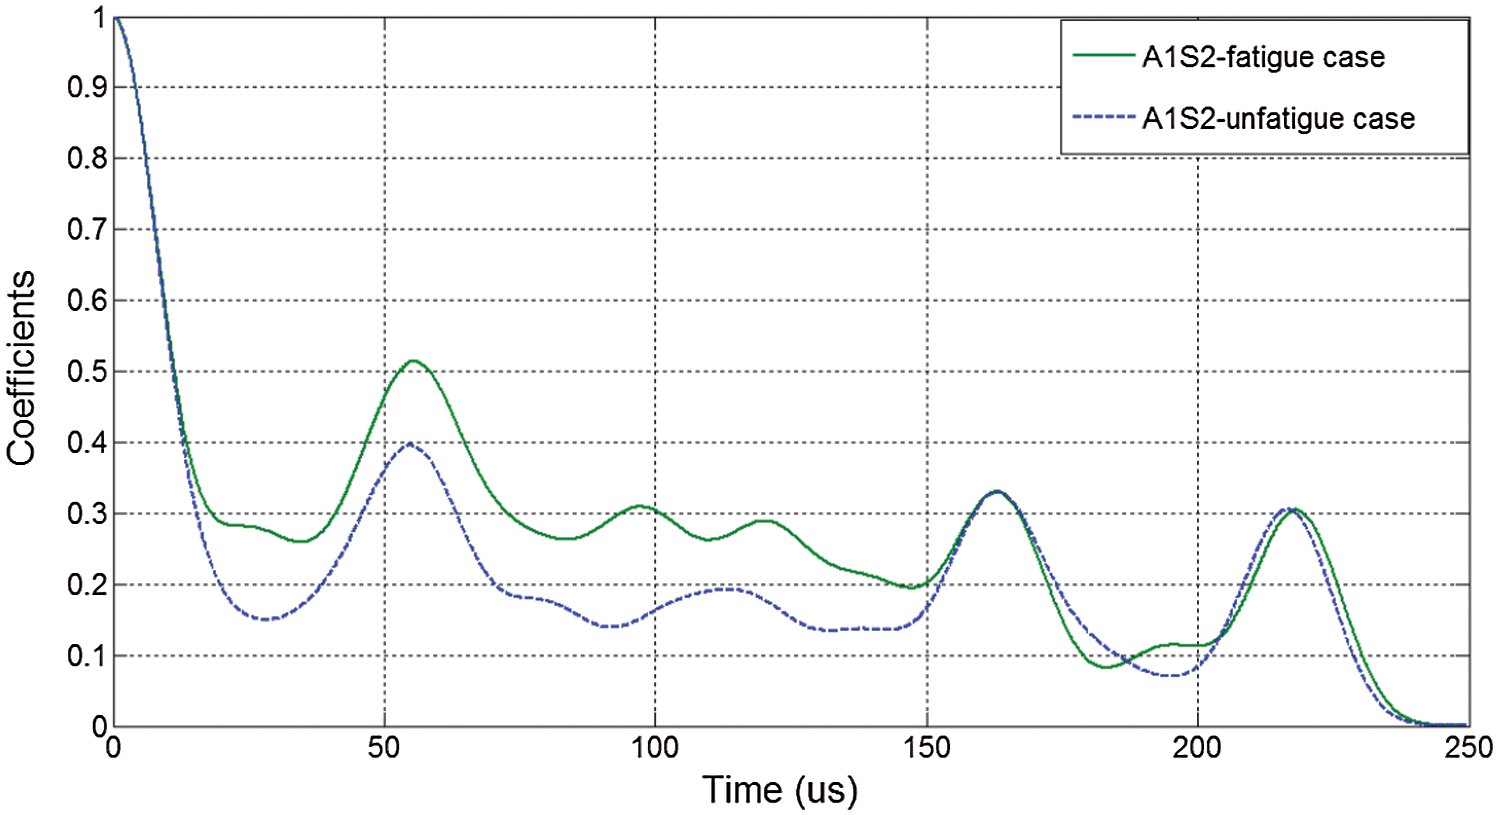
Figure 9: Correlation coefficient curves from sensing path P12
As described in the definitions, the time lag corresponding to each peak in the correlation coefficient curve measures the time difference between the highest amplitude of the incipient wave packet and that of the following wave components. The difference represented by the local wave package can be enhanced when the correlation coefficient curve for the damaged plate is divided by the baseline curve. The first discrepancies between the fatigued and pre-fatigued plates derived from the peaks represent signals directly transmit from one actuator to one sensor. If take this peak value as threshold, the discrepancies derived from the first peaks excess the threshold represent differences induced by the fatigue crack. The fatigue-induced peak highlighted in Fig. 10 allowed for the RTD/f to be identified.
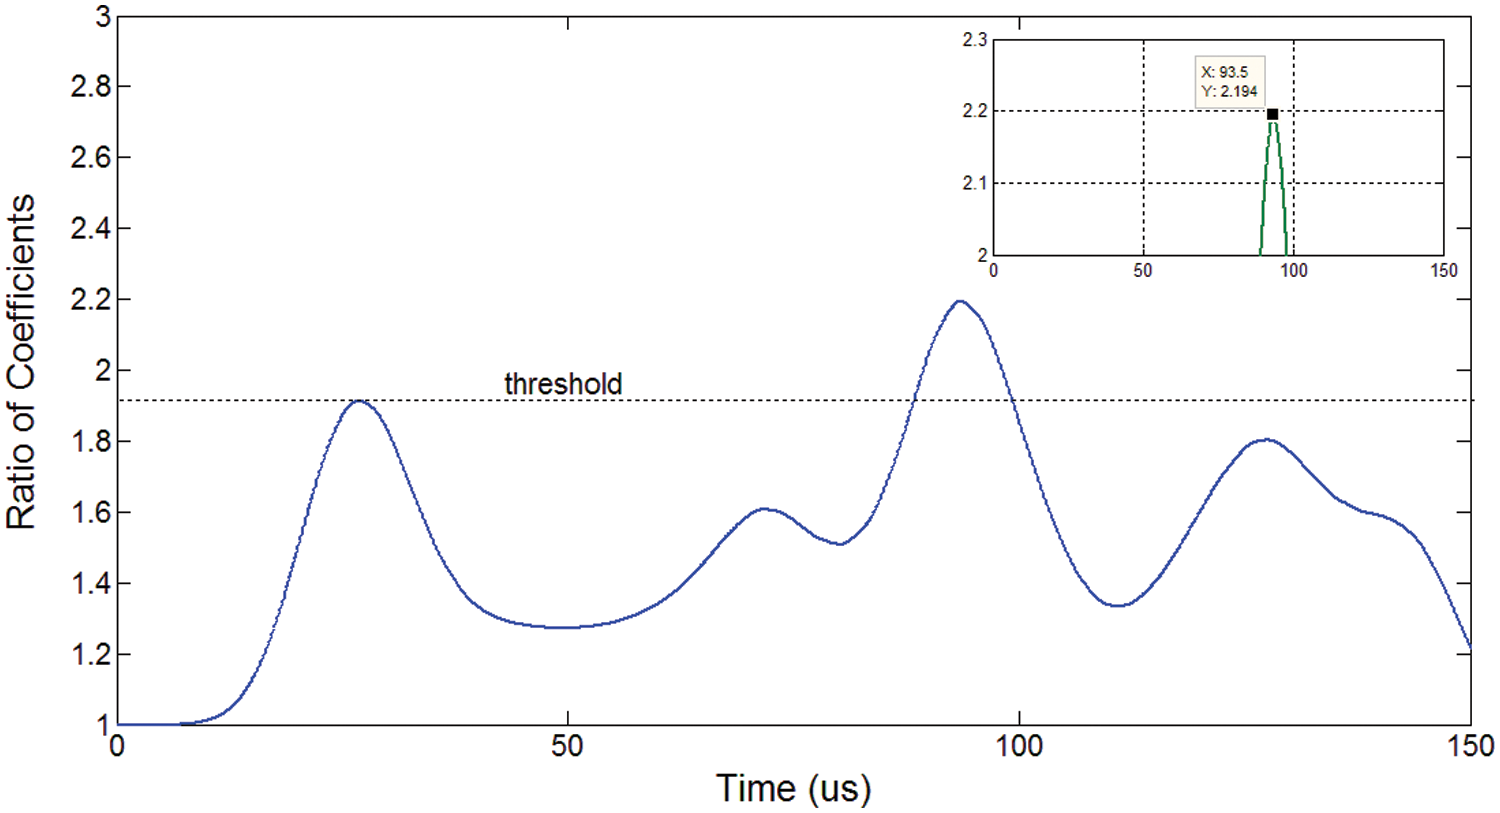
Figure 10: Ratio of correlation coefficient curves from sensing path P12
3.2.3 Determination of Damage Presence Probability (DPP)
In this part of the study, effort was focused on determining the fatigue crack presence probabilities (DPPs) of all positions on the steel plate. An imaging algorithm was adopted to represent DPP values for every position on the steel plate, the results being expressed in an intuitional manner [12]. To be consistent with our previous studies and without loss of generality, most of the definitions used in our prior investigations were adopted, the exception being the geometries and parameters for determination of DPPs. Supposing the plate is represented as a virtual mesh with K grids (e.g., of 1 × 1 mm2 each in what follows), the distance from a certain grid Lj (j ∈ {1,2,…K}) to PZT wafer Am can be expressed as, where and are the location vectors of Am and Lj in the global coordinate system, as shown in Fig. 11. The time needed for GWs to travel along the route AmLjAn can then be defined as
The coordinates of the damage center are two unknown variables. The solution of Eq. (6) presented an ellipse locus with the two PZT wafers being two foci, as portrayed by the dash-dotted line in Fig. 11.
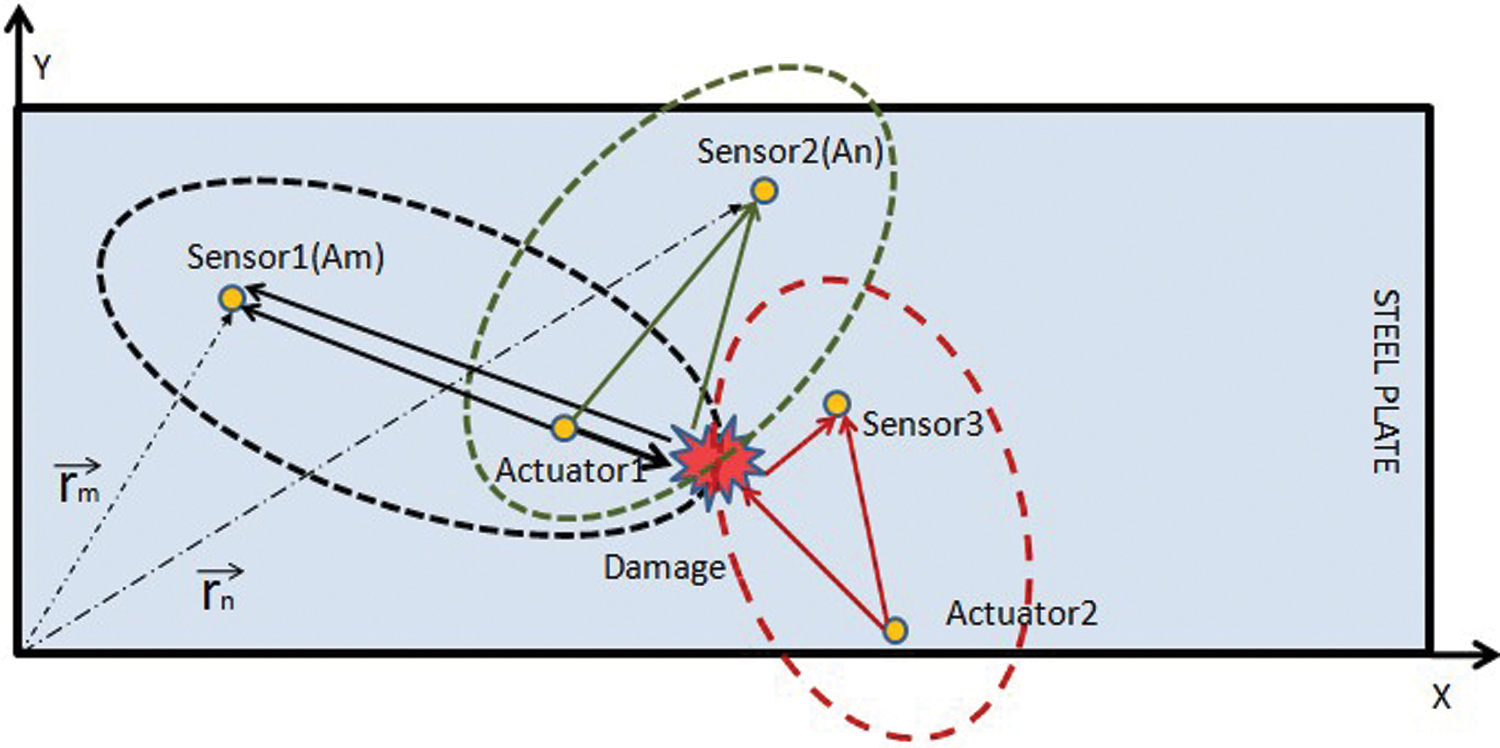
Figure 11: RTD/f-based triangulation of damage in a two-dimensional plate with three sensing paths
In principle, the grids correctly located on this locus, i.e., those with coordinates that satisfy Eq. (6), have the highest probability of sustaining damage from the sensing path pair Pm,n that produces such a locus. Therefore, the DPP values of these grids were determined to be 100%. The coordinates will not satisfy Eq. (6) for grids at other locations. Moreover, the further these grids are from the ellipse locus, the lower the probability they will sustain damage. Accordingly, to quantify the DPP values at such grids in relation to their locations Lj and the sensing path pair Pm,n(m, n ∈ {1,2,…7}, m ≠ n)), a cumulative distribution function (CDF) [24] is defined as follows:
where
The DPP can be obtained by applying the above algorithm to all K grids for estimated values of Pm,n. To illustrate, suppose the plate is virtually meshed into K grids as in the DPP (Lj, Pm,n ) image shown in Fig. 12.
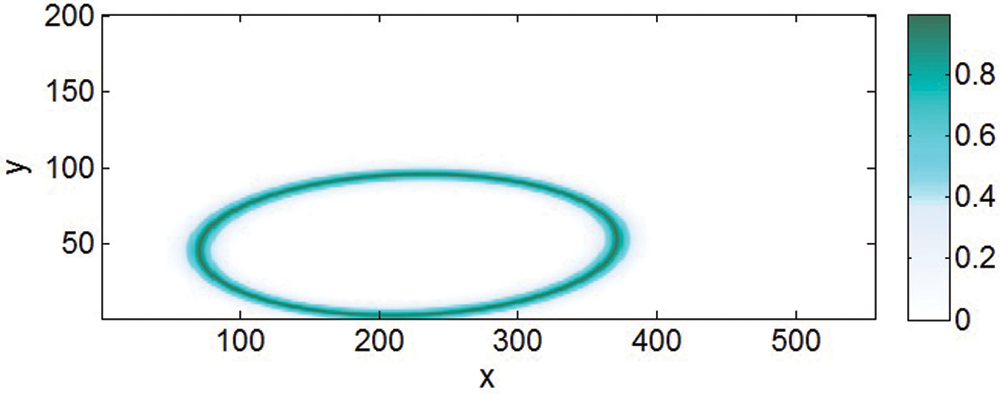
Figure 12: DPP image obtained from a single path
In this image, the DPP values vary within the range of [0,1] with the two extremes standing for the lowest and highest DPP, i.e., 0% and 100%, respectively. The lighter the image, the greater the DPP of the grid. However, determining the damage location from such an image is insufficient because all grids on the locus derived from Eq. (6) will have the same highest DPP value. Therefore, in the experiment conducted in this study, images contributed by all available Pm,n in the active sensor network were fused to arrive at a common estimate of the fatigue crack location. An image fusion scheme was adopted to strengthen damage-associated information in final estimation result, based on conjunctive image fusion techniques. Supposing DPP images established from all effective Pm,n are available for use in conjunctive fusion schemes, as stated in following expressions:
where P are all involved sensing path pairs; Np is the number of elements in P. DPPL,P is so-called fusion result for all DPP. Thus, for the fatigue crack with up and down tips at (300 mm, 37 mm) and (300 mm, 22 mm), after employing all of the PZT path pairs, the location of the fatigue crack could be clearly seen in both the two-dimensional DPP image (shown in Fig. 13) and the three-dimensional DPP image (shown in Fig. 14). The estimated location was about (299 mm, 30 mm).
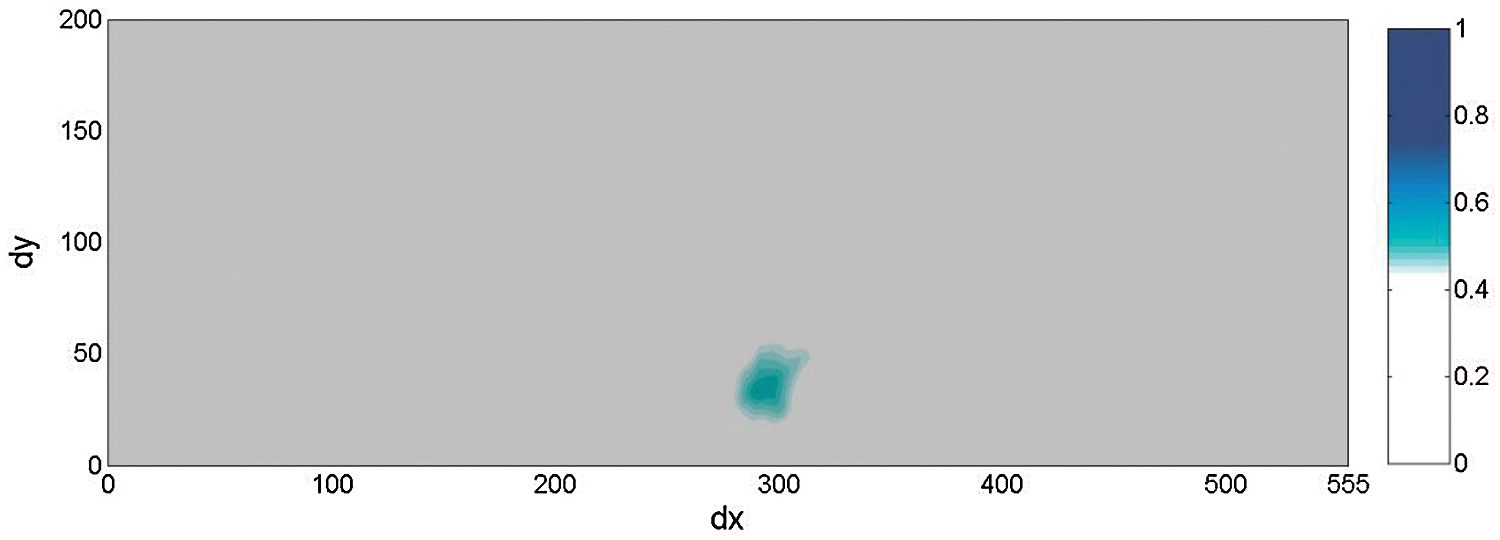
Figure 13: Two-dimensional DPP image of damage location derived by all sensor paths
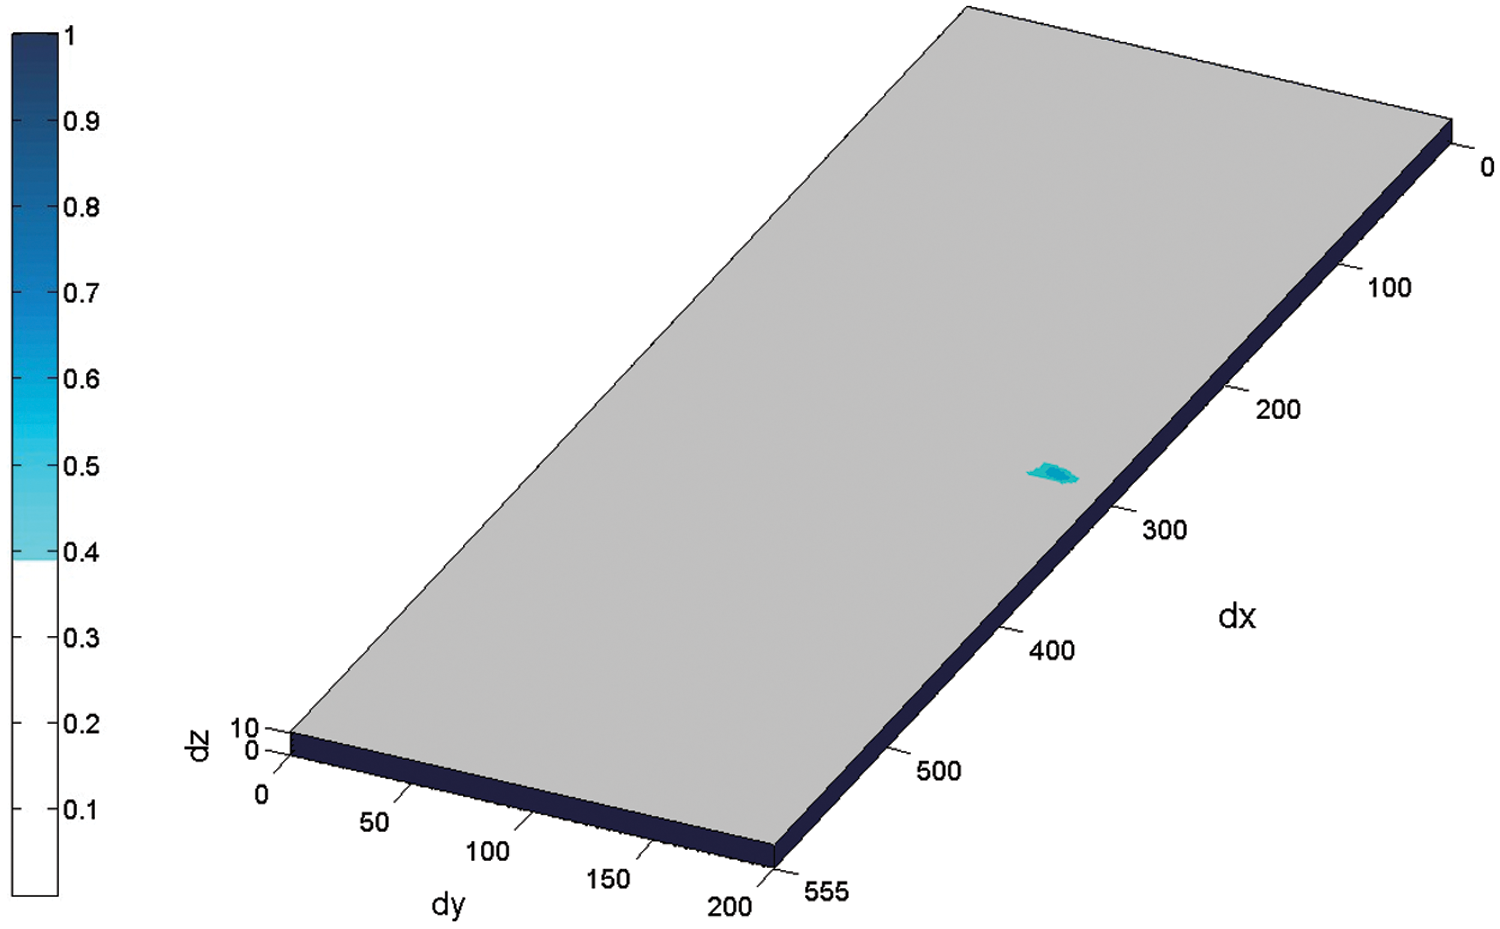
Figure 14: Three-dimensional DPP image of damage location derived by all sensor paths
After generating the fatigue crack, both a tensile load and a compressive load were applied to the steel plate to identify the effect of these loads on the fatigue crack. Fig. 15 shows the original signals derived from path P67 via the experiments. The envelopes of the amplitudes of this family of periodic curves can be seen in zoom view figure of Fig. 15.
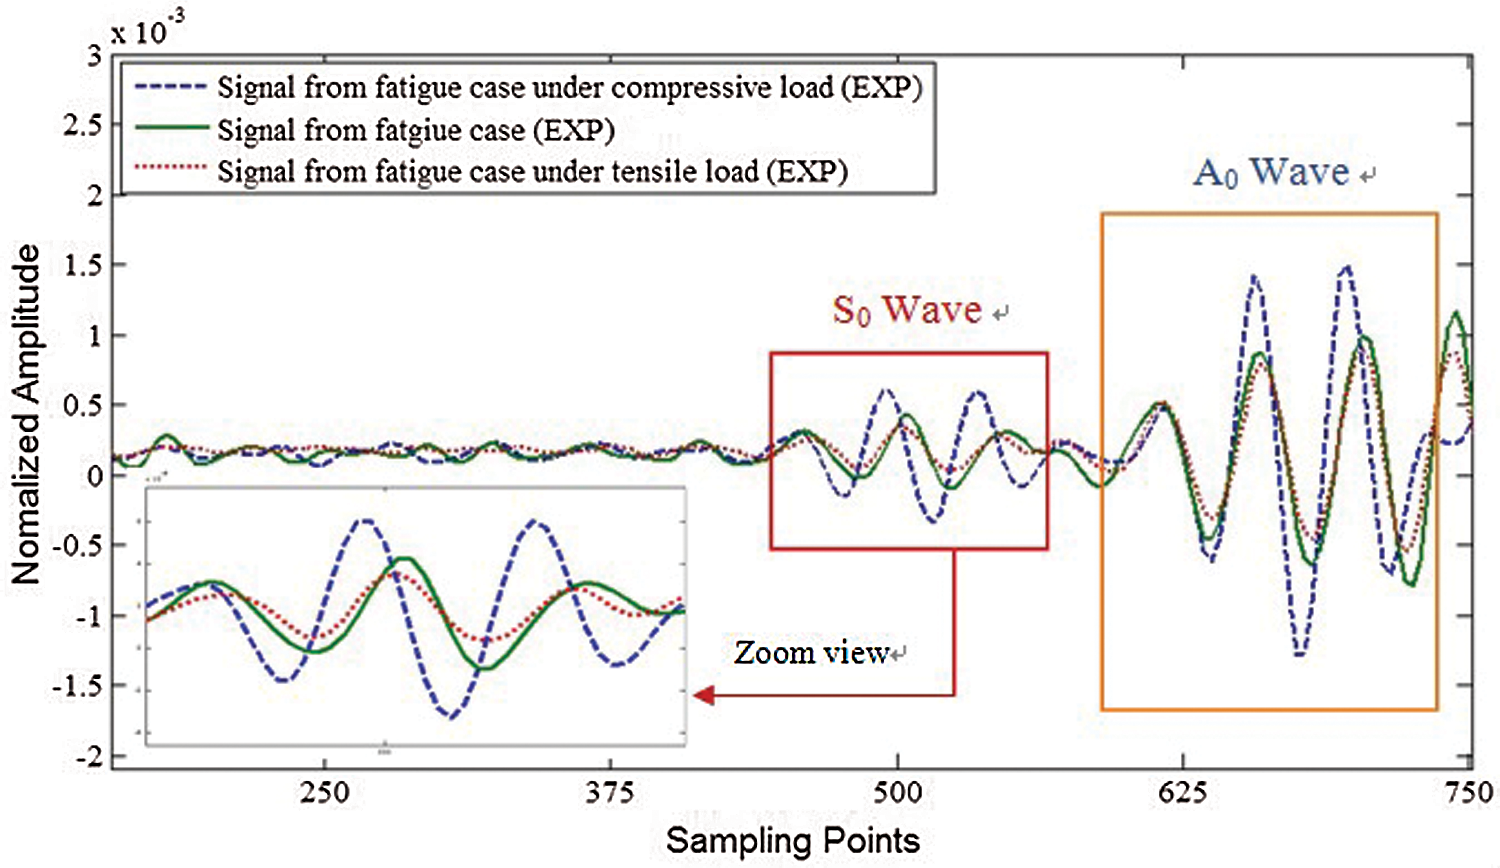
Figure 15: Loading effect on wave signals through fatigue crack
The results show that the S0 waves transmitted were marginally smaller if the fatigue crack was under tension, as represented by a smaller wave amplitude. In contrast, the S0 waves transmitted were somewhat larger if the fatigue crack was under compression, as represented by a much larger wave amplitude. Apart from amplitude, ToF when the transmitted wave reaches the corresponding sensor after being generated appeared a little in advance in the case of the S0 wave transmitted when the fatigue crack was under compression. The reason for this is that for a partially open fatigue crack under compression, some of the open area will be closed due to the load being applied and the wave can be transmitted through the closed area instead of scattering from the open area. In cases of GWs transmitted when the fatigue crack was under a fatigue load and a tensile load, there was very little difference in either amplitude or time of flight (ToF), thus indicating that wave signals transmitting through a fatigue crack under fatigued condition is most like the wave signals transmitting through an open crack under damaged condition , and there were enough PZT transducers and sensor paths that although some signals derived from the paths just passed through the closed fatigue crack, the signals derived from the rest of the paths were adequate for detecting the fatigue crack.
The fatigue crack was simulated by the Seam Assigned Model (SAM) in finite element method (FEM) software ABAQUS®/CAE combined with contact effect to ensure part of the pressure pass through the intersurfaces of the fatigue crack. All the simulation procedures and parameters adopted were same with previous simulation work in this thesis except the model part and mesh part, which were suitable for SAM analysis. Simulation model is shown in Fig. 16 and the regions around the notch, fatigue crack and PZT elements were meshed with finer meshes.
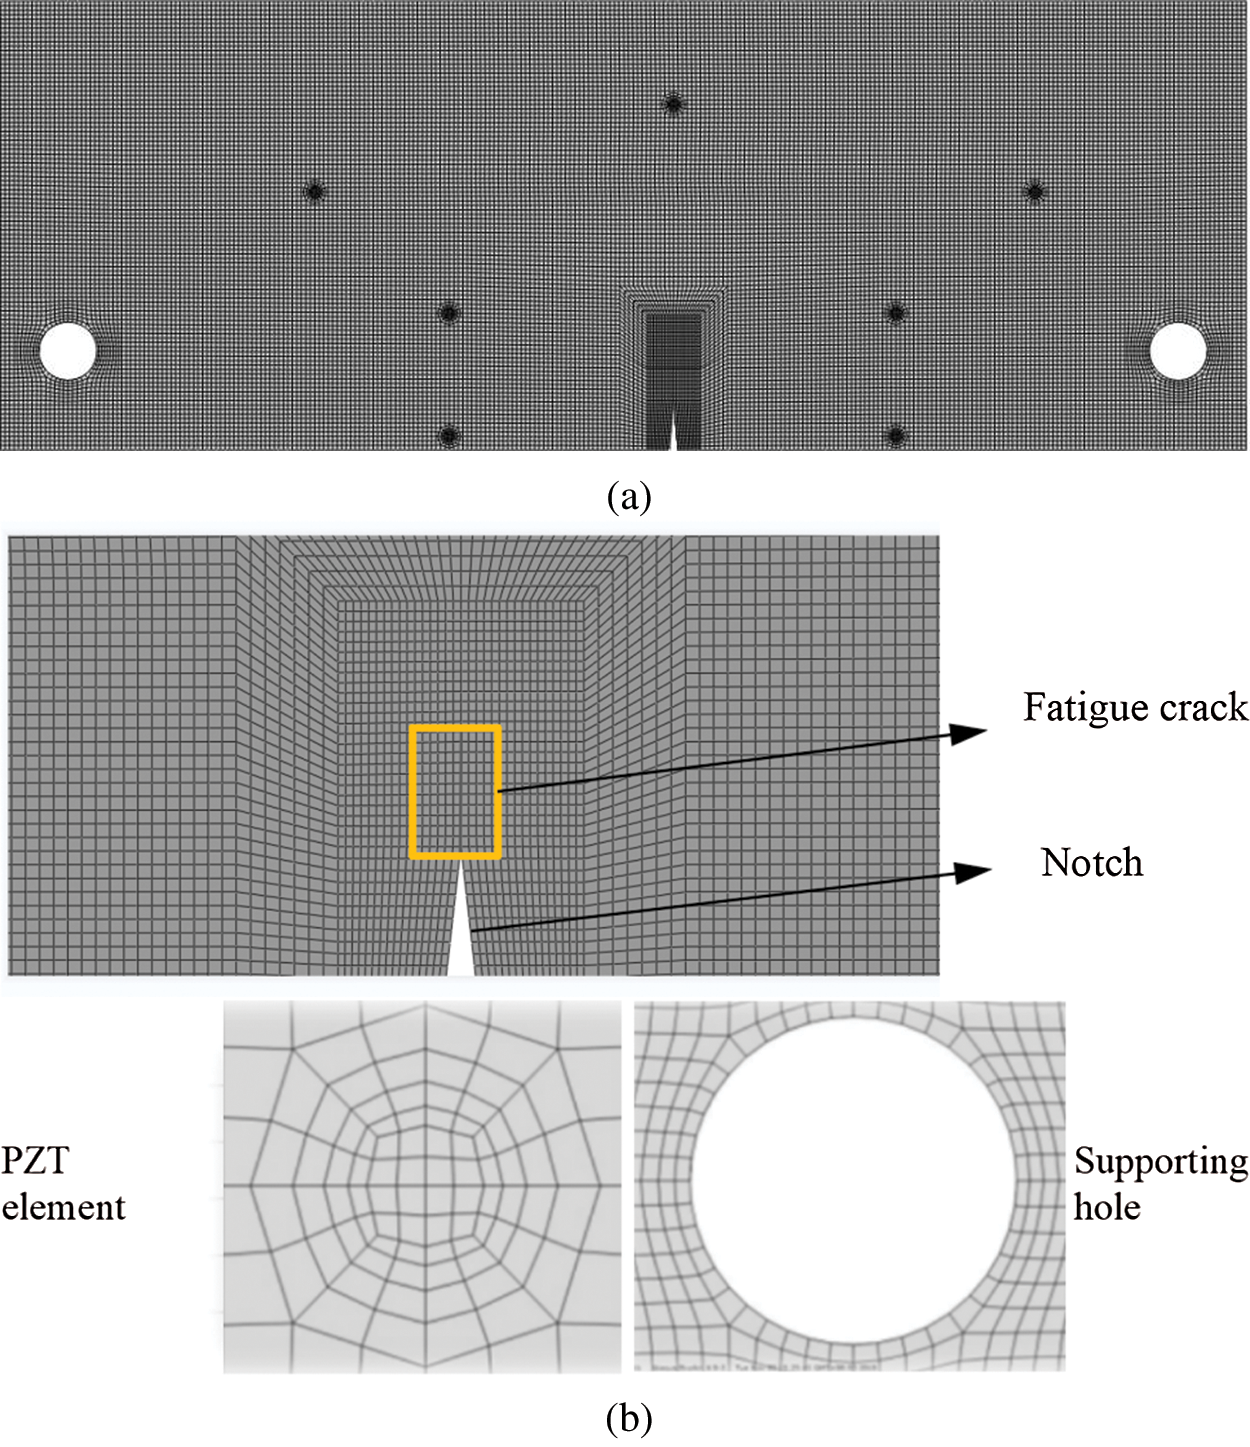
Figure 16: (a) Simulation model (b) Zoom-in view of notch, fatigue crack, supporting hole and PZT element in mesh part
In order to establish the fatigue crack model, the model of steel plate was firstly partitioned with a specific length, i.e., the fatigue crack length, 15 mm in this case, which originated from the notch tip and then the seam and contact effect were assigned on the partitioned surfaces. At the same time, a model of a intact steel plate with the same dimensions and properties was established for obtain a baseline data.
4.2 Simulation of Wave Propagation
Fig. 17 shows time history output of the simulation results which represent the process of wave propagation before and after passing through the fatigue crack. It is clear to observe that the wave can be reflected by the fatigue crack and additional wave scattering and attenuation effects due to interactions with the notch and boundaries exist. From simulation results, the arrival of the incident and fatigue crack-reflected dominant wave packages can be obtained, from which the flight distance can be computed using the wave velocity.
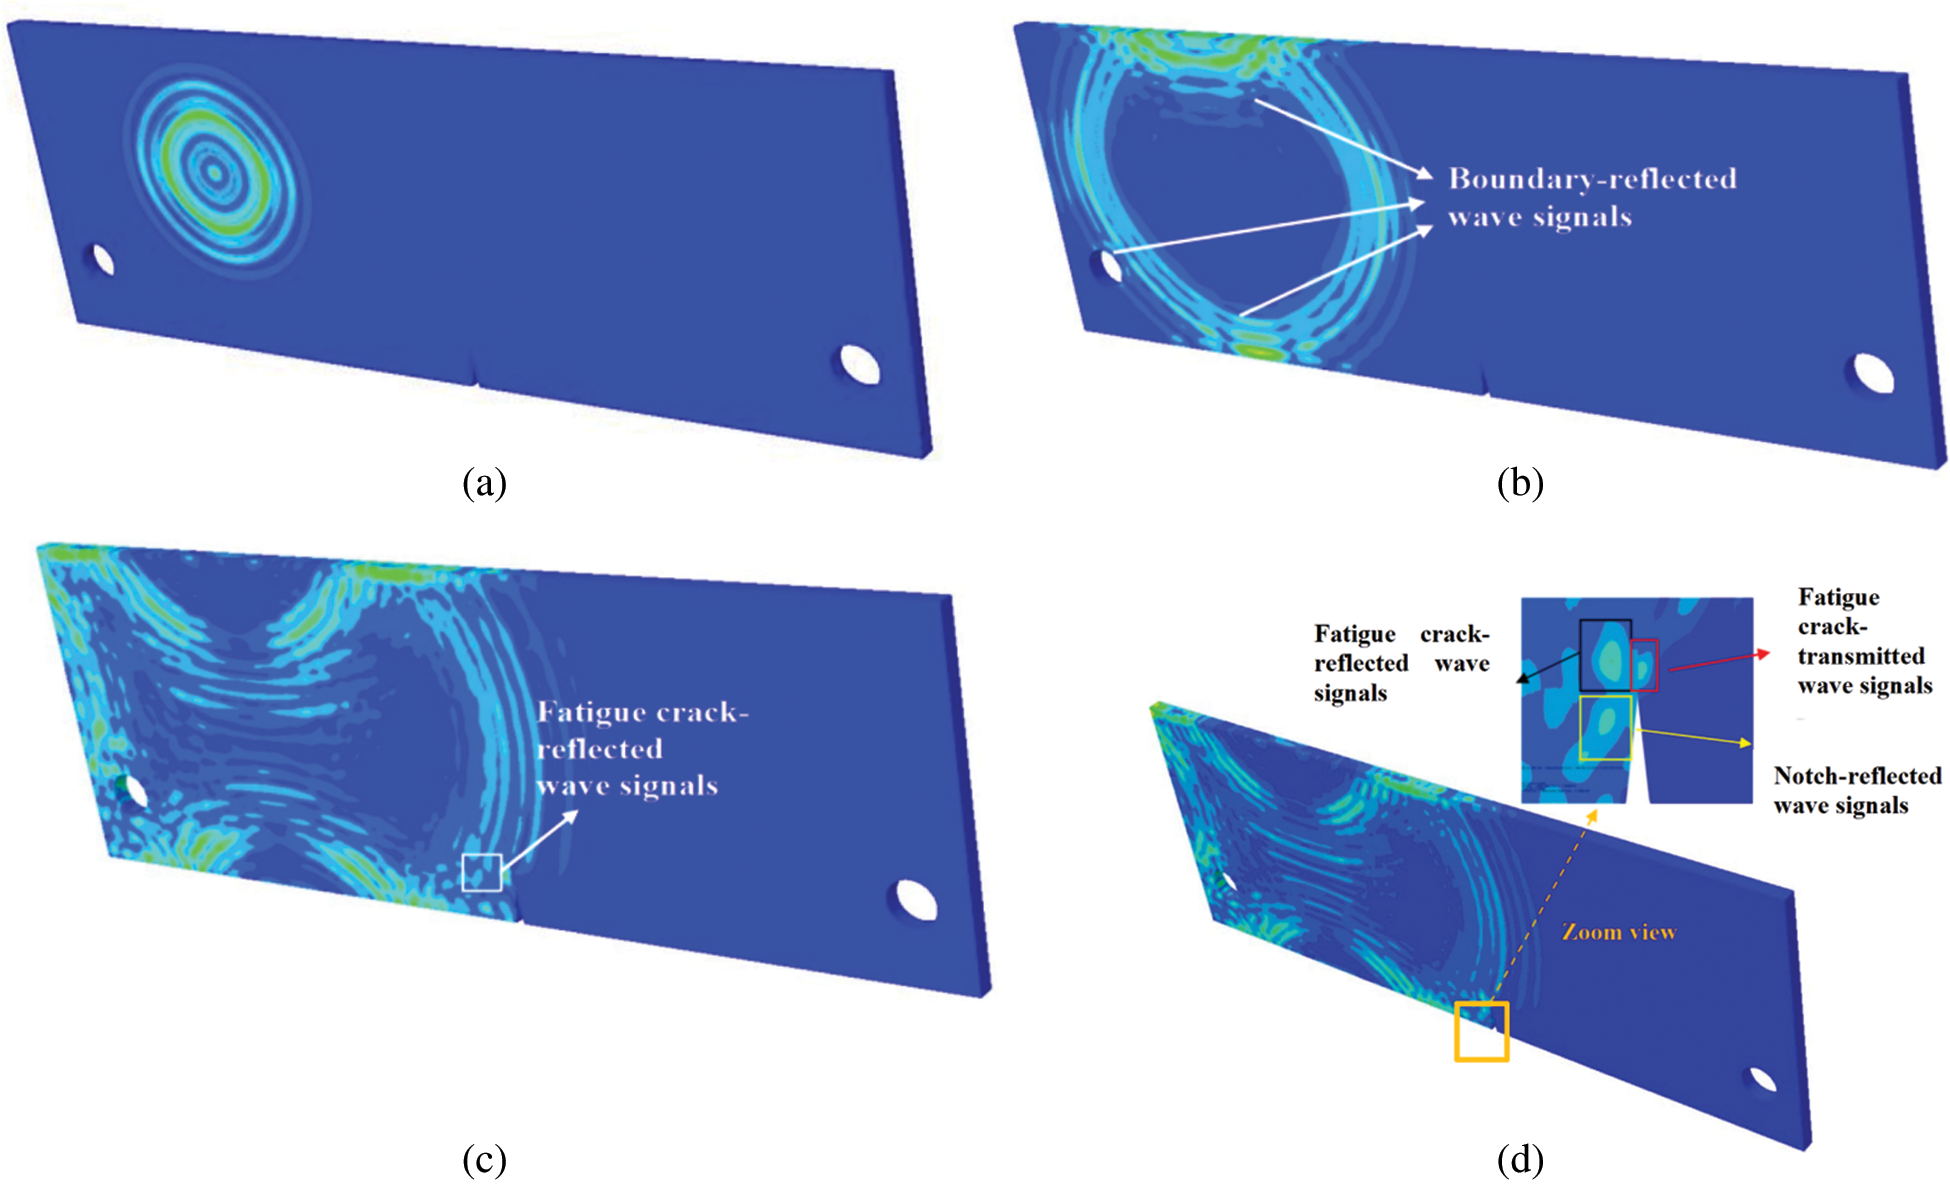
Figure 17: Snapshots for GW propagation through a fatigue crack at selected moments from FEM simulation (a) 26 μs; (b) 52 μs; (c) 74.04 μs; (d) 76 μs
Using the same analytical method and procedure as amentioned in experiments, simulation results obtained from P12 and processed by data compression and interpretation are shown in Figs. 18 and 19.
Figure 18: Signal compression result from P12 including boundary reflected and damage(notch/notch + fatigue crack) scattered wave components (FEM)
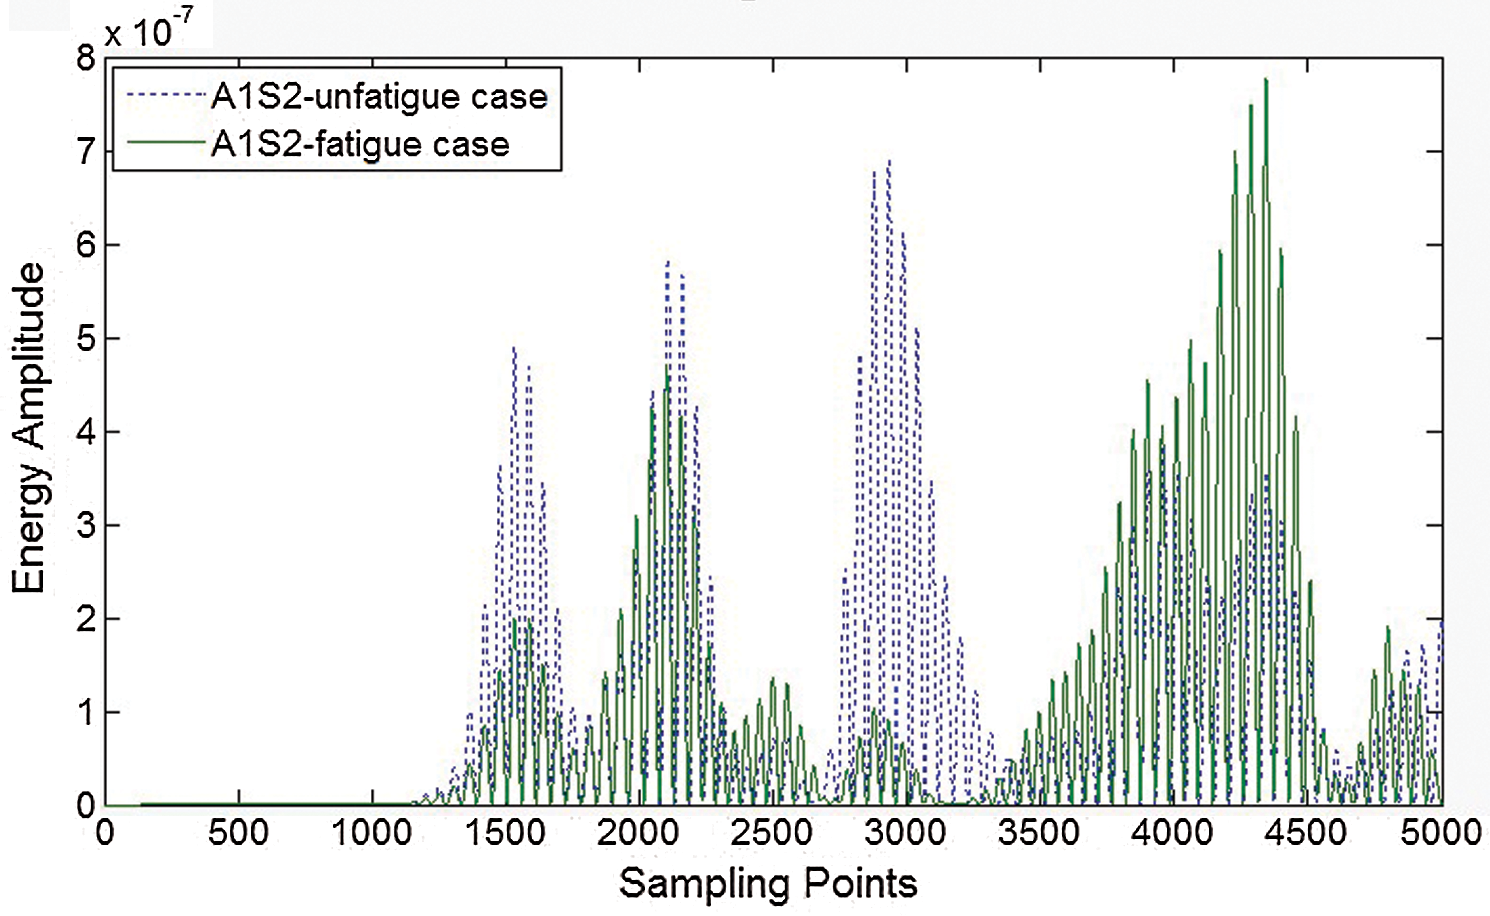
Figure 19: CWT-based energy spectrum of signal from sensing path P12 (FEM)
We can see that simulation results and experimental results agree well with each other no matter from the difference of ToFs or amplitudes between the baseline data and signals from fatigued sample. By all the RTD/fs extracted from FEM results, locations with highest probability of fatigue crack occurrence was picked out and detailed in Fig. 20. The coordinate system is the same as that indicated in experimental results. It can be found that comparing with the dimensions of specimen, the distance between estimated location and the true location is relatively small, implying the acceptability of the proposed approach.
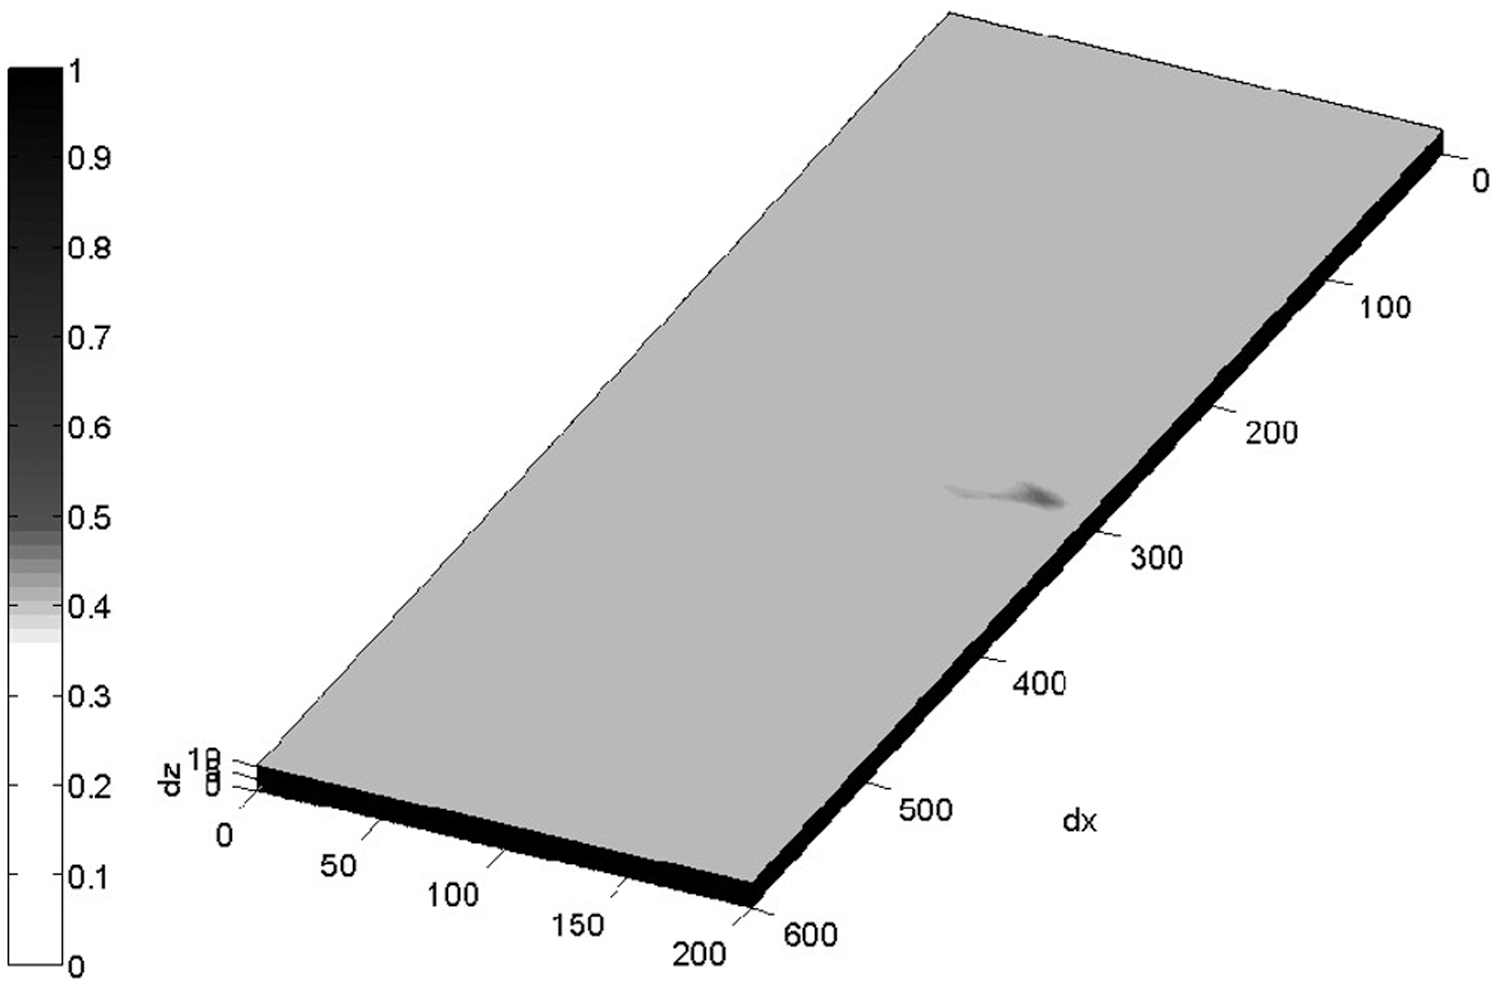
Figure 20: Three-dimensional DPP image of damage location derived by all sensor paths (FEM)
4.4 Comparison of Different Modeling Methods
In order to differentiate the developed fatigue crack modal with traditional crack modal, which was established by deleting element, three different models for one was an intact plate without crack, one was a plate with a fatigue crack model and one was a plate with deleted elements in the fatigue zone. Except the establishment of crack, the other properties and parameters about the models were the same. Fig. 21 shows the original signals derived from path P67 via the simulations.
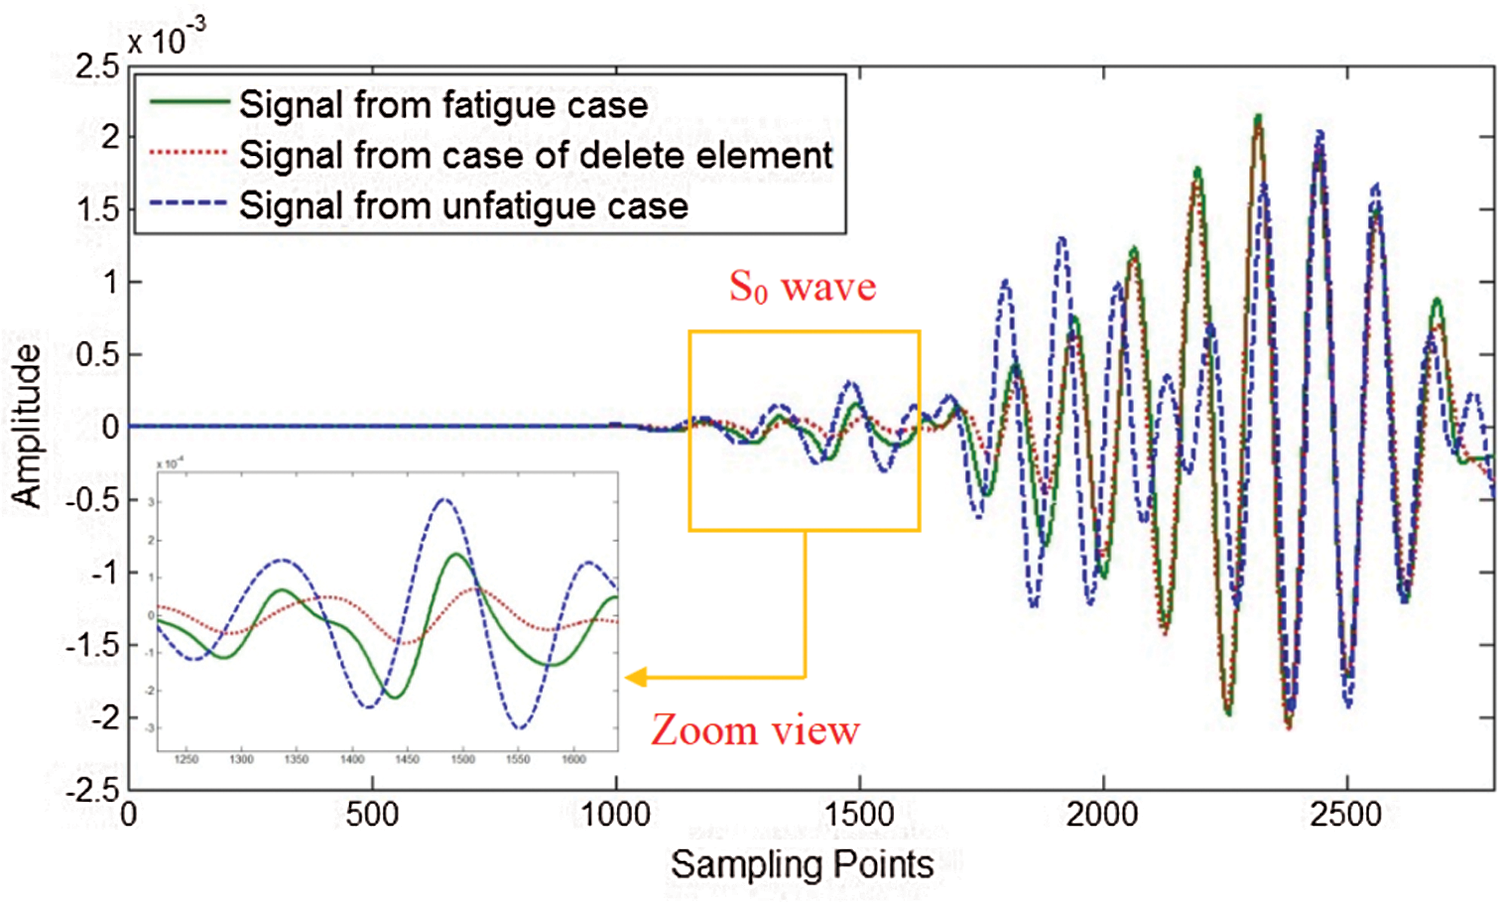
Figure 21: Comparison of wave signals from different cases sensing path P67 (FEM)
The envelopes of the amplitude and ToFs of this family of periodic curves can be seen by zoom view from S0 wave mode which was transmitted through the crack zone. Results indicate that the S0 wave modes transmitted were marginally smaller for model with fatigue crack and model with deleted elements compared with that of model for intact plate as the crack reflected most of the wave energy. And for the amplitude obtained from fatigue crack model, wave amplitude is a little larger than that obtained from model with deleting elements because this developed fatigue crack model can transmit part of wave energy through the fatigue crack. Apart from amplitude, ToF when the transmitted wave reaches the corresponding sensor after being generated appeared in advance in the case of the S0 wave transmitted for the intact plate model. And ToF for wave package transmitted from fatigue crack model shows a little in advance than that from model with deleting elements. The reason for this is that transmitted time from actuator to sensor is shortest when the wave directly transmitted between each other which is just like the case of intact plate and time becomes longer when the wave has to be reflected, scatted and transmitted by the fatigue crack and even longer when it has to be scatted by crack. However, there was very little difference in either amplitude or ToF for fatigue crack case and deleting element case, thus indicating that if fatigue crack propagates to a relative long size (mm), wave signals transmitted through the fatigue crack is most like the wave signals transmitted through an open crack.
This paper reports on a study in which an active PZT sensor network was successfully used to identify the location of a 15 mm fatigue crack in a thick steel plate by experiments and FEM analysis with a satisfactory degree of precision.
(1) WT technology and the correlation function on the energy distribution envelope were employed to determine the RTD/f, after which the DPP based on the RTD/f was applied to define the crack location using an imaging approach and energy-based spectrum. The results show that although the location of the fatigue crack adjacent to the notch and near the original edges of the plate made damage evaluation much more difficult, the proposed approach still produced an acceptable estimate of the fatigue crack location.
(2) The outcome of the study indicates that this method combining a GW propagation-based imaging approach with estimation of the load effect on waves guided through the fatigue crack delivers an acceptable visual estimate of the location of fatigue cracks in steel plates. The proposed approach thus represents an effective method of evaluating the presence and location of such damage in steel structures and has great potential for their real-time SHM.
Funding Statement: The work was supported by the National Natural Science Foundation of China (Grant No. 11702328).
Conflicts of Interest: The authors declare that they have no conflicts of interest to report regarding the present study.
1. Huang, M., He, J. J., Guan, X. F. (2015). Probabilistic inference of fatigue damage propagation with limited and partial information. Chinese Journal of Aeronautics, 85(4), 1055–1065. [Google Scholar]
2. Gao, D. Y., Ma, Y. L., Wu, Z. J., Zheng, Y. B., Lu, H. B. (2021). Guided wave based damage detection method for aircraft composite structures under varying temperatures. Structural Durability & Health Monitoring, 15(1), 23–37. [Google Scholar]
3. Zima, B., Rucka, M. (2015). Guided waves for monitoring of plate structures with linear cracks of variable length. Archives of Civil and Mechanical Engineering, 16(3), 387–396. [Google Scholar]
4. Hong, M., Su, Z. Q., Lu, Y., Sohn, H., Qing, X. L. (2015). Locating fatigue damage using temporal signal features of nonlinear Lamb waves. Mechanical Systems and Signal Processing, 60, 182–197. [Google Scholar]
5. Rabelo, D., Hobeck, J., Inman, D., Neto, R. M. F., Steffen, V. (2017). Real-time structural health monitoring of fatigue crack on aluminum beam using an impedance-based portable device. Journal of Intelligent Material Systems and Structures, 28(20), 3152–3162. [Google Scholar]
6. Yuan, S. F., Wang, H., Chen, J. (2020). A PZT based on-line updated guided wave-Gaussian process method for crack evaluation. IEEE Sensors Journal, 20(15), 8204–8212. [Google Scholar]
7. Sohn, H. (2012). Laser based structural health monitoring for civil, mechanical, and aerospace systems. Proceedings of SPIE-The International Society for Optical Engineering, 834502. DOI 10.1117/12.921722. [Google Scholar] [CrossRef]
8. Choi, Y., Abbas, S. H., Lee, J. R. (2018). Aircraft integrated structural health monitoring using lasers, piezoelectricity, and fiber optics. Measurement, 125, 294–302. [Google Scholar]
9. Spytek, J., Mrowka, J., Pieczonka, L., Ambrozinski, L. (2020). Multi-resolution non-contact damage detection in complex-shaped composite laminates using ultrasound. NDT & E International, 116, 102366. [Google Scholar]
10. Mizutani, Y., Yamada, H., Nishino, H., Takemoto, M., Ono, K. (2001). Noncontact detection of delamination in impacted cross-ply CFRP using laser-generated Lamb waves. Proceedings of SPIE-The International Society for Optical Engineering, pp. 330–341. [Google Scholar]
11. Lu, M. Y., Lu, X., Zhou, L. M., Su, Z. Q., Ye, L. (2009). Guided-wave-based detections of weld and crack in steel plates. Proceedings of SPIE-The International Society for Optical Engineering, 74932S. DOI 10.1117/12.845656. [Google Scholar] [CrossRef]
12. Lu, X., Lu, M. Y., Zhou, L. M., Su, Z. Q., Cheng, L. et al. (2010). Evaluation of welding damage in welded tubular steel structures using guided waves and probability-based imaging approach. Smart Materials and Structures, 20, 015018. [Google Scholar]
13. Abbas, M., Shafiee, M. (2018). Structural health monitoring (SHM) and determination of surface defects in large metallic structures using ultrasonic guided waves. Sensors, 18(11), 3958. [Google Scholar]
14. Staszewski, W. J., Lee, B. C., Traynor, R. (2007). Fatigue crack detection in metallic structures with Lamb waves and 3D laser vibrometry. Measurement Science and Technology, 18(3), 727–739. [Google Scholar]
15. Yu, X. D., Zuo, P., Xiao, J., Fan, Z. (2019). Detection of damage in welded joints using high order feature guided ultrasonic waves. Mechanical Systems and Signal Processing, 126, 176–192. [Google Scholar]
16. Meo, M., Polimeno, U., Zumpano, G. (2008). Detecting damage in composite material using nonlinear elastic wave spectroscopy methods. Applied Composite Materials, 15, 115–126. [Google Scholar]
17. Wang, Q., Shen, Y., Zhang, J. Q. (2005). A nonlinear correlation measure for multivariable data set. Physica D: Nonlinear Phenomena, 200(3–4), 287–295. [Google Scholar]
18. Su, Z. Q., Zhou, C., Hong, M., Cheng, L., Wang, Q. et al. (2014). Acousto-ultrasonics-based fatigue damage characterization: Linear vs. nonlinear signal features. Mechanical Systems and Signal Processing, 45(1), 225–239. [Google Scholar]
19. Lu, Y., Ye, L., Su, Z. Q. (2006). Crack identification in aluminium plates using Lamb wave signals of a PZT sensor network. Smart Materials and Structures, 15, 839–849. [Google Scholar]
20. Lemistre, M., Balageas, D. (2001). Structural health monitoring system based on diffracted Lamb wave analysis by multiresolution processing. Smart Materials and Structures, 10(3), 504–511. [Google Scholar]
21. Su, Z. Q., Ye, L., Bu, X. Z. (2002). A damage identification technique for CF/EP composite laminates using distributed piezoelectric transducers. Composite Structures, 57(1–4), 465–471. [Google Scholar]
22. Staszewski, W. J., Boller, C., Tomlinson, G. R. (2004). Health monitoring of aerospace structures: Smart sensor technologies and signal processing. New York: Wiley. DOI 10.1002/0470092866. [Google Scholar] [CrossRef]
23. Wang, Q., Zhou, C., Ji, D. C. (2019). Study on nonlinear Lamb wave based structural fatigue damage tomography. Journal of Basic Science and Engineering, 27(3), 686–694. [Google Scholar]
24. Walpole, R. E., Myers, R. H., Myers, S. L., Ye, K. (1998). Probability and statistics for engineers and scientists, pp. 51–61. Upper Saddle River, NJ: Prentice Hall Inc. [Google Scholar]
 | This work is licensed under a Creative Commons Attribution 4.0 International License, which permits unrestricted use, distribution, and reproduction in any medium, provided the original work is properly cited. |