| Structural Durability & Health Monitoring |
DOI: 10.32604/sdhm.2021.016495
ARTICLE
Sub-1 GHz Network-Based Wireless Bridge-Monitoring System: Feature and Verification
1College of Engineering, University of Louisiana at Lafayette, Lafayette, LA 70503, USA
2ABNA Engineering, St. Louis, MO 63108, USA
3Parks College of Engineering, Aviation and Technology, Saint Louis University, St. Louis, MO 63103, USA
4Department of Civil Engineering, University of Burgos, Burgos, 09001, Spain
*Corresponding Author: Li Hui. Email: li.hui@louisiana.edu
Received: 10 March 2021; Accepted: 25 October 2021
Abstract: Traditional bridge monitoring systems often require wired connections between sensors, a data acquisition system, and data center. The use of extension wires, conduits, and other costly accessories can dramatically increase the total cost of bridge monitoring. With the development of wireless technologies and the notable cost benefits, many researchers have been integrating wireless networks into bridge monitoring system. In this study, a wireless bridge monitoring system has been developed based on the Sub-1 GHz network. The main functional components of this system include sensors, wireless nodes, gateway and data center. Wireless nodes can convert analog signals obtained from the sensors to digital signals, then transmit the collected data to the gateway using the Sub-1 GHz network. The gateway receives and sorts data from different wireless nodes and then forwards these data to the data center wirelessly. All collected data are processed in the data center using the data processing software developed in this study. In order to validate the performance of the wireless system developed in this study, a steel girder bridge was monitored in the field during the concrete deck construction. The field results were also compared with the theoretical values obtained from finite element models to ensure the accuracy and reliability of the wireless system. The results indicate that the wireless bridge monitoring system developed in this study is effective and affordable. The Sub-1 GHz network can be a better solution for bridges with complicated site conditions because of the extended data transmission distance. Although the power consumption can be controlled by using low-power consumption components, including the power control in software design can also dramatically reduce the system’s power consumption.
Keywords: Bridge monitoring; wireless network; bridge deck construction; exterior girder rotation
Long-term or short-term bridge monitoring often requires many sensors and data acquisition systems (DAS). The traditional bridge monitoring system uses extension wires to connect sensors with the monitoring system, conduits to protect the wires, and other costly accessories. Fig. 1 shows an example of using extension wires during bridge monitoring. All these accessories significantly increase the total cost of bridge monitoring and the difficulties during the bridge instrumentation. Therefore, to reduce the cost for the bridge monitoring as well as simplify the instrumentation procedures, many researchers have investigated the application of wireless systems for bridge monitoring in recent years [1–5].

Figure 1: Extension wire between DAS and sensors
One of the major concerns for developing a wireless bridge monitoring system is the data transmission approach. With the rapid development of wireless technologies in recent years, many wireless transmission methods, such as Bluetooth, WIFI, Zigbee, cellular network, and Sub-1 GHz, can be implemented when integrating wireless sensor networks into a bridge monitoring system. The data transmission rate, range, power consumption, and overall reliability are different for each method. A comparison among different commonly used wireless technologies is shown in Table 1. Compared with other types of wireless methods, the sub-1 GHz network can provide a long-distance data transmission without any extra cost from the mobile network operators, and the power consumption can be as low as 5.4 mA using a 3.6 V lithium battery [6]. The development of a bridge monitoring system must consider the condition of the real bridge, such as location, geographical condition, and weather, etc. For instance, Sun et al. [7] developed a bridge monitoring system based on Zigbee technology; however, the speed of communication was slow when using Zigbee technology, limiting its application in bridge monitoring [3]. Yu et al. [8] designed a WIFI-based wireless sensor network for the monitoring of an offshore anchored suspension bridge. Bluetooth technology has also been integrated into bridge monitoring projects to reduce costs [9–11], but the data transmission range is a major issue. Many researchers were also exploring the application of cellular networks in structural monitoring. Moreu et al. [12] developed smart wireless sensors based on the cellular network to monitor railroad bridges. Other researchers have developed different monitoring systems or sensors with different purposes to monitor structures under different environmental and geographical conditions using cellular networks [13,14]. However, very little research has been conducted using sub-1 GHz network.

In this paper, a low-cost bridge monitoring system using the Sub-1 GHz network was developed for both long-term and short-term bridge monitoring. The system mainly includes four functional components: sensors, wireless nodes, data gateway, and data processing center. Multiple sensors can be attached to a single wireless node, and the data can be transferred to the gateway through the Sub-1 GHz radio network. The computer located in the data center processes the raw data coming from these wireless nodes, turning them into the desired format. Furthermore, this system was implemented during the deck construction of a bridge, and the results were validated by comparing them with the computer simulation using finite element (FE) analysis. The comparison indicates that the system developed in this study can provide reliable and accurate results during bridge monitoring.
The design of the wireless bridge monitoring system considers data transmission distance and rate, power consumption, cost, and reliability. In this study, the wireless bridge monitoring system mainly consists of sensors, wireless nodes, gateway, and data processing station, as shown in Fig. 2. The system measures the changes of voltage in the sensors. Hence, many different types of sensors, such as strain gauges, tilt sensors, and LVDTs, can be connected into the same system.

Figure 2: Wireless bridge-monitoring system
The wireless nodes collect analog signals directly from the connected sensors and convert these signals into digital ones in a binary format. After each measurement, the binary data are transmitted from the wireless nodes to the gateway that is generally connected to the data station. Sub-1 GHz radio network was selected for the data transmission between the wireless nodes and gateway because the range can be up to 2.5 km (1.55 miles). The gateway can also be used to extend the wireless transmission distance through the Sub-1 GHz or cellular networks.
The gateway in this system accepts and sorts the binary data based on the address of each node. The data processing software installed in the data station is designed to convert binary data to decimal format and store all the decimal data into the data station. Another essential function of the data processing software is to control the wireless nodes and gateway to reduce power consumption.
2.2 Development of Wireless Node
The wireless node development includes two parts: hardware design and operating system (OS) design. The hardware design of the wireless node is shown in Fig. 3. The wireless node consists of several units such as power supply unit, power control unit, analog to digital converter (ADC), microcontroller (MCU), and radio transmitter. Since each component of the wireless node requires a different range of voltage, voltage regulators are included in the power supply unit to ensure the functionality of all the units.

Figure 3: Hardware design of wireless node
The material used in developing the wireless node is shown in Table 2. The wireless node is powered by two 18650 batteries connected in series, with a voltage of 3.7 V and capacity of 3000 mA for each battery. A CC-1310 Launchpad from Texas Instruments (Dallas, TX, USA) is used as the MCU unit, as shown in Fig. 4. The CC1310 device is a wireless MCU targeting low power, long-range wireless applications based on Sub-1 GHz radio network [20]. Also, ADS-1256, which is an extremely low noise, 24-bit ADC with eight analog channels manufactured by Texas Instruments, is selected as ADC unit (Fig. 5). The ADS 1256 has a maximum sample rate of 30 kHz, and allows converting the analog signal from a sensor into a digital signal with an accuracy of 10/224 V (0.0006 mV) [21]. The MOSFET power control unit is used as an electronic switch for both sensors and ADC in order to reduce the power consumption of the entire system. An example setup of the wireless node is shown in Fig. 6.

Figure 4: CC1310 launchpad

Figure 5: ADS-1256 analog to digital converter
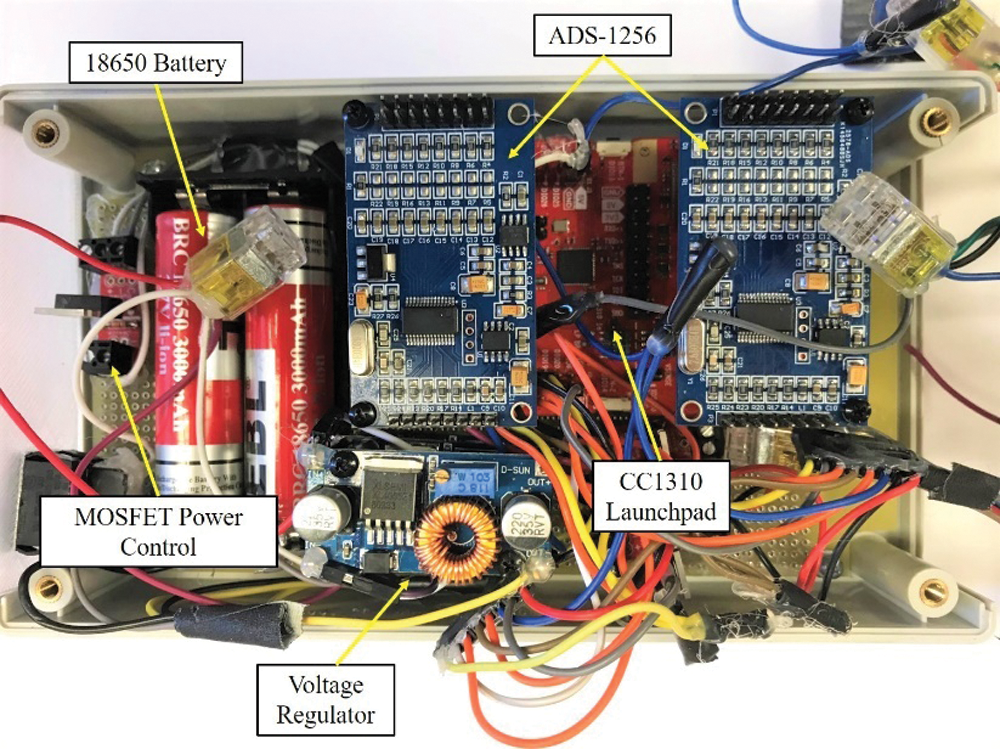
Figure 6: Example setup of wireless node

The development of the operating system for a wireless node needs to consider the power consumption and the communication between the node and the gateway. The general workflow is shown in Fig. 7. After the initialization of the MCU and all the input/output ports (I/O ports), the wireless node turns to low power consumption mode, only accepting commands from the gateway. There are three basic commands for controlling the wireless node: “Status”, “Collect”, and “Stop”. When the wireless node received “Status” command, the unique address, which is pre-assigned to each wireless node, is transmitted to the gateway in order to list all available wireless nodes. The “Collect” command sets the wireless node into active mode and allows the data from sensors transferring between the node and gateway. However, the system turns into sleep mode after each reading if the sample rate is larger than two seconds in order to eliminate unnecessary power consumption. The “Stop” command stops all activities and puts the wireless node into sleep mode until a new command is received.

Figure 7: Workflow of operating system for wireless node
In order to receive data from the wireless node, the CC1310 Launchpad is also used as gateway. The gateway can also send commands to wireless nodes and communicate with the data processing software. The workflow of the operating system for the gateway is shown in Fig. 8. The major role of the gateway is to link the wireless nodes and data processing software. The gateway basically sends any command received from the data processing software. It also transfers data received from wireless nodes to the data processing software for further analysis. When a “Status” command is received, the gateway transmits the command and is then set to “waiting” mode once the “Status” data is received and transferred to the data processing software. The “Collect” command lets the gateway accept data from wireless nodes until the “Stop” command is received from the data processing software.
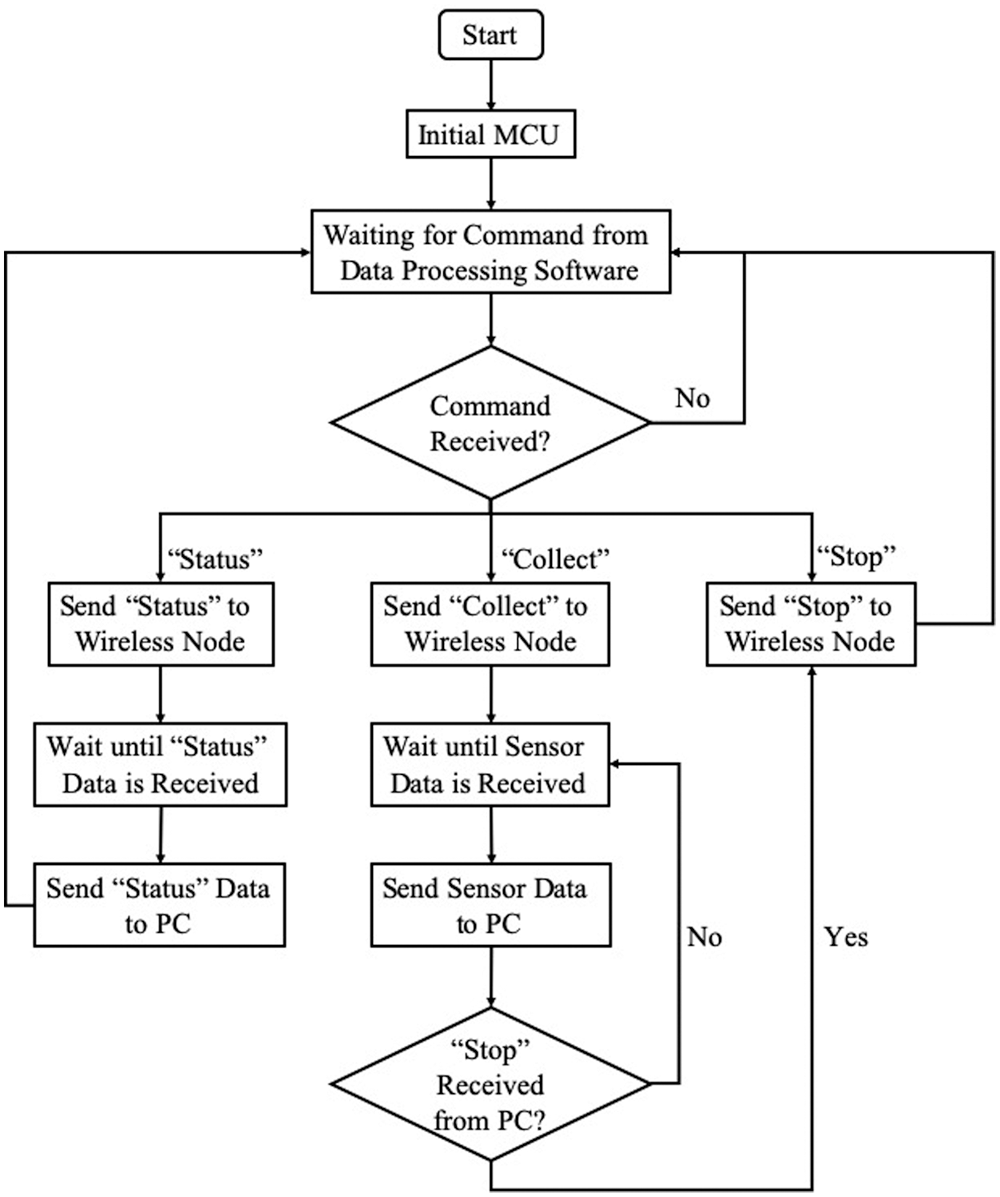
Figure 8: Workflow of operating system for gateway
2.4 Development of Data Processing Software
The data processing software includes three different functional modules: “Check Status”, “Data Collection”, and “Stop”. The workflow for all three modules is shown in Fig. 9. The purpose of the “Check Status” module is to check all available wireless nodes and list them in the user interface. The “Data Collection” module sends “Collect” command through the gateway to activate all wireless nodes. Then the raw data, which is in binary format, is converted to decimal data. The decimal data is stored in the computer and also listed in the user interface. The “Stop” module stops all the activities of wireless nodes and the gateway, putting them into “sleep” or “waiting” mode to reduce power consumption.
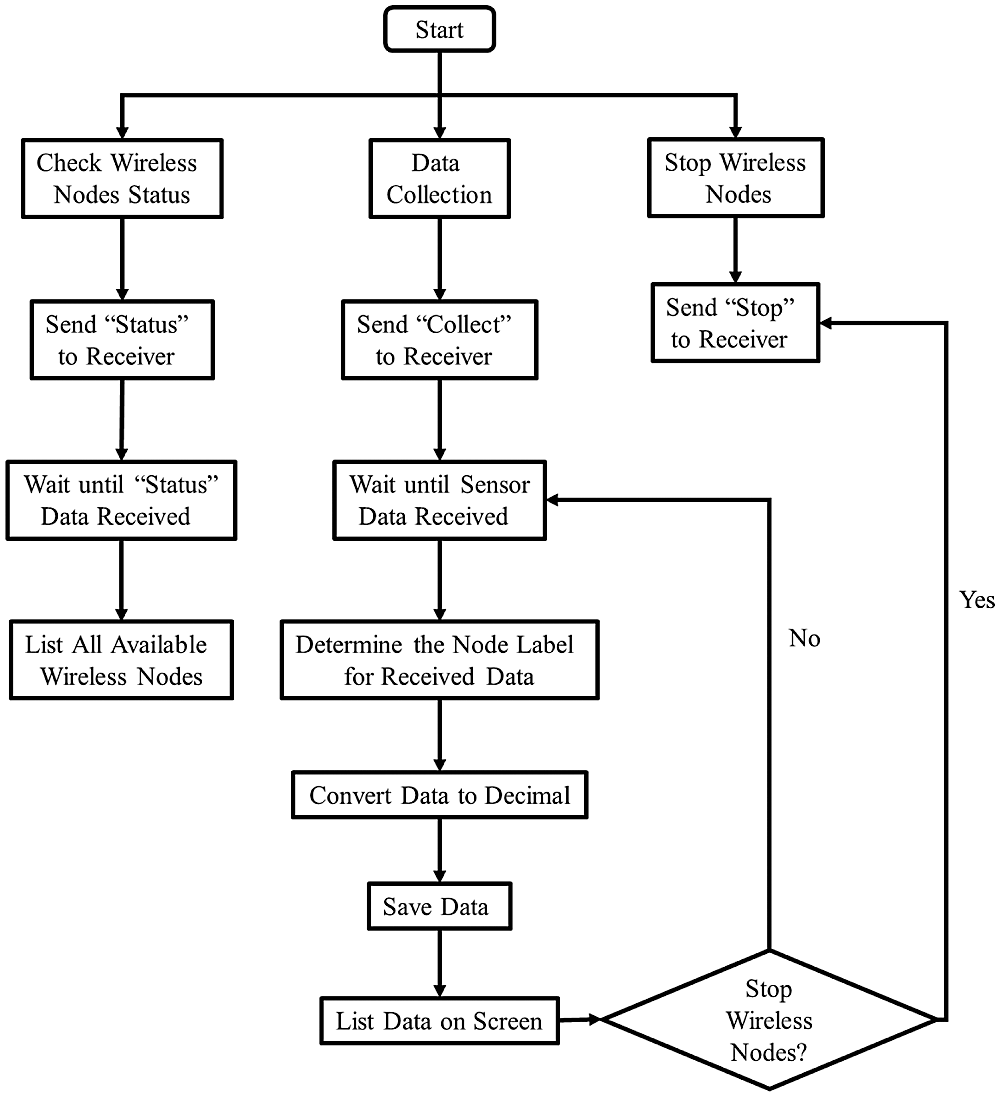
Figure 9: Workflow of data processing software
3 Validation through Field Bridge Monitoring
3.1 Bridge Information and Instrumentation
In order to validate the wireless bridge monitoring system as well as evaluate the exterior girder rotation during concrete deck placement, a bridge located in the state of Illinois was selected to be instrumented with different types of sensors during construction. The bridge is a three-span continuous bridge with span lengths of (23.5 + 29.3 + 23.5) m (77 + 96 + 77 ft). Six American W40 steel girders with a spacing of 2.21 m (7.25 ft) between each girder were utilized. In order to reduce the rotation in the exterior girder, pipe-tie systems [22–25] were installed between the exterior and the first interior girder with a distance of 2.44 m (8 ft) along the entire length of the bridge. The general geometric information of the bridge is shown in Table 3.

Tilt sensors and strain gauges were installed on the bridge to evaluate the rotation of bridge girders during deck construction. The locations of the sensors were determined based on the preliminary FE analysis results, which indicated that the largest transverse girder rotation occurs in-between the diaphragms that have the maximum longitudinal spacing; hence the girder transverse unbraced length [24,26]. The selected locations for the sensors are shown in Figs. 10 and 11.

Figure 10: Location of the section for sensor installation

Figure 11: Location of the tilt sensors and strain gauges
The tilt sensors, CXTLA02 manufactured by MEMSIC Inc. (Andover, MA, USA), were used to evaluate the rotation of exterior girder during deck construction. These sensors were protected with open aluminum boxes, shown in Fig. 12, and were installed at the middle and bottom of girder’s web.

Figure 12: Tilt sensor with open aluminum box
Foil strain gauges (CEA-06-125UN-350) manufactured by Micro-Measurements (Raleigh, NC, USA) were installed at the bottom flanges of the exterior girder and first interior girder, as shown in Fig. 13a. Strain gauges were also installed on the diagonal pipe of the temporary rotation prevention system to evaluate the performance of the pipe-tie rotation prevention system (Fig. 13b).
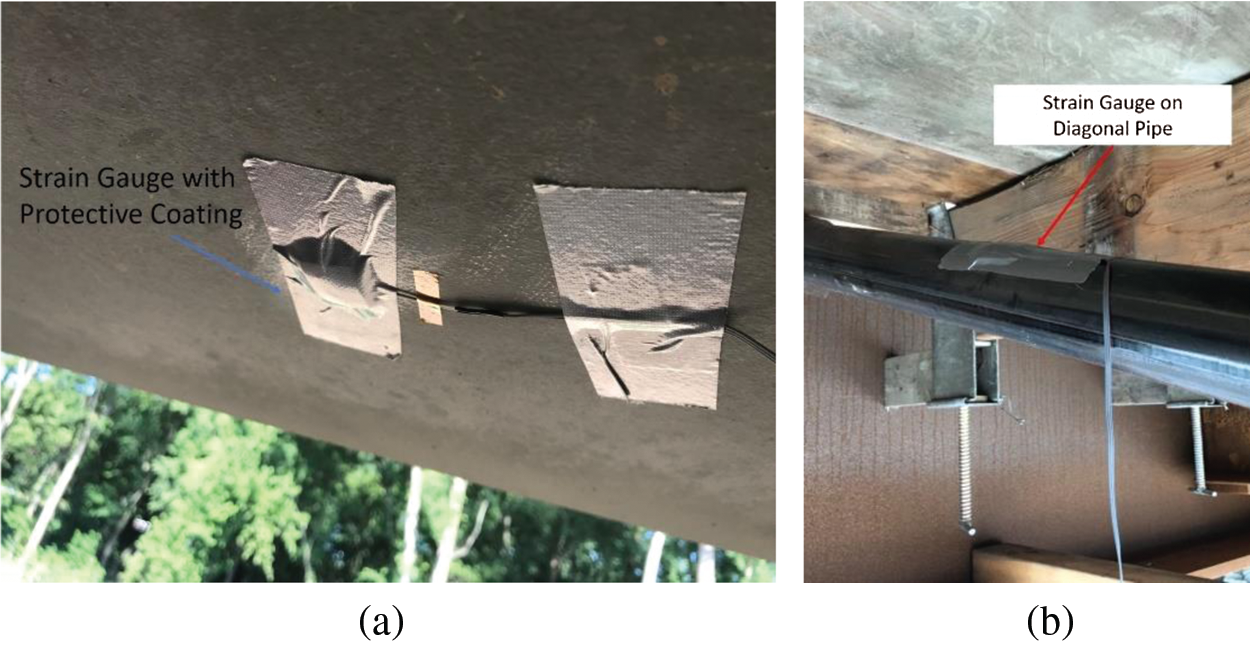
Figure 13: Strain gauge with protective coating. (a) Bottom of girder (b) Diagonal pipe
All sensors were connected to the wireless nodes developed in this study. Fig. 14 shows an example setup of the wireless node during the bridge monitoring. The wireless nodes were connected to the gateway wirelessly, and the data center was setup close to the construction site since the bridge was monitored only during deck construction. The distance between the wireless nodes and the data center was approximately 300 m (984 ft), which is much farther than for systems using Bluetooth, WIFI or Zigbee technologies.
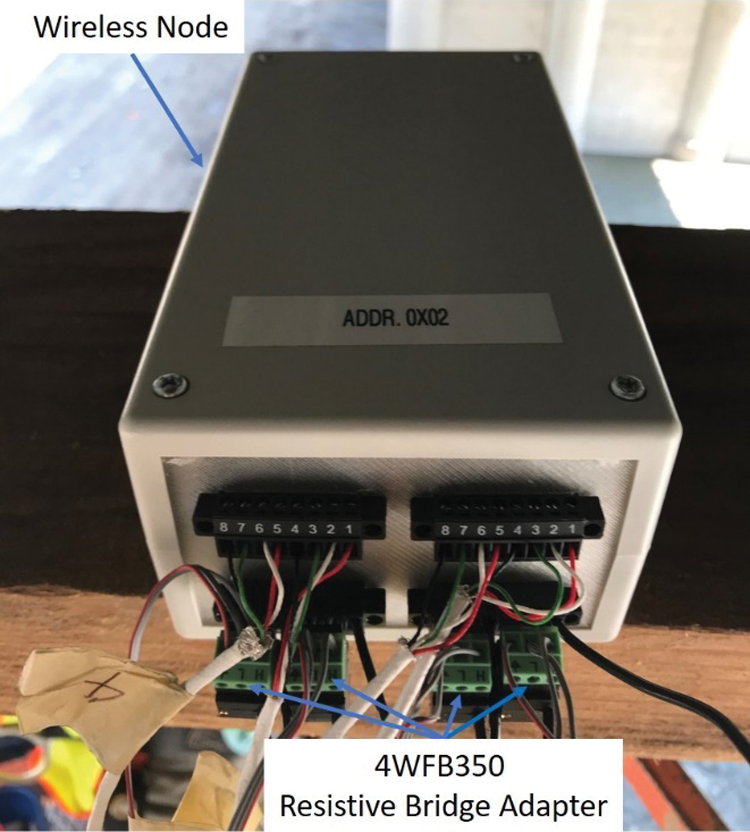
Figure 14: Resistive bridge adapters connected between wireless node and sensors
The wireless node measures the voltage changes in the tilt sensor; therefore, Eq. (1) must be used to calculate the rotation values. In this equation, Vout is the output voltage obtained from the sensor by converting the analog signals to decimal format. VOffset indicates the output voltage of the sensor when there is “zero” rotation, while M is the multiplier used to convert the voltage data to rotation angles.
Because voltage changes for strain gauges are generally very small, the Wheatstone quarter bridge circuit was used to detect the small voltage changes in strain gauges. Resistive bridge adapters, 4WFBS350 manufactured by Campbell Scientific (Logan, UT, USA), were connected between the wireless node and strain gauges. Therefore, the strain values can be computed using Eq. (2) [27].
In the equation, G is the gauge factor, and Vr can be calculated using the following Eq. (3) [27]:
The field monitored rotation data using the wireless bridge monitoring system are shown in Fig. 15. The rotation and strain data were collected at every 30 s. The construction of the concrete deck slab started at 7:46 AM, where the fresh concrete was placed from the west abutment toward the east abutment. The girders started to rotate transversely, at the location of the sensors, at 10:00 AM when the fresh concrete and the screed machine reached the second span, creating an inward rotation in the exterior girder (shown in Fig. 16). When the construction of the concrete deck reached the third span, at the instrumented section, the exterior girder experienced an outward rotation (shown in Fig. 17) with a maximum value of 0.18 degrees in the bottom of girder. The rotation in the middle of the girder shows very similar results compared with the bottom of the girder, indicating no significant distortion of the web during bridge deck construction.
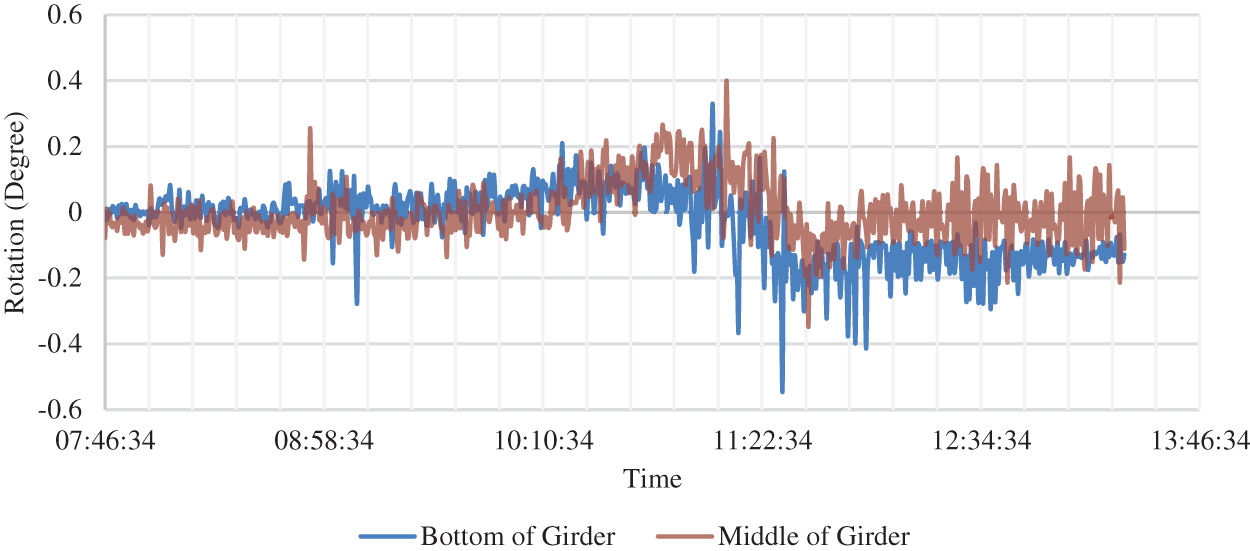
Figure 15: Field rotation measured by wireless monitoring system
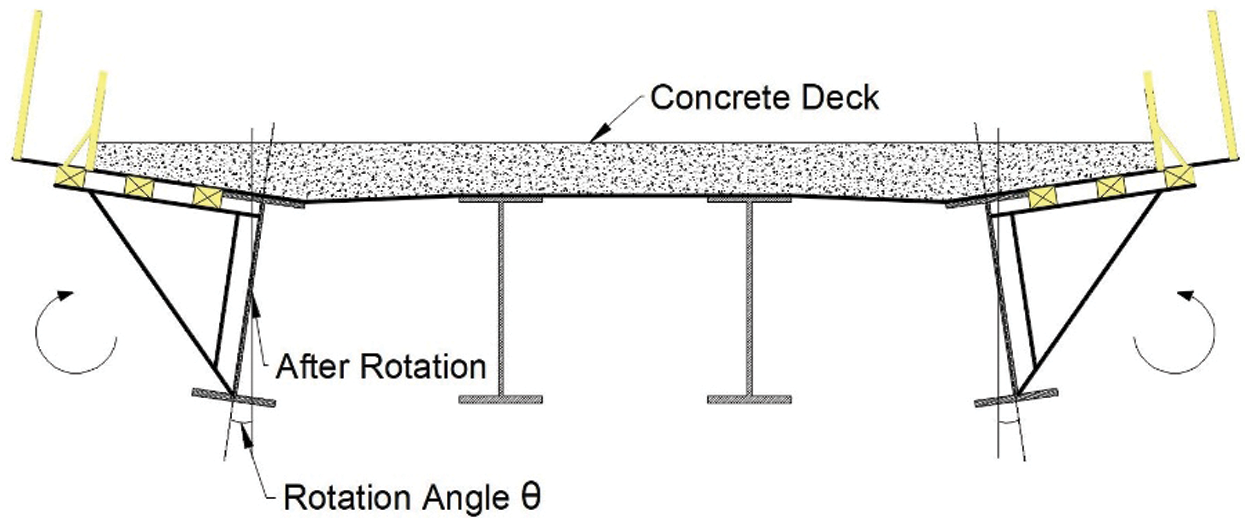
Figure 16: Inward rotation in the exterior girder
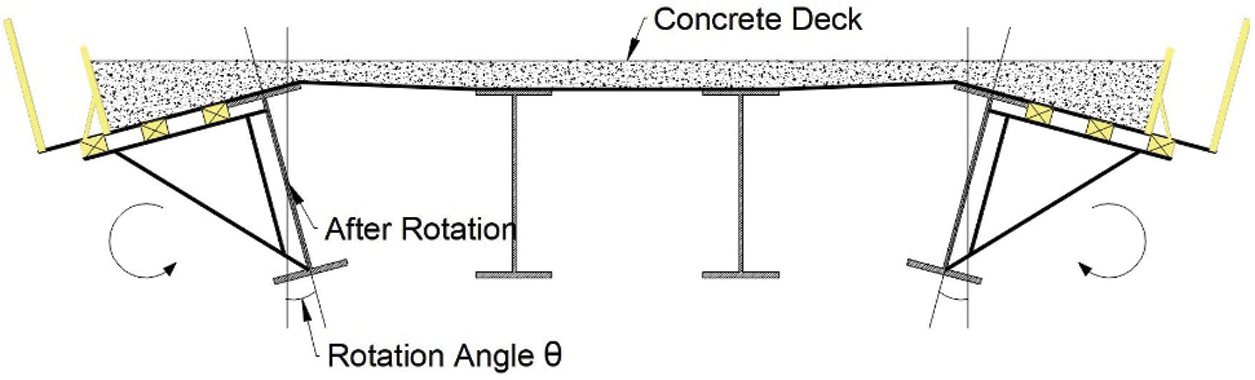
Figure 17: Outward rotation in the exterior girder
The strain values were measured in the diagonal pipes to evaluate the performance of the pipe-tie rotation prevention system as well as the wireless bridge monitoring system. The field results of the strain in the diagonal pipe are shown in Fig. 18. The results indicate that the diagonal pipe started to engage with the bridge girder system when the construction loads reached a location close to the monitored section. Similar to the rotation values, the largest strain value was observed when the screed machine and fresh concrete were above the monitored section, resulting in a compressive strain of approximately −87 με.
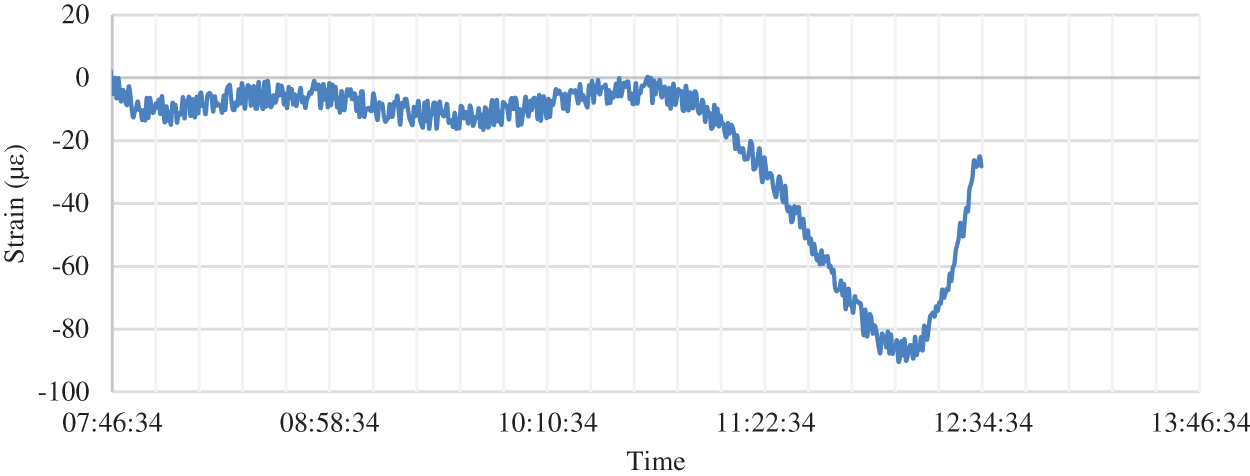
Figure 18: Field strain in diagonal pipe measured by wireless monitoring system
The strain in the bottom of the exterior and first interior girders was also monitored during deck construction. The results are shown in Fig. 19. Both girders experience similar strains during the construction process. The maximum strain values recorded were 97.8 and 86.7 με for the exterior and interior girders, respectively.
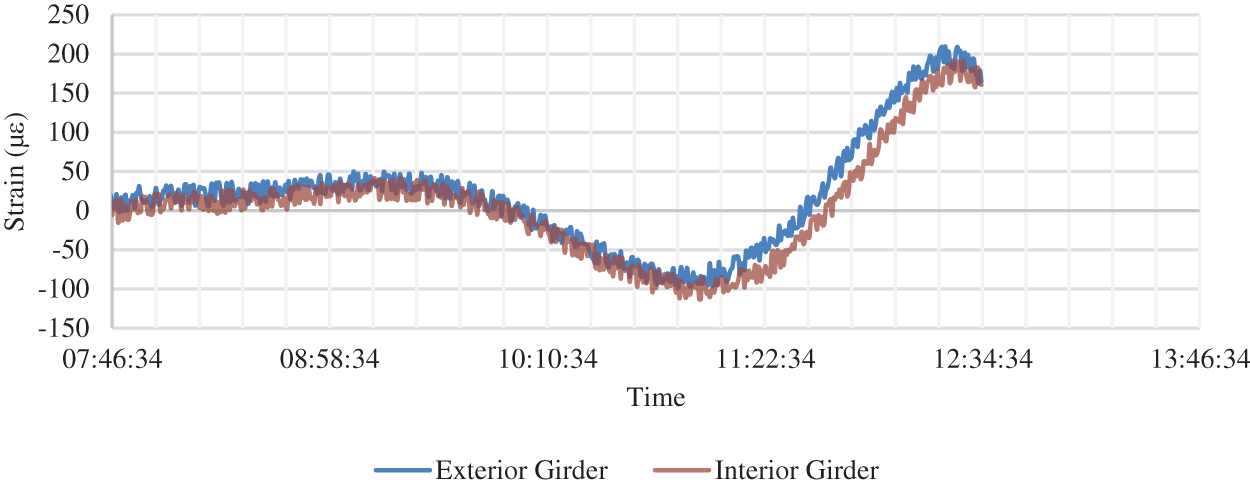
Figure 19: Field strain at bottom of girders measured by wireless monitoring system
Both rotation and strain data show very low noise during monitoring, mainly due to the use of the low-noise ADC. The ADS-1256 ADC used in this study offers outstanding noise performance that can be optimized by adjusting the data rate or programmable gain amplifier (PGA) setting. When the data rate is programmed using 100 Hz and the PGA is set as 64, the system can convert an analog signal to a high-resolution digital signal with an effective number of bits (ENOB) at 20 [21]. The input-referred noise at this time is approximate 0.17 μV, resulting in a rotation of only 0.0000002 degrees or a strain of around 0.5 με. Therefore, the noise can be eliminated by using this high-resolution ultra-low-noise ADC to ensure the wireless monitoring system’s performance.
3.3 Comparison Between FE and Field Results
In order to validate the performance of the wireless bridge monitoring system, the field monitoring results were compared with results from a FE analysis. The FE model was established using SAP2000 software and has been verified in previous research studies [22–25,28,29], as shown in Fig. 20. The bridge girders, as well as the diaphragms, were modeled using shell elements in order to include the warping effect and the distortion of the girder’s web in the analysis [30–35]. The overhang brackets were modeled using three-dimensional (3-D) frame elements, while 3-D truss elements were assigned to components of the temporary rotation prevention system. The details of the elements used in the FE model are shown in Table 4.
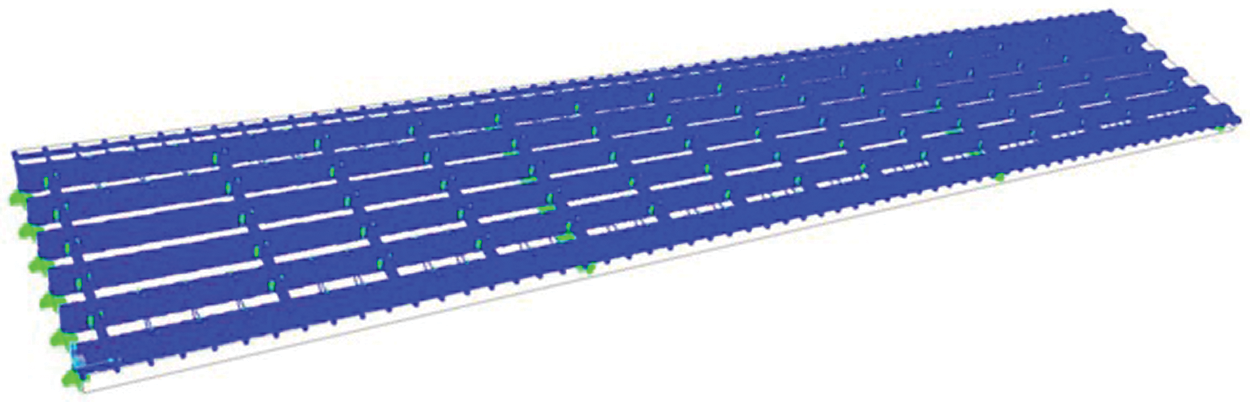
Figure 20: Finite element model for selected bridge

Since it is difficult to confirm the exact locations of the construction equipment from the field data, the comparison between the FE and the field results is conducted by comparing only the maximum rotation and strain/stress values to assess the accuracy and reliability of the wireless monitoring system. Fig. 21 shows the comparison between the FE and the field rotation results. In the middle of the girder’s web, the FE analysis indicates a rotation of 0.139 degrees which shows only 2% difference compared with 0.142 degrees from the field monitoring. The difference of the rotation values in the bottom of the girder between FE and field results is 7%. The small difference in rotation values demonstrates the accuracy of the system when measuring the changes of voltage inside the sensors.
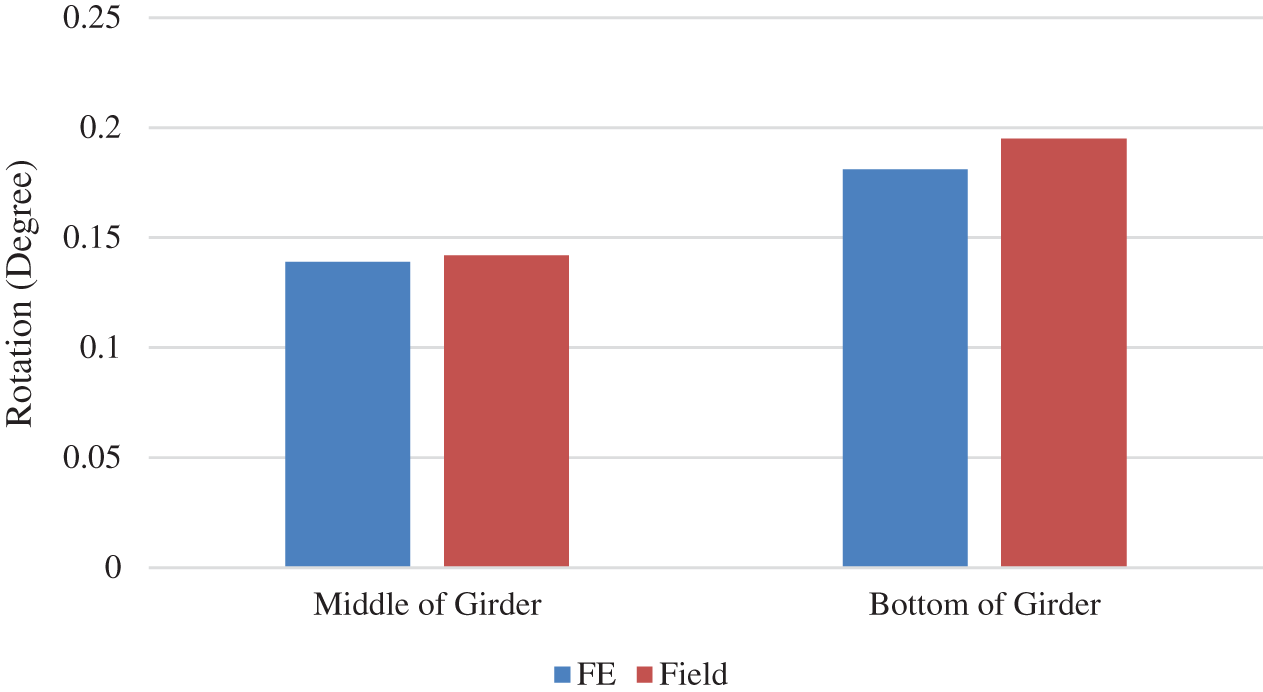
Figure 21: Comparison between the FE and field rotation results
The comparison between FE and field strain/stress results is shown in Fig. 22. The FE analysis shows a compressive strain of −105.3 με (−21.1 MPa) in the diagonal pipe, approximately 15% difference when compared to the field results (−87 με/−17.4 MPa). The strain/stress values in both exterior and interior girders were similar, with less than 6% difference observed. The large compressive strain/stress in the diagonal pipe indicates the pipe-tie system has a significant contribution in preventing the girder rotation. Moreover, the small differences between the FE and field results show the high performance of the wireless bridge monitoring system developed in this study.
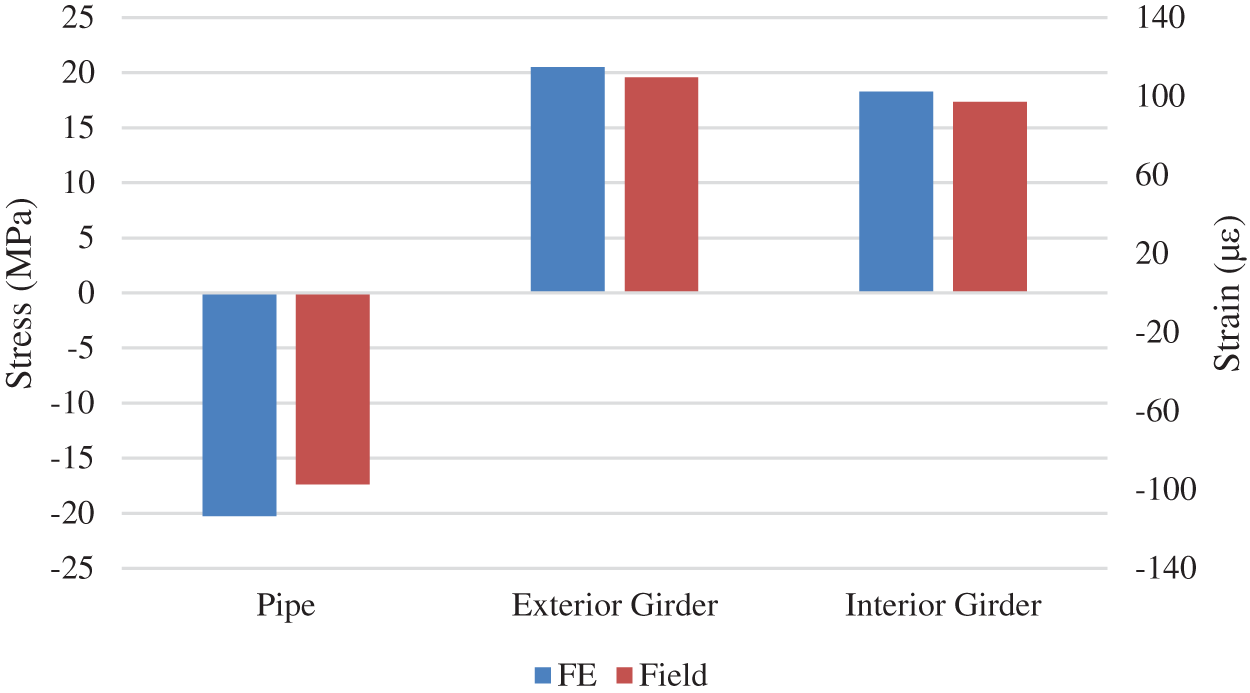
Figure 22: Comparison between the FE and field strain/stress results
In this study, a Sub-1 GHz network-based wireless bridge monitoring system was developed. The main functional components in this system include sensors, wireless node, gateway, and data center. The wireless node collects the analog signals directly from sensors, and transmits all the data through the Sub-1 GHz network to either the data center directly or the gateway. The gateway can receive and sort the data from all the wireless nodes, and then forward data to the data center using the wireless network such as cellular or Sub-1 GHz network, depending on the communication distance. To evaluate the performance of the system, a bridge was instrumented with different types of sensors and the wireless monitoring system developed in this study during the deck construction. The following conclusion can be drawn based on the findings of this study.
(a)The wireless monitoring system developed in this study is demonstrated to be an effective and cheap solution for bridge monitoring.
(b)The condition of the bridge site can be very complex and sometimes requires long data transmission distances. Sub-1 GHz network can be a better solution for bridge monitoring since the data transmission distance can be several kilometers and does not require a cellular network.
(c)The communication distance between the wireless nodes and the data center can be extended by using the gateway. The gateway forwards all the received data to the data center using the Sub-1 GHz network or cellular network, depending on the distance between the gateway and the data center.
(d)High accuracy ADC should be used in the wireless bridge monitoring system in order to obtain high accuracy and reliable field results. When connecting strain gauges, the Wheatstone bridge circuit should be used in order to detect the minor changes of the voltage/current in the strain gauges.
(e)Power consumption can be controlled by using low-power consumption components. Besides, the design of the software, including the OS for the wireless node, gateway, and data processing software, can dramatically affect the power consumption of the system.
Funding Statement: The authors received no specific funding for this study.
Conflicts of Interest: The authors declare that they have no conflicts of interest to report regarding the present study.
1. Kassim, M. R., Mat, I., Harun, A. N. (2014). Wireless sensor network in precision agriculture application. International Conference on Computer, Information and Telecommunication Systems, pp. 1–5. USA, IEEE. [Google Scholar]
2. Liu, Z. (2014). Hardware design of smart home system based on zigbee wireless sensor network. AASRI Procedia, 8, 75–81. DOI 10.1016/j.aasri.2014.08.013. [Google Scholar] [CrossRef]
3. Kumara, V. H. P., Shubhangi, D. C. (2020). Design and implementation of real time monitoring of bridge using wireless technology. Second International Conference on Inventive Research in Computing Applications, pp. 949–953. India, IEEE. [Google Scholar]
4. Chen, K., Chen, J. C., Cox, R. A. (2012). Real time facility performance monitoring system using rfid technology. Assembly Automation, 32(2), 185–196. DOI 10.1108/01445151211212334. [Google Scholar] [CrossRef]
5. Wang, Y., Lynch, J. P., Law, K. H. (2007). A wireless structural health monitoring system with multithreaded sensing devices: Design and validation. Structure and Infrastructure Engineering, 3(2), 103–120. DOI 10.1080/15732470600590820. [Google Scholar] [CrossRef]
6. Vetti, S., Olsson, J., Copley, J. (2016). Sub-1 GHz long-range communication and smartphone connection for IoT applications. USA: Texas Instruments. [Google Scholar]
7. Sun, Y., Xu, C. W. (2010). Notice of retraction: The research of bridge state monitoring system based on IoT technology. 2010 IEEE International Conference on Advanced Management Science, pp. 87–90. USA, IEEE. [Google Scholar]
8. Yu, Y., Han, F., Bao, Y., Ou, J. (2016). A study on data loss compensation of wifi-based wireless sensor networks for structural health monitoring. IEEE Sensors Journal, 16(10), 3811–3818. DOI 10.1109/JSEN.2015.2512846. [Google Scholar] [CrossRef]
9. Mehta, V., El Zarki, M. (2004). A bluetooth based sensor network for civil infrastructure health monitoring. Wireless Networks, 10(4), 401–412. DOI 10.1023/B:WINE.0000028544.49457.eb. [Google Scholar] [CrossRef]
10. Choi, S. H., Kim, B. K., Park, J., Kang, C. H., Eom, D. S. (2004). An implementation of wireless sensor network for security system using bluetooth. IEEE Transactions on Consumer Electronics, 50(1), 236–244. DOI 10.1109/TCE.2004.1277868. [Google Scholar] [CrossRef]
11. Heo, G. H., Lee, W. S., Lee, C. O., Jeon, J. R., Sohn, D. J. (2011). Development of smart wireless measurement system for monitoring of bridges. Journal of the Korea Institute for Structural Maintenance and Inspection, 15(2), 170–178. DOI 10.11112/jksmi.2011.15.2.170. [Google Scholar] [CrossRef]
12. Moreu, F., Kim, R. E., Spencer, B. F. (2017). Railroad bridge monitoring using wireless smart sensors. Structural Control and Health Monitoring, 24(2), e1863. DOI 10.1002/stc.1863. [Google Scholar] [CrossRef]
13. Oleaga, C., Lavado, A., Riu, A., Rothemund, S., Carmona-Moran, C. A. et al. (2018). Long-term electrical and mechanical function monitoring of a human-on-a-chip system. Advanced Functional Materials, 29(8), 1805792. DOI 10.1002/adfm.201805792. [Google Scholar] [CrossRef]
14. Hou, S., Wu, G. (2019). A low-cost IoT-based wireless sensor system for bridge displacement monitoring. Smart Materials and Structures, 28(8), 085047. DOI 10.1088/1361-665X/ab2a31. [Google Scholar] [CrossRef]
15. Lee, J. S., Su, Y. W., Shen, C. C. (2007). A comparative study of wireless protocols: Bluetooth, UWB, ZigBee, and Wi-Fi. 33rd Annual Conference of the IEEE Industrial Electronics Society, pp. 46–51. USA, IEEE. [Google Scholar]
16. Saad, C., Mostafa, B., Ahmadi, E., Abderrahmane, H. (2014). Comparative performance analysis of wireless communication protocols for intelligent sensors and their applications. International Journal of Advanced Computer Science and Applications, 5(4), 76–85. DOI 10.14569/issn.2156-5570. [Google Scholar] [CrossRef]
17. Lin, J., Talty, T., Tonguz, O. (2015). On the potential of bluetooth low energy technology for vehicular applications. IEEE Communications Magazine, 53(1), 267–275. DOI 10.1109/MCOM.2015.7010544. [Google Scholar] [CrossRef]
18. Gorrepotu, R., Korivi, N. S., Chandu, K., Deb, S. (2018). Sub-1 GHz miniature wireless sensor node for IoT applications. Internet of Things, 1, 27–39. DOI 10.1016/j.iot.2018.08.002. [Google Scholar] [CrossRef]
19. Wardana, I. N. K., Ciptayani, P. I., Suranata, I. W. A. (2018). Sub-1 GHz wireless sensing and control instruments for green house farming system. Journal of Physics: Conference Series, 953, 012081. DOI 10.1088/1742-6596/953/1/012081. [Google Scholar] [CrossRef]
20. Texas Instrument (2020). CC13x0, CC26x0 SimpleLinkTM Wireless MCU Technical Reference Manual. Dallas, TX: Author. [Google Scholar]
21. Texas Instrument (2013). Very Low Noise, 24-Bit Analog-to-Digital Converter. Dallas, TX: Author. [Google Scholar]
22. Hui, L., Hraib, F., Vicente, M., Hindi, R. (2019). Effectiveness of exterior-beam rotation-prevention systems for bridge deck construction—Phase II. IL: Illinois Center for Transportation. [Google Scholar]
23. Ashiquzzaman, M., Hui, L., Ibrahim, A., Lindquist, W., Hindi, R. (2016). Effectiveness of Exterior Beam Rotation Prevention Systems for Bridge Deck Construction. IL: Illinois Center for Transportation. [Google Scholar]
24. Hui, L., Hraib, F., Hindi, R. (2018). Limiting exterior girder rotation during construction for non-skewed bridges. Maintenance, Safety, Risk, Management and Life-Cycle Performance of Bridges: Proceedings of the Ninth International Conference on Bridge Maintenance, Safety and Management, pp. 1456–1461. USA, CRC Press. [Google Scholar]
25. Hraib, F., Hui, L., Vicente, M., Hindi, R. (2019). Evaluation of bridge exterior girder rotation during construction. Engineering Structures, 187, 149–160. DOI 10.1016/j.engstruct.2019.02.058. [Google Scholar] [CrossRef]
26. Hraib, F., Hui, L., Illis, B., Vicente, M., Hindi, R. (2020). Evaluation of the orientation of concrete finishing machines in skewed bridges. In: SP342: Advanced analysis and testing methods for concrete bridge evaluation and design, pp. 129–142. USA: American Concrete Institute. [Google Scholar]
27. Compbell Scientific Inc. (2017). 4WFBS120, 4WFBS350, 4WFBS1K 4-Wire Full-Bridge Terminal Input Modules Instruction Manual, Logan, UT: Author. [Google Scholar]
28. Hui, L., Hraib, F., Hindi, R. (2019). Diaphragm design for limiting exterior girder rotation during overhang construction. Structures Congress, pp. 134–142. USA, American Society of Civil Engineers. [Google Scholar]
29. Hui, L. (2019). Numerical and experimental evaluation of bridge exterior girder during deck construction (Ph.D. Thesis). Saint Louis University, USA. [Google Scholar]
30. Cambronero-Barrientos, F., Díaz-del-Valle, J., Martínez-Martínez, J. A. (2017). Beam element for thin-walled beams with torsion, distortion, and shear lag. Engineering Structures, 143, 571–588. DOI 10.1016/j.engstruct.2017.04.020. [Google Scholar] [CrossRef]
31. Choi, B. H., Park, Y. (2010). Inelastic buckling of torsionally braced I-girders under uniform bending, II: Experimental study. Journal of Constructional Steel Research, 66(8–9), 1128–1137. DOI 10.1016/j.jcsr.2010.02.005. [Google Scholar] [CrossRef]
32. Choi, B. H., Lee, T. H., Park, Y. M. (2014). Torsional stiffness requirements for diaphragm bracing of discretely braced I-girders. International Journal of Steel Structures, 14(2), 355–368. DOI 10.1007/s13296-014-2015-z. [Google Scholar] [CrossRef]
33. Megson, T. H. G. (2013). Chapter 3-torsion of solid sections. In: Aircraft Structures for Engineering Structures, pp. 69–88. USA: Butterworth-Heinemann. [Google Scholar]
34. Roddis, W. M. K., Kriesten, M., Liu, Z. (1999). Torsional analysis for exterior girders. KS: University of Knasas Center for Research. [Google Scholar]
35. Sapountzakis, E. J., Mokos, V. G. (2007). 3-D beam element of composite cross section including warping and shear deformation effects. Computers & Structures, 85(1–2), 102–116. DOI 10.1016/j.compstruc.2006.09.003. [Google Scholar] [CrossRef]
 | This work is licensed under a Creative Commons Attribution 4.0 International License, which permits unrestricted use, distribution, and reproduction in any medium, provided the original work is properly cited. |