| Structural Durability & Health Monitoring |
DOI: 10.32604/sdhm.2022.010622
ARTICLE
Tyre Pressure Supervision of Two Wheeler Using Machine Learning
1Department of Mechanical Engineering, College of Engineering Pune, Maharashtra, 411005, India
2School of Mechanical Engineering, Vellore Institute of Technology, Tamil Nadu, 600127, India
3Savitribai Phule Pune University, Maharashtra, 411007, India
*Corresponding Author: R. Jegadeeshwaran. Email: krjegadeeshwaran@gmail.com
Received: 14 March 2020; Accepted: 23 April 2020
Abstract: The regulation of tyre pressure is treated as a significant aspect of ‘tyre maintenance’ in the domain of autotronics. The manual supervision of a tyre pressure is typically an ignored task by most of the users. The existing instrumental scheme incorporates stand-alone monitoring with pressure and/or temperature sensors and requires regular manual conduct. Hence these schemes turn to be incompatible for on-board supervision and automated prediction of tyre condition. In this perspective, the Machine Learning (ML) approach acts appropriate as it exhibits comparison of specific performance in the past with present, intended for predicting the same in near future. The current investigation experimentally assesses the suitability of ML scheme for vibration based on-board supervision of tyre pressure of two wheeled vehicle. In order to examine the vibration response of a wheel hub, the in-house design & development of DAQ (Data Acquisition System) is described. Micro Electro-Mechanical Scheme (MEMS) built accelerometer is incorporated with open source hardware and software to collect and store the data. This framework is easy to develop, monitor and can be retrofitted in two wheeled vehicle. For various pressure conditions, the change in response of wheel hub vibration with respect to time is collected. The statistical parameters describing these vibration signals are determined and the decision tree is applied to select distinguishing parameters between extracted parameters. The classification of different conditions of tyre pressure is carried out using ML classifiers.
Keywords: Machine learning; tree based classifiers; decision tree; tyre pressure supervision; autotronics
How frequently do we test the pressure in tyres of automobile? The answer would be ‘usually no’; unless the automobile itself gives the major indication. Yes, and this will lead to numerous problems!!! Generally the automobile user manual is referred to select the appropriate tyre pressure. It is always suggested that, tyre pressure to be supervised regularly, i.e., once in a week or in between the long travel of the automobile or weighing higher loads as 3–6% natural drop of air pressure for each month is usual. This manual supervision of the tyre pressure is really a tedious task and typically ignored by 99% users. Operating tyres at incorrect pressure lead to tragic and pathetic steering, inordinate stretch of sidewalls evolving heat and hence wear. It is not at all suitable where emergency stop or sudden drive action is expected. The under-inflated tyres are favorable for rolling resistance which demands more energy to make it turn and hence affects fuel economy. Specifically, if a vehicle is operated with pressure less than 5 PSI (pounds per square inch) than expected value, then life of tyre get shorten by around 25%. On the other hand over-inflated tyres affect braking ability due to extreme friction. Hence tyre pressure supervision intended for assurance of the correct tyre pressure eliminates all above difficulties and offers several advantages when vehicle performance and safety is considered [1–5]. The tyre pressure monitoring methodologies are mainly categorized in two groups; one is direct and another is indirect approach. The one is tyre rotation monitoring and another is tyre pressure monitoring. In first method, the angular speed of the wheel is measured in intention to correlate it with desired pressure and send alert to the control panel. In second, pressure gauges are employed which captures pressure inside the wheel and send warning signal to control system. The second method is very popular as reads pressure directly, the instrumentation required is readily available and work in both static and dynamic driving conditions. The pneumatic tyres demand such supervision as the pressurized air performs role of spring and diminishes the vibration. The direct approach involves the use of a pressure sensor attached on the interior or exterior part of the wheel rims. The sensor needs to be integrated with the signal conditioning, processing and controlling components for the data acquisition, i.e., to the centralized control module. The data is acquired, analyzed and interpreted to send an alert if the pressure rating in the tyre is less as compared to the desirable level. The direct approach is advantageous with the aspects such as it provides real pressure value, not prone to false readings due to tyre rotations or replacements, the power batteries usually last for a longer time, etc. But the issues like costlier instrumentation, non-serviceable batteries (once it is exhausted, the complete sensor has to replaced), requirement of continuous installation, servicing, and replacement limits the approach for real time pressure monitoring. As the name implies an indirect approach does not truly estimates tyre pressure but correlates the performance of other easily measurable parameter with that of pressure. It classically uses sensor to measure wheel velocity as same as anti-lock braking provision. The rate of revolution a wheel indicates how fast the tyre is rotating. Once the speed is known, the diameter of tyre is easily deduced. Now if a speed of wheel is measured as more than the desirable, the alert of ‘underinflated tyre’ is set. This approach is relatively economical as compared to other approaches. It also involves less coding/repairs for the years. There is no need of separate installation and maintenance. It is fully depends on diameter of the tyre and respective rate of revolution. Hence care must be taken while replacement. This method may act unreliable in case of faulty, uneven tyres. The control system has to be reset every re-inflation of the tyre [6–9]. In the continuation of the indirect approach, the use of an accelerometer and driveline data also has reported by many researchers. A scheme proposed by Zhu et al. [10] incorporates used an intelligent tyre with 3-axis accelerometers. It is stated that an accelerometer is suitable for continuous and truthful interpretation of pressure accompanied with fewer electronic components. The prototype was developed and data acquisition was carried out for various input conditions. The emphasis was given for examining acceleration in the direction of circumference of the rim. The correlation between vibration frequency and pressure was deduced after the data analytics. The verification of the prototype was made w.r.t. real time data acquired on a vehicle for same input conditions. A novel approach developed by Wei et al. [11] uses fusion of piezoresistive pressure sensor and accelerometer to create monolithic composite sensor. An attempt was made to enhance the sensitivity with seismic-mass being electroplated. With an intention to provide on-chip known-good-die and reliable monitoring, the electroplated metal mass was employed to attain the electrostatic self-testing function. It is showed that the pressure sensor and accelerometers separately attained the improved sensitivity as 83.6 millivolts per Mega-Pascal and 15.6 microvolts per gravitational acceleration. Similar approach integrating two sensors was presented. It includes the fusion of pressure sensor diaphragm and proof-mass of accelerometer considerably decreases the chip size and moreover offers superior manufacturability. The approach is feasible for measuring both pressure and acceleration [12]. Muhammad [7] analyzed a torsional model of tyre vibrations by considering stiffness & moment of inertia. The numerous rule-based algorithms are modeled interpret the pressure variation w.r.t. change in vibration frequency showcased from respective torsional stiffness change. To overcome limitations of the threshold-built approach based on pressure/temperature measurement Egaji et al. [13] has proposed Dominance-built Rough Set Approach (DRSA). This is popularly recognized as multi-criteria categorization and preference learning scheme. It is similar to the decision rule-sets based on if-then conditions. First of all, the decision rule-sets were modeled based on one factor and other was kept fix. This resolved the problem of non-static and dynamic pressure/temperature relationship. Also the fixed factor was discretized to get rid of false alters. The two analysis levels were modeled based on this approach such as pressure-based analytics and temperature-based analytics. This methodology were implemented and showed that the proposed approach has led to a considerable decrease of wrong alerts. Yunta et al. [14] measured deformation of the tyre based on substantial in door experimental analytics using different parameters such as vertical load or slip angle. It is stated that there exists trustworthy relationship between lateral force, tensile and compressive strain. An interpretation scheme from experimental analytics was modeled and analyzed using MATLAB Simulink to showcase the competency of strain measuring sensors to estimate grip loss and deduce the lateral friction coefficient. Breglio et al. [15] presented a wireless framework for an intelligent tire monitoring. It mainly involves a sensor module integrated with a micro-controller, communication module. There were two sensors, i.e., flex sensor and a PVDF used to determine strain rate in free-rolling conditions, low speeds, acceleration and breaking in real conditions. The relationship between measurements and physical parameters were examined to exhibit the possibility to achieve a valuation of rolling speed of wheel with the use of a signal processing schemes. Zhou et al. [16] presented sensor fusion built rule-based algorithm. A combined mathematical model was developed to integrate three algorithms based on Bayesian, relative distance and multi-sensor weighted fusion. The comparative result showed that multi-sensory weighted fusion scheme serves better. Zhao et al. [17] used an accelerometer to detect the vertical axle acceleration and a dynamic pressure sensor placed on tyre valve stem to measure dynamic pressure. The transfer functions are derived and employed to determine the road profile. Persson et al. [18] utilized response of vibration and estimation of wheel radius for tyre pressure monitoring. The fusion of these two parameters is incorporated for identification of pressure losses and robustness owing to various input conditions. It is showed that the pressure loss more than 15% in multiple tyres can be identified within a minute. Prasanthi et al. [19] reported a research on monitoring tyre pressure using the android phone. The alert using the color indications were implemented to communicate via Serial port Bluetooth profile. Jeong et al. [20] carried out characterization of tyre based on the Buckingham theorem and with the use of signals from an intelligent tire sensor. Further, the estimator algorithm was developed using standing wave characteristics and it was validated by performing experimentation considering diverse tyre conditions. Sujon et al. [21] presented a state of art review for highlighting practices in Weigh-in-Motion (WIM) in transport applications by emphasizing on profits, limits, cost-effectiveness, and usage of data. Kumar et al. [22] proposed an indirect condition monitoring approach considering thermodynamics principle relates to a variation in vehicle-bridge interaction loads to a variation in dynamic pressure of a tyre. The approach was executed in two phases. The first was based on estimation of uncertainty in tyre parameters considering the Bayesian inference and implementation of the Stein variational gradient descent. The later on was about reconstruction of a variation in vehicle-bridge interaction loads from acquired tyre pressure signal seeing a damaged bridge. Abbi et al. [23] presented a novel approach for supervising tyre pressure through an application on an Android phone. It notifies and indicates color change when there would be a proper warning regarding over or under inflated tyres. Hence as far as on-board supervision and automated prediction of tyre condition for two wheeled vehicle is considered, the traditional schemes are turn to be incompatible. Moreover many schemes require regular manual conduct, are expensive and prone to limitations as stated above with respective case. In this perspective, the ML approach acts appropriate as it exhibits comparison of specific performance in the past with present, intended for predicting the same in near future. Therefore, this paper describes in-house designed DAQ applied for supervising tyre pressure of two wheeled vehicle and demonstrates experimental assessment using machine learning scheme. The in-house development of DAQ is described at the beginning of the paper. In intention of acquiring vibration of wheel hub, the experiments were systematically designed considering different factors such as pressure in tyre, speed of vehicle and road conditions. The change in response of wheel hub vibration with respect to time is collected for all the experimentation. The statistical parameters describing these vibration signals are determined and the decision tree is applied to select distinguishing parameters between all extracted parameters. The classification of different conditions of tyre pressure is carried out using ML classifiers. Fig. 1 shows the framework for the current investigation.
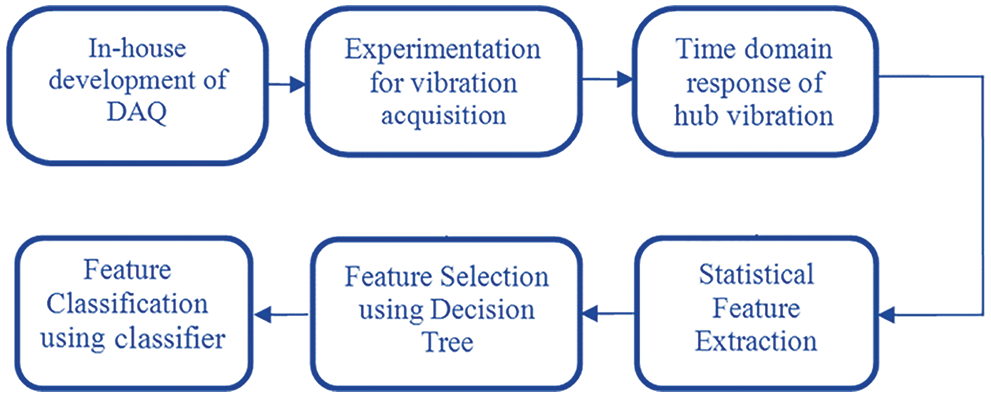
Figure 1: Framework for the tyre pressure supervision of two-wheeler using machine learning
2 In-House Design and Development of DAQ
The condition monitoring of any component of a mechanical system initiates with the observation of change in the response of performance indicators. Subsequently, significant changes in the response lead to typical failure. For current investigation, the literature states that the wheel hub vibration is a reliable indicator for the interpretation of a tyre pressure. It is also learnt that existing vibration measurement systems (generally called as ‘classic vibration analyzers’) are certainly not affordable due to higher costs [24]. In this context, development of a competent low cost system is the need of an hour. Hence, the in-house design & development of DAQ incorporating open source hardware and software has been advocated. The primary objective of this system is to acquire wheel hub vibration and secondarily to store the data for analyzing trend of response. An open source low-priced microcontroller Arduino Mega was interfaced with an accelerometer ADXL335 and communicated to Microsoft Excel to accumulate & exhibit the acquired readings [25–27].
2.1 Arduino Mega2560 as a Microcontroller
Arduino is an open-source prototype package created using a handy, user-friendly hardware and software. The package comprises of a programed circuit board and convenient software named Arduino Integrated Development Environment (IDE) used to design and run the computer program to the physical board. It offers a customary form factor which divides the roles of the micro-controller into an added manageable platform. There exist various types of Arduino packages based on kind of microcontrollers incorporated. One such kind ‘Arduino-Mega’ is based on microprocessor model ‘ATmega2560’. The Mega2560 has 16 analog ports which read the analog signal from a sensor and convert it into a digital value that can be read by the microprocessor. The each pin provides 10 bits of resolution. The clock speed is 16 Megahertz. Apart from this it has lots 54 digital input/output ports; 14 from which are utilized for pulse width modulation (PWM). The provision of a USB linkage, a power card, and a reset button makes the board as whole package for data acquisition. The greater number of ports makes this package more competent for as assignment where cluster of inputs or outputs is essential [28].
2.2 MEMS Accelerometer as a Sensor
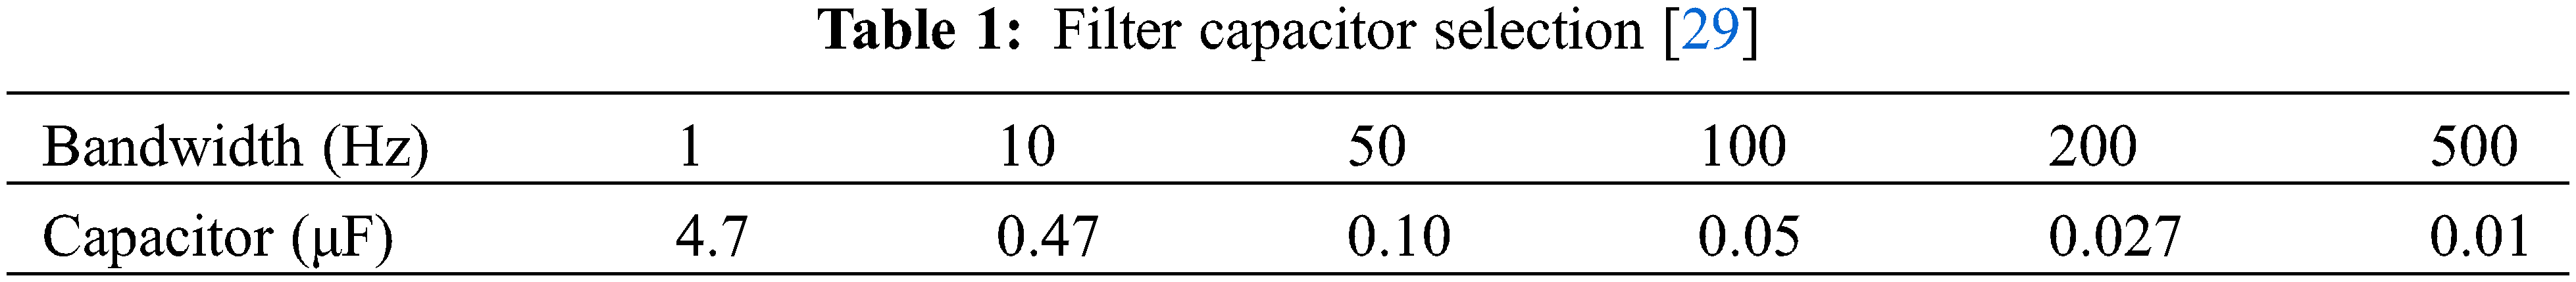
Micro Electro-Mechanical Scheme (MEMS) built accelerometer ADXL335 is used. It is small in size, tinny, consumes less power and converts acceleration into conditioned proportional voltage. The range in terms of gravitational acceleration is +/– 3 g. The provision of choosing the bandwidth with the help of three capacitors, i.e., CX, CY, and CZ at respective ports Xout, Yout, and Zout makes this accelerometer suitable and reliable for many applications for frequency range of 0.5 Hertz to 1600 Hertz for X and Y axes, and 0.5 Hz to 550 Hz for Z axis. The filtering of signal can be incorporated by setting the bandwidth through additional capacitors so as to enhance resolution and avoids the aliasing effect. The bandwidth is chosen with respect to the Table 1.
The material used for base of an accelerometer is a silicon wafer. The usual accelerometer consists of a spring mass system. Here the poly-silicon flexural springs are used to hang down the mass on silicon wafer base as shown in Fig. 2. This linkage offers an opposition to counter forces of acceleration. The differential capacitance is measured when the distance between mobile plates of suspended mass and independent immobile plates changes due to input displacement. The immobile plates are compelled by out-of-phase square waveform by 180°. The displacement causes change in distance between moving and fixed plates which further changes capacitance and thus the output voltage can be measured to examine the acceleration [29].
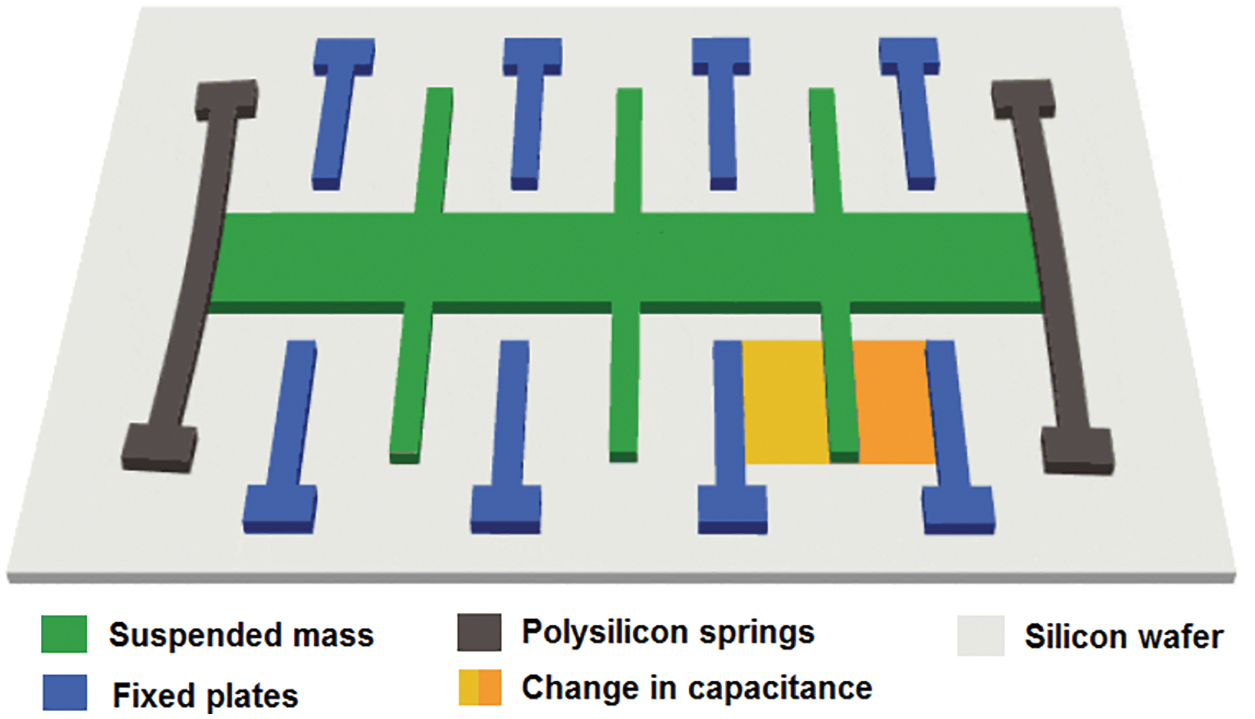
Figure 2: Mechanism used in MEMS accelerometer
2.3 Mechatronic Design for Data Acquisition
The resolution of a data acquisition system is depends on the number of bits of a microcontroller. An ‘n’ bit analog to digital conversion provides ‘2N’ resolution. The each pin Arduino ATmega2560 provides 10 bits, i.e., it has a resolution of one part in 210 which is nothing but 1024. Therefore, a 10-bit analog to digital convertor driven by maximum input of 5 volt to output the resolution of measurement into 5 volt/1024 = 0.004882813 volt = 4.88 mV. Since the output of an accelerometer is ratio-metric, hence, the output sensitivity (popularly regarded as a scaling factor or multiplication factor) differs proportionately with respect to the input voltage. For example, Vsin = 3.3 V provides the sensitivity as 330 millivolts per gravitational acceleration. The Eq. (1) is used to convert the output voltage into equivalent acceleration. As per the data sheet [29] the output voltage at ‘0’ gravitational acceleration is also considered as ratio-metric, therefore output at ‘0’ gravitational acceleration is usually assumed as half of input supply voltage. The acceleration (a) measured in m/sec2 can be calculated as:
The Fig. 3 shows mechatronic integration and connections made for mechatronic integration is described here. The accelerometer has total five ports. The first one is ‘GND’ ground to be connected to ‘GND’ of Arduino. The second is ‘VCC’ supply voltage to be connected to ‘Vin’ of Arduino. Finally, Xout, Yout and Zout is channel output for X, Y and Z axes respectively to be connected to analog ports of Arduino, i.e., A8, A9, A10, respectively. The Arduino can be powered either by USB port of a computer or by an external power source. Here Vin pin is used to power the Arduino board from USB port of a computer. The minimum rated time delay of 100 milliseconds was considered to acquire smallest change in vibration response. Fig. 4 shows a prototype of DAQ with the provision of three channels for accelerometers.
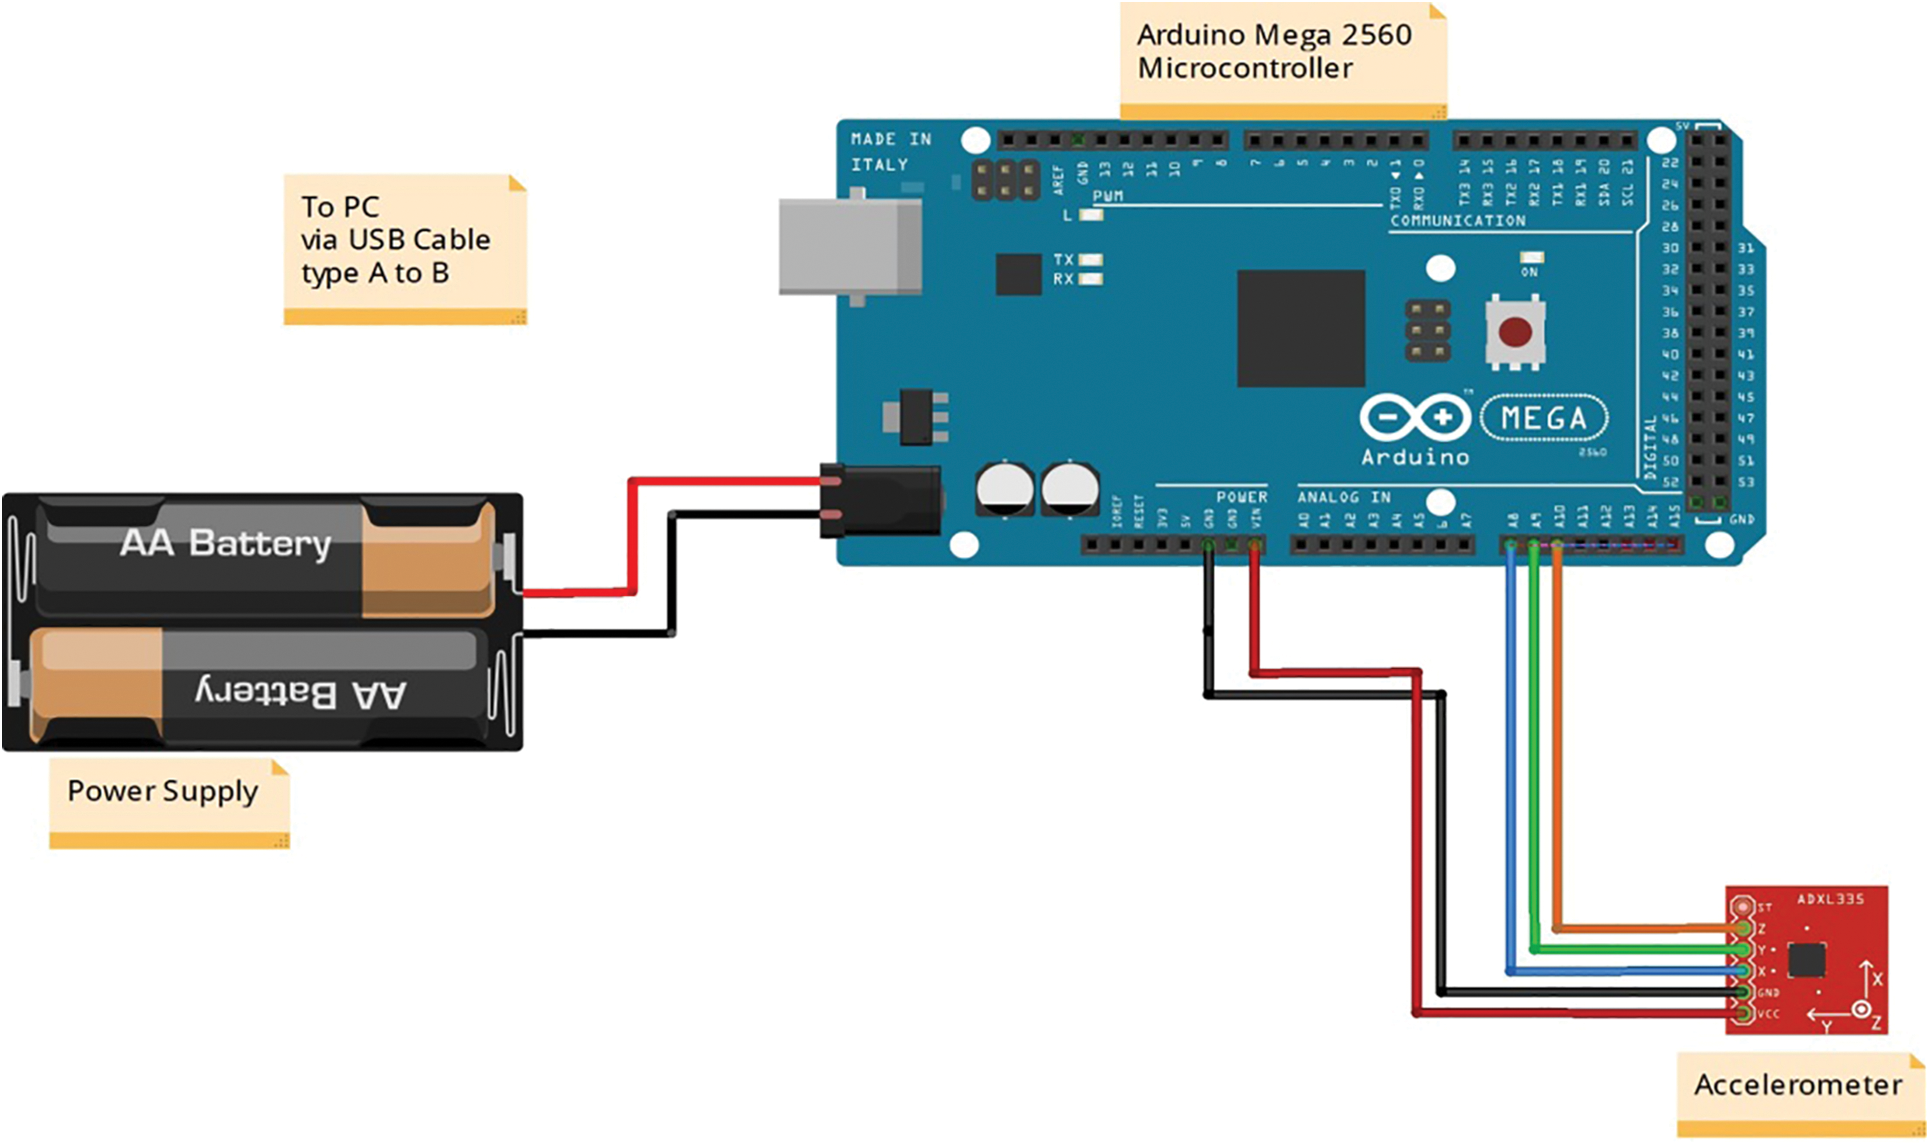
Figure 3: Mechatronic integration
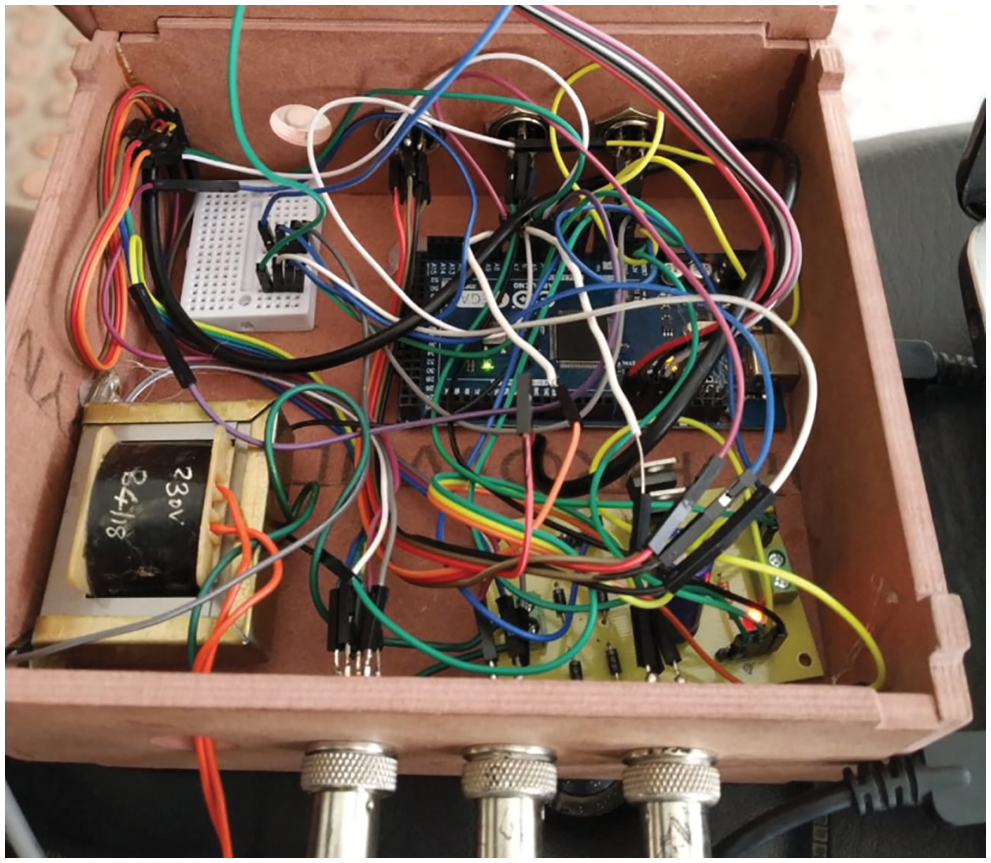
Figure 4: Prototype with three channels for accelerometer
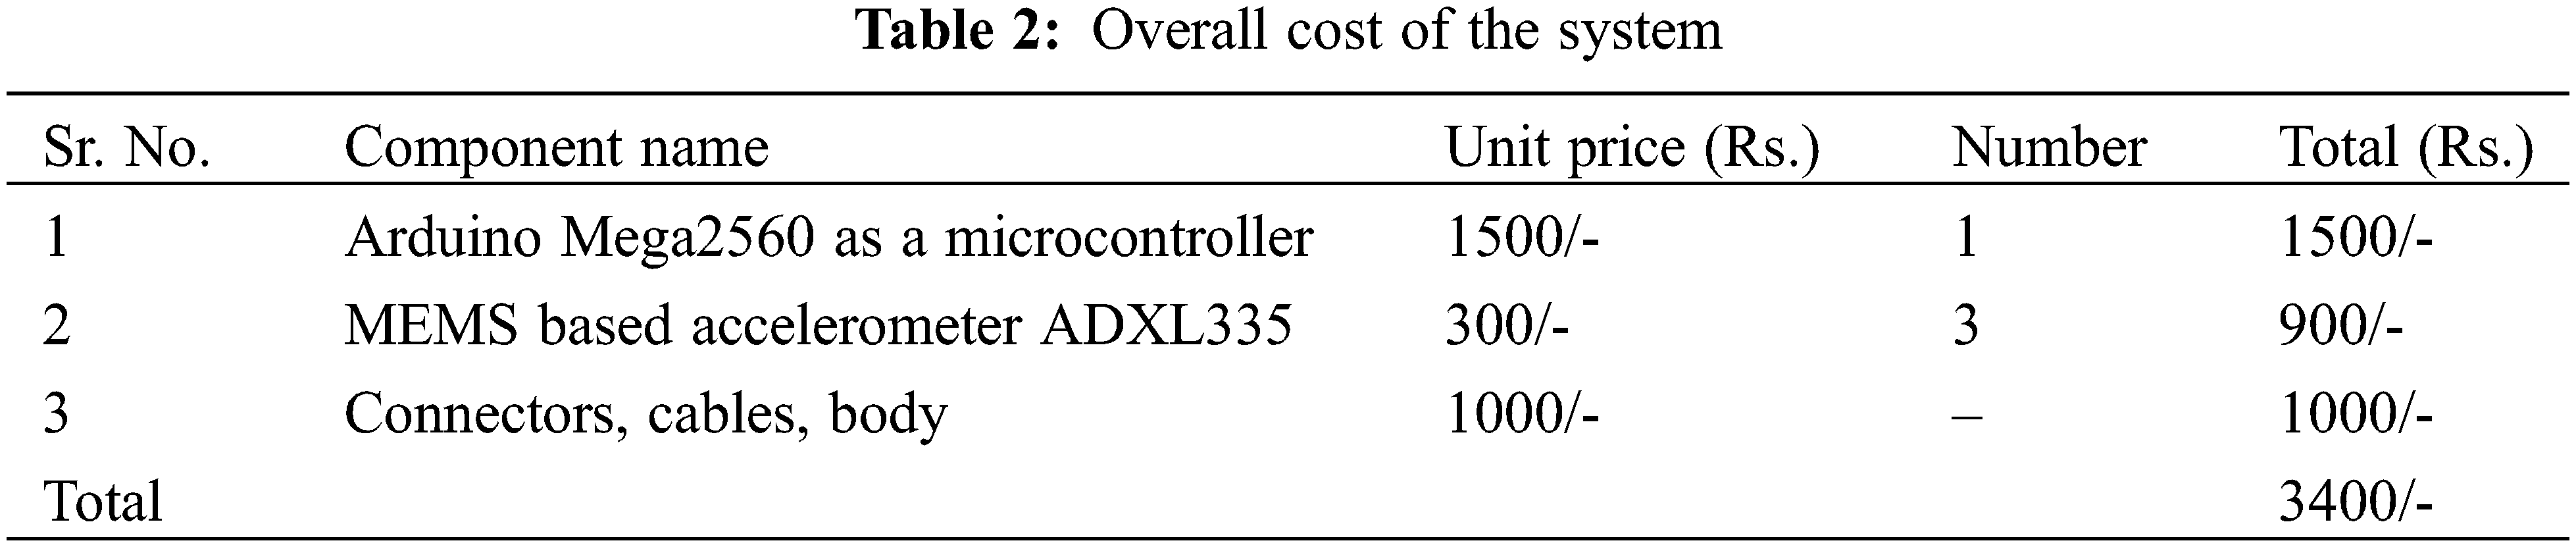
In the current research, Arduino Mega was programmed with the Arduino software Integrated Development Environment (Arduino-IDE) and communicated to Microsoft Excel to accumulate & exhibit the acquired readings. The open-source Parallax-DAQ tool is utilized to communicate data from serial monitor of Arduino to Excel. This feature can obtain data from 26 stations simultaneously from any Parallax micro-controllers and saves into the columns. It offers easy analysis of the huge data composed in, experimental analysis for real-time condition monitoring intended for fault diagnosis. The overall cost of system is Rs. 3400/-. The Table 2 shows the details:
The new two wheeled vehicle ‘Honda CB-Shine’ completed just 3500 km running within six months was selected for experimentation. A model number engraved on the outer side provide specifications of the tyre. The Fig. 5 shows the tyre of make ‘MRF Zapper FS’ with ‘80/100 R18’ model number. The number ‘80’ indicates the width of the tyre’s cross section in millimeters; the aspect ratio of the sidewall height to the cross section width is ‘100’. This letter ‘R’ specifies radial construction. The number ‘18’ indicates the diameter of the wheel expressed in inches [30]. A radial tyre offers a good fuel economy, comfort and is popularly used in two wheeled vehicles, hence being selected here for this study.
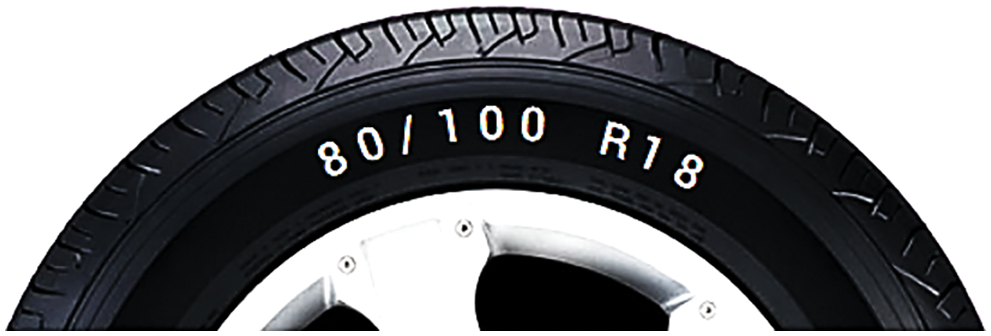
Figure 5: The tyre model ‘80/100 R18’
The scope of this experimentation is:
• Tyre pressure interpretation using wheel hub vibrations response
• Study of vibration response using statistical approach
• Classification using ML algorithms
• Developing and implementing real time tyre pressure supervision system using machine learning approach
The Fig. 6 shows the experimental setup. An accelerometer was mounted on each front and rear axle’s hubs with the help of adhesive to be held securely as shown in Fig. 7. For various pressure conditions, the change in response of wheel hub vibration with respect to time was collected. The profile selected for experimentation was a plane road throughout. Since this approach is applied for first time, road with irregular profile was not considered. The testing was carried out with two persons with average weight of around 80 kg; one was driving and another one was accompanying the driver. The load acting on vehicle is important factor for monitoring tyre pressure and hence obviously affects the pressure if it more than rated load. But since the road profile was plane, the vibration will evolve only when there would be less pressure in the tyre and it will not get affected due to load. Moreover, two persons with average weight of around 80 kg were selected. If load acting on vehicle is less than above specified, there will not be significant change in the model. If it is more than that, it may affect the tyre pressure. The experimentation was carried out for roughly 2 minutes so as complete the defined road track.
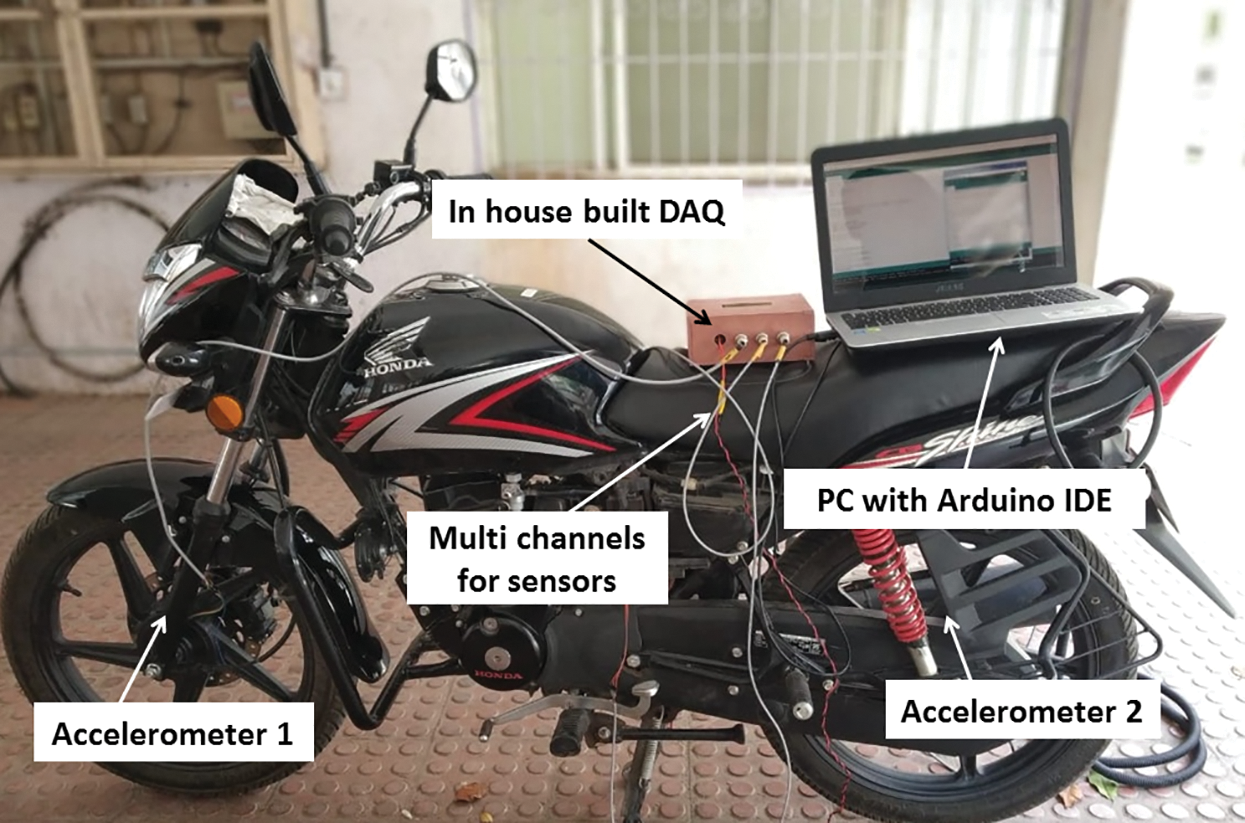
Figure 6: Experimental setup
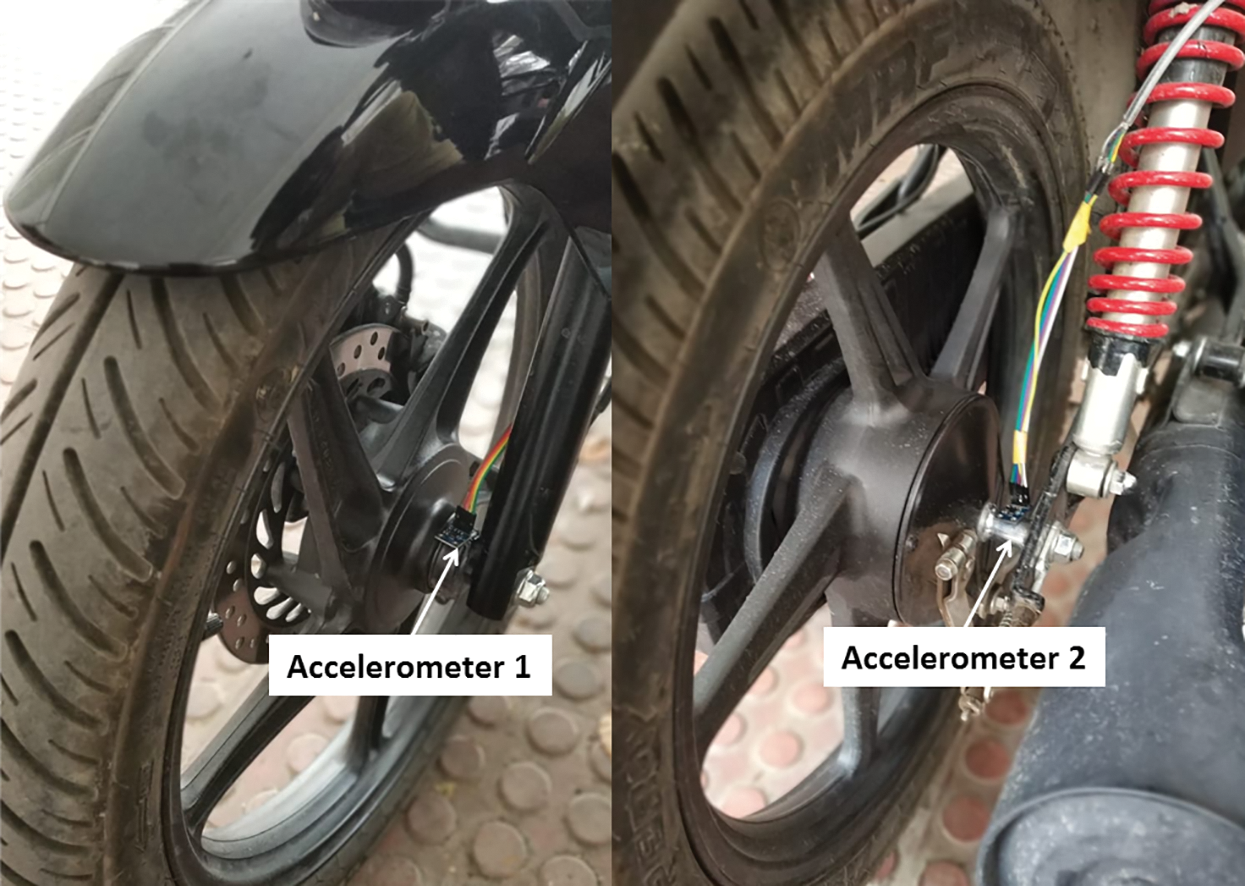
Figure 7: Positioning of accelerometers
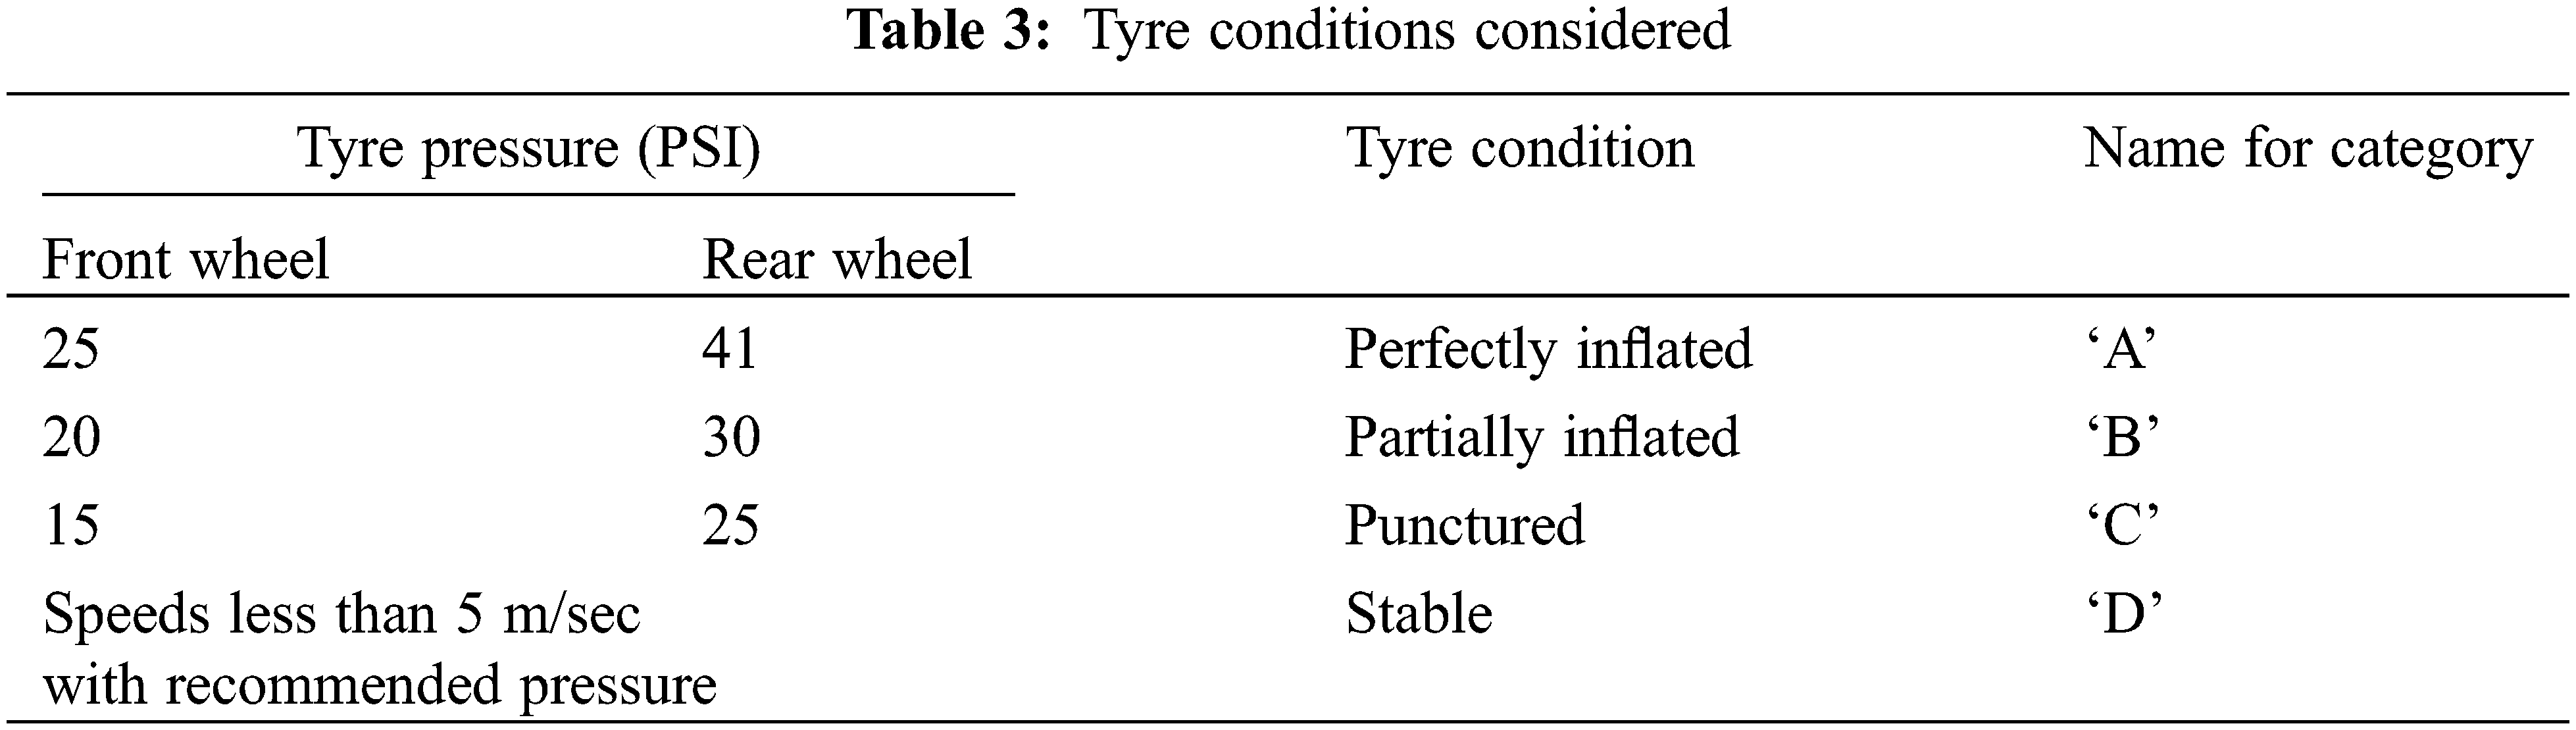
The speed of vehicle was ensured not to exceed 15 m/sec. The recommended tyre pressure for this model (Rider & Pillion) is 25 PSI and 41 PSI for front and rear wheels respectively. This was considered as defect free condition (perfectly inflated tyre), i.e., ‘A’. The pressure at 20 PSI and 30 PSI for front and rear wheels was considered as partial defect condition (partially inflated tyre), i.e., ‘B’. The pressure rate below 15 and 25 PSI respectively was considered to be defective condition (Punctured tyre), i.e., ‘C’. It is observed that the speeds less than 5 m/sec with recommended tyre pressure did not show the adequate response in acceleration hence it was categorized as the stable condition, i.e., ‘D’. Table 3 shows the typical tyre conditions considered for the experimentation.
The normal driving with speed within the specified range was adopted for the testing. The testing for all conditions stated above was conducted. The change in response of acceleration (g) with respect to time (sec) for rear wheel is represented by Figs. 8a–8d. The similar kind of response was also observed for front wheel also. It is observed that the Z axis of the accelerometer is highly responsive to the hub vibrations as compared to X and Y direction. The substantial change in amplitude can be seen for all 4 conditions. The analysis of this data using ML approach is explained in next section.
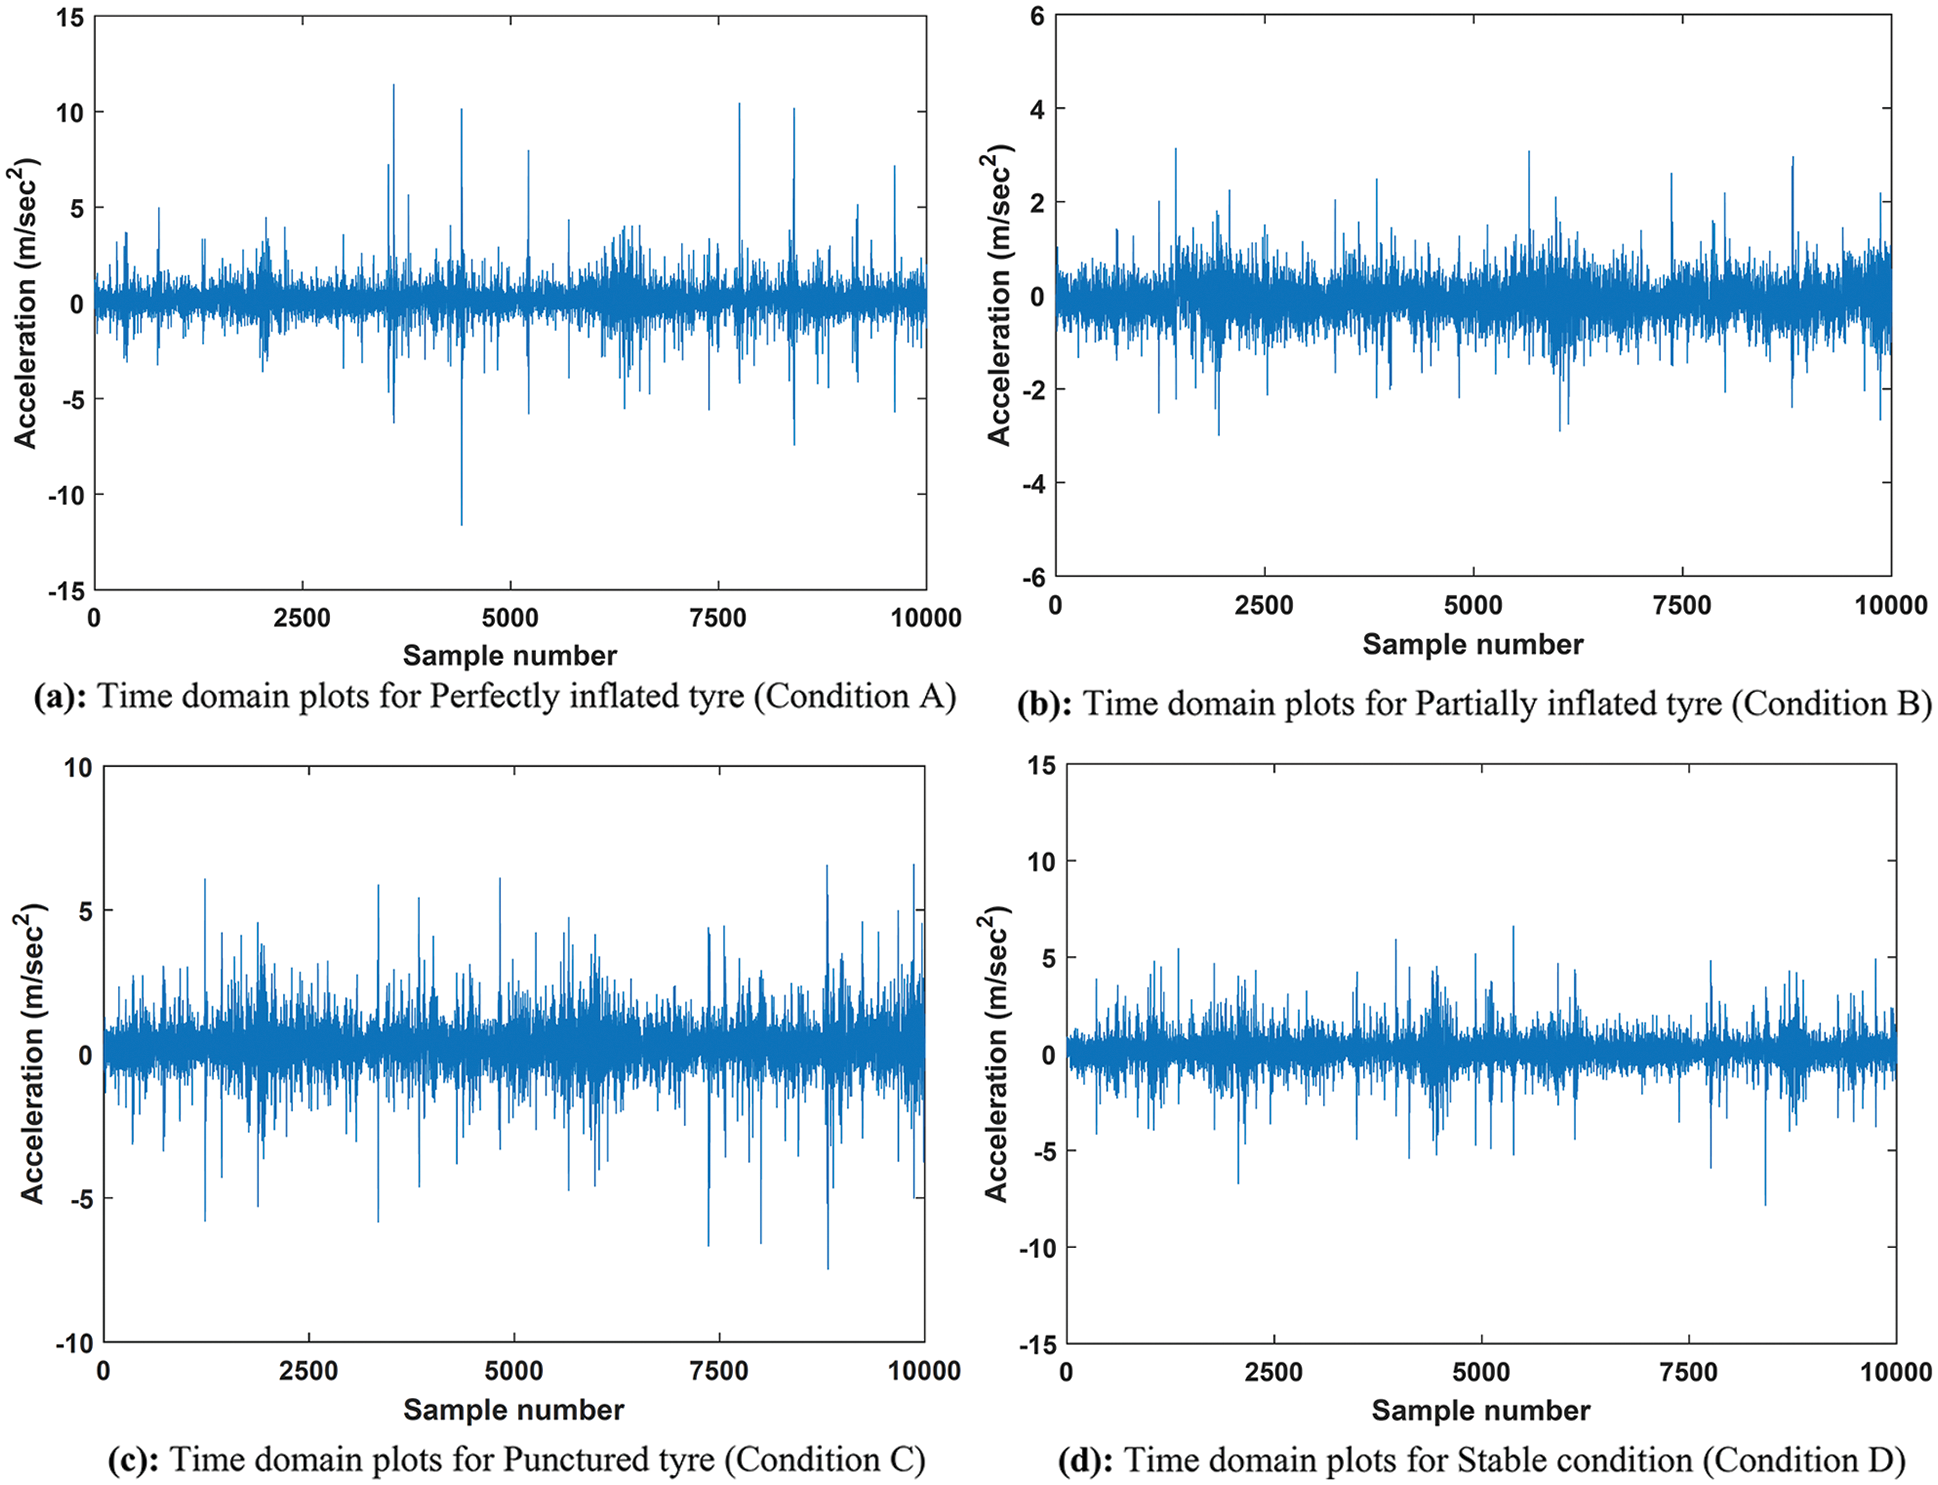
Figure 8: (a) Time domain plots for perfectly inflated tyre (Condition A), (b) Time domain plots for partially inflated tyre (Condition B), (c) Time domain plots for punctured tyre (Condition C), (d) Time domain plots for stable condition (Condition D)
4 Data Analysis Using Machine Learning Scheme
The time domain plots exhibits the change in the vibration response with respect to time. The substantial change in amplitude was shown for all 4 conditions but alone may not be useful for accurate categorization of tyre conditions. Hence statistical data analysis is essential step to perceive more information from the vibration response. This has to be followed by separation of distinct statistical attributes according to the tyre conditions so as to classification rule sets can be developed. The machine learning algorithms are most suitable for development of such rule sets. Hence this framework was adopted for current investigation and explained stepwise in further subsections.
It was observed that the acquisition of vibration response of each case reflected near about 20,000 data points. The sampling was incorporated to create multiple testers out of the complete response. It was re-organized in such a way that the each tester comprises of near about 1024 data points. In the current investigation total 80 testers were used (i.e., 20 testers for each case * 4 case = 80 testers) for each front and rear wheel conditions. As stated earlier that this data has to be summarized in form of descriptive statistics, the statistical attributes were mined for each tester. The attributes are nothing but the indicative statistical parameters of particular condition. The vibration response with respect to time can be read by
• Range
• Summation
• Minimum
• Standard error
• Maximum
• Count
• Mean
• Variation
• Skewness
• Mode
• Median
• Standard deviation
• Kurtosis
The event-driven program was designed and implemented in Microsoft Excel for data mining. This makes the attribute extraction process easier and consumes significantly less time. As result of attribute extraction, each tester was represented by thirteen attributes.
In intention with the condition wise classification, the attribute which differs from each other must be selected and similar attributes are to be eliminated. Hence in the second step, significant attributes are selected using decision tree. This reduces number of the attributes participating training the data and hence time required for building the model. Here altogether thirteen attributes are supplied to J48 decision tree selector and created tree is presented in Fig. 9.
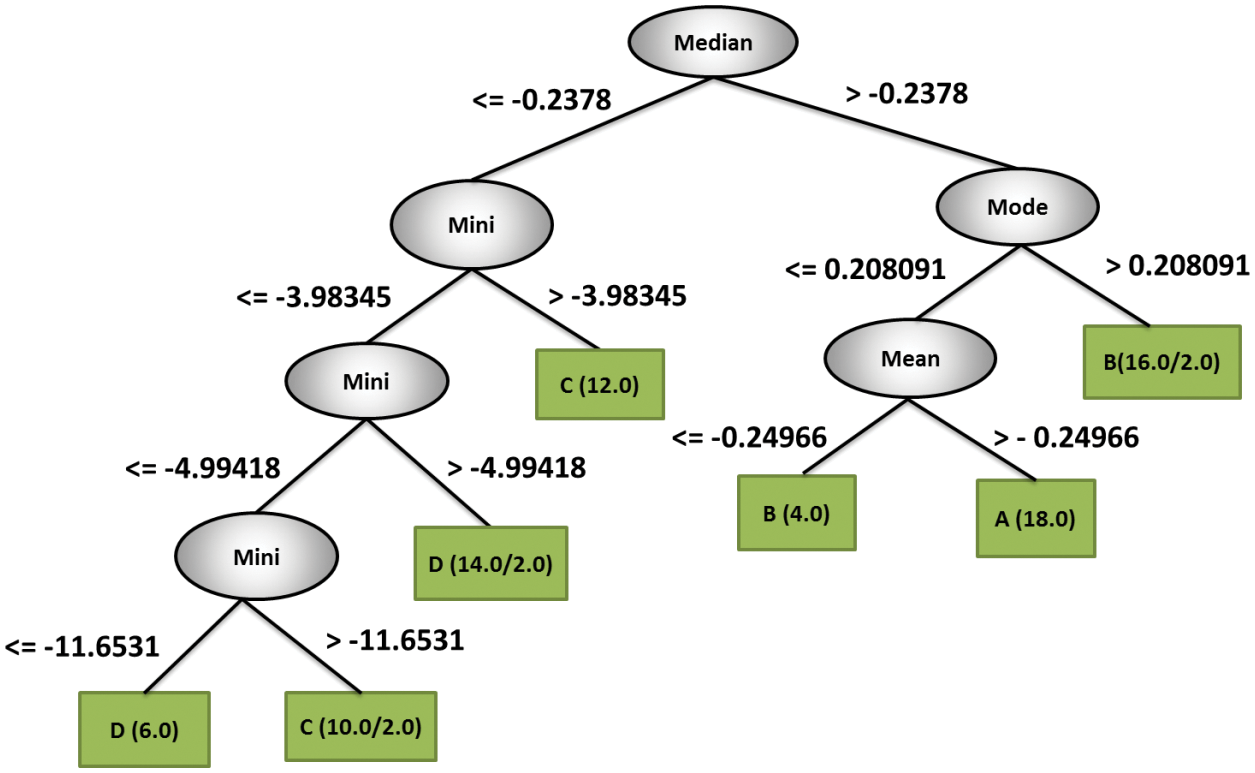
Figure 9: Feature selection using decision tree
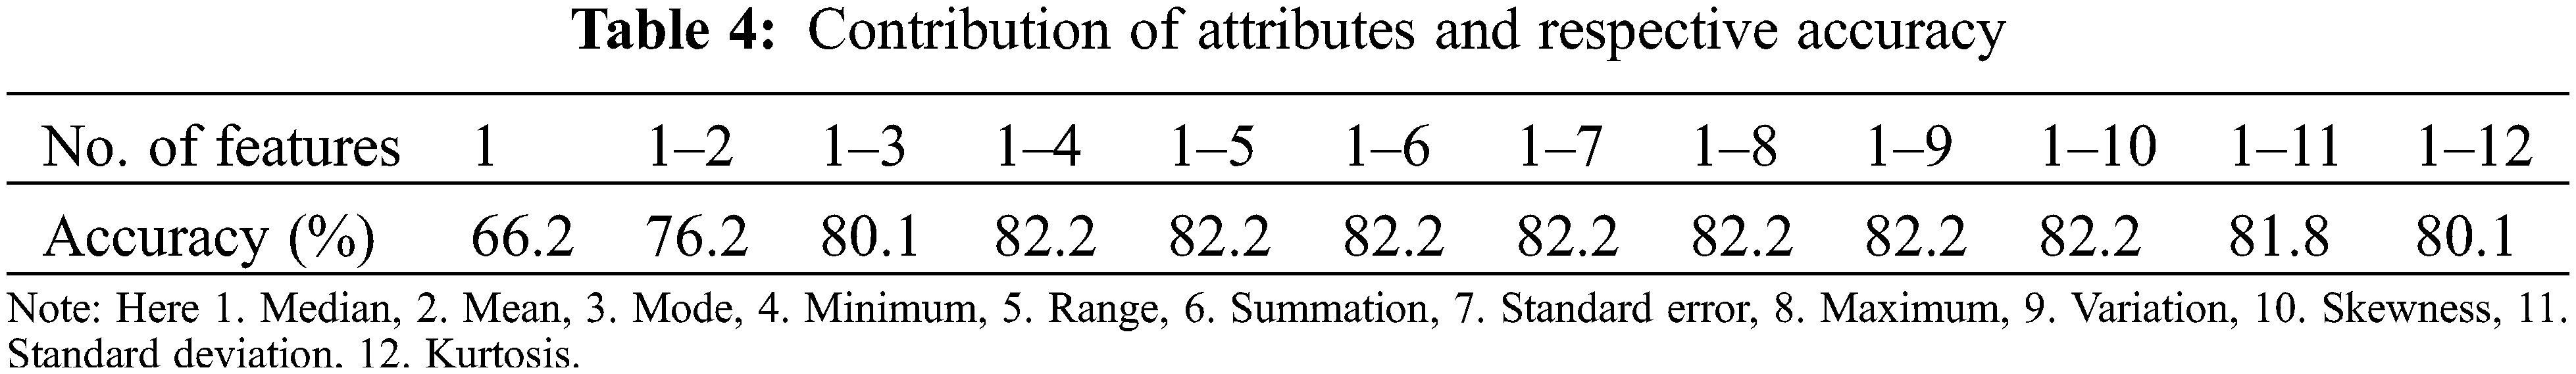
It can be perceived that only 4 attributes, i.e., median, mode, mean and minimum value selected by J48 tree considered to be noteworthy. The rule sets are self-explanatory. If the ‘median’ is greater than –0.2378, the attribute is classified as ‘mode’. If ‘mode’ is less than or equal to 0.208091, attribute is classified as ‘mean’. If ‘mean’ less than or equal to –0.24966, the class is categorized as ‘B’ for 4 samples. With the same linage, on the other hand ‘mean’ more than or equal to –0.24966, the class is categorized as ‘A’ for 18 samples. In the similar way, other classes are also categorized. Hence these four attributes were only used further for the categorization. The approach of considering different number of attributes affects the classification accuracy. The Table 4 shows the effect of number of feature on classification accuracy and found to have similar results as of decision tree. When only 4 features considered, the accuracy is maximum as familiar to decision tree. When only 4 features considered, the accuracy is maximum as familiar to decision tree. When only 4 features considered, the accuracy is maximum as familiar to decision tree.
The classification in terms of machine learning is defined as ‘a supervised learning approach’. The input data is used to train the mathematical rule based codes and then trained rules are used to classify new conditions. The machine learning algorithms is the most competent tool for the categorization of different conditions. Hence two tree family based algorithms, i.e., hoeffding tree & random forest tree were employed for attribute classification. The statistically mined data with significant attributes choose from decision tree was supplied to the classifiers.
A Hoeffding classifier is trains the huge in an incremental approach. It is based on presumption that the delivery producing instances do not vary with respect to time. It believes that fact a minor sample may frequently be sufficient to select an optimum feature for classification. This principle is justified arithmetically using Hoeffding portion, which enumerates the quantity of cases required to evaluate certain information inside a set. This approach was originally designed to trace web-click flow and estimate prediction of the next one. The main advantage of hoeffding classifier is that the training of data is possible with lesser number of samples. Because it is sufficient to select optimum separation attributes [31]. The Eq. (2) used to decide minimum number of samples required for separation of node.
where ‘R’ is range of random variable r, ‘n’ is independent observations, mean computed from sample minus ravg, true mean of r is at least ravg minus ε, with probability 1 –
The algorithm develops associations of multiple decision trees followed by the integration with one another with an intention to achieve enhanced, stable and honest prediction estimate. The Fig. 10 shows the principle of working. It uses classification and regression both hence regarded as collective method. Due to addition of the extra randomness while development of tree like pattern, the training of model becomes healthy. The important feature is that it identifies the most noteworthy feature between random subdivisions rather than while splitting the node. This expansive assortment develops the superior model. Here, first step is the creation of multiple subdivisions of dataset and develop corresponding decision trees simultaneously. The Fig. 10 is self-explanatory; ‘n’ number of subdivisions will have ‘n’ number of decision trees. The concluding step is to find mean of all analysis [33].
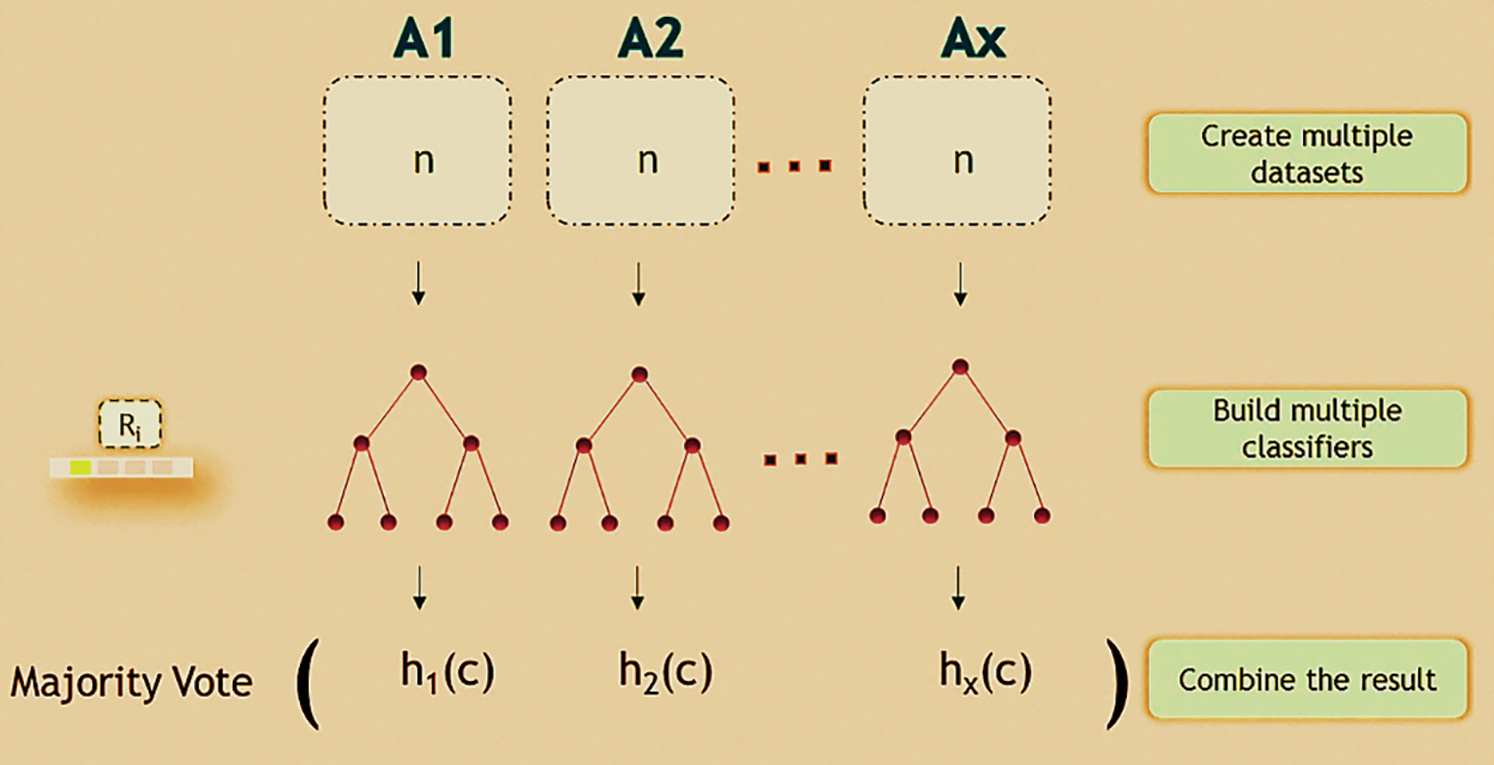
Figure 10: Principle of working of random forest classifier
The random forest is very popular for its unparalleled accurate performance amongst other algorithms. It performs well for larger data sets and able to analyze several input attributes without any loss. It also determines the significant attributes for perfect classification. As the forest construction grows, it estimates an internal unbiased for generalization error. It retains the accuracy of model wherein a data with larger proportion is missing. This is achieved by estimating the missing data. It also facilitates the balancing of the error in unbalanced sets. It calculates relationships between sets which can be utilized for assembly, tracing outliers and scaling. All these competences of random forest algorithm can be extended for analyzing unlabeled data sets to drive unsupervised learning [34].
In this section, the result of classification of different tyre conditions is explained with the help of detailed class-wise accuracy and validation is explained with the help of confusion matrix.
5.1 Detailed Class-Wise Accuracy
The detailed accuracy is elaborated using various terms like Precision, False Positive, Receiver Operating Characteristics (ROC) area, True Positive, Recall.
• The true positive indicates how correctly the trained data estimates prediction of the true label
• The false positive indicates how wrongly the trained data estimates prediction of the true label
• The Matthews correlation coefficient (MCC) indicates the quality of binary classifications
• The precision indicates the % of correctly classified results among the reclaimed ones
• The Recall indicates the % of total relevant results correctly categorized
• The F measure indicates the weighted harmonic mean of precision and recall
• The Receiver Operating Characteristics (ROC) area indicates in general quality of the classifiers. It is a graph of TP portion (i.e., sensitivity) on x axis and FP portion (i.e., 1 – specificity) on Y axis
• The Precision Recall Curve (PRC) area is a graph of precision on X axis and recall on Y axis
The parameters mentioned above are considered while examining performance of the classifiers. The detailed performance of classification for hoeffding tree (front and rear wheel) and random forest tree (front and rear wheel) is stated here.
The detailed performance of classification for hoeffding tree (front and rear wheel) and random forest tree (front and rear wheel) is stated below.
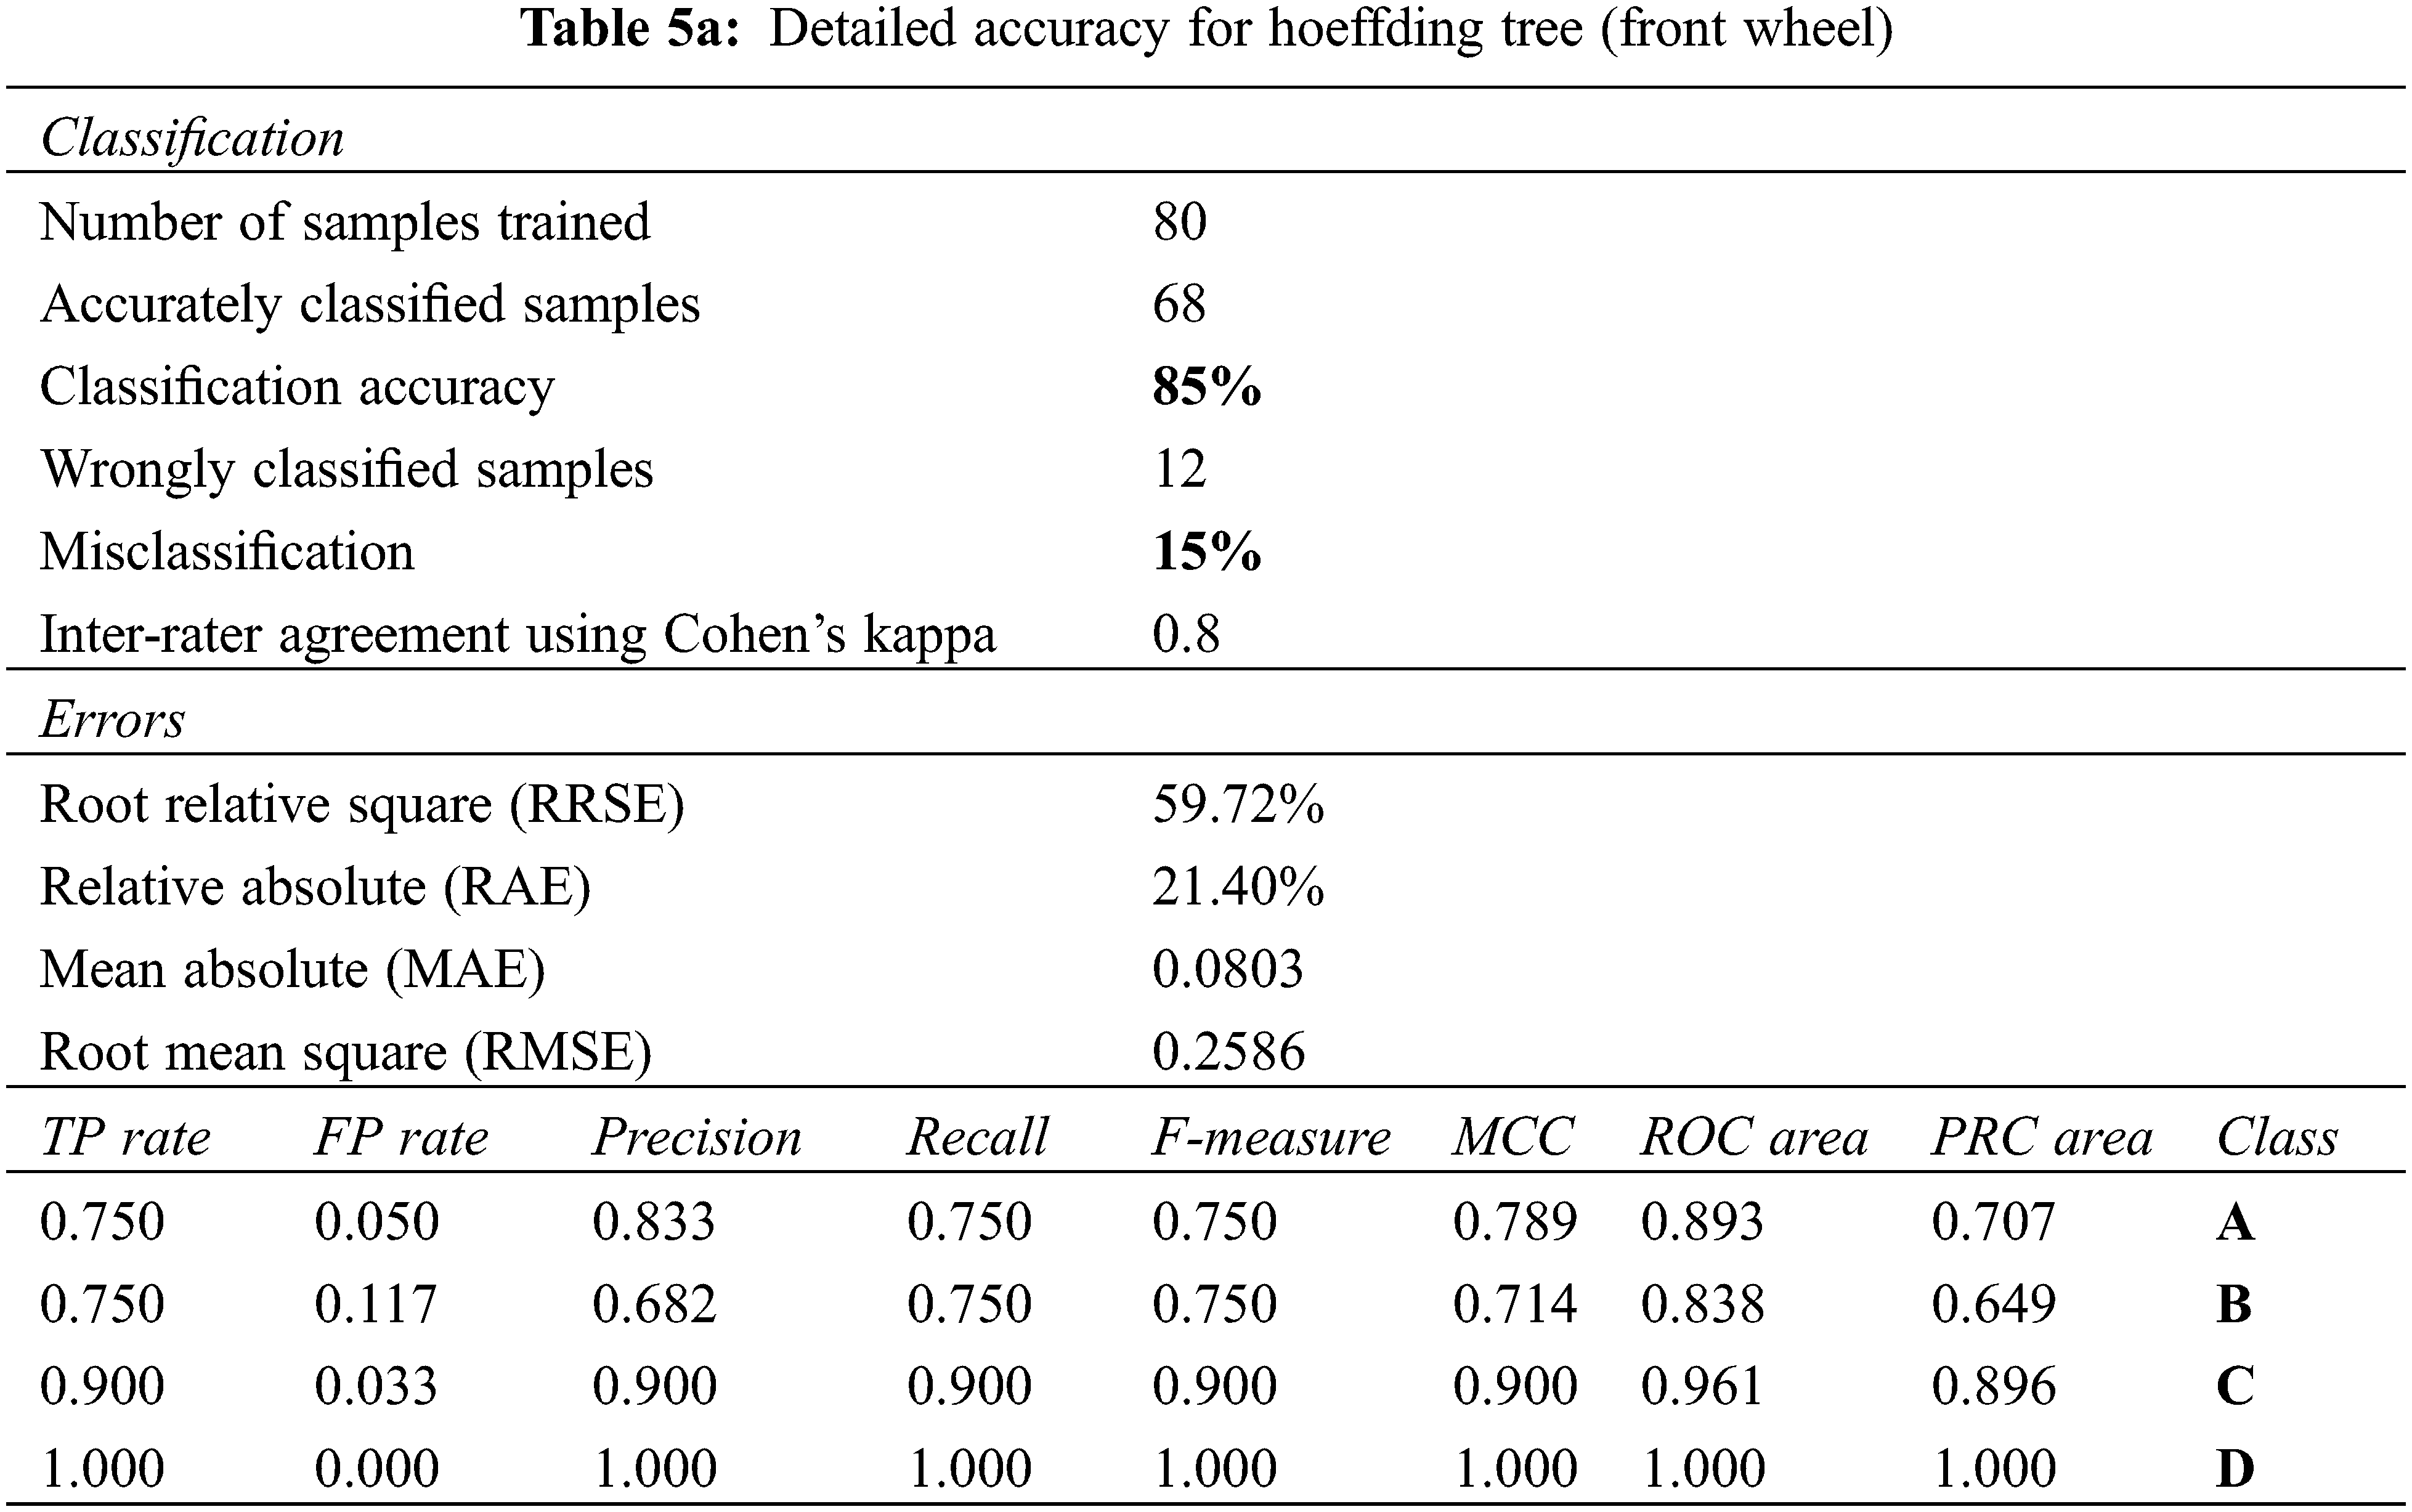
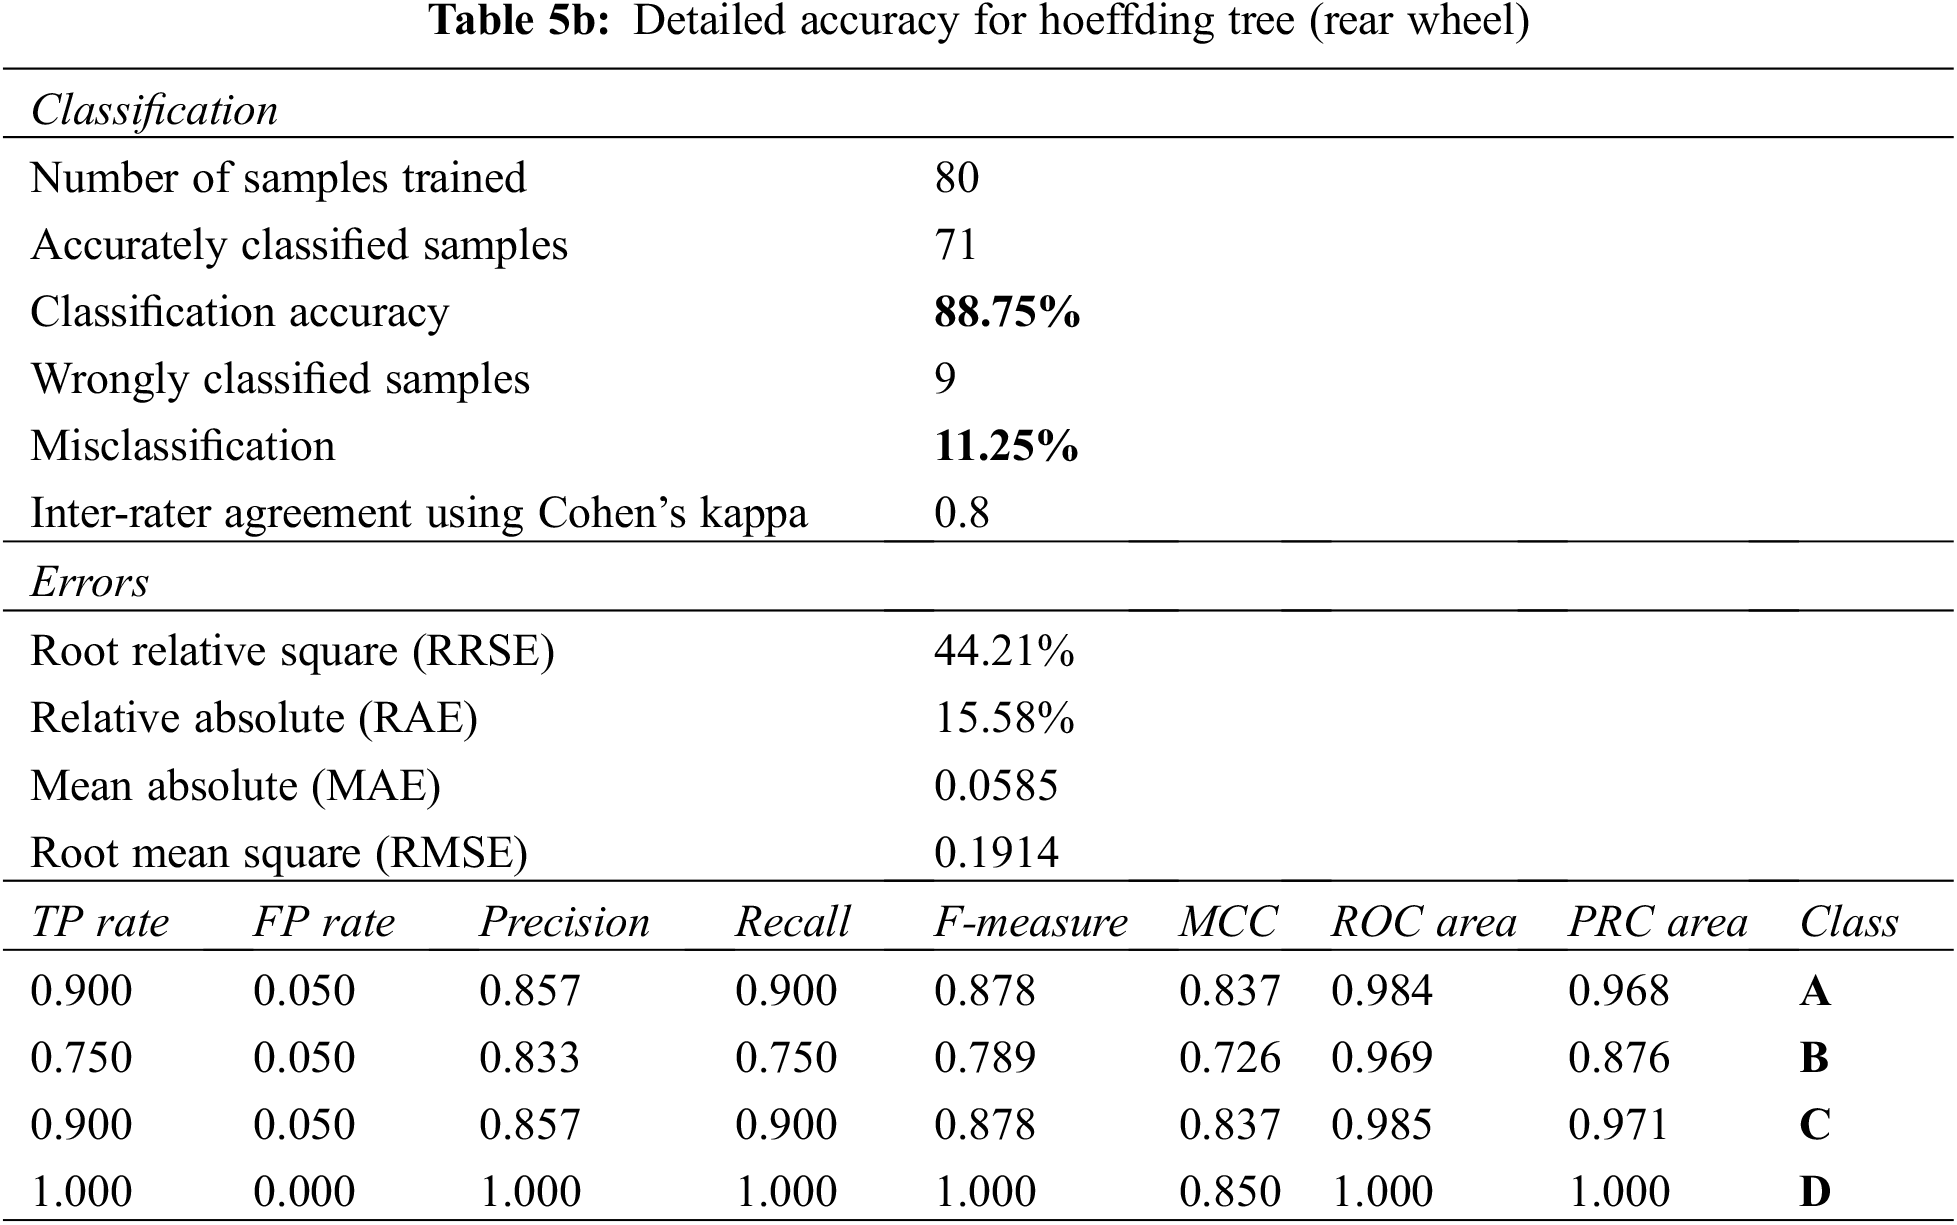
The accuracy in terms of all these parameters (front & rear wheel conditions) using hoeffding tree and random forest tree is shown in Tables 5a–5d, respectively. The detailed accuracy for front wheel using hoeffding tree is stated here. The properly classified instances are 68 and imperfectly are 12 out of 80, i.e., 85% and 15%, respectively. The mean absolute error is 0.0803. Root mean square error is 0.2586. Percentage relative absolute error is 21.40. Percentage root relative squared error is 59.72. The class-wise detailed accuracy is given in Table 5. The weighted average of TP rate is 0.850, FP rate is 0.050, precision is 0.854, recall is 0.850, F-measure is 0.851, MCC is 0.802, ROC area is 0.923, and PRC area is 0.813. Similarly Tables 5b–5d show detailed accuracy for remaining cases and is self-explanatory.


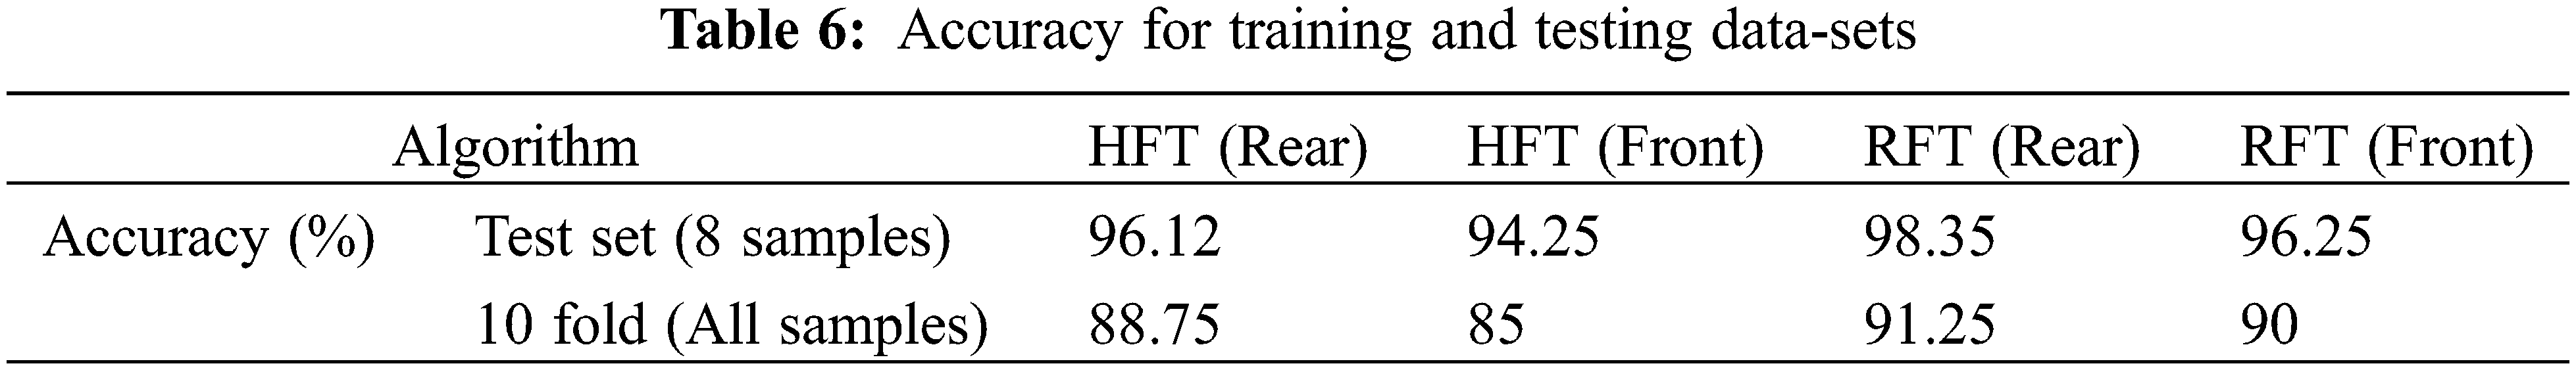
5.2 Classification Based on Training and Testing Data-Sets
The classification based on training and testing data is stated first. The total data is split into two parts with ratio of 60–40% and comparison is presented in Table 6.
5.3 Validation of the Classification
The validity of the experimentation based on ‘k’ cross validation tool to obtain a classification matrix is demonstrated here. The test data is divided into 10 folds and compared with trained data. Tables 7 and 8 shows the classification matrix using for the Hoeffding tree and random forest tree respectively. Table 7a demonstrations the matrix for front wheel using Hoeffding tree yielding accuracy of 85%. It is observed from classification matrix for condition ‘A’, 15/20 testers were properly classified as ‘defect free’ and 5/20 tester was imperfectly classified as ‘B’. For condition ‘B’, 15/20 testers were properly classified as ‘B’, 3/20 tester was imperfectly classified as ‘A’ and 2/20 as ‘C’. For condition ‘C’, 18/20 was properly classified as ‘C’ and 2/20 tester was imperfectly classified as ‘B’. Lastly for condition ‘D’, all 20/20 testers were properly classified. Similarly other classification matrices can be understood.
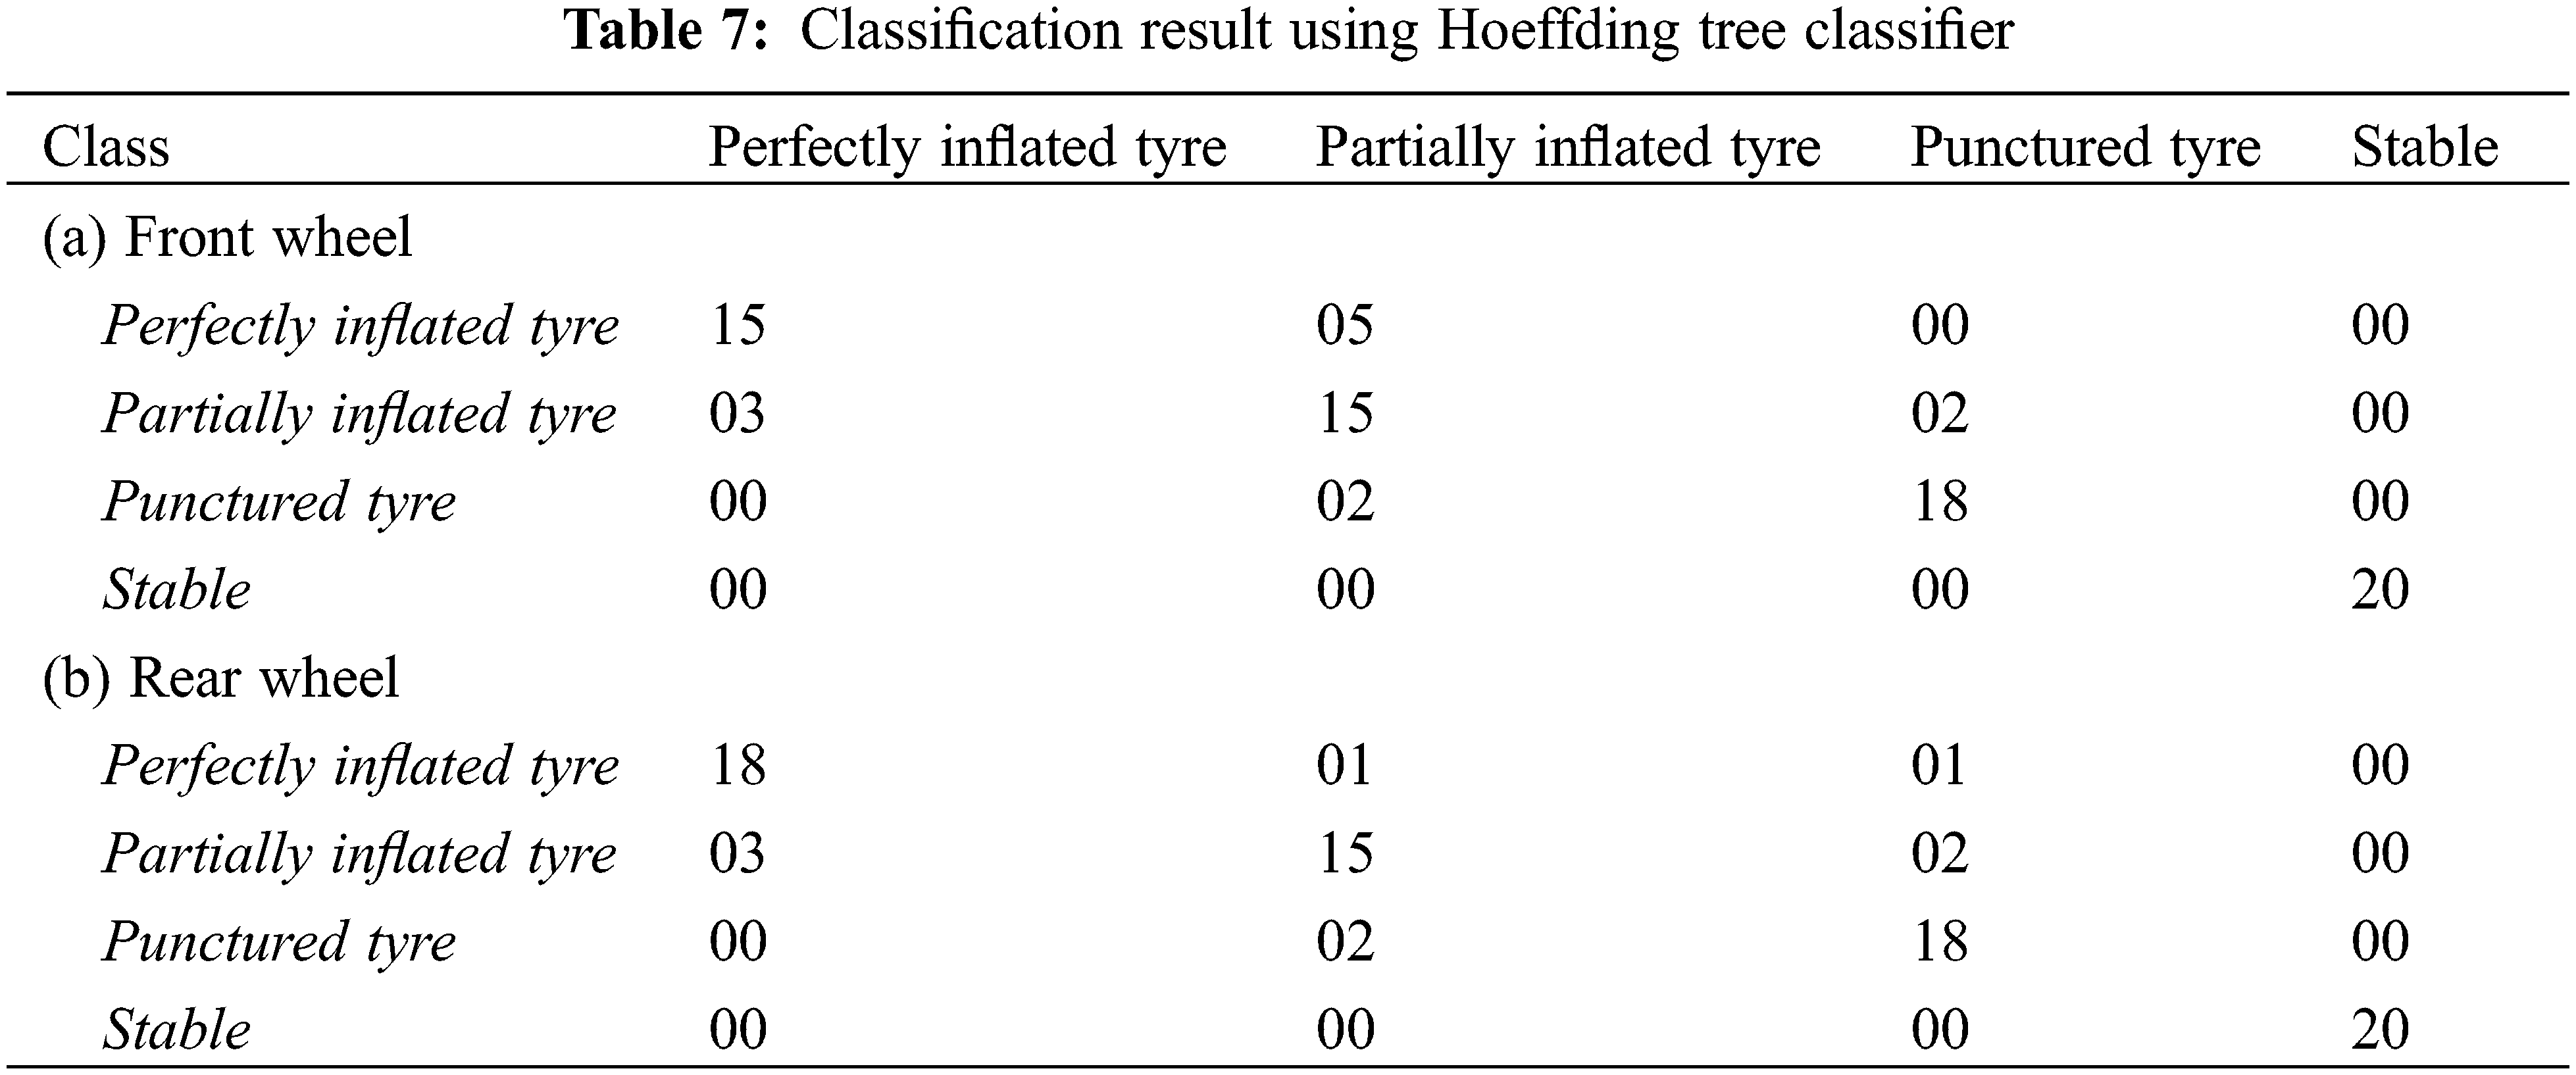
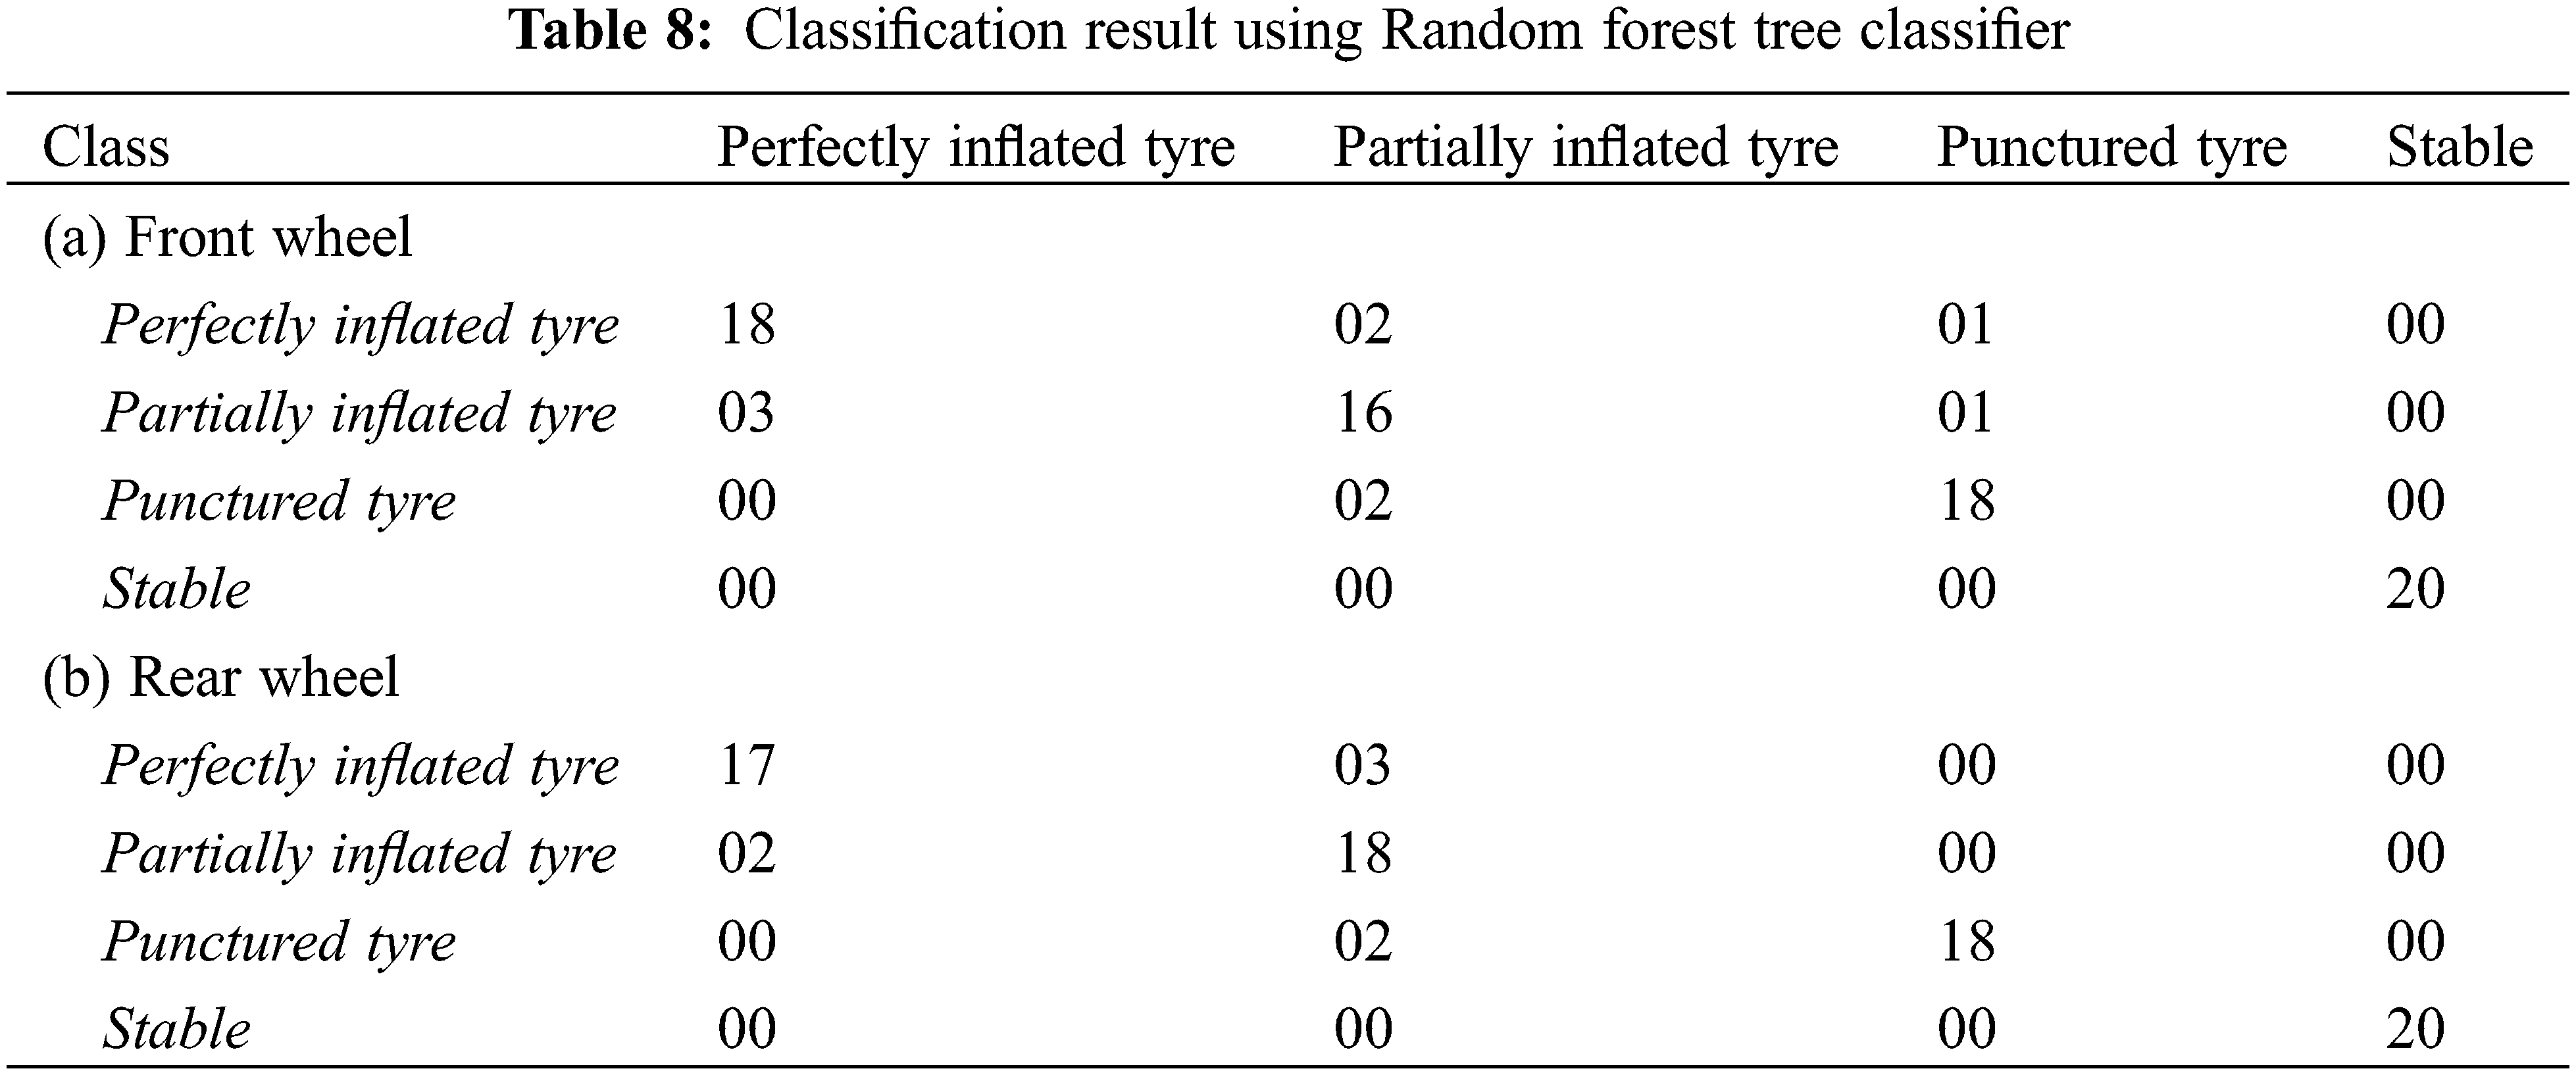
Fig. 11 shows classification accuracy for both the classifiers and comparative illustration. It can be easily learnt that the both the classifiers performs well and scores more than 85% accuracy for both wheels. The random forest classifier performs the best as it yielded accuracy 90% and above as compare to the hoeffding tree. This shows that the algorithms selected for this application are well suitable for classifying hub vibration relating to corresponding tyre condition.
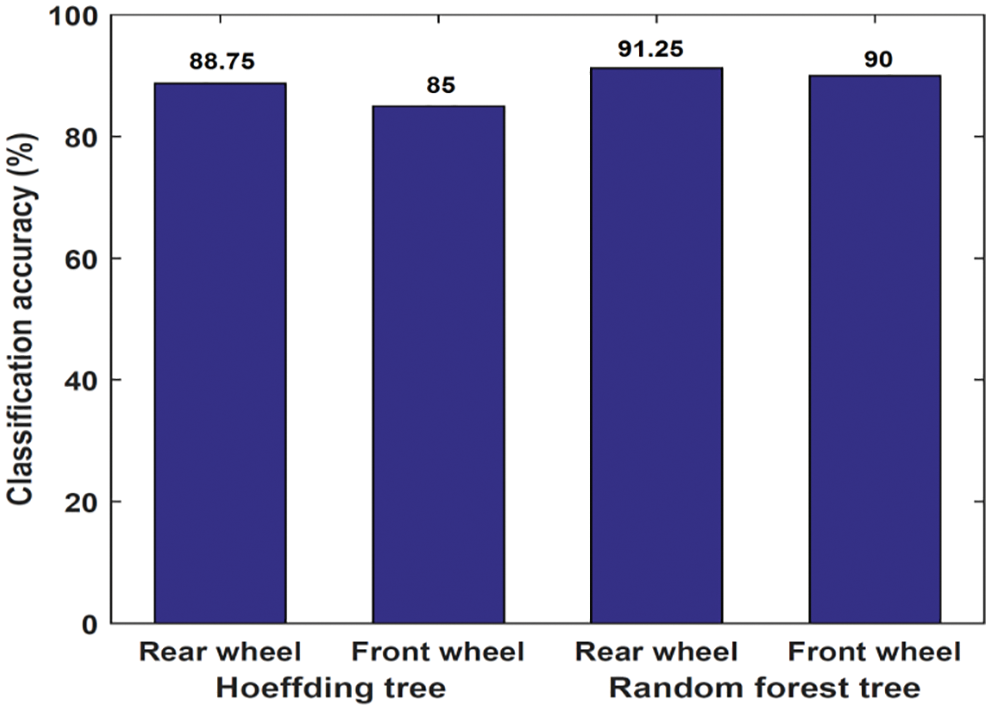
Figure 11: Comparative illustration for classification accuracy
The in-house designed DAQ applied for supervising tyre pressure of two wheeled vehicle and experimental assessment using machine learning scheme is successfully demonstrated. The classification using Hoeffding tree classifier yielded accuracy of 88.75% and 85% for rear and front wheel respectively. The classification using random forest tree classifier yielded accuracy of 91.25% and 90.00% for rear and front wheel respectively. Therefore vibration based monitoring using machine learning scheme is found suitable and capable of classifying tyre pressure condition. Further, for future analysis, the various levels of load acting on vehicle, tyre pressure and road conditions can be considered while acquiring the data and generalized model can be designed. The clear distinction of tyre pressure condition using ML scheme would be implemented for on-board prediction of punctured condition and users can get relieved from irritation and waste of time. The incorporation of SD card with Arduino would eliminate use of computer so as to acquire real time data directly. For on-board implementation, trained rubrics (in form of a condition based algorithm) can be saved in SD card. This would facilitate simultaneous comparison of real time data with trained rubrics to predict the tyre condition. The framework can act even smarter by integrating it with Internet of Things (IoT).
Acknowledgement: The authors would like to thank the College of Engineering Pune for providing the opportunity to carry out experimentation at the Department of Mechanical Engineering.
Funding Statement: The authors received no specific funding for this study.
Conflicts of Interest: The authors declare that they have no conflicts of interest to report regarding the present study.
References
1. MacIsacc, J. D., Garott, W. R. (2002). Preliminary findings of the effect of tire inflation pressure on the peak and slide coefficients of friction. National Highway Traffic Safety Administration, US Department of Transportation, DOT-HS-809428. https://www.nhtsa.gov/DOT/NHTSA/NRD/Multimedia. [Google Scholar]
2. Velupillai, S., Guvenc, L. (2007). Tire pressure monitoring. IEEE Control Systems Magazine, 27(6), 22–25. DOI 10.1109/MCS.2007.909477. [Google Scholar] [CrossRef]
3. Varghese, A. (2013). Influence of tyre inflation pressure on fuel consumption: Vehicle handling and ride quality simulation and modelling (Master’s Thesis). Division of Vehicle Engineering and Autonomous Systems Vehicle Dynamics Group, Chalmers University of Technology Goteborg, Sweden. https://odr.chalmers.se/handle/20.500.12380/193515. [Google Scholar]
4. Kubba, A. E., Jiang, K. (2014). A comprehensive study on technologies of tyre monitoring systems and possible energy solutions. Sensors, 14(6), 10306–10345. DOI 10.3390/s140610306. [Google Scholar] [CrossRef]
5. Hamed, M., Tesfa, B., Gu, F., Ball, A. (2015). Effects of tire pressure on vehicle suspension performance. International Letters of Chemistry, Physics and Astronomy, 55, 102–111. DOI 10.18052/www.scipress.com/ILCPA.55.102. [Google Scholar] [CrossRef]
6. Elfasakhany, A. (2019). Tire pressure checking framework: A review study. Reliability Engineering and Resilience, 1(1), 12–28. [Google Scholar]
7. Muhammad, A. (2019). Technical review: Indirect tire pressure monitoring systems and tire vibrations. Tire Science and Technology, 47(2), 102–117. DOI 10.2346/tire.18.460403. [Google Scholar] [CrossRef]
8. Isermann, R., Wesemeier, D. (2009). Indirect vehicle tire pressure monitoring with wheel and suspension sensors. IFAC Proceedings Volumes, 42(8), 917–922. DOI 10.3182/20090630-4-ES-2003.00151. [Google Scholar] [CrossRef]
9. Caban, J., Drozdziel, P., Barta, D., Liscak, S. (2014). Vehicle tire pressure monitoring systems. Diagnostyka, 15(3), 11–14. [Google Scholar]
10. Zhu, B., Han, J., Zhao, J. (2019). Tire-pressure identification using intelligent tire with three-axis accelerometer. Sensors, 19(2560), 2560. DOI 10.3390/s19112560. [Google Scholar] [CrossRef]
11. Wei, C., Zhou, W., Wang, Q., Xia, X., Li, X. (2012). TPMS (tire-pressure monitoring system) sensors: Monolithic integration of surface-micro-machined piezo-resistive pressure sensor and self-testable accelerometer. Microelectronic Engineering, 91(4), 167–173. DOI 10.1016/j.mee.2011.10.001. [Google Scholar] [CrossRef]
12. Huang, Y., Sung, W., Lai, W., Liu, C. H., Fang, W. (2013). Design and implementation of time-delay switch triggered by inertia load. 2013 IEEE 26th International Conference on Micro Electro Mechanical Systems (MEMSpp. 729–732. [Google Scholar]
13. Egaji, O. A., Salem, C., Brown, D. (2019). An innovative decision rule approach to tyre pressure monitoring. Expert Systems with Applications, 124(3), 252–270. DOI 10.1016/j.eswa.2019.01.051. [Google Scholar] [CrossRef]
14. Yunta, J., Garcia-Pozuelo, D., Diaz, V., Olatunbosun, O. (2018). A strain-based method to detect tires’ loss of grip and estimate lateral friction coefficient from experimental data by fuzzy logic for intelligent tire development. Sensors, 18(2), 490. DOI 10.3390/s18020490. [Google Scholar] [CrossRef]
15. Breglio, G., Irace, A., Pugliese, L., Riccio, M., Russo, M. et al. (2019). Development and testing of a low-cost wireless monitoring system for an intelligent tire. Machines, 7(3), 49. DOI 10.3390/machines7030049. [Google Scholar] [CrossRef]
16. Zhou, Y. L., Zang, Y. H., Lin, Y. H. (2012). Based on multi-sensor information fusion algorithm of TPMS research. Physics Procedia, 25(4), 786–792. DOI 10.1016/j.phpro.2012.03.158. [Google Scholar] [CrossRef]
17. Zhao, Y., McDaniel, J. G., Wang, M. L. (2017). IRI estimation using analysis of dynamic tire pressure and axle acceleration. Smart Structures and Systems, 19(2), 151–161. DOI 10.12989/sss.2017.19.2.151. [Google Scholar] [CrossRef]
18. Persson, N., Gustafsson, F., Drevö, M. (2002). Indirect tire pressure monitoring using sensor fusion. SAE Transactions, 1, 1657–1662. [Google Scholar]
19. Prasanthi, G., Felix Enigo, V. S. (2018). A smart tyre pressure monitoring using android phones. International Conference on Intelligent Data Communication Technologies and Internet of Things, pp. 312–318. Cham: Springer. [Google Scholar]
20. Jeong, D., Choi, S. B., Lee, J., Kim, M., Lee, H. (2021). Tire dimensionless numbers for analysis of tire characteristics and intelligent tire signals. Mechanical Systems and Signal Processing, 161(4), 107927. DOI 10.1016/j.ymssp.2021.107927. [Google Scholar] [CrossRef]
21. Sujon, M., Dai, F. (2021). Application of weigh-in-motion technologies for pavement and bridge response monitoring: State-of-the-art review. Automation in Construction, 130(6), 103844. DOI 10.1016/j.autcon.2021.103844. [Google Scholar] [CrossRef]
22. Kumar, G. S., Krishnanunni, C. G., Rao, B. N. (2021). Indirect damage identification in bridges based on dynamic tyre pressure monitoring. International Journal of Structural Stability and Dynamics, 21(4), 2150056. DOI 10.1142/S0219455421500565. [Google Scholar] [CrossRef]
23. Abbi, A., Ramakrishnaiah, T. (2021). Tyre pressure monitoring system. IOP Conference Series: Materials Science and Engineering, 1042(1), 012024. IOP Publishing. [Google Scholar]
24. Khade, H. S., Patange, A. D., Pardeshi, S. S., Jegadeeshwaran, R. (2021). Design of bagged tree ensemble for carbide coated inserts fault diagnosis. Materials Today: Proceedings, 46(2), 1283–1289. [Google Scholar]
25. Khairnar, A., Patange, A., Pardeshi, S., Jegadeeshwaran, R. (2021). Supervision of carbide tool condition by training of vibration-based statistical model using boosted trees ensemble. International Journal of Performability Engineering, 17(2), 229–240. DOI 10.23940/ijpe.21.02.p7.229240. [Google Scholar] [CrossRef]
26. Bajaj, N. S., Patange, A. D., Jegadeeshwaran, R., Kulkarni, K. A., Ghatpande, R. S. et al. (2022). A Bayesian optimized discriminant analysis model for condition monitoring of face milling cutter using vibration datasets. Journal of Nondestructive Evaluation, Diagnostics and Prognostics of Engineering Systems, 5(2), 021002. DOI 10.1115/1.4051696. [Google Scholar] [CrossRef]
27. Patange, A. D., Jegadeeshwaran, R. (2020). Application of Bayesian family classifiers for cutting tool inserts health monitoring on CNC milling. International Journal of Prognostics and Health Management, 11(2). [Google Scholar]
28. Datasheet: Arduino ATmega2560. https://store.arduino.cc/usa/mega-2560-r3. [Google Scholar]
29. Datasheet: Accelerometer ADXL335. https://www.sparkfun.com/datasheets/Components/adxl335. [Google Scholar]
30. Tire specification. https://www.goodyearautoservice.com/en-US/tire-basics/tire-size. [Google Scholar]
31. Akhil, M., Sugumaran, V., Soman, K. P., Amarnath, M. (2014). Fault diagnosis of helical gear box using variational mode decomposition and random forest algorithm. Structural Durability & Health Monitoring, 10(1), 55–80. DOI 10.3970/sdhm.2014.010.055. [Google Scholar] [CrossRef]
32. Patange, A. D., Jegadeeshwaran, R. (2021). A machine learning approach for vibration-based multipoint tool insert health prediction on vertical machining centre (VMC). Measurement, 173(4), 108649. DOI 10.1016/j.measurement.2020.108649. [Google Scholar] [CrossRef]
33. Johnson, J. M., Khoshgoftaar, T. M. (2019). Survey on deep learning with class imbalance. Journal of Big Data, 6(27), 3. DOI 10.1186/s40537-019-0192-5. [Google Scholar] [CrossRef]
34. Elangovan, M., Ramachandran, K. I., Sugumaran, V. (2010). Studies on Bayes classifier for condition monitoring of single point carbide tipped tool based on statistical and histogram features. Expert Systems with Applications, 37(3), 2059–2065. DOI 10.1016/j.eswa.2009.06.103. [Google Scholar] [CrossRef]
 | This work is licensed under a Creative Commons Attribution 4.0 International License, which permits unrestricted use, distribution, and reproduction in any medium, provided the original work is properly cited. |