DOI:10.32604/sv.2020.011086
| Sound & Vibration DOI:10.32604/sv.2020.011086 | |
| Article |
Frequencies Rotation at High Sound Pressure Levels Toward Low Frequencies
1Department of Environmental Engineering, Faculty of Natural Resources and Environment, Science and Research Branch, Islamic Azad University, Tehran, Iran
2Materials Science and Engineering Department, School of Engineering, Shiraz University, Shiraz, Iran
3Department of Environmental Engineering, Faculty of Natural Resources and Environment, Science and Research Branch, Islamic Azad University, Tehran, Iran
*Corresponding Author: Sirus Javadpour. Email: Javadpor@shirazu.ac.ir
Received: 18 April 2020; Accepted: 14 August 2020
Abstract: Today, analyzing of sound pressure level and frequency is considered as an important index in human society. Sound experts believe that analyzing of these parameters can help us to better understanding of work environments. Sound measurements and frequency analysis did to fix the harmful frequency in all sections in Shiraz gas power plant with sound analyzer model BSWA 308. The sound pressure levels (LP) and the one and one-third octave band were continuously measured in A and C weighting networks and slow mode for time response. Excel 2013 and Minitab 18.1 software used for statistical calculations. Results analyzed by Minitab 18.1 software. The highest harmful frequency in Shiraz Gas Power Plant (SGPP) was 50 Hz with 115 dB. The sound pressure level (SPL) ranged from 45 dB to 120 dB in one-third octave band and weighting network C. The maximum sound pressure level was in Craft electricity generator with 105.3 dB and 67 Hz. Sound pressure level in surrounded environment was 120 dB. According to the results, in this industry the sound pressure level exceeded the Occupational Exposure Level of Iran (OEL). The value of sound pressure level were higher than the Standard of occupational health. SGPP consumes 47000 cubic meters of natural gas per hour to produce 100 MW (Mega Watt) of electricity. It is very high and it is not economical and cost effective. These numbers indicate that the power plant’s efficiency is low. It could be concluded that the noise pollution is an important issue in these industries. Moreover, SGPP produce noise with loss energy. Frequencies rotation at high sound pressure levels toward low frequencies were happened.
Keywords: Sound waves; noise-induced; occupational safety; industrial health; noise
 | This work is licensed under a Creative Commons Attribution 4.0 International License, which permits unrestricted use, distribution, and reproduction in any medium, provided the original work is properly cited. |
Today, the disturbing sound of the environment has become a major problem for human societies. After the introduction of noise as an occupational and environmental disease, there are considerable amount of literature on noise pollution in an industry [1]. In this factory, the noise pollution produced by machinery, turbines, generators and powered tools or other activities influences employees’ health and all of them can even cause diseases [2]. It become one of the most frequent occupational hazards [2]. Noise-Induced Hearing Loss (NIHL) is known as an occupational disease in the world [3]. The World Health Organization (WHO) has shown that there is a disturbance between sleep and discomfort of traffic [4].
Noise pollution has been widely investigated in deferent cities [5–8]. As others have highlighted, Nassiri’s approach raises many doubts about the health’s workers in work environments. Many studies have been published on occupational health in deferent factories [9–13]. Various approaches have been proposed to solve this issue [14]. In recent years, there has been growing interest in frequency analyzing for solving problem [15,16]. Many attempts have been made in order to investigate LP in factories [17]. More recent evidence highlights that 35.4% of measurement stations, LP exceeded the occupational standard level (85 dB) [17,18]. As mentioned by Iraj Ali Mohammadi et al. (2017), AliMohammadi’s argument relies too heavily annoyance in cities. Bukola Olalekan Bolaji’s et al. (2017) [19], reported that electricity generating sets produced 26.7% of the overall noise which shows that it is one of the important sources of noise in the manufacturing companies. We know that sound index has many applications in the field of noise and environmental pollution. Thus, we can use these indexes for sound analysis in industrial environments.
3 Experimentation and Observations
According to general electric (GE) power systems, the first ever gas turbine installed in an electric utility in the United States of America in 1949. GE power system was used in combined cycle mode. However, this was not the first use of a gas turbine for power generation. The credit for that belongs to the Swiss company BBC (Brown, Boveri and Companies) which in 1939 installed a 4MW (Mega Watt) open-cycle gas turbine at a municipal power station in Neuchâtel, Switzerland (see Fig. 1). This unit had a long life. It was finally retired in 2002 and has since been restored for public display [20–22]. The history of the gas turbine for power generation can date back to the beginning of 20th century when a British engineer, Sir Frank Whittle and a German scientist, Hans von Ohain, independently developed a gas turbine for aircraft propulsion. Also, in the same period, the first gas turbine for power generation was operational in 1939 in Neufchateau, Switzerland [23] (see Fig. 2).
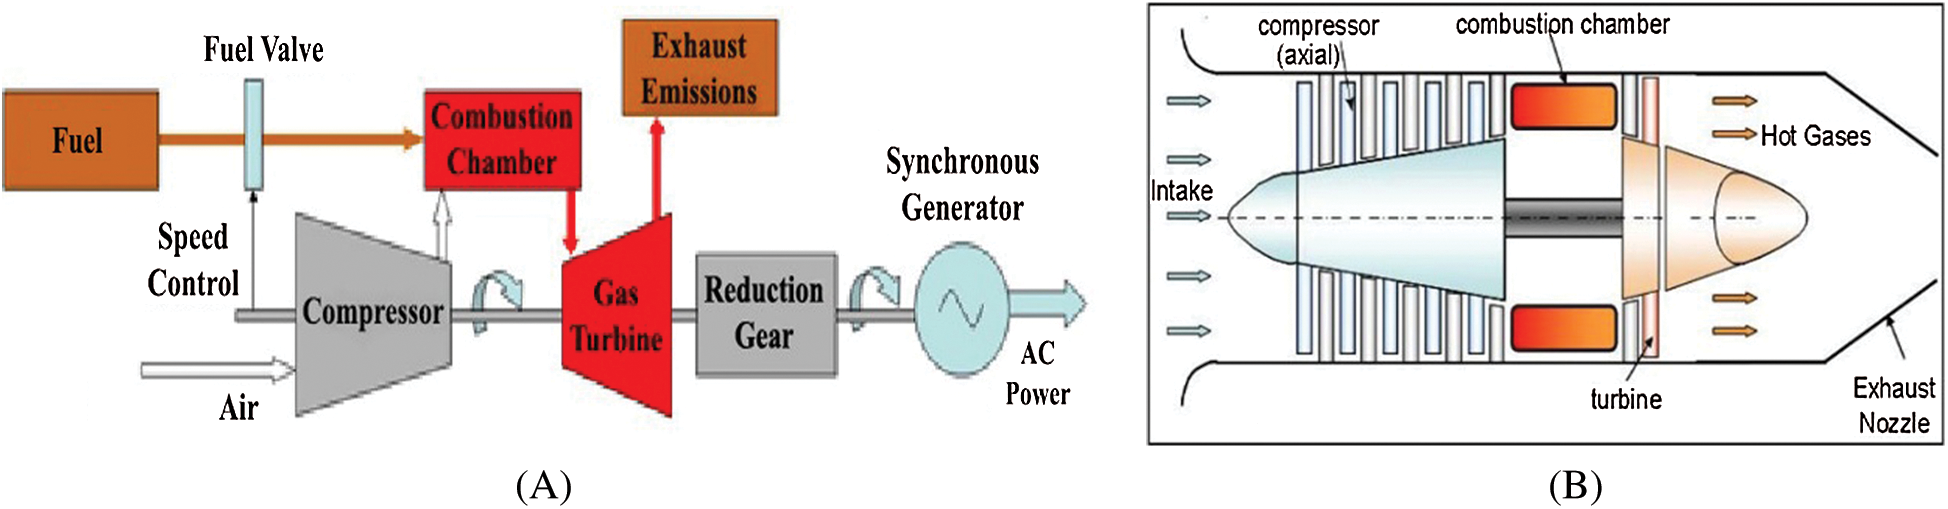
Figure 1: A) Diagram of gas turbine electric power generation. B) Schematic of first use of a gas turbine for electric power generation which in 1939 installed in Neuchâtel, Switzerland [23]
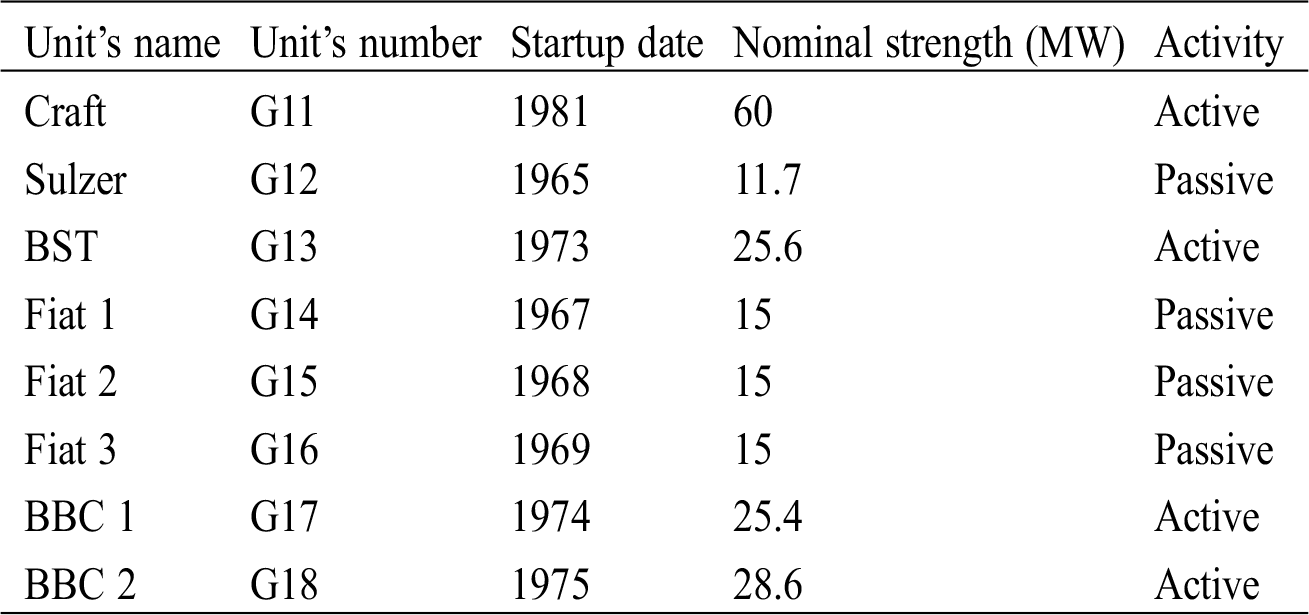
Ever since, the emergence gas turbine designs in the different parts of the world has never stopped [23]. SGPP is one of them. SGPP is known as the main cause of environmental noise pollution in Shiraz city. This electricity power plant was selected to sound measuring and frequency analysis. This electricity power plant has 8 unit with 4 active units (see Tab. 1). Tab. 1 summarizes the data on type of generators in SGPP. In terms of the amount of energy produced, Craft’s unit is the largest generator of this plant.
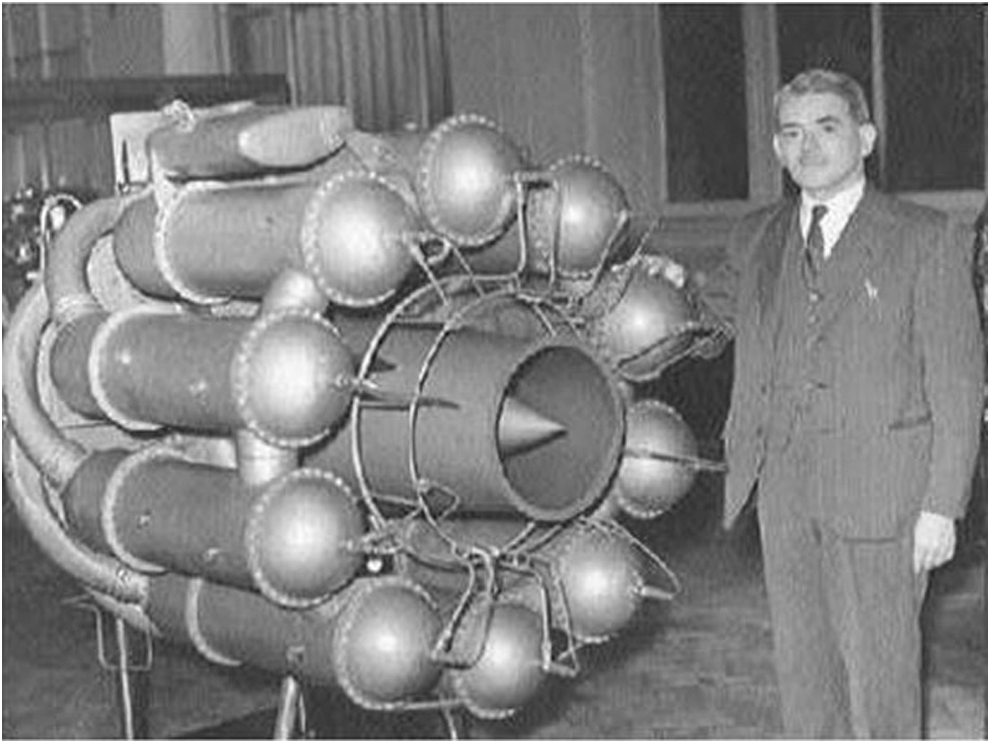
Figure 2: The first gas turbine for power became operational in 1939 in Switzerland [23]
This study introduces a new view to acoustic experts. This way causes that the sound engineers consider sound and frequency analyzing at the same time and with more attention to them. There are several ways among the methods of engineering and theoretical mathematics that are used for measuring different sound behavior and different goals. In our research project, steps of new view are as follows:
• Sound measurements and frequency analysis at different sections in SGPP at 700 metering station with Octave Sound Level Meter (SLM) model BSWA 308.
• Determine sound source and harmful frequency in this factory.
• Analyze the results by Excel 2013 and Minitab 18.1 software.
• Analyze of the gas consumption volume amount in the SGPP with household gas subscribers in cold and tropical regions.
Table 1: Type of generators in SGPP (2019)
We used sound level meter and frequency analysis model BSWA 308 with class A in order to identify harmful frequency in different sections. First, the noise source identified in cooperation with the HSE (Health, Safety, and Environment) and technical offices in SGPP. Second, sound level meter and frequency analysis was carried out at 700 stations from different part of this factory and around the factory (see Fig. 3). In this study, the ISO 9613 standard were used for measurement mechanism and technical calculations. The duration of calibration, according to ISO 9613 standard, determined for each measurement was about 90 s [24]. In this project, Craft and BBC generators and their turbines were selected as a noise source. Craft and BBC electricity generators are among the biggest source of the last four decades to produce noise pollution in this industry. Some of important properties of sound’s generators can be referred to the designs and type of these generators.
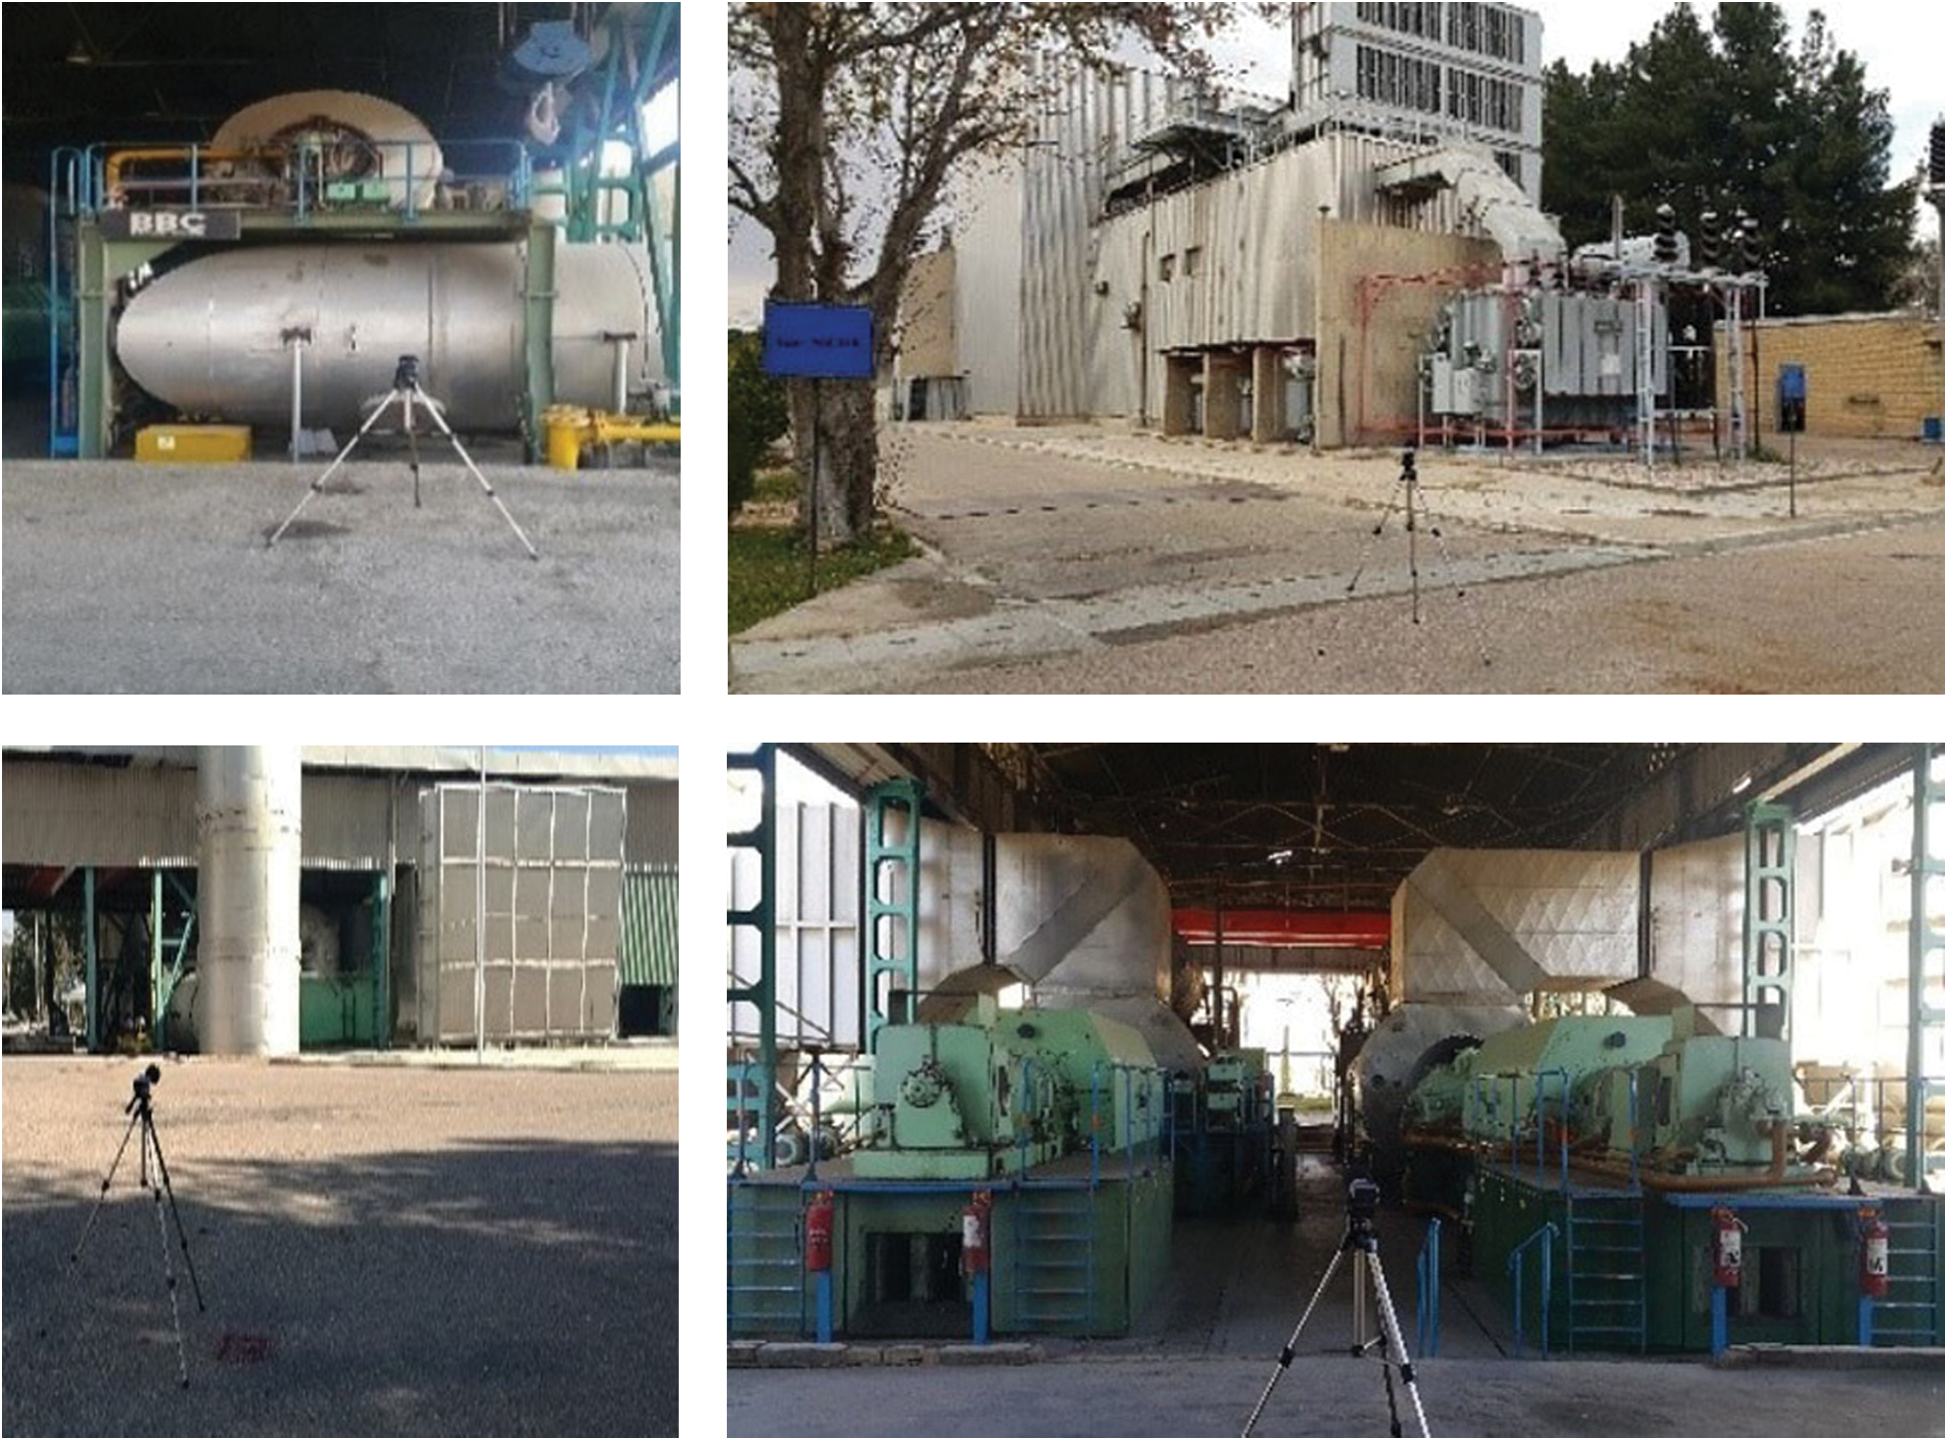
Figure 3: Show some of the measurement stations and the method of measurement in SGPP in 2019 [24]
The result of occupational measurements in more than 700 stations in the weighting network A and C are shown in Figs. 3 and 4. According to these figures, all stations under study were at health’s risk and no safety limit was recorded. The highest average sound pressure level belonged to the BST and Craft stations and were equal to 103.5 dB and 115 dB respectively. It should be noted that at the time of the measurement of the sound pressure level, units of Fiat and Sulzer were shut down. Data were extracted only from the Craft, BBC and BST unit’s records.
Table 2: Results of the sound pressure level and harmful frequency are shown in the turbines of SGPP in 2019
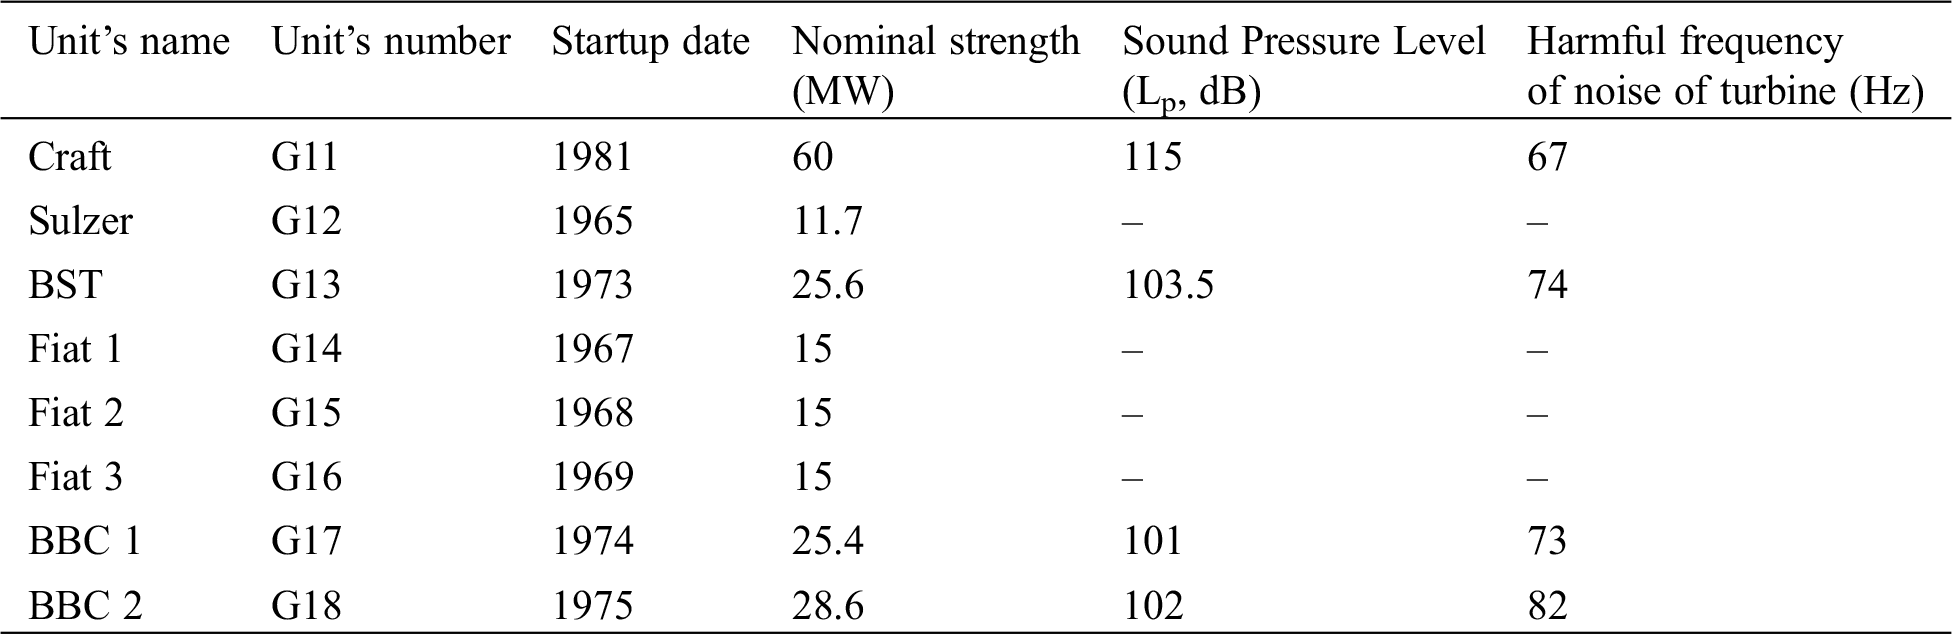
Fig. 4 show that sound pressure level (LP, C) variations in one-third octave band weighting network in slow mode at 20 stations. The results suggest that changes in the sound pressure level varied from 45 dB to 120 dB. According to Tab. 2, all results obtained from the study stations were higher than the Iran’s environmental standard and Occupational Exposure Level of Iran (OEL).
Fig. 5 clearly showed that sound pressure level was higher than OEL. Therefore, it was in danger range. Administrators, especially those who are involved in industrial construction, can use the result’s charts for acoustic design of the buildings so that they can provide the quiet side for the users and consider the Threshold Limit Values (TLVs), see Fig. 6.
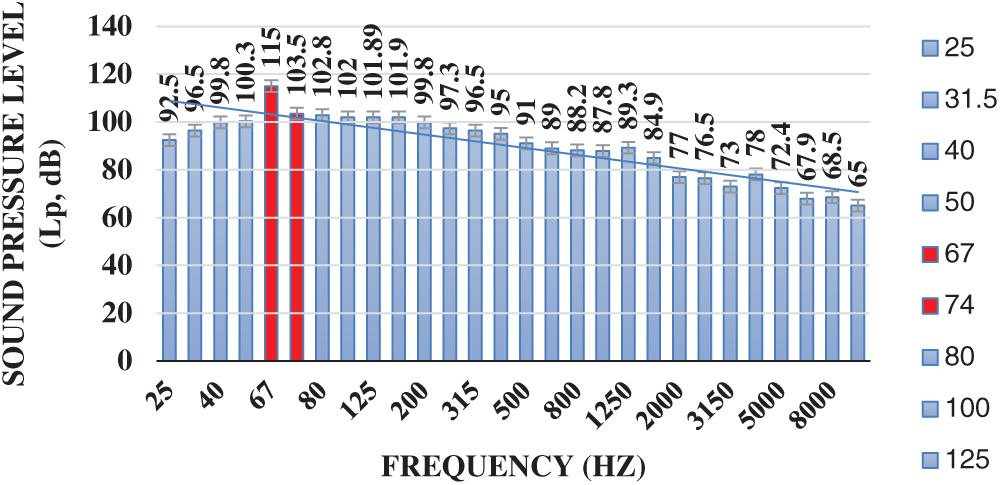
Figure 4: Maximum sound pressure level (LP, A) changes in the one-third octave band weighting network in slow mode at 700 stations measured in SGPP during 2019
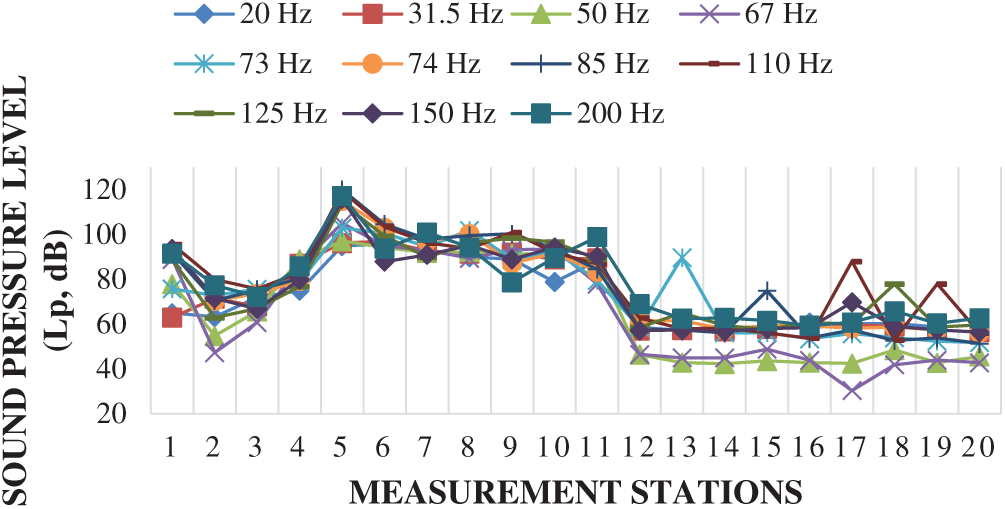
Figure 5: The sound pressure level (LP, C) variations in frequency between 20–200 Hz in one-third octave band weighting network in slow mode at 20 stations measured in SGPP during 2019
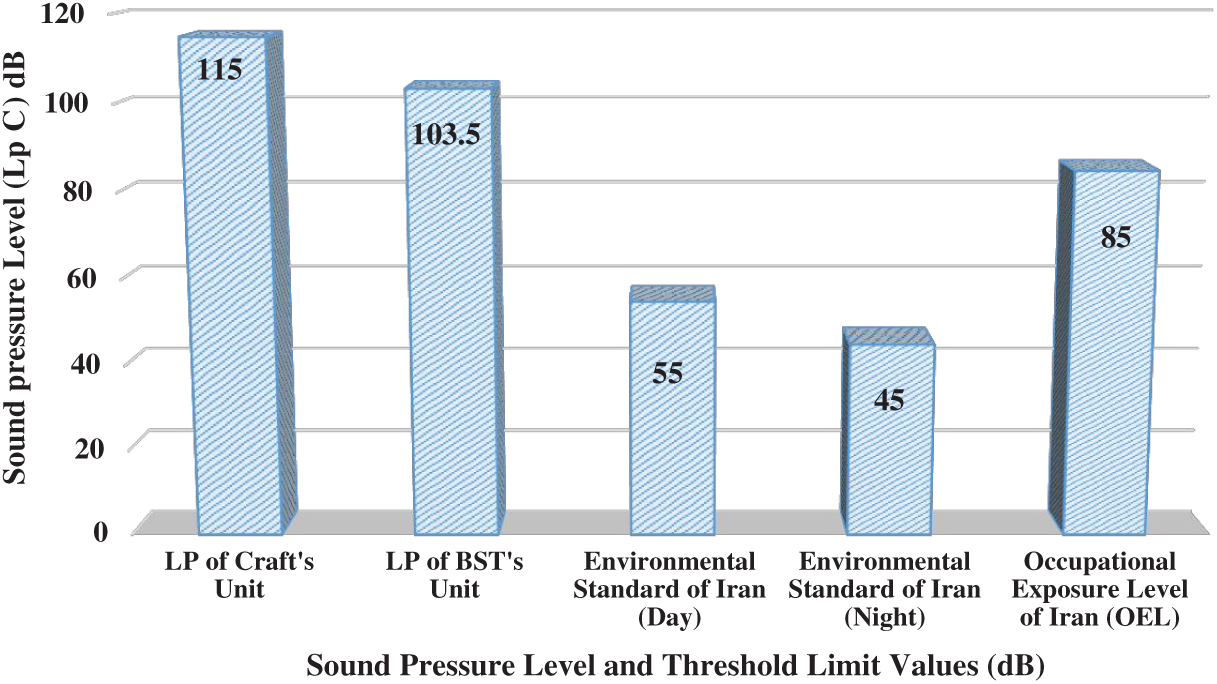
Figure 6: The comparison of the maximum sound pressure level (LP, C) value in one-third octave band weighting network in slow mode at Craft and BST stations in Shiraz gas power plant during 2019
As can be seen in Figs. 4 and 5, with the increase in the SPL (LP, C) of the SGPP, the rate of low frequencies in the main turbine has increased. The noise pollution to the main turbine (Craft) was changeable between 105.3 dB and 120 dB, and the largest effect observed at 120 dB (see Fig. 6). The response of the other power tools such as, oil pump and gas pump individually analyzed with using a sound frequency analyzer and also one-third octave band weighting network to separate the frequency range in which each part operated. In this case, frequency analysis showed that the observed SPL was equal to 4.7 dB. Results indicated that the power tools had not a significant effect on the increase of the sound pressure level of the frequency. The increasing of internal reflections could increase SPL. In this factory’s building, the amount of reduction in the sound pressure level will increase significantly if the appropriate absorbers uses.
Today, from the technological point of view, the development of technology has reduced the level of sound production in these electricity generators but, it seems that along with the worn-out industry with noise pollution is caused that the sound in the industrials’ environment is moving toward low frequencies. One of the reasons of neglecting the issue of frequency measurements and sound analyzing has been more attention to the air and expensive cost of frequency measurements. In our country, the goal and high lightened of introducing a new view was considering the problem of noise pollution such as: frequency analysis, effects of barrier, reflections and worn-out industries. The most remarkable result to emerge from data is that 50 Hz. Interestingly this correlation is related to lower frequency. In our view, the result emphasize the validity of our measurement. These results offer powerful evidence for frequency at old electricity generators. As expected, these results showed that frequency analysis is very important procedure in noise measuring.
At the time of measurement, two units of the generators were outside the circuit and were not involved in the overall measurements of the sound pressure level. These finding thus need to be noticed other factory’s part. The conclusions of the review should be analyzed with caution. We aware that our research may had three limitations. The first was reflection’s effects, the second was shutting down of some units and the third was impossibility of turning off some parts during measurement. There is evidence to support the hypothesis that our life moved towards lower frequencies in industries and cities. We saw that a growing body of literature has investigated in noise pollution and occupational health, but at the end of any literature is only said the necessity for improvement of controlling and protection measures has prime importance. To be honest, there is a need to offer a new attitude for presentation of solutions in any literature.
One of the major results of this study is that frequencies changes occur in the current society. The burn out of the mother industries, especially in the industry of electricity production is effective in changing the characteristics of noise production. Until now, a comprehensive study of this issue has not been carried out scientifically. Much work on the potential of noise pollution has been carried out yet, there are still some critical issues on analyzing of sound [25–31]. The characteristics of frequency’s effect are not well understood in depth in Iran. It is not yet known whether low frequency can do health’s effects. One of the main issue in our knowledge of sound’s frequency is lack of research in this topic. Although, this approach is interesting but, it suffers from to take into account for research management in some industries. We know that most studies have only focused on health’s effect without any applicable suggestions [32].
In addition to noise pollution, this electric gas power plant consumes a lot of energy annually. Further analysis showed that the Craft, BBC and BST units consume 18,000, 10,000 and 9000 cubic meters of natural gas per hour, respectively. In this study, it was found that a total of 47000 cubic meters per hour of natural gas was consumed when all the units were on. Scientific information in specialized articles on the performance and efficiency of gas power plants with old technology showed that the maximum efficiency was 20% to 35%. Therefore, 70% of the consumed gas in this power plant was wasted. It is generally accepted that a more appropriate analysis will be done if now we turning to compare with the average consumption of household gas subscribers in different regions, especially tropical and cold regions. Tab. 3 shows the data from this analysis.
Table 3: Gas consumption volume amount of Kraft and BBC units in SGPP in an 8 hr work shift in 2019
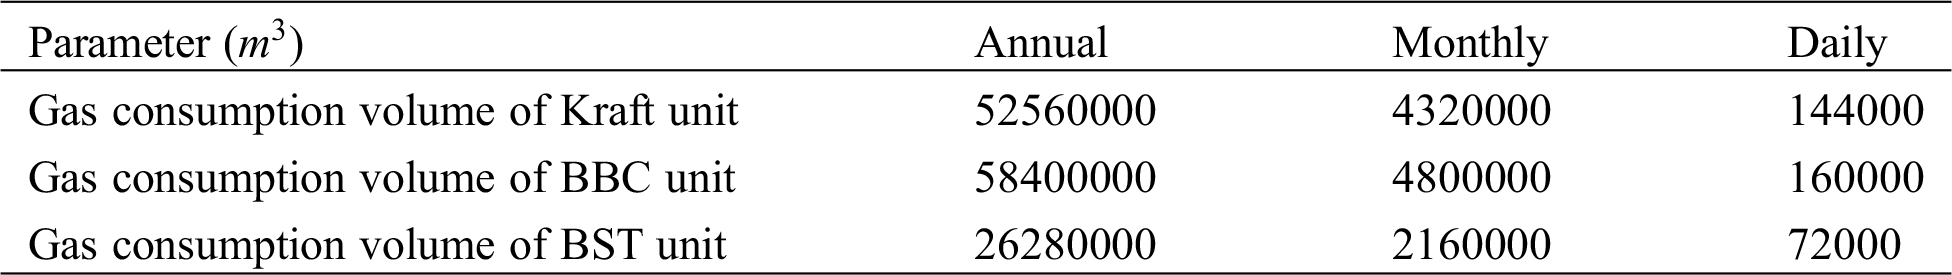
Table 4: Comparison table of the gas consumption of the SGPP on a daily, monthly and annual basis for an 8 hr work shift in 2019

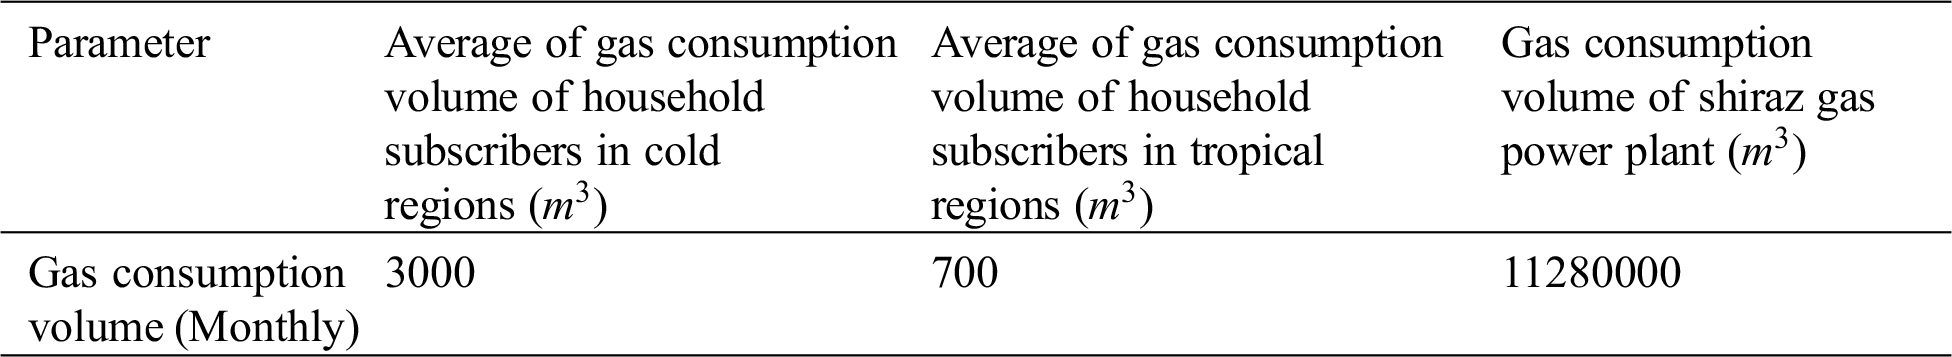
Table 5: Comparison table of average consumption of household subscribers in cold and tropical regions of Iran with the monthly consumption of SGPP in 2019
Tabs. 3 and 4 demonstrates that the gas consumption of this power plant is not affordable.
This paper has high lightened the importance of frequency measuring of sound in all sound measurements. It can be concluded that this factory wastes energy while polluting the noise. This old power plant has generated annoying low frequencies. We have obtained results demonstrating that sound changing in our human life. These finding add a growing body of literature to our understanding of noise pollution in internal environment of factories and cities’ environments.
The effects of the noise will be critical in residential areas where many companies and homes are sited to gather in the same area. The present findings might help to have important applications for solving several courses of actions in order to solve noise pollution. In our view, these result represent an excellent initial step toward solving noise control in industry and making a better design in noise barrier. We believe that our results may improve importance knowledge about sound frequency and could help a useful aid for support decision makers because they need to know that Changes in industrial disturbance frequencies. Then, they can design noise barriers better. Further work needs to be done to established whether each generator how much does acoustic energy produce? And how worn-out can change the frequency of sound. It seems that along with the development of the new industry, repairs and major overhaul must be taken seriously in the old industry.
As can be seen in Tab. 5, the monthly gas consumption volume of the power plant for 8 h of work shift is equal to 1128,000,000 cubic meters. This number is equal to the gas consumption volume of 32022 subscribers of domestic gas in cold regions and 137240 subscribers of domestic gas of tropical regions. If we consider the calculations based on the annual consumption, the amount of consumption is equal to 137240000 cubic meters per year. The maximum amount of electricity generated by all active units indicates that approximately 70% of the consumed energy is converted into heat.
With the current technology, this gas turbine electric power generation consumes 47000 cubic meters of natural gas per hour to produce 100 MW of electricity, which is very high and it is not economical and cost effective. These numbers indicate that the power plant’s efficiency is low. In this case, the efficiency of the factory is about 35%. At the same time, there are common and inexpensive alternatives to power generation. Thus, taking into account the current location of the plant’s construction, an alternative solution, thought with high overheads is turning the factory into a museum for public display. Therefore, it is recommended that these power plants be turned into museums. With turning this factory into a museum, simultaneously, resulting in preventing energy waste, it is possible to reduce noise pollution in the surrounding residential areas.
For offshore power plants, there is the possibility of using exhaust Outlet heat for the preparation of sweet water. Another alternative solution, which can be affordable, is to accompany a desalination system. It seems that in the cases stated, the efficiency of the plant is about 90%.
Acknowledgement: This research project was part of a Ph.D. dissertation of the first author in Environmental Engineering at Islamic Azad University, Faculty of Natural Resources and Environment, Science and Research Branch, Tehran, Iran, supported by Shiraz University Laboratory (Civil and Materials College, School of Engineering) and Shiraz Gas Power Plant (For Acoustic Room, 2018–2019). This research did not receive any specific grant from funding agencies in the public, commercial, or not-for-profit sectors. The authors would like to gratitude all people who have cooperated with the research team. We appreciate the following persons for their support, without their helps this work would never have been possible: Engineer Mr. Mohammad Reza Parsa, Engineer Mr. Majid Rozeetalab, Engineer Mr. Hashem Negahdari, and Ms. Maryam Negahdari.
Ethical Issues: The authors hereby certify that all data collected during the study is as stated in this manuscript, and no data from the study has been or will be published elsewhere separately.
Funding Statement: The author(s) received no specific funding for this study.
Conflicts of Interest: The authors declare that they have no conflicts of interest to report regarding the present study.
References
1. Ohrstrom, E., Skanberg, A., Svensson, H., Gidlof-Gunnarsson, A. (2006). Effects of road traffic noise and the benefit of access to quietness. Journal of Sound Vibration, 295(1–2), 40–59. DOI 10.1016/j.jsv.2005.11.034.
2. Aurich, J. C., Yang, X., Schröder, S., Hering-Bertram, M., Biedert, T. et al. (2012). Noise investigation in manufacturing systems: An acoustic simulation and virtual reality enhanced method. CIRP Journal of Manufacturing Science and Technology, 5(4), 337–347. DOI 10.1016/j.cirpj.2012.09.010. [Google Scholar] [CrossRef]
3. John, M. E. (1978). Patties industrial hygiene and toxicology. 3rd. USA: Wiley-inter Science Publication. [Google Scholar]
4. WHO. (2011). Burden of disease from environmental noise: Quantification of healthy life years lost in Europe. Copenhagen: Regional Office for Europe of the World Health Organization. [Google Scholar]
5. Gallehdar, E. S., Alimohammadi, I., Alemohammad, N., Nassiri, P. (2018). The relationship between the noise pollution caused by road transport and demographic factors of residents living near the Basij highway, north to south Tehran district 15. Journal of Health in the Field, 5(3). [Google Scholar]
6. Paravar, A., Monazzam, M. R., Mansouri, N., Motalebi Kashani, M. (2015). Evaluation of noise pollution and traffic noise index using geographical information system in the main streets of Kashan, Iran. Health System Research, 11(4), 688–93 [In Persian]. [Google Scholar]
7. Yousefzadeh, A., Nassiri, P., Rahimi Foroushani, A. (2016). The relationship between air traffic noise and its induced annoyance in the southwest area in Tehran, Iran. Journal of Health and Safety at Work, 6(3), 15–28 [In Persian]. [Google Scholar]
8. Ahmadi, S., Karbord, A., Einanlo, E., Aubi zade, H., Zarei, M. (2011). Occupational noise exposure and hearing loss among car smoothers in Qazvin. Iranian Journal of Health and Environment, 4(1), 85–92. [Google Scholar]
9. Gallehdar, E. S., Alimohammadi, I., Alemohammad, N., Nassiri, P. (2018). The relationship between the noise pollution caused by road transport and demographic factors of residents living near the Basij highway, north to south Tehran district 15. Journal of Health in the Field, 6; 5(3), 1–7 (In Persian). DOI 10.22037/jhf.v5i3.14663. [Google Scholar] [CrossRef]
10. Mohammadi, A., Alidadi, H., Delkhosh, M., Fallah, H., Amouei, A. et al. (2016). Noise pollution measurement in crowded areas of Neyshabur during primary three months of 2015. Iranian Journal of Research in Environmental Health, 2(4), 276–284. [Google Scholar]
11. Jafari, M., Kazempour, M. (2013). Review of low frequency noise effects on mental performance. Journal of Health, 3(4), 52–62. [Google Scholar]
12. Farhang Dehghan S, Monazzam MR, Nassiri P. (2013). The Assessment of noise exposure and noise annoyance at a petrochemical company. Journal of Health and Safety at Work, 3(3), 11–24 (In Persian). http://jhsw.tums.ac.ir/article-1-5076-en.html. [Google Scholar]
13. Hashemi, H., Esmaeili, F. (2013). Survey on noise pollution in a poultry slaughterhouse. Journal Health System Research, 9(5), 513–520. [Google Scholar]
14. Monazzam, M. R., Farhang Dehghan, S., Nassiri, P., Jahangiri, M. (2015). Termination of the dominant noise source in an air production plant of a petrochemical industry and assessing the effectiveness of its enclosing. Occupational Medicine Quarterly Journal, 7(2), 44–56. [Google Scholar]
15. Jahangiri, M., Golmohammadi, R., Aliabadi, M. (2014). Determination of main noise sources in a thermal power plant. Journal of Health and Safety at Work, 10; 4(3), 13–22 (In Persian). http://jhsw.tums.ac.ir/article-1-5175-en.html. [Google Scholar]
16. Ghanbari, M., Yartire, H., Ashtarian, H., Salimi, K. Pourman, D. et al. (2014). A Study of sound pressure level, frequency analysis and sound spectrum levels calculation in Crepnaz factories of Kermanshah city. Journal of Clinical Research Paramedical Sciences, 3(4), 294–302. [Google Scholar]
17. Zare, S., Hasheminejad, N., Elahi Shirvan, H., Hasanvand, D., Hemmatjo, R. et al. (2018). Assessing individual and environmental sound pressure level and sound mapping in Iranian safety shoes factory. RJAV, 15(1), 20–25. [Google Scholar]
18. Zare, S., Ghotbi-Ravandi, M. R., ElahiShirvan, H., Ahsaee, M. G., Rostami, M. (2019). Predicting and weighting the factors affecting workers’ hearing loss based on audiometric data using C5 algorithm. Annals of Global Health, 85(1), 88. DOI 10.5334/aogh.2522. [Google Scholar] [CrossRef]
19. Bolaji, B. O., Olanipekun, M. U., Adekunle, A. A., Adeleke, A. E. (2018). An analysis of noise and its environmental burden on the example of Nigerian manufacturing companies. Journal of Cleaner Production, 172, 1800–1806. DOI 10.1016/j.jclepro.2017.12.007. [Google Scholar] [CrossRef]
20. Chase, D. L. (2001). Combined-cycle development evolution and future. GE Power Systems, GER-4206, (10), 5–6. [Google Scholar]
21. Breeze, P. (2016). Gas-turbine power generation. Academic Press. Elsevier, (UK). [Google Scholar]
22. The Brown Boveri Review Report (1940). Published by BROWN, BOVERI & COMPANY, LIMITED, BADEN (Switzerland). Printed by Kreis & Co., Basle. Switzerland. Obtainable through A. Francke A. G., Berne and Rouge & Cie., Lausanne (Switzerland). [Google Scholar]
23. The Dutch Gas Turbine Association (DGTA) (2019). Technology and Innovations. Netherlands. [Google Scholar]
24. ISO 9613-1:1993 Acoustics—Attenuation of sound during propagation outdoors—Part 1: Calculation of the Absorption of Sound by the Atmosphere https://www.iso.org/standard/17426.html. [Google Scholar]
25. Environmental Performance and Coordination Branch (2018). Noise measurement manual. ESR/2016/2195, Version 4.01. The State of Queensland 2020. Department of Environment and Heritage Protection, Australia. [Google Scholar]
26. Crichton, F., Dodd, G., Schmid, G., Petrie, K. J. (2015). Framing sound: Using expectations to reduce environmental noise annoyance. Environmental Research, 142, 609–614. DOI 10.1016/j.envres.2015.08.016. [Google Scholar] [CrossRef]
27. Guasch, O., Magrans, F. X., Rodriguez, P. V. (2002). An inversion modelling method to obtain the acoustic power of the noise sources in a large factory. Applied Acoustics, 63(4), 401–417. DOI 10.1016/S0003-682X(01)00044-5. [Google Scholar] [CrossRef]
28. Hammond, G. P., O’Grady, Á. (2017). Indicative energy technology assessment of UK shale gas extraction. Applied Energy, 185, 1907–1918. DOI 10.1016/j.apenergy.2016.02.024. [Google Scholar] [CrossRef]
29. Lee, J. H., Kim, T. S., Kim, E. H. (2017). Prediction of power generation capacity of a gas turbine combined cycle cogeneration plant. Energy, 124, 187–197. DOI 10.1016/j.energy.2017.02.032. [Google Scholar] [CrossRef]
30. Noussan, M. (2018). Performance based approach for electricity generation in smart grids. Applied Energy, 220, 231–241. DOI 10.1016/j.apenergy.2018.03.092. [Google Scholar] [CrossRef]
31. Orlowski, R. J. (1990). Scale modelling for predicting noise propagation in factories. Applied Acoustics, 31(1–3), 147–171. DOI 10.1016/0003-682X(90)90058-3. [Google Scholar] [CrossRef]
32. Monazzam, M. R., Farhang Dehghan, S., Nassiri, P., Jahangiri, M. (2015). Termination of the dominant noise source in an air production plant of a petrochemical industry and assessing the effectiveness of its enclosing. Occupational Medicine Quarterly Journal, 7(2), 44–56. [Google Scholar]