DOI:10.32604/sv.2020.011513
| Sound & Vibration DOI:10.32604/sv.2020.011513 | |
| Article |
Cost Optimized Non-Contacting Experimental Modal Analysis Using a Smartphone
1Mechanical Engineering Department, Faculty of Engineering, Lebanese University, Beirut, Lebanon
2SDM Research Group, Mechanical Engineering Department, International University of Beirut, Beirut, Lebanon
3Mechanical Engineering Department, Lebanese International University, Bekaa, Lebanon
4Civil Engineering Department, Faculty of Engineering, Lebanese University, Beirut, Lebanon
*Corresponding Author: Jaafar Hallal. Email: jaafar.hallal@gmail.com
Received: 12 May 2020; Accepted: 27 August 2020
Abstract: The vibrations behavior analysis is an essential step in the mechanical design process. Several methods such as analytical modelling, numerical analysis and experimental measurements can be used for this purpose. However, the numerical or analytical models should be validated through experimental measurements, usually expensive. This paper introduces an inexpensive smartphone as an accurate, non-intrusive vibrations’ behavior measurement device. An experimental measurement procedure based on the video processing method is presented. This procedure allows the measurement of the natural frequencies and the mode shapes of a vibrating structure, simply by using a smartphone built-in camera. The experimental results are compared to those obtained using an accurate analytical model, where the natural frequencies error is less than 2.7% and the modal assurance criterion is higher than 0.89. In order to highlight the obtained results, a comparison has been done using a high quality and high frame per second (fps) camera-based measurement of material properties. Since the highest recovered natural frequency and its associated mode shape depend on the frame per second rate of the recorded video, this procedure has great potential in low frequencies problems such as for big structures like buildings and bridges. This validated technique re-introduces the personal smartphone as an accurate inexpensive non-contacting vibration measurement tool.
Keywords: Experimental measurement; motion magnification; smartphone; vibrations; mode shape; natural frequency
 | This work is licensed under a Creative Commons Attribution 4.0 International License, which permits unrestricted use, distribution, and reproduction in any medium, provided the original work is properly cited. |
The analysis of vibration behaviour of any structure is essential in order to avoid its failure, especially when it is subjected to an important load such as earthquakes. The vibration response of any structure depends on its material properties and geometrical shape, in addition to the applied load and the boundary conditions. Analytical and numerical modelling, also experimental measurements can be used independently or combined to figure out the vibration behaviour of a system.
The analytical modeling is a set of equations based on the fundamental physical laws that define the natural phenomena and predict the response of any system [1,2]. It is known by its accuracy; however, one should choose assumptions wisely while developing the system to avoid any loss of important information. Since this model is described using mathematical equations, the obtained results can be easily interpreted and related to its source. The analytical model can become so complex regarding its differential equations when several physical phenomena are involved or when the structure is geometrically complex. On the other hand, numerical modelling is a widely applied technique that uses mathematical models to describe the solution of complex geometries under different types of behavior laws. It has the ability to use large number of variables thanks to the recent development in computer science domain. On the other side, experimental measurements investigate the use of a sensor system to collect data from the studied structure. These obtained measurements are considered as a reference to validate the numerical and the analytical models, since they reflect the exact response of the studied system provided that the measurements were done correctly.
Back to the vibration analysis, analytical models can be established using Newton’s second law or energy methods. Even though these methods are easy to formulate, and very helpful to interpret. The model can get complicated rapidly, especially if it becomes a non-linear problem. Numerical modelling using Finite Element analysis can be called in these cases. Such numerical model needs to be validated experimentally to predict the behavior of the structure. The modal testing can be performed by placing a sensor on the structure being hammered. Contact sensors such as accelerometers are also used for modal analysis with high accuracy [3–5]. However, contact sensor can affect the obtained results due to its mass, especially when it comes to small structures. Several non-contact sensors have been developed as a substitute of the contact measurement devices, such as GPS monitoring [6], hologram interferometry [7], speckle photography [8] and laser Doppler vibrometer [9–11]. These devices are well known for their high cost and design complexity.
Thanks to the advanced technology evolution in the image sensors and high-performance optical lenses, vision-based measurements have been used by researchers and engineers in different fields, such as human motion analysis [12,13], condition monitoring [14,15], underwater measurement [16], and vibration analysis [17,18]. The vision-based measurement technique is also used for displacement measurement of different engineering structures [19,20].
A modern approach called the video magnification technique applied using high frame per seconds (fps) recorded video can magnify the small motion of the structure [21,22]. The analysis of this processed video will provide the modal characteristics of the structure. An important disadvantage of this method is the high cost. Actually, a high fps rate with enough image quality will quickly increase the cost of a camera. To alleviate the problem of high cost of the camera, an inexpensive smartphone built-in camera with appropriate fps and image quality is proposed as an alternative solution. This solution is proposed and discussed in this paper due to the rapid progress in the smartphones embedded technologies, while their prices are falling down [23]. Nowadays, making calls are not the main smartphone function. Taking advantage of the features such as the built-in accelerometer and from the spec’s evolution such as the processor and the memory, a lot of helpful applications are being introduced lately. These wide ranges of professional applications are useful and represent an accurate source of experimental measurement in the domain of sports science [24], astrophysics [25], acoustics [26], mental health [27], and medical applications [28]. Yang et al. [29] and Dorn et al. [30] worked on the automated detection of the mode shape of a simple structure using high resolution professional camera. Orak et al. [31] used the smartphone to identify the thermal stress measurement of several simple structure, while Feng [32,33] used a professional camera in order to monitor the structural health.
Going further in the simplification of the vibration behavior in experimental measurements, considering the advantages of the low price and the good quality, we will introduce the smartphone as a reliable low-cost non-contacting vibration sensor. First, the methodology of the proposed solution will be discussed. Then, an analytical model and experimental measurements using the built-in smartphone camera will be applied on the chosen structure. A comparison of the natural frequencies and the mode shapes is performed between the analytical and experimental results. Finally, a critical study of the feasibility, the limits and the future works of this approach are presented.
Visual motion which occurs at different amplitudes and over large frequency scale can hide important information such as natural frequencies and mode shapes. The motion magnification is a methodology aiming to exaggerate small displacement in a captured video. In other words, it can represent a microscope for visual motion [34]. This methodology consists of the detection and the modelling of the appearance of an original video, as trajectories of the pixel intensities observed in a reference frame, and then render the video with small motions amplified. The motion in the output video is magnified, and then small motion can be observed easily by naked eye. It is important to note that the small camera motions will not affect the accuracy of this method. Actually, instead of treating the original video as independent frame photos, the algorithm finds some special points that can be classified fixed. The motion is then estimated relative to these fixed points [35].
The processing starts by analysing the recorded video of the vibrating structure using a technique related to phase-based motion magnification [21]. Peaks in the Fourier transformation of the displacement signal are used to find the natural frequencies. For each of these natural frequencies, the displacement signal of all points of the structure is filtered with a narrow temporal bandpass filter centered at the natural frequency. The obtained spatially varying temporally filtered displacement signal will be used to estimate the associate mode shape.
The displacement is well defined at the edge of the structure. Actually, the motion of textureless and homogenous areas can be ambiguous. Resolving this issue need the use of a computer vision algorithms as dense optical flow [36,37]. The beam presented in this paper will not have such problem, however, for further application on big structure or torsion motion we suggest to trim the structure with inch tape and photographic targets to facilitate analysis of the high-speed recorded video.
The used technique is based on the local phase and local amplitude in oriented complex spatial bandpass filters, to simultaneously compute the displacement signal. The local phase and local amplitude are the analogue of the phase and amplitude of Fourier series coefficients. The local phase controls the location of basis function while the local amplitude controls its strength.
For a video with image brightness specified by the three dimensions array  at spatial location
  and time t, the local phase and local amplitude in orientation θ at a frame at time t0 is computed by specially bandpassing the frame with a complex filter
  to get:

where  is the local amplitude, and
  is the local phase. Filter
  is an operator to be applied on the array
  , and it is detailed in Fleet et al. [38].
According to Gautama et al. [38,39], the constant contours of the local phase through time correspond to the displacement signal in the following equation:

Now, differentiating with respect to time yields:

where u and v are the velocity in the x and y directions, respectively. From Eq. (3), we can conclude that  and
and  . Therefore, the velocity in units of pixel is:


The velocity between the ith frame and the first frame for all i is computed to give a displacement signal in time. The displacement signal is converted to unit of length by multiplying with a specific length on the structure, usually on the inch tape, by the number of pixels it spans.
These results present the displacement signal at all points in the image. Now, the peaks in Fourier transform of the resulting signal correspond to the natural frequencies. Then, the specially varying displacement signal will be temporally filtered around each natural frequency in order to obtain the mode shape.
The analytical model of a cantilever beam is developed based on the Newton’s second law. The first natural frequencies and mode shapes are extracted using this analytical mode. Experimental measurement using the video magnification technique will be conducted over the same beam. A video of the vibrating cantilever beam will be recorded using a smart phone built-in camera. This video will be used to compute the displacement signal on every point of the vibrating structure using a technique related to phase-based motion magnification [21]. The peaks in Fourier transform of the displacement signal will be related to the natural frequencies of the structure. The mode shapes can be extracted from the displacement of all points of the structure at the natural frequencies. For each natural frequency, the displacement signal at all points of the structure filtered with a narrow temporal bandpass filter, centred about this frequency will give an estimation of the mode shape of the structure.
3 Analytical Modelling of Steel Cantilever Beam
The procedure presented in this paper will be applied on the transverse vibration of a rectangular homogenous steel cantilever beam, where the dimensions and the material properties are as follows:
• Elastic modulus: 
• Density: 
• Length: 
• Width: 
Thickness: 
First, an analytical model of the steel cantilever beam will be used in order to determine the modal behavior. Since the length to the width ratio  , and the length to the thickness ratio
  are both greater than 10, this beam can be treated as Euler Bernoulli beam. According to the analytical model discussed minutely in Inman et al. [40], the natural frequencies (in Hz) are calculated using the Eq. (6):

where ki is a constant to be determined depending on the geometry and the boundary conditions of the structure,  is the Young’s modulus of the beam,
  is the thickness,
  is the density, and
  is the length of the beam. In the case of a cantilever beam, the values of ki are
  ,
,  and
and  .
.
The mode shapes corresponding to each natural frequency have the following form:

where  is a constant determined depending on the geometry and the boundary conditions of the structure. In the case of a cantilever beam, these values are:
  ,
,  and
and  .
.
The homogenous rectangular cantilever beam was chosen in this paper without any additional assumptions due to the confident results obtained in such case. This allows us to consider the analytical results as a reference to validate the proposed procedure.
4 Experimental Measurement Using Smartphone Camera
The main concept of the video magnification technique is to find small motion in a recorded video and magnify them. Therefore, an appropriate video should be recorded first. As shown in Fig. 1, the steel cantilever beam is placed perpendicular to the optical axis of the camera lens. A small initial displacement in the z direction is applied on the free edge of the beam. The transverse free vibration of the beam is recorded using the built-in camera of an about 600 USD smartphone. The recorded video of 240 fps is for 0.6 second at 1920 × 1080 resolution. The format of the video is MP4 and its size is 3.24 MB. The distance between the beam and the smartphone is about 60 cm. In order to minimize possible errors from the camera shake, the smartphone is placed on a tripod.

Figure 1: Experimental setup composed of the beam and the camera used to record the video
The video magnification technique models the appearance of the input video as translation of the pixel intensities observed in reference frame. In order to avoid the inevitable camera shake problems, this approach creates a sort of a relative coordinate system attached to the camera [34]. Pixels moving with correlated motions are grouped together to form a cluster. This will allow the very small motions to be grouped with larger motions to which they belong. A background cluster regroups all the fixed points. Finally, the small motion of a moving cluster is exaggerated. Fig. 2 shows the fixed and moving cluster of the recorded video.
The displacements of each pixel in the moving cluster will be magnified by a selected factor, typically between 4 and 40. The exaggerated displacement in function of time curve of an arbitrary point situated on the moving cluster is plotted, and then the Fourier transform of the curve is obtained. An arbitrary point is chosen in order to avoid any mode shape node. Peaks of the obtained Fourier transform are the natural frequencies of the moving structure.

Figure 2: Moving clusters (in red) of the beam
For each obtained natural frequency, the displacement signal at all points of the structure filtered with a narrow temporal bandpass filter centred about this frequency will give an estimation of the mode shape of the structure.
The beam is excited by a transverse impulse on its free edge. A video is recorded using the smartphone built in camera as shown before and then analysed using the motion magnification technique. Fig. 3 taken from the processed video shows the magnified motion of the beam. The normalized displacement of an arbitrary point on the beam is shown in Fig. 4. The displacement Fourier transform presented in Fig. 5 shows clearly three emerged peaks at 5.1 Hz, 32.7 Hz and 92 Hz which represent the three natural frequencies of the cantilevered beam.
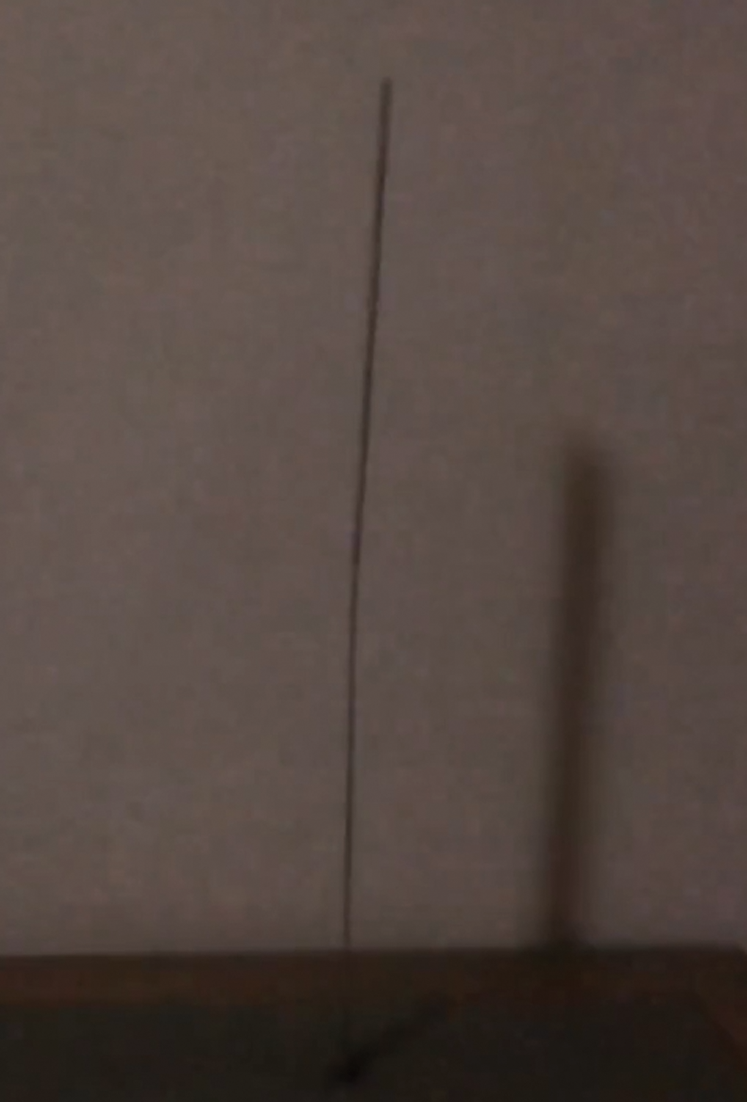
Figure 3: Magnified motion of the beam
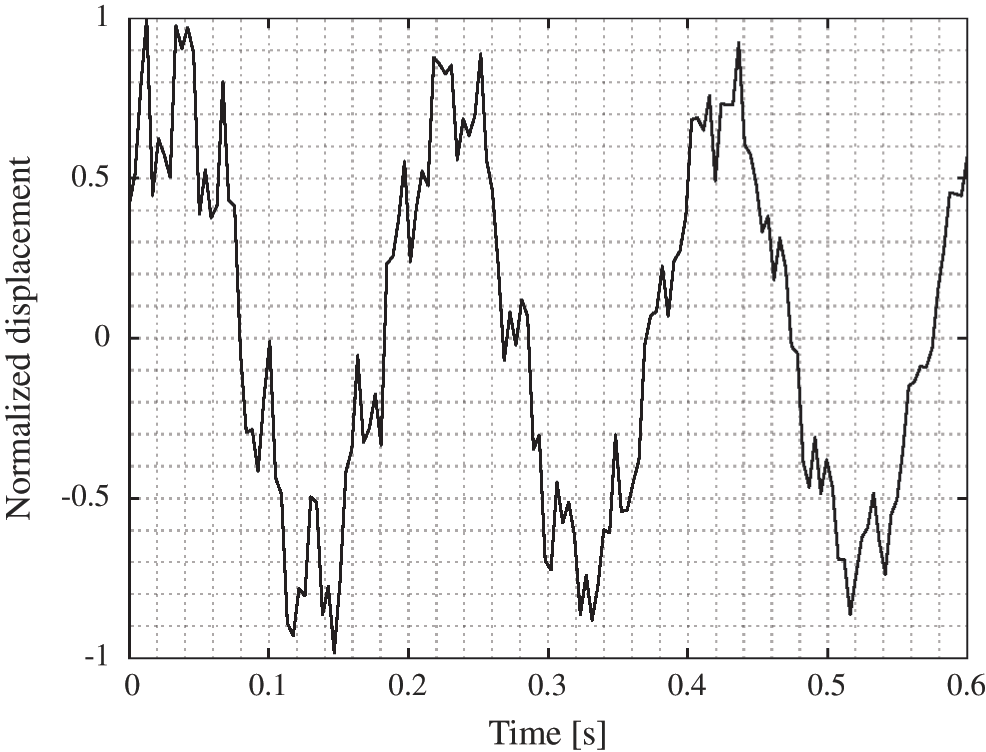
Figure 4: Normalized displacement of an arbitrary point on the beam

Figure 5: Fourier transform of the displacement signal
It’s important to mention here, that the graph presented in Fig. 4 was not able to be observed by naked eye without displacement exaggeration motion magnification technique. Actually, the exaggeration of the displacement allows us to accurately localise a particle in the processed recorded video.
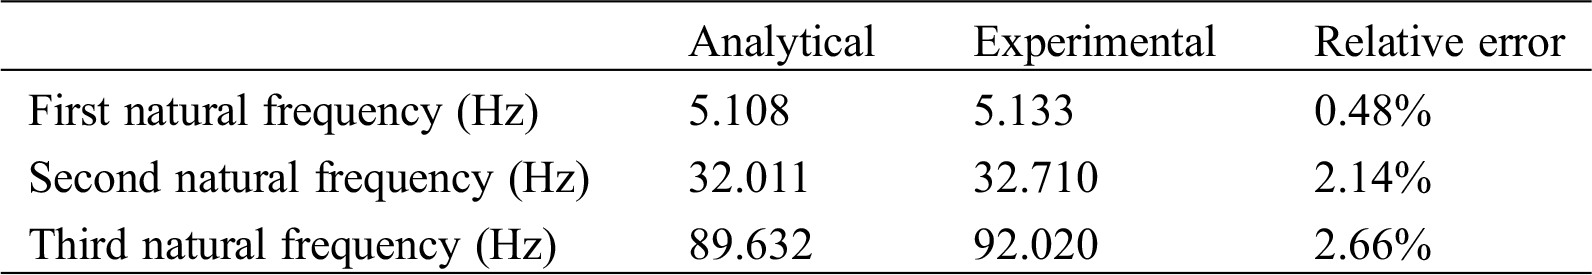
Tab. 1 presents the first three natural frequencies of the steel cantilever beam calculated using the analytical model and measured using the motion magnification technique. The relative error for the first natural frequency is 0.5%, while it is less than 2.7% for the second and third natural frequencies. Taking into consideration the uncertainties of the material properties and the manufacturing processes, these values are acceptable.
In order to highlight the accuracy of the obtained results, one can refer to Davis et al. [41] who measured the Young’s modulus of a steel cantilever beam using a high quality 2500 fps camera with an error between 10% to 15%. It is worth noted that the natural frequencies are directly related to the Young’s modulus as presented in Eq. (6).
Table 1: First three natural frequencies of the cantilever beam measured experimentally and calculated analytically
In order to avoid aliasing in the processed video, and according to the Nyquist limit, natural frequencies obtained from the video magnification technique are restricted to the half of the frame per second rate of the recorded video. Actually, the Nyquist limit is the highest recovered frequency for a given sampling frequency of a signal. Since we aim to recover natural frequencies from a video signal, the highest recovered natural frequency will be less than the half of the fps rate of the video.

According to Eq. (3), and since the recorded video has 240 fps, the maximum recovered natural frequency from the recorded video is 120 Hz. The first three mode shapes calculated analytically and measured experimentally are depicted in Figs. 6–8 respectively. A quick comparison shows a good match between these mode shapes.
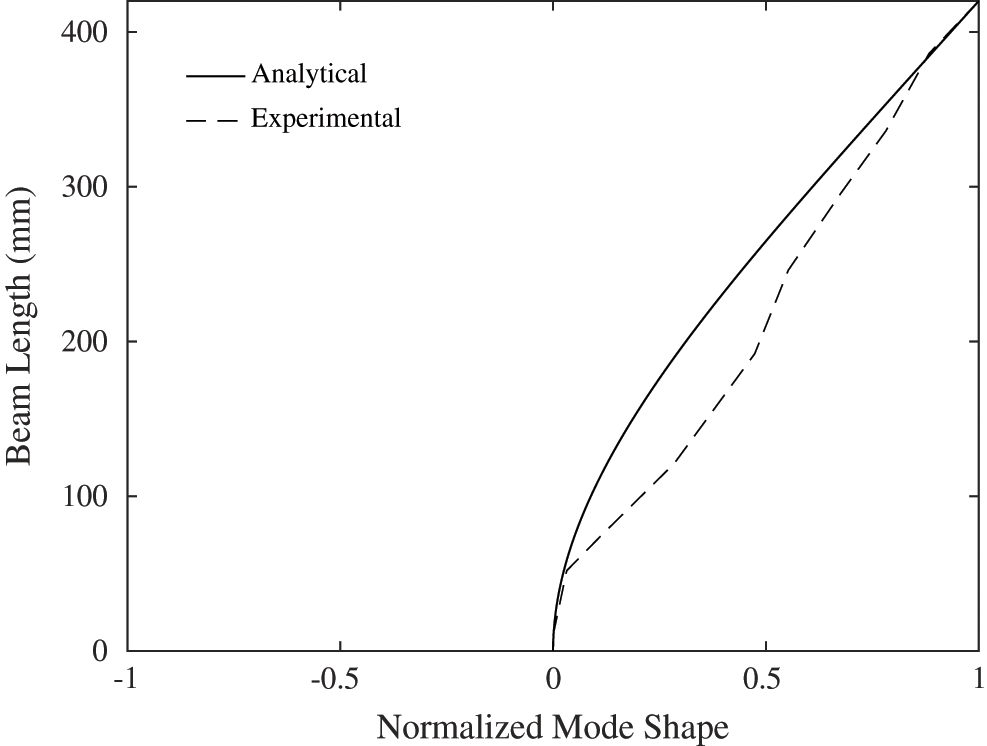
Figure 6: First mode shape of the cantilever beam
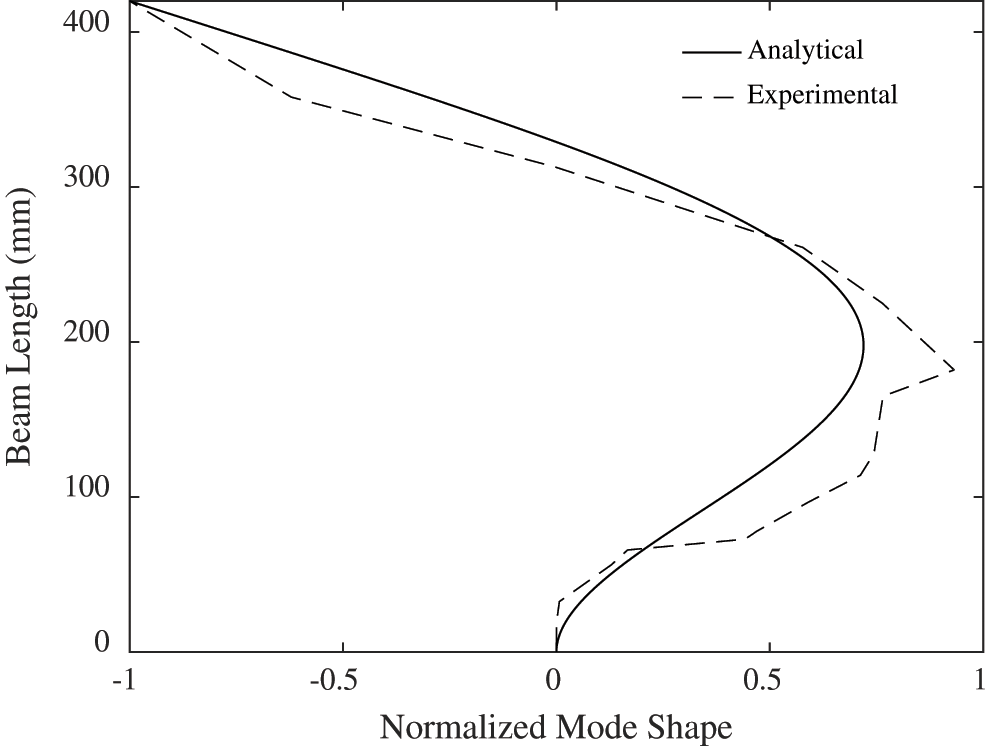
Figure 7: Second mode shape of the cantilever beam
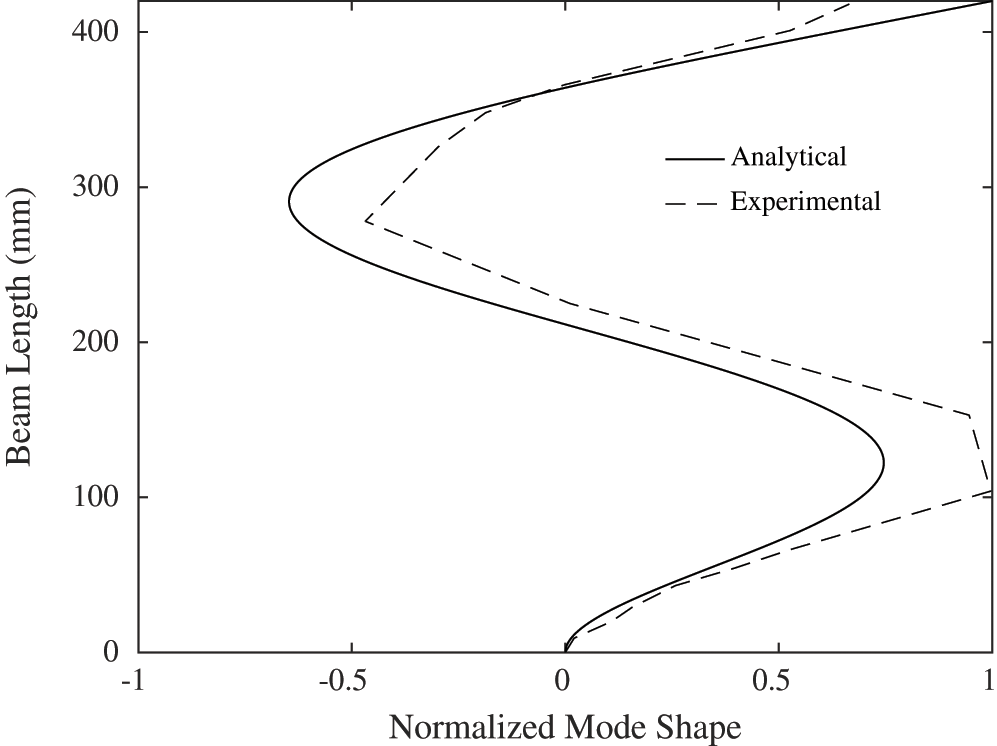
Figure 8: Third mode shape of the cantilever beam
The Modal Assurance Criterion (MAC) [1], used as a mode shape correlation constant to quantify the accuracy of identified mode shapes, is applied here to quantify the similarity of the mode shapes identified using the motion magnification and the analytical modelling. The MAC values vary between 0 and 1, where a value of 1 means a perfect match. A MAC value less than 0.77 indicates a poor resemblance of mode shapes. The MAC value of a mode shape is essentially the normalized dot product of the modal vector at each common node (i.e., points) as presented in Eq. (9):

where  and
and  represent the modal vectors identified using different techniques.
The calculated MAC values are 0.9802, 0.9513 and 0.8921 for the first, second and third mode shape, respectively. Thus, a consistent correspondence of the extracted mode shapes using the motion magnification technique is concluded.
In this paper, we have measured experimentally using an inexpensive smartphone built-in camera the vibration behaviour of a mechanical structure. The measured natural frequencies and their associated mode shapes were verified quantitatively and qualitatively over an analytical model. A natural frequencies relative error less than 2.7% and a MAC value greater than 0.89 for the low natural frequencies are enough to verify the feasibility and the accuracy of this procedure in the vibration behaviour analysis. For the same conditions, and in a low frequency range, this procedure can be applied on big structure such as buildings and bridges, where the cost of experimental vibration measurement increases quickly. The range of detected natural frequencies by the proposed procedure depends on the frame per second rate of the recorded video. This will not be a constraint in the case of big structure, since they have very low frequencies. Nowadays, relatively high fps built-in cameras are available in the market even for inexpensive smartphones; this will be an added value for our technique since it depends on the number of fps. Actually, as long as the structure fits into the camera frame, it can be analyzed. Taking advantage of the smartphone technology evolution, this procedure can be implemented in a smartphone application.
Funding Statement: The authors received no specific funding for this study.
Conflicts of Interest: The authors declare that they have no conflict of interest to report regarding the present study.
References
1. Ewins, D. (2000). Modal testing: Theory, practice, and application, vol. 2. Hertfordshire: Research Studies Press.
2. Maia, N. M. M., e Silva, J. M. M. (1997). Theoretical and experimental modal analysis. Hertfordshire: Research Studies Press. [Google Scholar]
3. Kranjc, T., Slavič, J., Boltežar, M. (2016). A comparison of strain and classic experimental modal analysis. Journal of Vibration and Control, 22(2), 371–381. DOI 10.1177/1077546314533137. [Google Scholar] [CrossRef]
4. Park, K. T., Kim, S. H., Park, H. S., Lee, K. W. (2005). The determination of bridge displacement using measured acceleration. Engineering Structures, 27(3), 371–378. DOI 10.1016/j.engstruct.2004.10.013.
5. Zhang, L., Lei, X., Jiang, J., Feng, Q. (2018). A study of the suitable measurement location and metrics for assessing the vibration source strength based on the field-testing data of Nanchang underground railway. Sound and Vibration, 52(5), 22–27. [Google Scholar]
6. Casciati, F., Fuggini, C. (2009). Engineering vibration monitoring by GPS: Long duration records. Earthquake Engineering and Engineering Vibration, 8(3), 459–467. DOI 10.1007/s11803-009-9058-8. [Google Scholar] [CrossRef]
7. Valin, J. L., Gonçalves, E., Palacios, F., Pérez, J. R. (2005). Methodology for analysis of displacement using digital holography. Optics and Lasers in Engineering, 43(1), 99–111. DOI 10.1016/j.optlaseng.2004.05.010. [Google Scholar] [CrossRef]
8. Zhuang, Y., Huaning, Z., Wenling, Z., Hefei, L. (2002). Application of the Fourier transform in electronic speckle photography. Experimental Mechanics, 42(1), 18–24. DOI 10.1007/BF02411047. [Google Scholar] [CrossRef]
9. Mandal, D. D., Wadadar, D., Banerjee, S. (2018). Performance evaluation of damage detection algorithms for identification of debond in stiffened metallic plates using a scanning laser vibrometer. Journal of Vibration and Control, 24(12), 2464–2482. DOI 10.1177/1077546316687956. [Google Scholar] [CrossRef]
10. Nassif, H. H., Gindy, M., Davis, J. (2005). Comparison of laser Doppler vibrometer with contact sensors for monitoring bridge deflection and vibration. NDT & E International, 38(3), 213–218. DOI 10.1016/j.ndteint.2004.06.012.
11. Saravanan, K., Sekhar, A. (2013). Crack detection in a rotor by operational deflection shape and kurtosis using laser vibrometer measurements. Journal of Vibration and Control, 19(8), 1227–1239. DOI 10.1177/1077546312444770. [Google Scholar] [CrossRef]
12. Cheli, F., Mazzoleni, P., Pezzola, M., Ruspini, E., Zappa, E. (2013). Vision-based measuring system for rider’s pose estimation during motorcycle riding. Mechanical Systems and Signal Processing, 38(2), 399–410. DOI 10.1016/j.ymssp.2013.01.009. [Google Scholar] [CrossRef]
13. Figueroa, P. J., Leite, N. J., Barros, R. M. (2006). Tracking soccer players aiming their kinematical motion analysis. Computer Vision and Image Understanding, 101(2), 122–135. DOI 10.1016/j.cviu.2005.07.006. [Google Scholar] [CrossRef]
14. Jurjo, D. L. B. R., Magluta, C., Roitman, N., Gonçalves, P. B. (2015). Analysis of the structural behavior of a membrane using digital image processing. Mechanical Systems and Signal Processing, 54, 394–404. DOI 10.1016/j.ymssp.2014.08.010. [Google Scholar] [CrossRef]
15. Park, S. W., Park, H. S., Kim, J. H., Adeli, H. (2015). 3D displacement measurement model for health monitoring of structures using a motion capture system. Measurement, 59, 352–362. DOI 10.1016/j.measurement.2014.09.063. [Google Scholar] [CrossRef]
16. Trigo, F. C., Martins, F. P., Fleury, A. T., Silva Jr., H. C. (2014). Identification of a scaled-model riser dynamics through a combined computer vision and adaptive Kalman filter approach. Mechanical Systems and Signal Processing, 43(1–2), 124–140. DOI 10.1016/j.ymssp.2013.10.005. [Google Scholar] [CrossRef]
17. Ji, Y. F., Chang, C. C. (2008). Nontarget image-based technique for small cable vibration measurement. Journal of Bridge Engineering, 13(1), 34–42. DOI 10.1061/(ASCE)1084-0702(2008)13:1(34). [Google Scholar] [CrossRef]
18. Ji, Y. F., Chang, C. C. (2008). Nontarget stereo vision technique for spatiotemporal response measurement of line-like structures. Journal of Engineering Mechanics, 134(6), 466–474. DOI 10.1061/(ASCE)0733-9399(2008)134:6(466). [Google Scholar] [CrossRef]
19. Lee, J. J., Shinozuka, M. (2006). A vision-based system for remote sensing of bridge displacement. NDT & E International, 39(5), 425–431. DOI 10.1016/j.ndteint.2005.12.003. [Google Scholar] [CrossRef]
20. Sładek, J., Ostrowska, K., Kohut, P., Holak, K. Gąska, A. et al. (2013). Development of a vision based deflection measurement system and its accuracy assessment. Measurement, 46(3), 1237–1249. DOI 10.1016/j.measurement.2012.10.021. [Google Scholar] [CrossRef]
21. Wadhwa, N., Rubinsten, M., Durand, F., Freeman, W. T. (2013). Phase-based video motion processing. ACM Transactions on Graphics, 32(4), 1–10. DOI 10.1145/2461912.2461966. [Google Scholar] [CrossRef]
22. Wu, H. Y., Rubinstein, M., Shih, E., Guttag, J. Dueand, F. et al. (2012). Eulerian video magnification for revealing subtle changes in the world. ACM Transactions on Graphics, 31(4), 1–8. DOI 10.1145/2185520.2185561. [Google Scholar] [CrossRef]
23. Mallinson, K. (2015). Smartphone revolution: Technology patenting and licensing fosters innovation, market entry, and exceptional growth. IEEE Consumer Electronics Magazine, 4(2), 60–66. DOI 10.1109/MCE.2015.2392954. [Google Scholar] [CrossRef]
24. Driller, M., Tavares, F., McMaster, D., O’Donnell, S. (2017). Assessing a smartphone application to measure counter-movement jumps in recreational athletes. International Journal of Sports Science and Coaching, 12(5), 661–664. DOI 10.1177/1747954117727846. [Google Scholar] [CrossRef]
25. Whiteson, D., Mulhearn, M., Shimmin, C., Cranmer, K., Brodie, K. et al. (2016). Searching for ultra-high energy cosmic rays with smartphones. Astroparticle Physics, 79, 1–9. DOI 10.1016/j.astropartphys.2016.02.002. [Google Scholar] [CrossRef]
26. Gómez-Tejedor, J. A., Castro-Palacio, J. C., Monsoriu, J. A. (2015). Frequency analyser: A new Android application for high precision frequency measurement. Computer Applications in Engineering Education, 23(3), 471–476. DOI 10.1002/cae.21618. [Google Scholar] [CrossRef]
27. Luxton, D. D., McCann, R. A., Bush, N. E., Mishkinf, M. C., Reger, G. M. (2011). mHealth for mental health: Integrating smartphone technology in behavioral healthcare. Professional Psychology: Research and Practice, 42(6), 505–512. DOI 10.1037/a0024485. [Google Scholar] [CrossRef]
28. Vashist, S. K., Schneider, E. M., Luong, J. H. (2014). Commercial smartphone-based devices and smart applications for personalized healthcare monitoring and management. Diagnostics, 4(3), 104–128. DOI 10.3390/diagnostics4030104. [Google Scholar] [CrossRef]
29. Yang, Y., Dorn, C., Mancini, T., Talken, Z. Kenyon, G. et al. (2017). Blind identification of full-field vibration modes from video measurements with phase-based video motion magnification. Mechanical Systems and Signal Processing, 85, 567–590. DOI 10.1016/j.ymssp.2016.08.041. [Google Scholar] [CrossRef]
30. Dorn, C. J., Mancini, T. D., Talken, Z. R., Yang, Y., Kenyon, G. et al. (2016). Automated extraction of mode shapes using motion magnified video and blind source separation. Topics in Modal Analysis & Testing, 10, 355–360. [Google Scholar]
31. Orak, M. S., Nasrollahi, A., Ozturk, T., Mas, D., Ferrer, B. et al. (2018). Non-contact smartphone-based monitoring of thermally stressed structures. Sensors, 18(4), 1250. DOI 10.3390/s18041250. [Google Scholar] [CrossRef]
32. Feng, D., Feng, M. Q. (2017). Experimental validation of cost-effective vision-based structural health monitoring. Mechanical Systems and Signal Processing, 88, 199–211. DOI 10.1016/j.ymssp.2016.11.021. [Google Scholar] [CrossRef]
33. Feng, D., Feng, M. Q. (2015). Vision-based multipoint displacement measurement for structural health monitoring. Structural Control and Health Monitoring, 23(5), 876–890. DOI 10.1002/stc.1819. [Google Scholar] [CrossRef]
34. Ce, L., Antonio, T., Freeman, W. T., Durand, F., Adelson, E. H. (2005). Motion magnification. ACM Transactions on Graphics, 24(3), 519–526. DOI 10.1145/1073204.1073223. [Google Scholar] [CrossRef]
35. Sand, P., Teller, S. (2004). Video matching. ACM Transactions on Graphics, 23(3), 529–599. DOI 10.1145/1015706.1015765. [Google Scholar] [CrossRef]
36. Horn, B., Schunck, B. (1981). Determining optical flow. Artificial Intelligence, 17(1–3), 185–203. DOI 10.1016/0004-3702(81)90024-2. [Google Scholar] [CrossRef]
37. Lucas, B., Kanade, T. (1981). An iterative image registration technique with an application to stereo vision. in Proceedings of the 7th International Joint Conference on Artificial Intelligence (IJCAI '81), Canada, 674–679. [Google Scholar]
38. Fleet, D., Jepson, A. (1990). Computation of component image velocity from local phase information. International Journal of Computer Vision, 5(1), 77–104. DOI 10.1007/BF00056772. [Google Scholar] [CrossRef]
39. Gautama, T., Van Hulle, M. (2002). A phase-based approach to the estimation of the optical flow field using spatial filtering. IEEE Transactions on Neural Networks and Learning Systems, 13(5), 1127–1136. DOI 10.1109/TNN.2002.1031944. [Google Scholar] [CrossRef]
40. Inman, D. J. (2014). Engineering vibration. Upper Saddle River, N.J., USA, Pearson Education. [Google Scholar]
41. Davis, A., Bouman, K. L., Chen, J. G., Rubinstein, M. Durand, F. et al. (2015). Visual vibrometry: Estimating material properties from small motion in video. The IEEE Conference on Computer Vision and Pattern Recognition, Boston, MA, USA. [Google Scholar]