DOI: 10.32604/sv.2021.010715
ARTICLE
Prediction and Limitations of Noise Maps Developed for Heterogeneous Urban Road Traffic Condition: A Case Study of Surat City, India
Civil Engineering Department, SVNIT, Surat, India
*Corresponding Author: Dipeshkumar R. Sonaviya. Email: dipeshsonaviya2589@gmail.com
Received: 22 March 2020; Accepted: 15 August 2020
Abstract: Road traffic noise pollution has been recognized as a serious issue which affects human health as well as affects urban regions. Noise maps are very beneficial to identify the impact of noise pollution. A noise mapping study performed to study the propagation of noise in tier-II city along with field measurements. The noise maps are developed using a computer simulation model (SoundPLAN essential 4.0 software). The noise prediction models like U.K’s CoRTN, Germany’s RLS-90, and their modified versions, which can be used for homogenous road traffic conditions, cannot be successfully applied in heterogeneous road traffic conditions of India. In developing country like India, road traffic noise pollution depends on the composition of heterogeneous traffic volume, variance in road geometrical, honking conditions, un-authorized parking, and varying density of the building on either side of the road. These traffic compositions contain vehicles, which have different sizes, speeds variations, a different dimension of vehicles. Because of fluctuating speeds, lack of lane disciplines, and un-authorized parking on main road lanes, honking events becomes inevitable, which changes and affects the urban soundscape of nations like India. Analysis of noise maps showed that horn honking due to un-authorized parked vehicles contributed an additional increase up to 11 dB (A) noise, which is quite significant.
Keywords: Noise level; noise mapping; prediction models; road traffic noise
In today’s era, urban roads in India are loaded with heavy traffic compassion linked with large groups of buildings spreading outside the original city zones [1]. Traffic noise has been the main issue in counties like India. Traffic noise is the most important source of environmental noise pollution in the urban region; therefore, many countries have introduced noise emission limits for vehicles and legislation to control the traffic noise [2]. Prediction of noise pollution due to traffic compositions related to such larger cities is a very curious topic [3]. Noise due to transportation and infrastructure poses a formidable challenge to the environmentalist [4]. Noise mapping of the urban region is a very beneficial method in view of noise control and sustainability [5]. Noise maps can be beneficial in classifying noise sources [6]. In a developing nation like India, the urban environments show varying characteristics of traffic as compared to a developed nation [7].
The noise prediction models like a U.K’s CoRTN, Germany’s RLS-90 for traffic noise can be very useful for urban road design and assessment of current traffic noise conditions [8]. The noise indices such as Leq, L10, L50, L90, etc. are required for the prediction models, set by nations government bodies to predict the sound pressure levels [9]. There are many softwares available for noise mapping and these types of softwares have basic tools for environment mapping [10]. In present study, noise mapping has been done using SoundPLAN essential 4.0 software for two different zones of Surat city.
The study area selected for noise mapping was Surat city (tier-II city). The city covers an area about 326.515 sq.km and divided in seven zones. These seven zones include different activities such as business, residence, commerce, and industrial. Out of the seven zones, South-West zone and West zone were selected for the study purpose because these zones include diversified activities of business, residence, commerce. Zones with land use involving industrial activity were kept beyond the scope of this research work [11].
In West zone, three road stretches of 1 km each forming a triangle were selected (see Fig. 1). These zones contain all type of activities which can be affected by vehicular noise pollution. Activity refers to schools, colleges, hospitals, commercial areas, and residential areas. Five different locations of Surat city have been chosen for the filed study (Fig. 1). Survey locations along the left side of Gujarat gas circle to Dhanmora complex is named as A1 and along the right side is named as B1. In the same way survey location along with the left side of Gujarat gas circle to Rushbh Tower is name as B2 and along the right-side name as A2. Also, Arterial road connecting these two arterial roads is named as C.
In the South-West zone, selected study area for the survey was 5 km stretch of Athwa-Dumas corridor and 4 km stretch of Udhna-Magdalla because these corridors contain all types of activities which can be affected by vehicular noise pollution (see Fig. 2). Activity refers to schools, colleges, hospitals, commercial areas, and residential areas. Noise monitoring was done at 31 locations in and around these two arterial roads with traffic volume study and traffic speed study. Survey locations along the left side of the Athwa-Dumas corridor are named as A1, A2 … to A8 and along the right side of the Athwa-Dumas corridor are named as B1, B2 … to B8. In the same way, survey locations along the left side of the Magdalla-Udhna corridor are named as A9, A10 … to A14 and along the right side named as B9, B10, … to B14. Also, the sub-arterial roads connecting these two arterial roads are named as C1, C2 and C3.
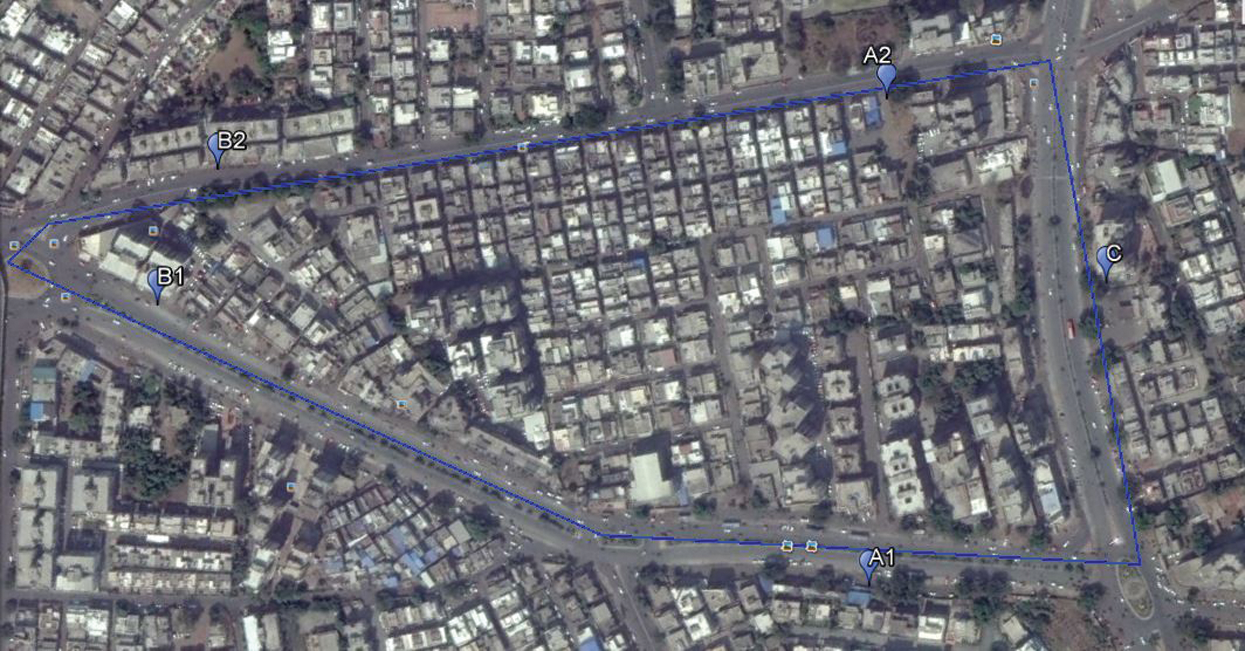
Figure 1: Map of West zone of Surat city showing study area
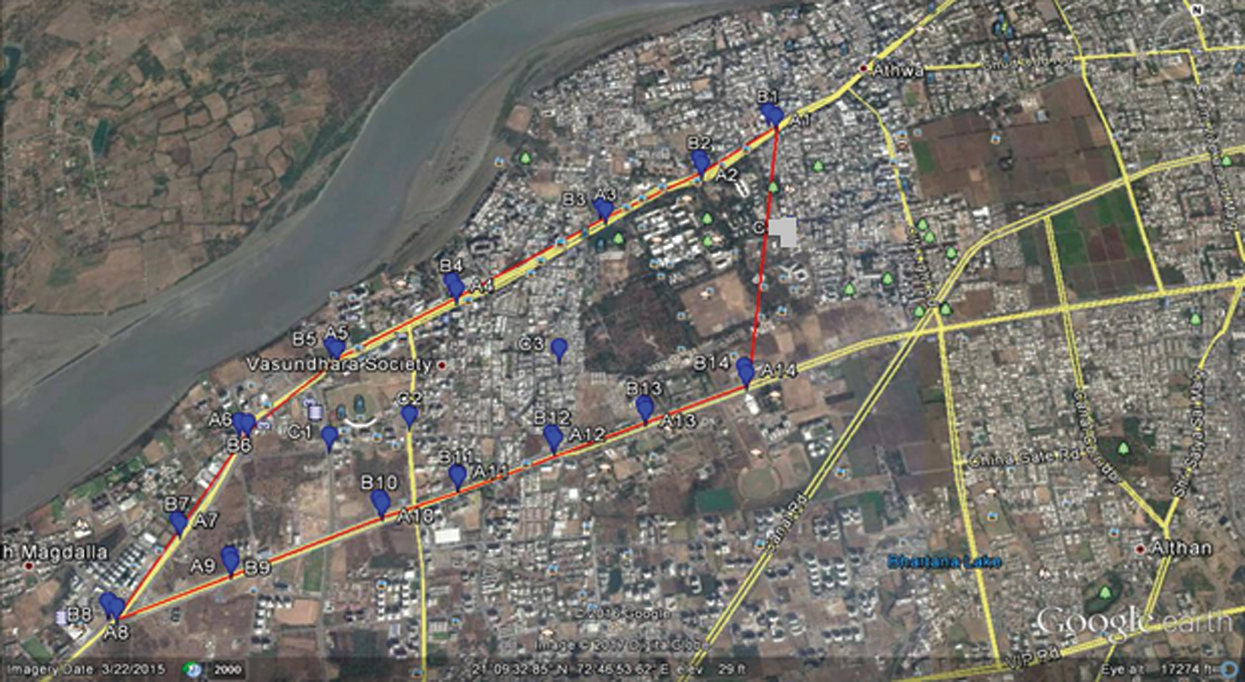
Figure 2: Map of South-West zone of Surat city showing study area
1.2 Methodology and Data Collection
Noise monitoring was done at 5 locations in West zone and 31 locations in South-West zone in arterial roads of Surat city, with traffic volume, traffic speed, numbers of horns, and un-authorized parking counts. Residential as well as commercial buildings are located just on the roadside and these buildings are minimum 3 storeys and maximum 13 stories.
Measurements were carried out from Monday to Friday, the working days. Noise data were collected by using the KIMO DB 300/2 (see Fig. 3), automatic sound level meter for 24-hour duration. Monitoring was divided into two parts as per CPCB guidelines, day time (6:00 to 22:00 hrs) and night time (22:00 to 06:00 hrs) [12]. The calibrator was used to calibrate the sound level meter for each measurement. The sound level meter was put on a tripod at 1.2 m above the floor level. The vehicle was divided into five categories like 2-wheelers (motorcycle, mopeds), 3-wheelers (autorickshaw), 4-wheelers (cars), bus, and truck.
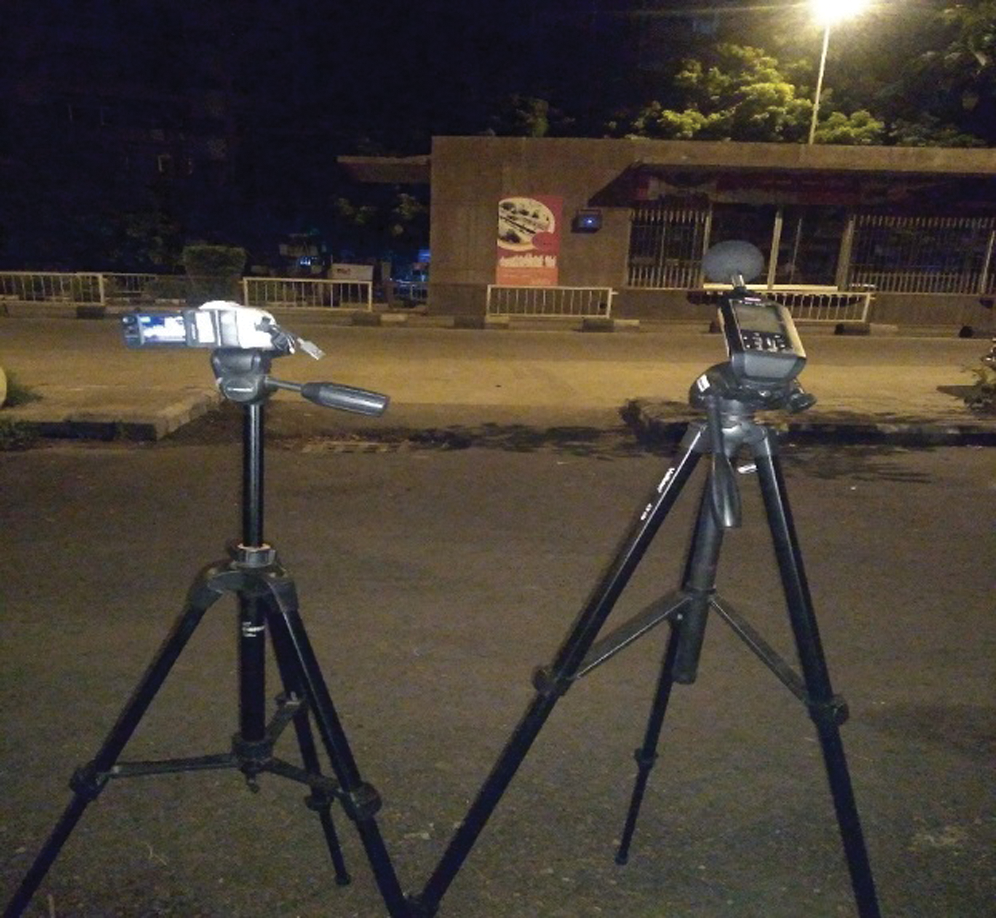
Figure 3: View of Sound level meter at site
The number of vehicles were counted that crossed the point of noise measurement from either direction on the road and vehicles were recorded by videography [13,14]. For each road stretch, through the day time (6:00 to 22:00 hrs) and night-time (22:00 to 06:00 hrs), total horn events and un-authorized parked vehicles were counted manually. The speeds of individual vehicles were also taken with a hand-held radar gun (see Fig. 4) along with the noise level.
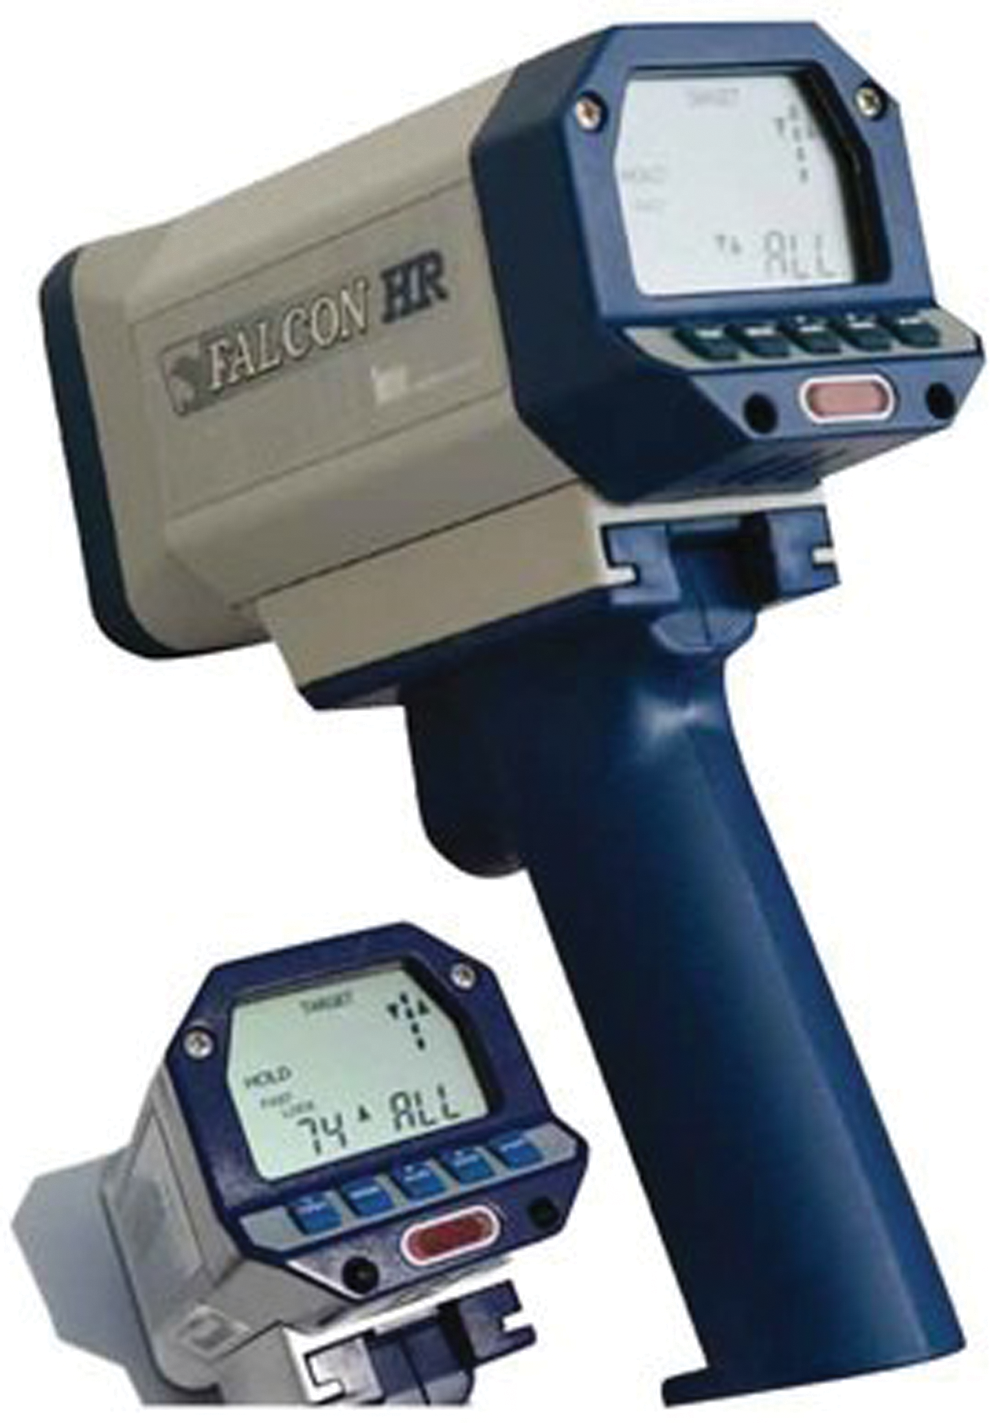
Figure 4: View of Radar gun
The data extraction process consists of four parts: namely noise level data, traffic (count & speed), and number of horns, un-authorized parking data. Noise levels (LAeq) and other noise indices (L10, L50, L90, L95) collected and stored in the automatic precision sound level meter, automatically generates a complete data sheet of all necessary noise data and statistics in a user-friendly way.
For developing road traffic noise model, it is essential to associate noise levels with sound generation, sound propagation, and sound reception [15,16]. Every model needs significant features such as the source of noise, the path of noise propagation, and the receiver on which it can be observed [17,18]. The noise source data consist of the flow rate of the vehicle, average vehicle speed, road gradient, and the characteristics of the road [19–21]. The propagation path comprises the distance of the receiver from source, the average height of propagation above the road surface, the road surface characteristics, the angle of view of the source from the receptor and reflecting surface near to the source [22,23]. The geometry features of road and buildings were measured manually [24].
Buildings were developed manually on the bitmap. The heights of the buildings was taken as 3.5 meters per floor. Residential as well as commercial buildings were located just on the roadside and these buildings were minimum 3 storeys and maximum 13 storeys. The traffic data was acquired by on site observation for traffic counts. The speed of the vehicle was taken using a radar gun and observed between 35 and 45 kmph during day and night. A further assumption in the computation was that all road and motorway surfaces are constructed of impervious bitumen and that all the measurements were taken only during, i.e., Monday to Friday [25–27].
To develop noise map, country-wise road calculation models such as RLS-90 from Germany, CoRTN:88 from UK, NMPB:2008 from France, TNM2.5 from US, etc., are available in SoundPLAN essential 4.0 software [28]. There are two noise propagation model such as RLS-90, CoRTN:88, are useful to develop road traffic noise map. Because these two noise models having urban road inventory features. Data required for mapping are noise data (LAeq24 hr, L10, L90, Lden, Lmax, Lmin), road inventory data, geometric features of mapping area, category wise traffic counts, category-wise vehicles speed, meteorological data such as wind velocity, humidity, temperature, air pressure [29]. The digital ground model was developed using tool available in SoundPLAN essential 4.0 software. The file supported to developed base ground models is a bitmap, DXF, ESRI Shapefile or ASCII. Bit maps of South-West zone and West zone of Surat city were imported and digitized in SoundPLAN.
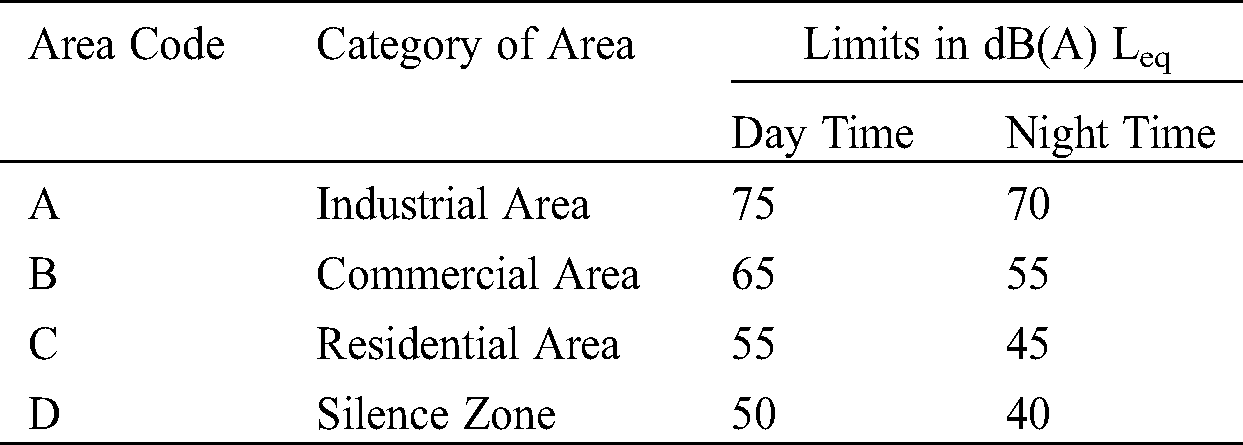
All the features of buildings were drawn and identified using tools available in SoundPLAN essential 4.0 such as road making tool, building making tool, receiver tool, calculation selection area tool, etc. Around 1600 building in South-West zone and 400 buildings in West zone of Surat city were drawn manually and ground elevation height for all buildings was taken from the Google Earth Pro. These buildings were a minimum of 3 stories and a maximum of 13 stories. The height of one floor considered was 3.50 meter so the minimum building height is 10.5 meter and the maximum is 45.5 meter. Traffic volume data, speed, and road inventory were given as per the model requirement. Receiver positions were input in the base map and identify its noise limit as per Central Pollution Control Board (CPCB) guideline (see Tab. 1). Noise propagation models were selected as per requirement. Calculation area (affected area) has been selected on its map. After the end of this lengthy procedure, noise maps were generated.
Table 1: Noise Level Standards (Noise Pollution Rules-2012)
The day time (6:00 to 22:00 hrs) and night-time (22:00 to 6:00 hrs) LAeq values measured at the site and predicted by RLS-90 and CoRTN:88 of SoundPLAN essential 4.0 are presented at Tabs. 1 and 2.
Also, four different noise maps, which are shown in Figs. 5 to 8, were generated for day time and night time using RLS-90 and CoRTN:88 propagation models of SoundPLAN essential 4.0 software.
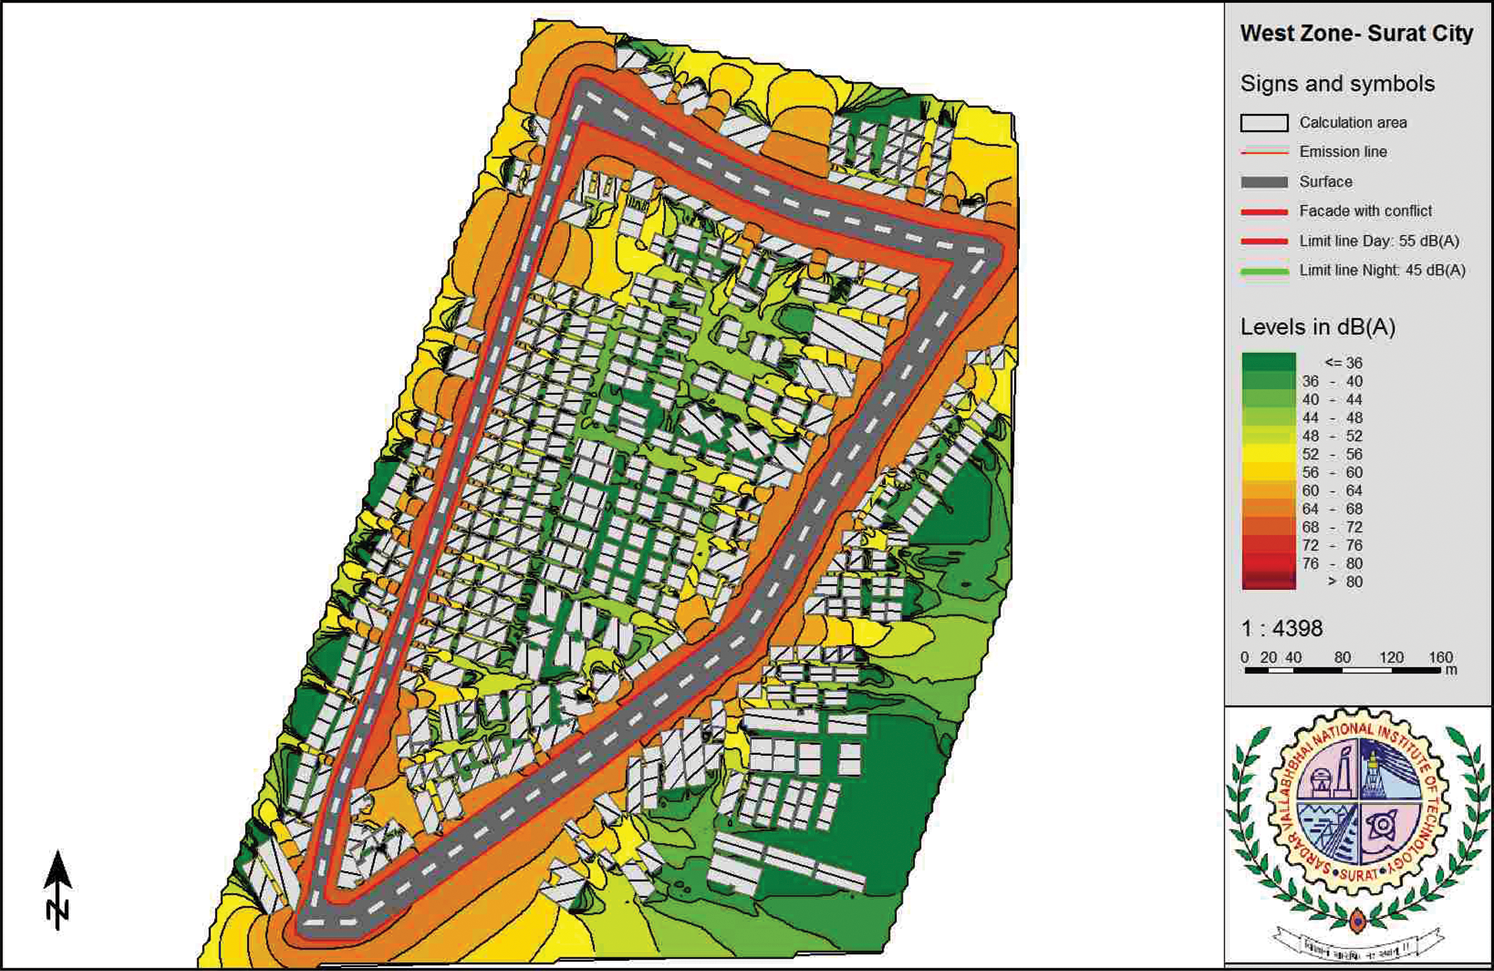
Figure 5: Day time noise map of West zone using RLS-90
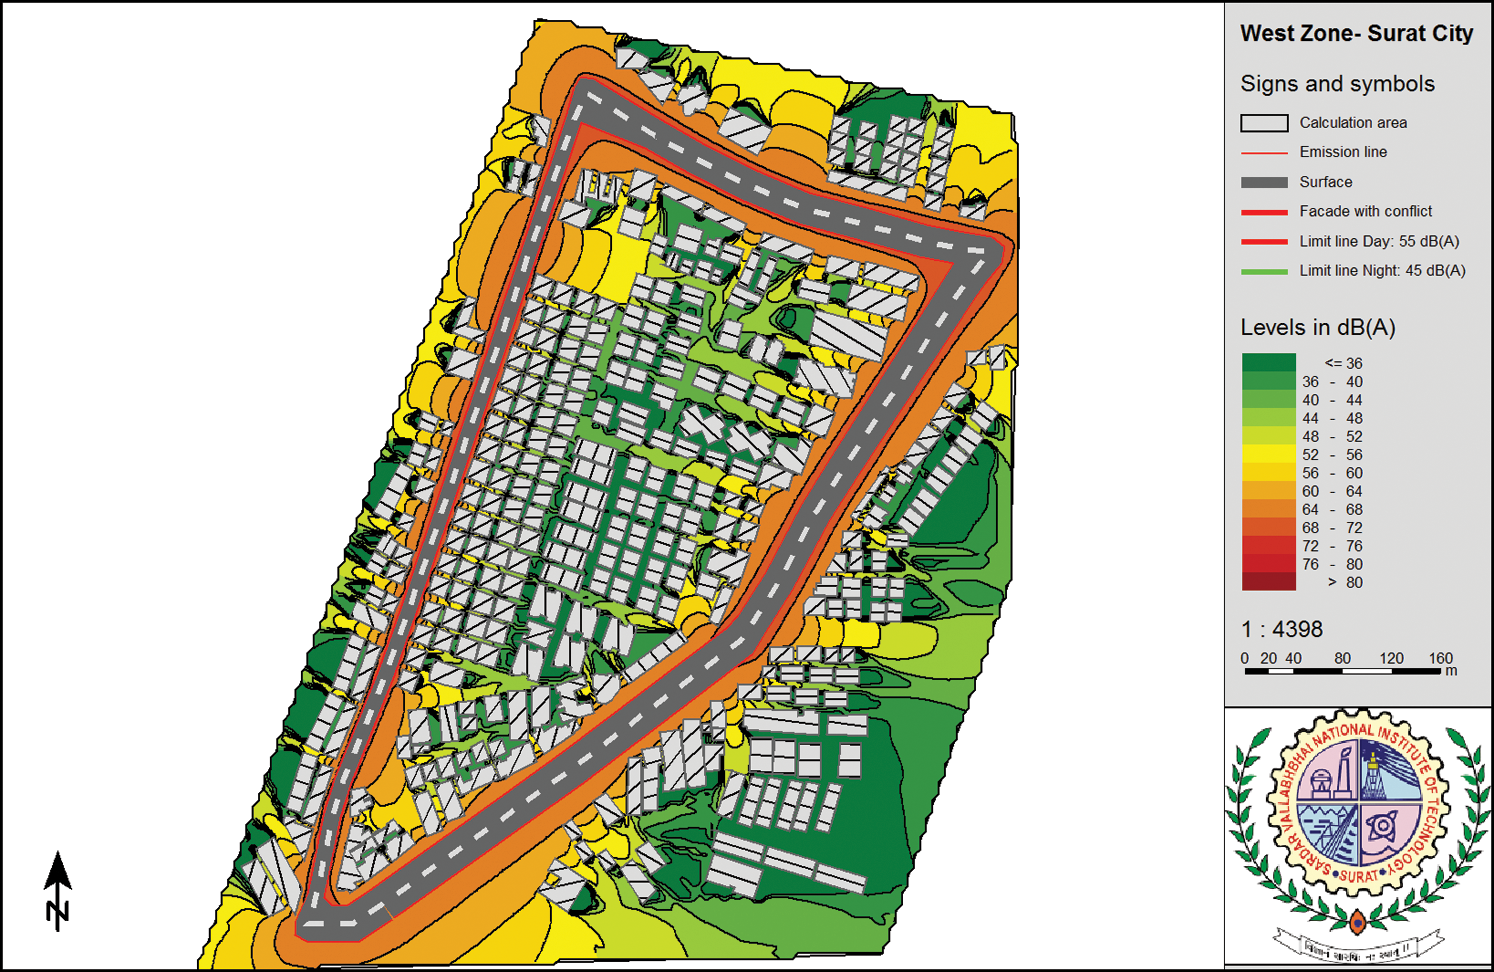
Figure 6: Day time noise map of West zone using CoRTN: 88
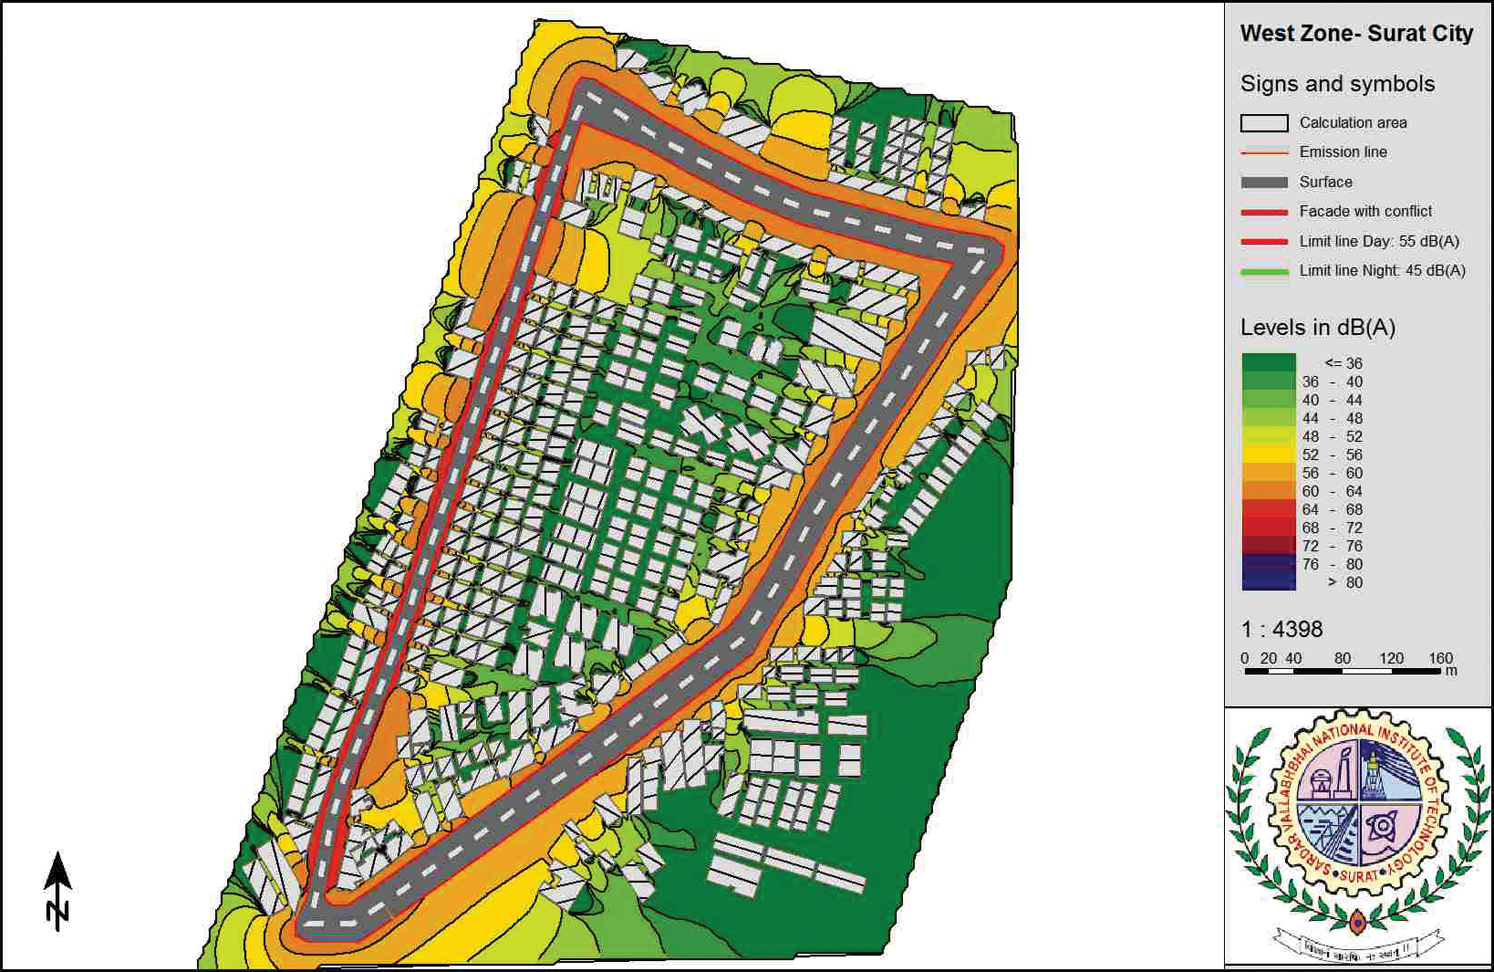
Figure 7: Night time noise map of West zone using RLS-90
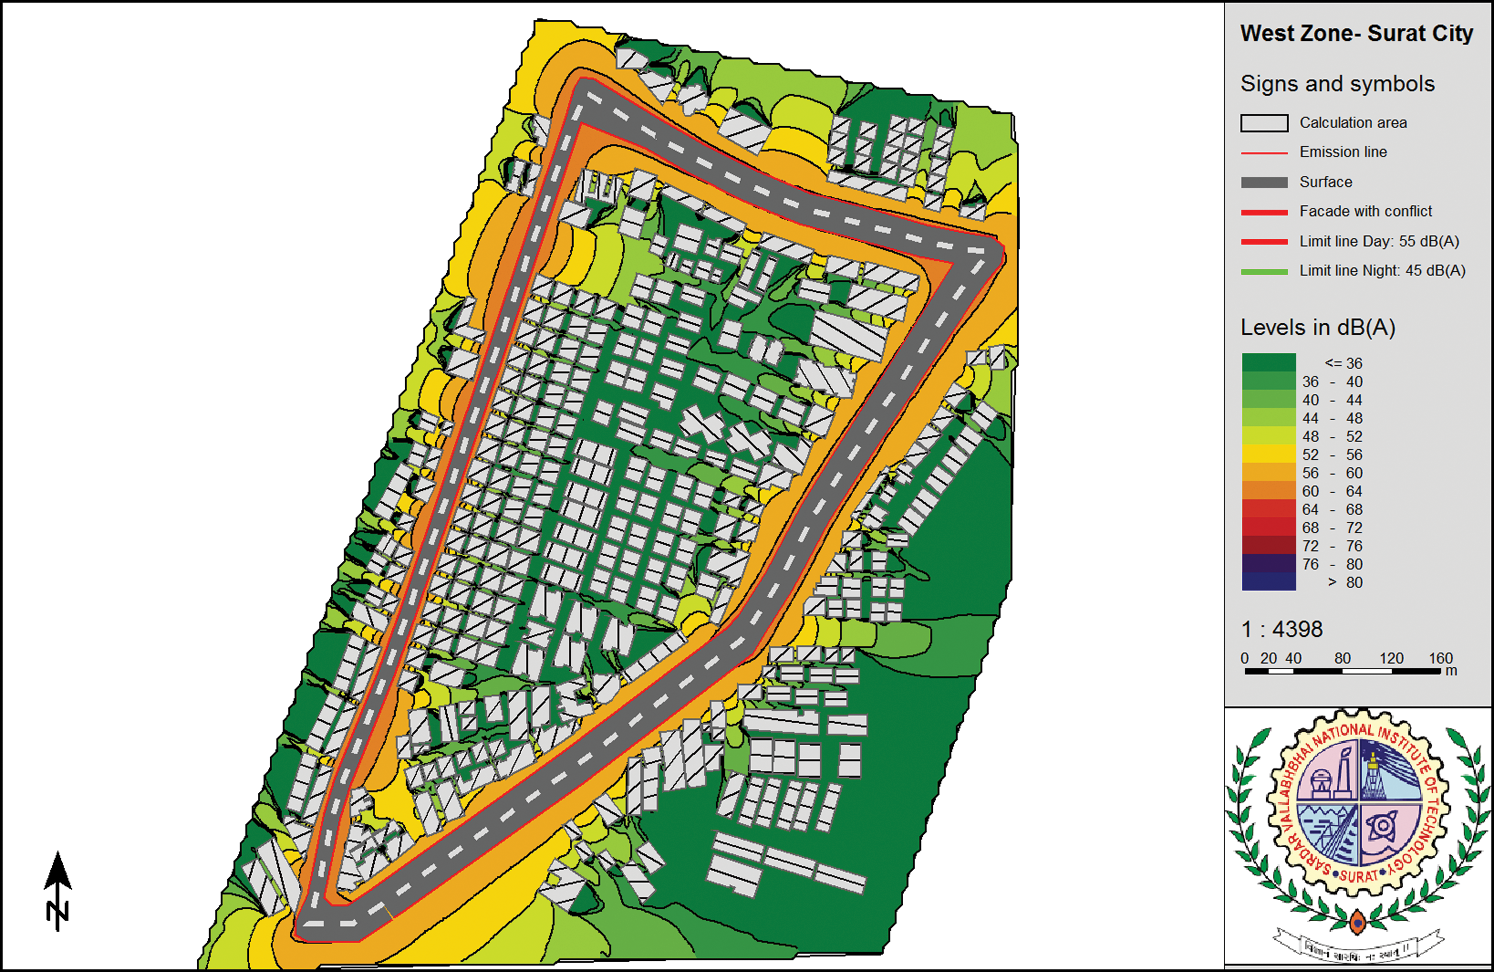
Figure 8: Night time noise map of West zone using CoRTN: 88
Tabs. 2 and 3 depict the difference between measured LAeq and predicted LAeq by a different model. CoRTN: 88 uses bituminous road surface and having vehicle speed greater than 75 kmph, whereas on Indian urban roads such vehicles speed is never observed. This is reflected in the prediction values given by CoRTN: 88, where LAeq values are underpredicted by up to 13 dBA as compared to actual values. RLS-90 model having use of the point source technique and comprises ground attenuation, screening, and reflection.
Table 2: Day-time predicted values
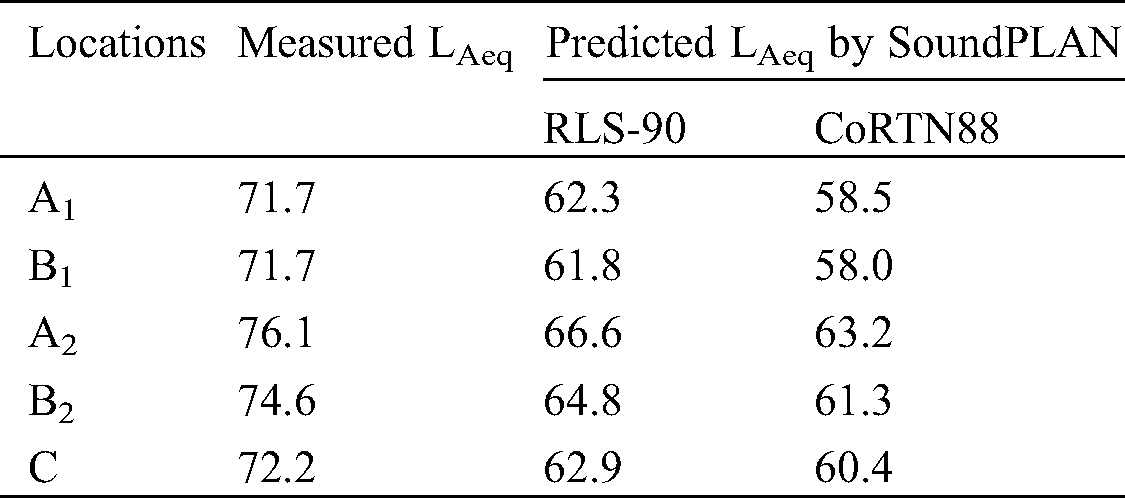
Table 3: Night time predicted values
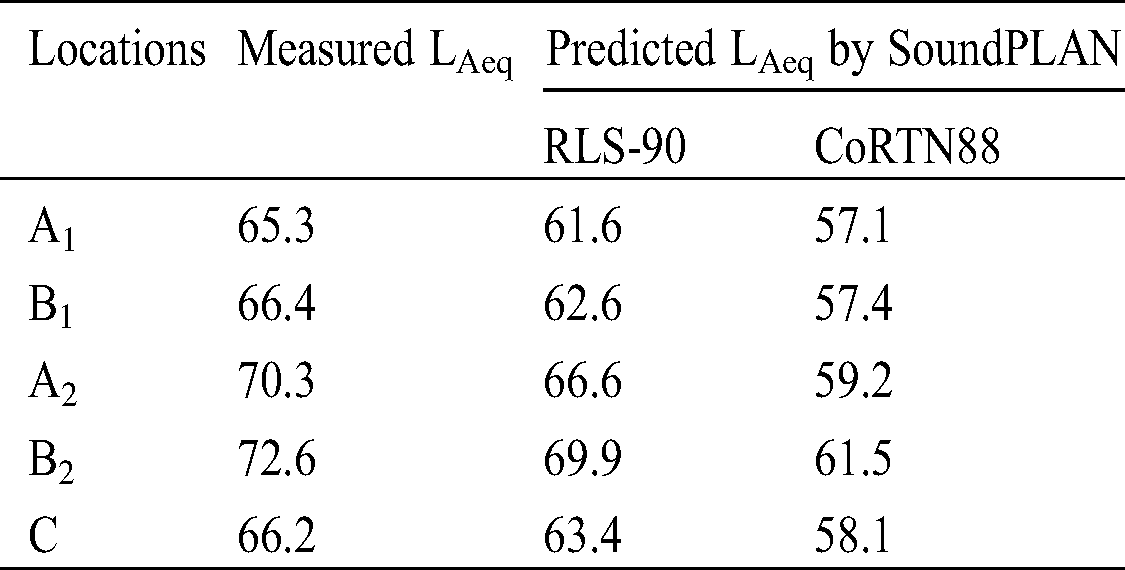
Tabs. 2 and 3 depict the difference between measured LAeq and predicted LAeq by different models. CoRTN: 88 is designed for a bituminous surface having vehicle velocity greater than 75 kmph, whereas on Indian urban roads such vehicles speed is never observed. This is reflected in the prediction values given by CoRTN: 88, where Leq values are under predicted by up to 13 dB(A) as compared to actual values. RLS-90 model uses the point source method and includes ground attenuation, screening and reflection.
LAeq values predicted by RLS-90 are nearer to observed (actual) values and has the difference of up to 10 dB(A). Hence, among all available noise propagation models in SoundPLAN essential 4.0 software, RLS-90 proved to be the best for homogenous traffic conditions. Therefore, RLS-90 was used to develop a noise map for South-West zone of Surat city (Figs. 9 and 10).
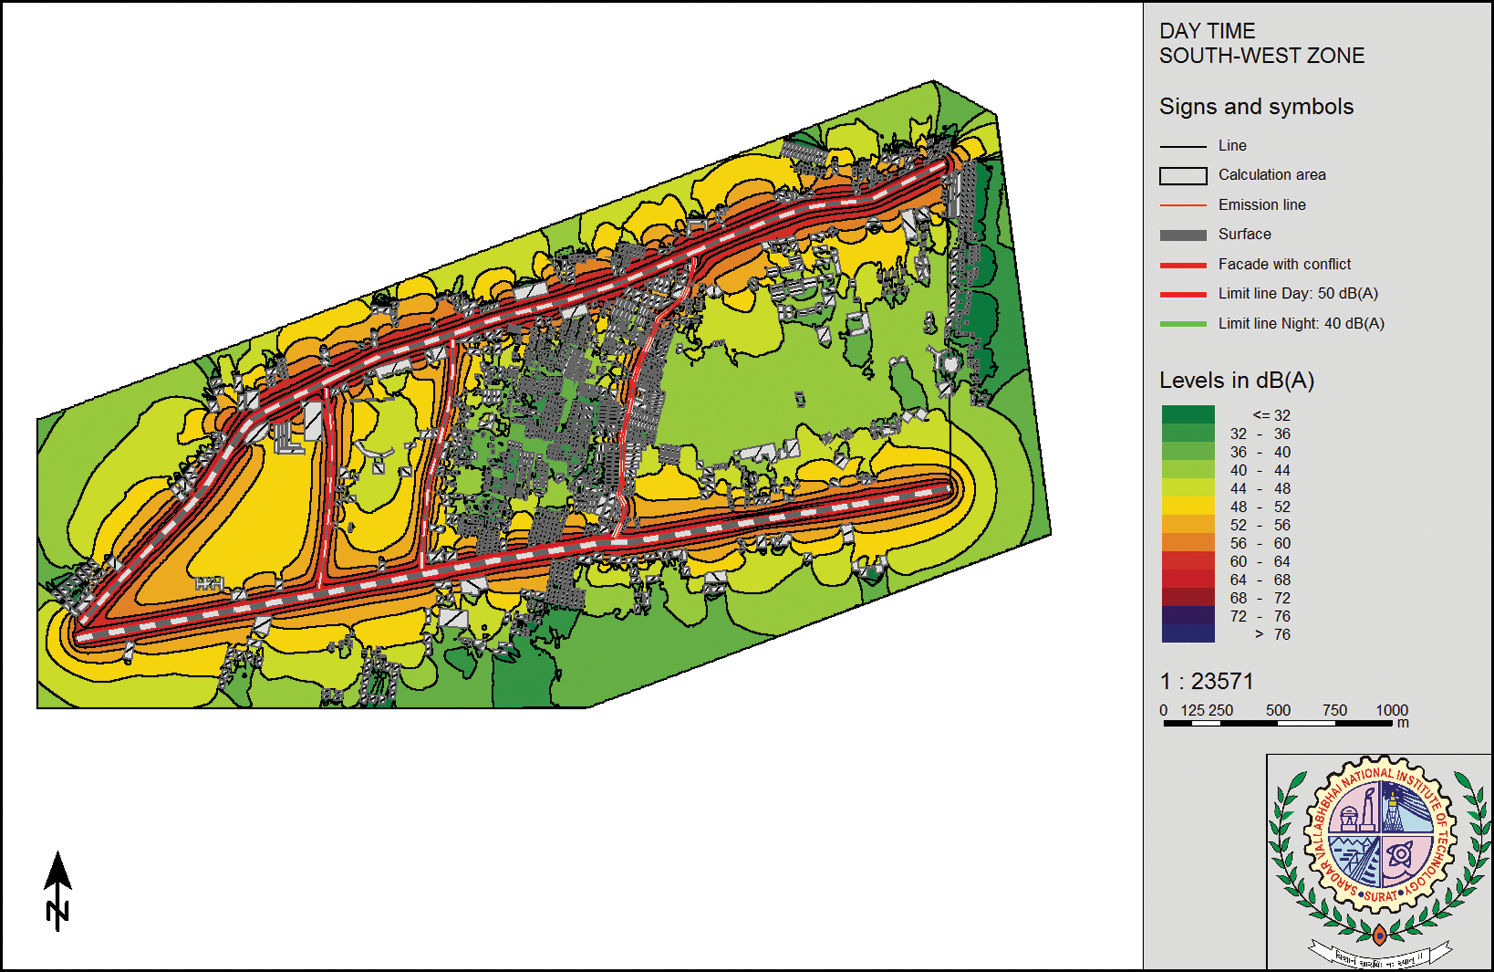
Figure 9: Day time noise map of South-West zone using RLS-90
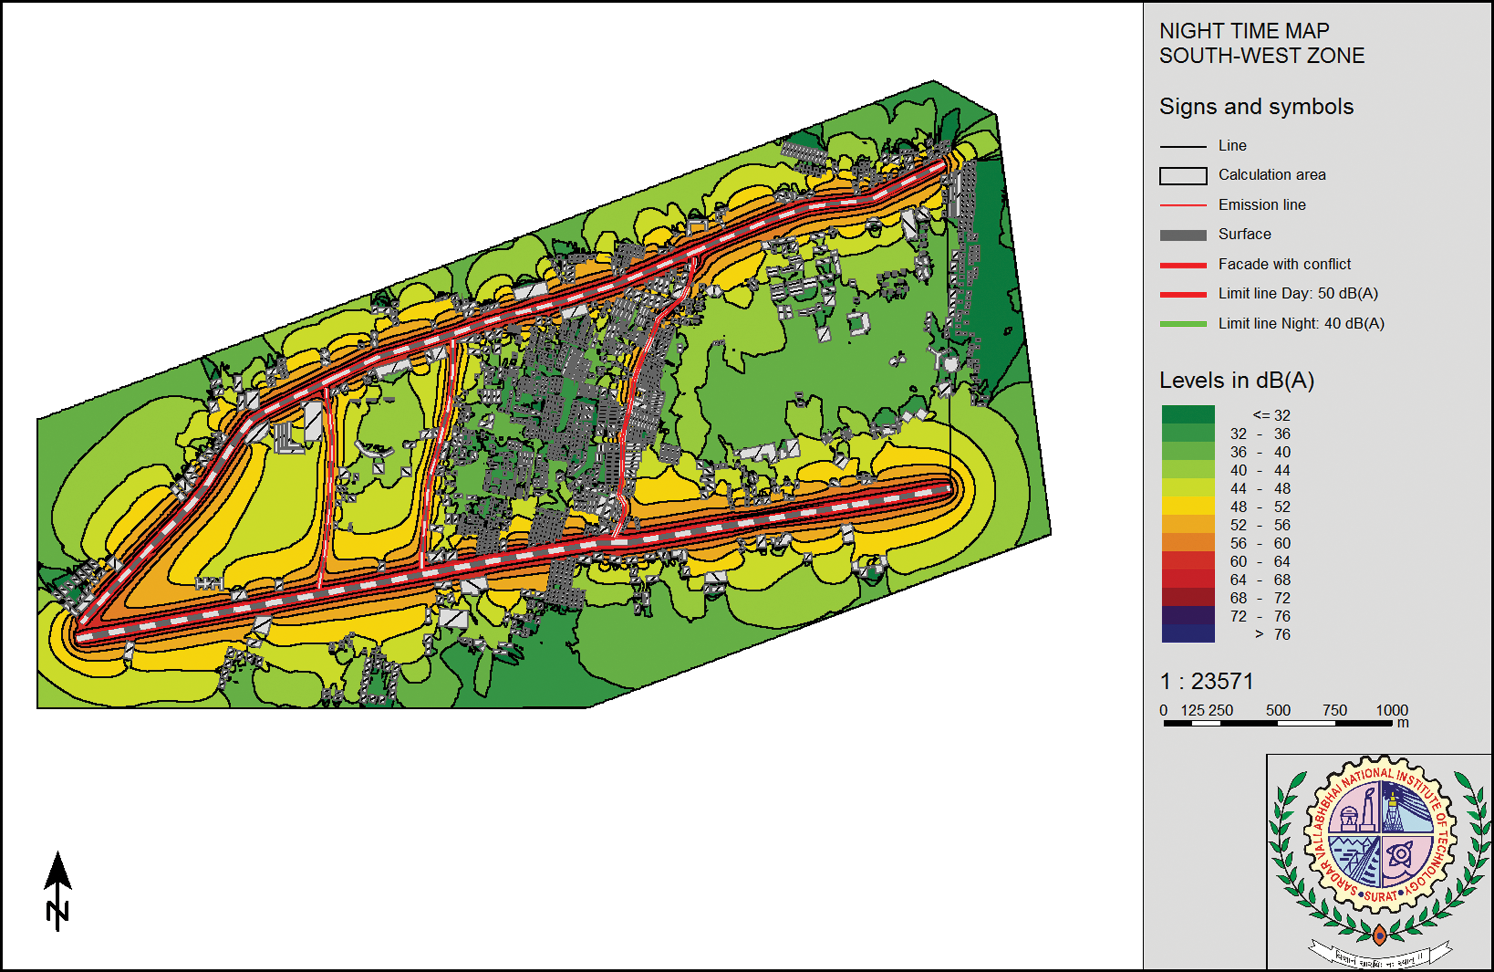
Figure 10: Night time noise map of South-West zone using RLS-90
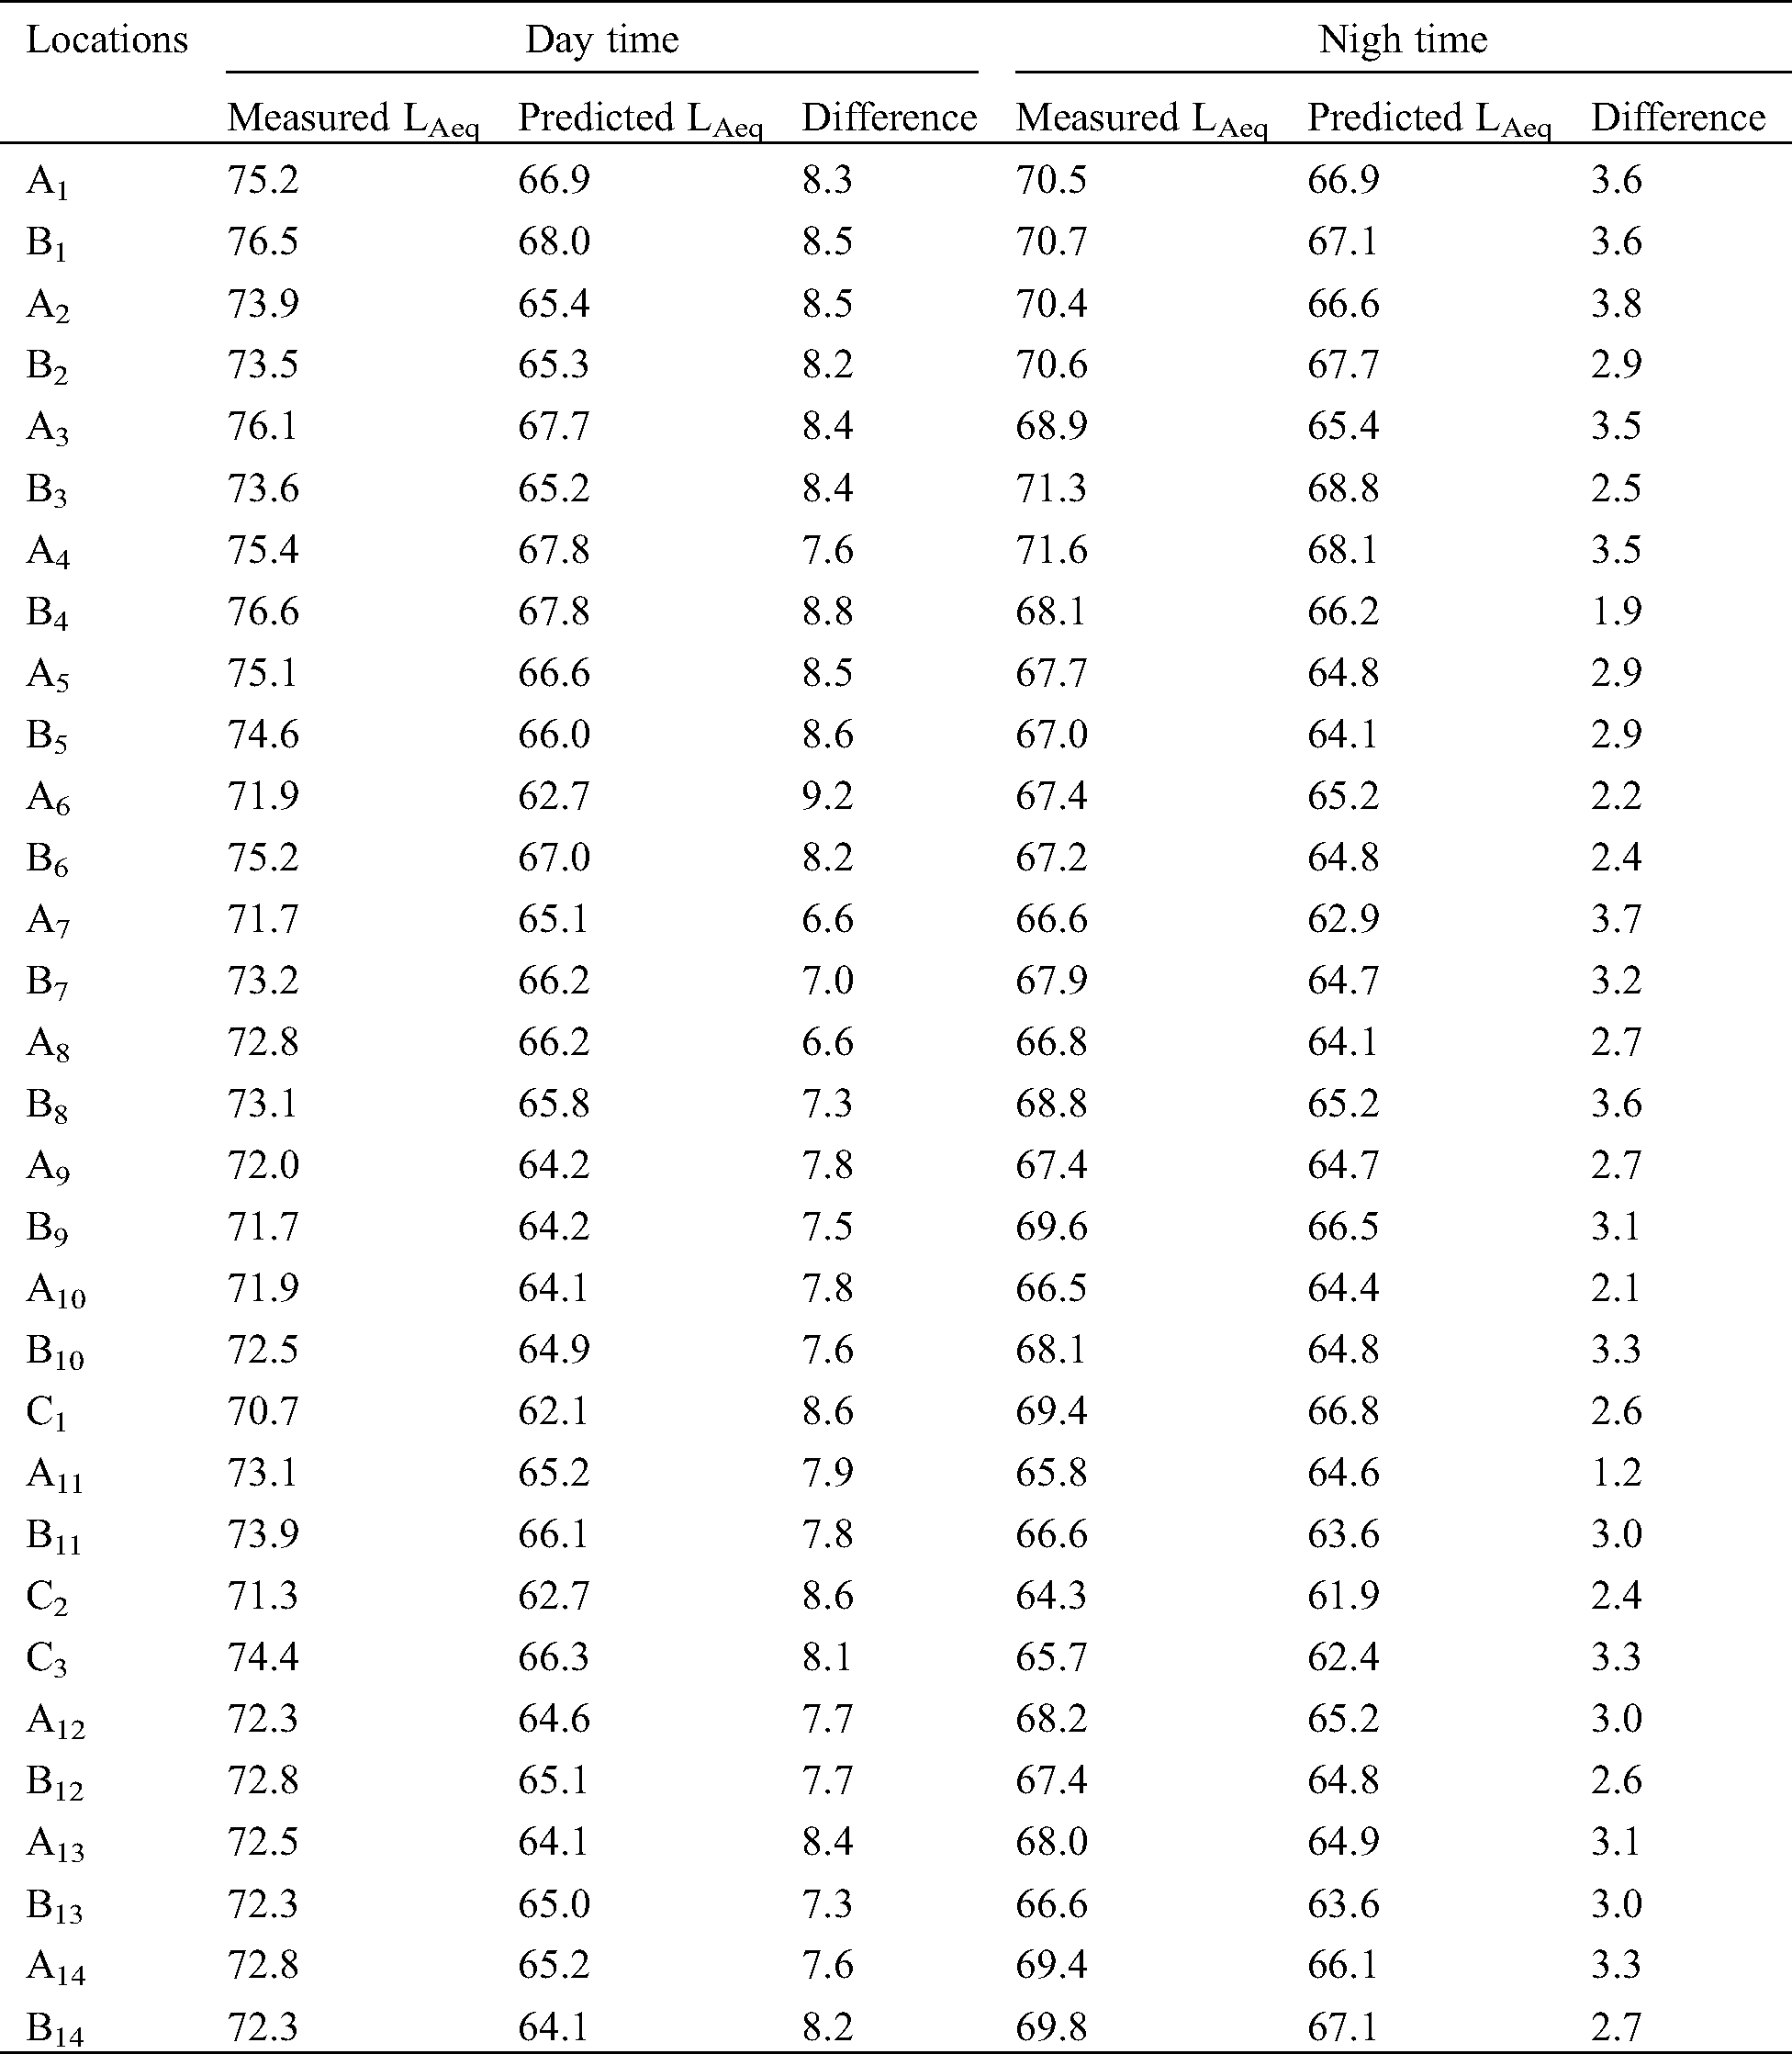
Tab. 4 depict the difference of up to 9 dB(A) at South-West zone using RLS-90 model when compared to measured data. The results show a significant difference from the measured noise levels which are due to the fact that these inbuilt models of SoundPLAN essential 4.0 inherently assume homogeneous traffic conditions with higher speeds, wider roads, and no conjunction, whereas Indian traffic conditions are heterogeneous, lesser speeds and narrow roads.
Table 4: Difference between Measured LAeq and Predicted LAeq (South-West zone)
Residential as well as commercial buildings are located just on the roadside and enough parking space is not available. Therefore, people park vehicles on the main road. Also, due to the widely fluctuating vehicular dimensions, the composition of vehicles, speed of vehicles, lack of lane disciplines, and un-authorized parking on main road lane in heterogeneous road traffic conditions, horn honking becomes imperative. It changes the soundscape of the city considerably as compared to other cities of developed countries. Therefore, a model considering the factors o Indian urban condition such as heterogeneity, un-authorized parking, horn honking conditions should be developed, which probably may bring down the difference between predicted and measured values.
Globally, there have been number of excellent and precise traffic noise prediction models developed in last 15–20 years. This includes FHWA in USA, CoRTN in UK, RLS-90 in Germany, and TNM in USA. Noise prediction models developed for highways-expressway cannot be applied to urban road traffic noise conditions. Hence, RLS-90, which is inbuilt in SoundPLAN essential 4.0 software, was selected.
This RLS-90 takes into account many variables, which are responsible for noise generation/mitigation viz. hourly traffic flow, vehicle speed, road type, road geometry, and obstacles. This study has undergone exhaustive data collection and extraction for preparation of noise prediction models/maps, around 0.5 million noise readings. However, inspite of this quantum of data, the error between predicted and measured noise levels comes at around 4 to 11 dB(A).
On critically analyzing, it can be concluded that a slightly high error is due to the fact that RLS-90 is a prediction model developed for homogenous traffic conditions, whereas in country like India, heterogeneous traffic conditions prevail, which is in high contrast to western countries.
Due to varied vehicular dimension and composition, accelerating-decelerating speed, lack of lane discipline and un-authorized parking on roads, horn honking becomes imperative. These two significant parameters viz. number of horn counts and un-authorized parking may be the leading cause of higher error percentage between observed and predicted noise values. Kalaiselvi et al. [2] applied a new horn correction factor in existing RLS-90 prediction model using level of service of the road as the input parameter for horn honking.
There are many reasons for horn honking. After the actual observation on many streets of urban roads, it was found out that the major reason for horn honking is the occupancy of un-authorized parked vehicles on the side kerbs. Hence, a new horn correction factor of un-authorized parked vehicles in the RLS-90 model can be developed, which will be the extension/upgradation of RLS-90 model in heterogeneous traffic conditions.
Acknowledgement: I am thankful to S.V. National Institute of Technology, Surat for cooperation and assistance.
Funding Statement: The author(s) received no specific funding for this study.
Conflicts of Interest: The authors declare that they have no conflicts of interest to report regarding the present study.
1. Abbaspour, M., Golmohammadi, R., Nassiri, P., Mahjub, H. (2016). An investigation on time-interval optimization of traffic noise measurement. Journal of Low-Frequency Noise Vibration & Active Control, 25(4), 267–273. DOI 10.1260/026309206779884883. [Google Scholar] [CrossRef]
2. Kalaiselvi, R., Ramachandraiah, A. (2016). Honking noise corrections for traffic noise prediction models in heterogeneous traffic conditions like India. Applied Acoustics, 111, 25–38. DOI 10.1016/j.apacoust.2016.04.003. [Google Scholar] [CrossRef]
3. Tandel, B., Macwan, J., Ruparel, P. (2011). Urban corridor noise pollution: A case study of Surat city. India International Conference on Environment and Industrial Innovation, vol. 12, pp. 144–148, India. [Google Scholar]
4. Borelli, D., Repetto, S., Schenone, C. (2014). Noise mapping of the flyover highway in Genoa: Comparison of different methods. Noise Mapping, 1(1), 59–73. DOI 10.2478/noise-2014-0007. [Google Scholar] [CrossRef]
5. Gwenael, G., Can, A., Petit, G., Fortin, N., Palominos, S. et al. (2016). Noise mapping based on participative Measurements. Noise Mapping, 3, 140–156. [Google Scholar]
6. Naish, D. (2010). A method of developing regional road traffic noise management strategies. Applied Acoustics, 71(7), 640–652. DOI 10.1016/j.apacoust.2010.02.009. [Google Scholar] [CrossRef]
7. Colakkadıog, D., Yucel, M. (2017). Modeling of Tarsus-Adana-Gaziantep highway-induced noise pollution within the scope of Adana city and estimated the affected population. Applied Acoustics, 115, 158–165. [Google Scholar]
8. Petrovici, A., Tomozei, C., Flores, R., Nedeff, L., Irimia, O. (2015). Noise prediction, calculation and mapping using specialized software. Journal of Engineering Studies and Research, 21, 59–64. [Google Scholar]
9. Zhu, L., Li, X., Jiang, C., Liu, L. Wu, R. et al. (2015). Rapid modeling method for road traffic noise sources: A case study in Beijing. Noise Mapping, 2(1), 276. DOI 10.1515/noise-2015-0003. [Google Scholar] [CrossRef]
10. Ascari, E., Licitra, G., Teti, L., Cerchiai, M. (2015). Low frequency noise impact from road traffic according to different noise prediction methods. Science of the Total Environment, 505, 658–669. DOI 10.1016/j.scitotenv.2014.10.052. [Google Scholar] [CrossRef]
11. Vijay, R., Sharma, A., Chakrabarti, T., Gupta, R. (2015). Assessment of honking impact on traffic noise in urban traffic environment of Nagpur. Journal of Environmental Health Science and Engineering, 13(10), 407. DOI 10.1186/s40201-015-0157-3. [Google Scholar] [CrossRef]
12. Central Pollution Control Board. (2017). Noise rules-2000. http://cpcb.nic.in/noise-standards-rules/. [Google Scholar]
13. Arana, M., Martin, R., Salinas, J. (2014). People exposed to traffic noise in European agglomerations from noise maps. A critical review. Noise Mapping, 1(1), 40–49. DOI 10.2478/noise-2014-0005. [Google Scholar] [CrossRef]
14. Alías, F., Rosa, A., Orga, F., Socoro, J. (2018). Detection of anomalous noise events for real-time road-traffic noise mapping: the DYNAMAP’s project case study. Noise Mapping, 5(1), 71–85. DOI 10.1515/noise-2018-0006. [Google Scholar] [CrossRef]
15. Ibrahim, S. (2016). Noise mapping of the University of Technology. Journal of Engineering and Sustainable Development, 20, 1–6. [Google Scholar]
16. Abbaspour, M., Golmohammadi, R., Nassiri, P., Mahjub, H. (2016). An investigation on time-interval optimisation of traffic noise measurement. Journal of Low-Frequency Noise Vibration & Active Control, 25(4), 267–273. DOI 10.1260/026309206779884883. [Google Scholar] [CrossRef]
17. Schlatter, F., Piquerez, A., Habermacher, M., Ragettli, S., Roosli, S. et al. (2017). Validation of large scale noise exposure modelling by long-term measurements. Noise Mapping, 4(1), 75–86. DOI 10.1515/noise-2017-0006. [Google Scholar] [CrossRef]
18. Sonaviya, D., Tandel, B. (2019). 2-D noise maps for tier-2 city urban Indian roads. Noise Mapping, 6(1), 1–7. DOI 10.1515/noise-2019-0001. [Google Scholar] [CrossRef]
19. Akhtar, N., Ahmad, K., Gangopadhyay, S. (2012). Road traffic noise mapping and a case study for Delhi region. International Journal of Applied Engineering and Technology, 2(4), 39–45. [Google Scholar]
20. Dal, Z., Yugruk, N., Akda, G. (2011). Noise disturbance caused by outdoor activities—A simulated-environment study for Ali Sami Yen Stadium, İstanbul. Journal of Environ Monit Assess, 174(1–4), 347–360. DOI 10.1007/s10661-010-1462-z. [Google Scholar] [CrossRef]
21. Jeong, J., Nazli, C., Otsuru, T., Hyung, C. (2010). An application of a noise maps for construction and road traffic noise in Korea. International Journal of the Physical Sciences, 5(7), 1063–1073. [Google Scholar]
22. Ibrahim, S. (2016). Noise mapping of The University of Technology. Journal of Engineering and Sustainable Development, 20, 115–124. [Google Scholar]
23. Lee, J., Gu, J., Park, H., Yun, H. Kim, S. et al. (2014). Estimation of populations exposed to road traffic noise in districts of Seoul metropolitan area of Korea. International Journal of Environmental Research and Public Health, 11(3), 2729–2740. DOI 10.3390/ijerph110302729. [Google Scholar] [CrossRef]
24. Ryu, H., Park, K., Chun, B., Chang, S. (2017). Spatial statistical analysis of the effects of urban form indicators on road-traffic noise exposure of a city in South Korea. Applied Acoustics, 115, 93–100. DOI 10.1016/j.apacoust.2016.08.025. [Google Scholar] [CrossRef]
25. Silvia, R., Ricardo, H., Luis, C. J. (2003). Evaluation and prediction of noise pollution levels in urban areas of Cdiz (Spain). Acoustical Society of America Journal, 114, 2439. [Google Scholar]
26. Sukru, D., Celalettin, O. (2006). Noise pollution and map of Konya city in Turkey. Journal of International Environmental Application & Science, 1(2), 63–72. [Google Scholar]
27. Seong, J., Park, H., Seo, J., Chang, I., Kim, M. et al. (2011). Modeling of road traffic noise and estimated human exposure in Fulton County, Georgia, USA. Environment International, 37(8), 1336–1341. DOI 10.1016/j.envint.2011.05.019. [Google Scholar] [CrossRef]
28. Tahlyan, D., Ohri, A. (2015). GIS based simplistic noise prediction model for urban areas. International Journal of Civil, Structural, Environmental and Infrastructure Engineering Research and Development, 5(1), 75–82. [Google Scholar]
29. Wazir, A. (2011). GIS based assessment of noise pollution in Guwahati City of Assam, India. International Journal of Environmental Sciences, 2, 743–751. [Google Scholar]
 | This work is licensed under a Creative Commons Attribution 4.0 International License, which permits unrestricted use, distribution, and reproduction in any medium, provided the original work is properly cited. |