DOI: 10.32604/sv.2021.011639
ARTICLE
Assessment of Noise Exposure of Sawmill Workers in Southwest, Nigeria
1Department of Mechanical Engineering, Ladoke Akintola University of Technology, Ogbomoso, Nigeria
2Department of Civil Engineering, Ladoke Akintola University of Technology, Ogbomoso, Nigeria
3Department of Systems Engineering, University of Lagos, Lagos, Nigeria
4Department of Mechanical Engineering, Adeleke University, Ede, Nigeria
*Corresponding Author: Abiola O. Ajayeoba. Email: aoajayeoba@lautech.edu.ng
Received: 21 May 2020; Accepted: 11 November 2020
Abstract: Economic wood processing employs the use of industrial machines for cutting, shaping, milling, and sawing timber, thereby leading to the generation of high levels of noise. Published data from empirical studies have categorized noise as an environmental hazard of global significance. Furthermore, noise exposure limits for different industries and all the industrial machines available has not been formally established as it presently exists in developed nations around the world. Therefore, this study assessed the daily exposure of sawmills workers to noise in Southwestern Nigeria. Reconnaissance surveys were first carried out in Osun, Oyo, Ondo, Ekiti, Lagos, and Ogun States to select sawmills that were fully operational and fit for the study. Two fully functional sawmills in two cities of each State were eventually selected for data collection, making a total of 24 sawmills, while the Circular Machines (CM), Planer Machines (PM), and Band-saw Machines (BM) were the machines in each sawmill considered. Two machines each of CM, PM, and BM were considered in each sawmill, making a total of forty-eight (48) machines each of CM, PM, and BM. Sound data were collected between 7 am and 7 pm each day for six days (between Monday and Saturday) using Extech 407732 sound level meter and all stabilized measurements were taken three times at different intervals. The data collected were in three different periods: Machine No-work Period (NPm), Machine Idle Period (IPm), and Machine Working Period (WPm). A two–way Analysis of Variance (ANOVA) was carried out at P < 0.05 to determine whether there is a significant difference in the sound level average before and after the break, for both the idle and working periods of the three machines considered. This was also done to determine whether there is a significant difference between the sound level average of the results collected during idle and working periods of the three machines. Noise Pollution Levels (Lnp) ranged from 83.20 dB (PM) to 107.65 (BM) and 93.42 (CM and PM) – 116.00 (BM) respectively, while IPm also gave the least noise pollution level of 95.79 dB and WPm gave the highest level of 102.88 dB. The results revealed that all the machines’ Lnp values in the working period are more than the 90 dB acceptable limit the recommendation value of 90 dB while 89.6% of CMs, 75% of PMs, and 89.6% of BM had their Lnp above 90 dB in the idle period respectively. The minimum and the maximum noise dose levels for IPm, WPm and overall are 0.09 (BM) and 2.37 (CM), 0.50 (CM), and 4.77 (PM) and 0.69 (BM) and 6.64 (PM) respectively. The study found out that the fundamental contributing factors to the high noise levels in sawmills are poor machine maintenance, use of old and obsolete machines, poor housekeeping strategy, limited space, workers’ negligence, lack of PPE, and lack of occupational safety training. The study recommends that proper workplace practices such as use of personal protective equipment, new and modern machines, training, and occupational safety programmes be implemented in the considered sawmills.
Keywords: Sawmills; machines; noise; exposure; pollution; wood
Noise is generally defined as an undesirable or an unpleasant sound whose origin can be traced to the Latin word “nausea”, which means seasickness [1]. It is also an unwanted sound that can harm our physical, sociological, and psychological well-being [2,3]. The alarming rate at which factory and production workers become exposed to very high levels of noise has now become an issue of global concern because studies have revealed that these unchecked exposures are predisposing factors for other serious health challenges [4]. This assertion was further buttressed by Skenberg et al. [5,6] where the studies argued that noise is one of the sources of pollution; it is also a special kind because of its invisible nature. Furthermore, the increasing rate of urbanization has also been implicated as the primary reason for the ever-increasing levels of environmental noise globally [7]. In fact, it has been reported as a common hazard in many industries, especially in the sawmill industry [8].
Consequently, economic wood processing is one of the results or off-springs of urbanization, because economic wood processing employs the use of industrial machines for cutting, shaping, milling and sawing timber everyday [9]. Also, wood processing occurs in sawmills and exposure to noise in sawmills is perhaps the most intense and prolonged level of noise experienced daily. The level could either be short or varied in some instances, but are equally as damaging [10]. Traditionally, this industry is known as one of the most dangerous repetitive work settings, labour-intensive and production oriented industries [8,11]. Its labor intensive nature could result in highly physical activities which could be at variance with health and safety procedures, thereby leading to increased physical risk factors for sawmill workers [12]. Mong’are et al. [11] reported that the physical risk factors which sawmill workers can become exposed to are noise, dust and slip.
Furthermore, the industries that are mostly exposed to noise pollution are metal, timber, base metal, paper, construction and fiber industries [13]. Anjorin et al. [14] reported that over 30 million workers in the United States of America and 4 to 5 million workers in Germany get exposed to noise levels defined as hazardous by the World Health Organization standards [15]. Occupational noise exposure has now become a common public health hazard in work settings [16–18]. This public health hazard is one of the universally recognized predisposing factors for hearing loss in workplaces and Noise–induced Hearing Loss (NIHL) is responsible for 16% of adult-onset hearing losses globally [19–21]. NIHL is one of the commonest occupational hazards in many nations, especially in the developing nations of the world. NIHL was a leading cause for compensatory payments between the year 2000 and 2002 in Thailand [8,22]. However, there are no reported NIHL compensatory payments in Nigeria to date [23].
Noise levels generated by sawmills in operation may vary from 80 dB to 120 dB and studies have shown that prolonged exposures to high levels of noise can result in some health and workplace challenges, such as acoustic trauma, tinnitus, temporary threshold shift, permanent threshold shift, interference with the communication between employees, mental stress, irritation, cardiac disorders, high blood pressure, ulcer, asthma, pregnancy disorders, learning disabilities in children, loss of efficiency and concentration, sleep disturbance, vertigo, speech problems and migraines [8,22,24–27].
Thus, this study will determine the daily personal noise exposure level of sawmill workers, noise pollution level of the machines, and daily dose.
This study was carried out in Osun, Oyo, Ondo, Ekiti, Lagos, and Ogun States of the Southwestern part of Nigeria where reconnaissance surveys were first carried out to select the sawmills that were used and to determine whether the sawmills were fully operational. Two fully functional sawmills in two cities of each State were eventually selected and visited for data collection, making a total of 24 sawmills visited. Circular Machines (CM), Planer Machines (PM), and Band-saw Machines (BM) which are the commonest types of machinery in the sawmilling industries were considered. Two machines each of CM, PM, and BM were considered in each of the sawmills visited, making a total of forty-eight (48) machines each of CM, PM, and BM. Sound data were collected using Extech 407732 sound level meter and all stabilized measurements were taken three times at different intervals. Data were also collected between 7 am and 7 pm each day for six days (between Monday and Saturday, as Sunday is always a work-free day). They got to work early enough to start work, depending on the availability of electricity supply and if electricity supply was unavailable, the workers usually spent their time cleaning, arranging, and preparing the logs or planks for work before putting on the generator, in order to save time. Furthermore, data were collected in three different periods: Machine No-work Period (NPm) i.e., the period in the sawmill when no machine is in operation; Machine Idle Period (IPm), i.e., machine operation period after the machine has been switched on but the wood has not been loaded onto the machine; and Machine Working Period (WPm) i.e., machine operation period when the wood is loaded for sawing.
2.1 Sound Level Data Collection
In this research, the noise measurements were carried out using ‘A’ Weighting and slow response as recommended in the manual [28]. However, the meter was set to high resolution (noise levels between 65 dB and 130 dB) for measurement during the idle and working periods, while the meter was set to low resolution (noise levels between 35 dB and 100 dB ) for measurement during the machine no-work period. The equivalent continuous sound level (Leq) was measured directly by the sound meter as digital numerical showed values that stabilized after about 30 s. The sound meter was hand-held such that the microphone attached to the sound meter faced the source of the sound and was also very close to the machine operators.
A two – way Analysis of Variance (ANOVA) was carried out at P < 0.05 to determine whether there is a significant difference in the sound level average before and after the break, for both the idle and working periods of the three machines considered, while the null and alternative hypothesis are shown as:
Null Hypotheses:
H1 is the means of sound levels of the three machines are the same
H2 is the means of sound levels before and after the break, in idle and working periods are the same
H3 is there is no interaction between sound levels of the three machines and when the data were collected
Alternative Hypothesis:
H1 is the means of sound levels of the three machines are not the same
H2 is the means of sound levels before and after the break, in idle and working periods are not the same
H3 is there is an interaction between sound levels of the three machines and when the data were collected
Also, a two–way ANOVA was carried out at P < 0.05 to determine whether there is a significant difference in the sound level average before and after the break, during machine no-work period in all the sawmills in the six States considered, as the null and alternative hypothesis are shown as:
Null Hypotheses:
H1 is the means of sound levels in the six States are the same
H2 is the means of sound levels before and after the break in machine no-work periods are the same
H3 is there is no interaction between sound levels in the six States and when the data were collected
Alternative Hypotheses:
H1 is the means of sound levels in the six States are not the same
H2 is the means of sound levels before and after the break in machine no-work periods are not the same
H3 is there is an interaction between sound levels in the six States and when the data were collected
A two – way ANOVA was also carried out at P < 0.05 to determine whether there is a significant difference between the sound level average of the results collected during idle and working periods of the three machines.
Null Hypotheses:
H1 is the means of sound levels of the three machines are the same
H2 is the means of sound levels different periods considered are the same
H3 is there is no interaction between the three machines and the different periods considered
Alternative Hypotheses:
H1 is the means of sound levels of the three machines are not the same for the periods considered
H2 is the means of sound levels different periods considered are not the same
H3 is there is an interaction between the three machines and the different periods considered
A Post-hoc comparison using Tukey’s Criterion as shown in Eq. (1) was conducted to identify where the significant differences were in the comparisons.

where Tu is the Tukey criterion
 is the range distribution, based on c and n–c
c is the number of groups
n is the total sample size
MSE is the Mean square error (from ANOVA table)
ni is the no of observation in a group
For each machine, Minimum Sound Level (lmin), Maximum Sound Level (lmax), Average Sound Level (lave), and Standard Deviation (σ), were determined. Also the following parameters were determined:
i) Noise pollution level (Lnp)
ii) The daily personal noise exposure level (LEPD)
iii) Daily noise dose (D)
Noise Pollution Level (Lnp) was however determined using the relationship according to ISO/R13 –1959 [29] as shown in Eq. (2).

where σ is the standard deviation of the sound levels collected.
The daily personal noise exposure level (LEP,d) was calculated using Eq. (3) [13].

where n is the number of individual periods in the working day;
Ti is the duration of period i;
(Leq,T)i is the equivalent continuous A-weighted sound pressure level that represents the sound the person is exposed to during period i; and  is the duration of the person’s working day, in seconds.
The daily dose also was calculated using Eq. (4) as:

where: D is daily noise dose (must not exceed unity)
t is actual exposure time at a given sound level
n is the number of discrete periods of exposure above 90 dB (A)
T is permissible exposure time per day.

NOTE: Maximum Exposure corresponds to D is 1.0. Thus, the control required for D > 1.0
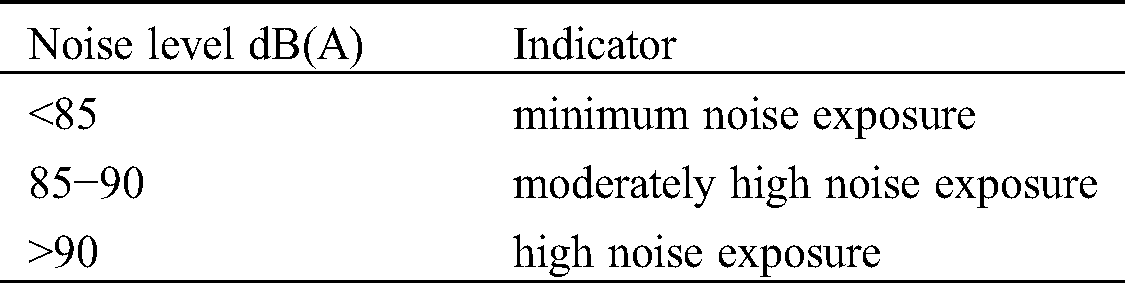
Thus, the exposure indicator in Tab. 1 will be used in this research due to its general applications because they correspond to regulatory limits in developed (usually 85 dB (A)) and many developing (usually 90 dB (A)) countries for an 8-h day [28,30–32]
Table 1: Noise level indicator
3.1 Noise Level Results and Discussion
The summary of the minimum and maximum sound levels for the machines at different periods presented in Tab. 2 shows that the idle period sound levels for CM, PM and BM ranged from 80.7 (OY42) to 101.8 dB (LA31); 80.2 (OY31) to 102.2 dB (LA12); and 81.9 (EK31) to 102.4 dB (ON41) respectively, while the working period sound levels ranged from 86.0 (ON21) to 109.6 dB (ON42); 88.6 (ON21 and OG31) to 109.6dB (LA11); and 89.7 (LA32) to 106.5 dB (ON12) for CM, PM and BM respectively.
The machine no-work period noise levels ranged from 42.8 (EK1) to 88.1 dB (OS1). Tab. 2 also revealed that the least sound level of 80.2 dB was recorded at Oyo State (OY31), while the highest value of 109.6 dB was recorded at Ondo State (ON42) and Lagos State (LA11). The major factors that contributed to the high sound levels can be attributed to the closeness of types of machinery in the sawmill layout to the generator supplying power to each machine or the entire sawmill, year of use/the maintainability level of the machinery, the dryness level of the log to be sawed and the type of wood being sawed. During the idle period also, the minimum sound level of the machines in all the States except for the circular saw machine in Lagos State was below 90 dB, while the minimum sound levels of the machines considered during the working periods were above the recommended 90 dB in Osun, Ekiti and Oyo States. Fig. 1 shows the number of machines at different modes and periods of measurement. Fig. 1 revealed that 66.7% and 68.8% of the Leq data collected before and after the break were greater than 90 dB at IPm, while 100% and 99.3% of the Leq data collected before and after the break, were greater than 90 dB at WPm. This indicated that those machines will expose the workers to a high noise level, thereby exposing the workers who stay under the noise longer than required to health hazards.
Table 2: Summary of the minimum and maximum sound levels for CM, PM and BM different periods
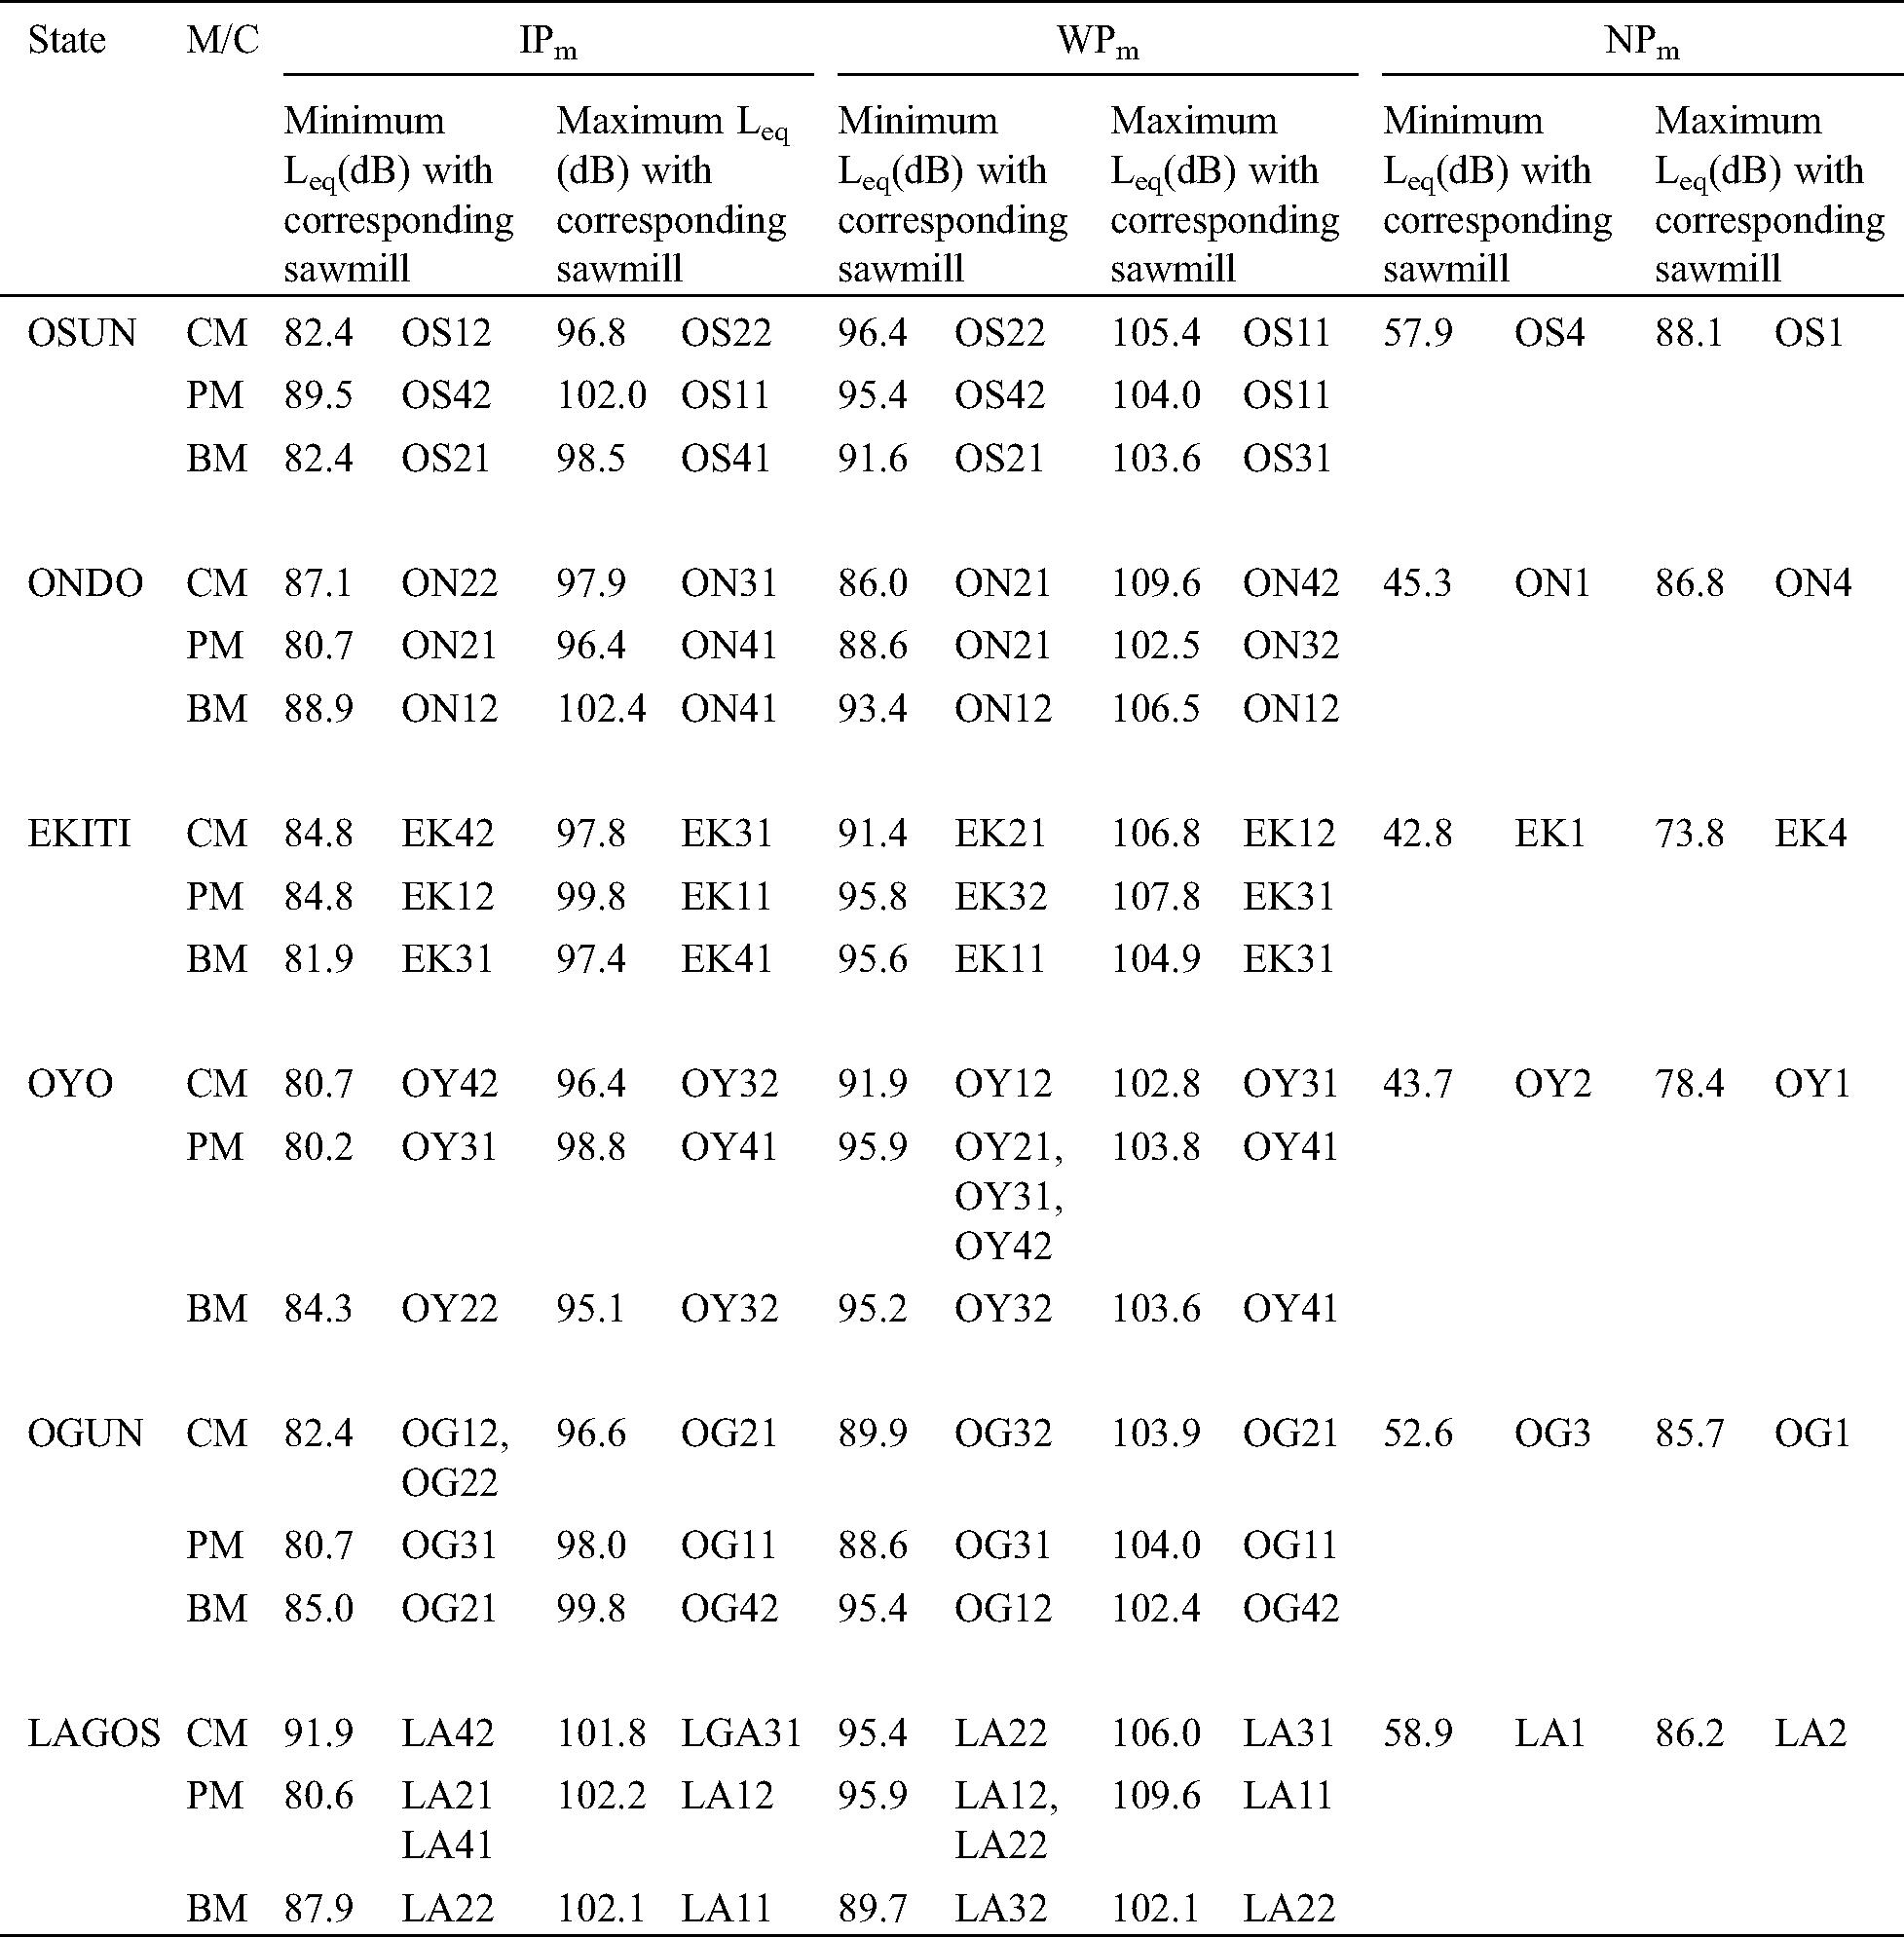

Figure 1: Number of machines at different noise level indicator
At machine no-work period, most of the workers in the environment of the machines were exposed to the minimum and safe noise, since Leq values in sawmills before the start of activities in the sawmills were lesser than 85 dB, while 87.5% of the sawmills had Leq values that were higher than 85dB after the start of sawmilling activities. This was so because there were little or no activities very early in the morning, compared to the afternoon when the traffic was usually high, buying and selling were on while shouting and talking were also on in the vicinity of the sawmills. Furthermore, the ANOVA results in Tab. 3 showed that there is no significant difference in the idle period sound level results when considering the types of the machines only, before and after the break only and the types of machines in relationship with when the data were collected (before or after the break), as P value > 0.05.
Therefore, the null hypotheses are accepted for H1, H2, and H3. However, during the working period in Tab. 4, the P value 0.006505 was less than 0.05 (0.006505 < 0.05) when considering the types of the machines only. This means there is a significant difference in the sound level results; hence H1 in the null hypothesis is rejected. But, the P values: 0.157122 and 0.888442 were greater than 0.05 for before the break, after the break and interaction respectively. Therefore, the H2 and H3 hypotheses are accepted in the null hypotheses (there are no significant differences between before the break and after the break sound level results, this is also the same when considering the type of machines in relationship with when the data were collected respectively).
Tab. 5 revealed that there is no significant difference in the machine no-work period sound level results when considering sawmills in the six States only, before the break only, and after the break only, as their P values (8.87 × 10⁻¹⁵ and 5.85 × 10⁻¹⁵ respectively) are lesser than 0.05. Therefore, the null hypothesis is rejected and its alternative hypothesis is accepted. However, there is no significant difference in the sound levels when considering each sawmill in the six States in relationship with when the data were collected, as the P values (0.656079) is greater than 0.05. Therefore, the null hypothesis is accepted. Also, the results in Tab. 6 showed that there is no significant difference in the average noise levels of the types of machines used only and also when considering the types of machines used in relationship with their periods only. That is, H1 and H3 in the null hypotheses are accepted as their P values (0.676513 and 0.675799 respectively) are greater than 0.05. The H2 in the null hypothesis was however rejected as the P–value for periods (1.1 × 10-199) is lesser than 0.05, showing that there are statistically significant differences in the noise levels when only considering idle, working and machine no-work periods.
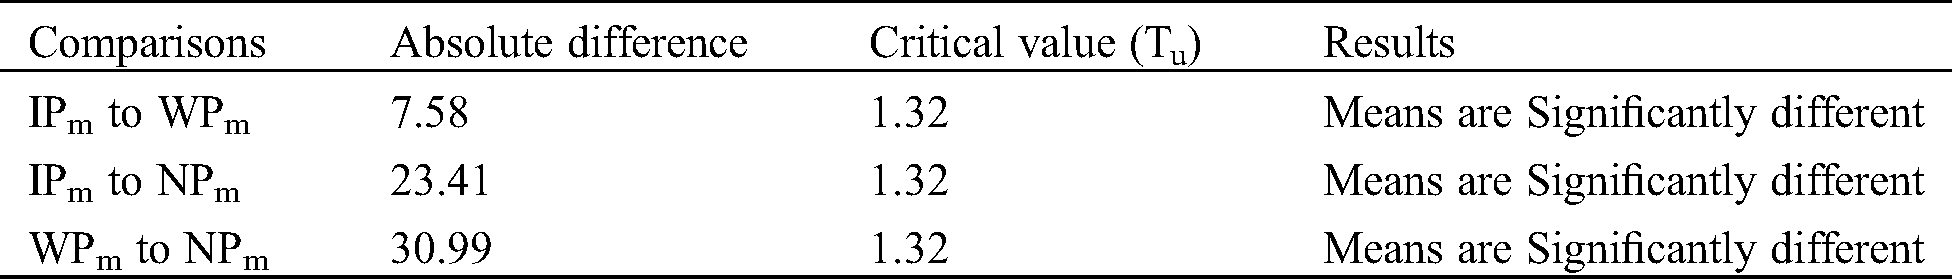
Post-hoc results of the comparisons using Tukey’s HSD test, as presented in Tab. 7 showed that the values of absolute difference are greater than the critical values in all the three comparisons. These indicated that the average noise levels in the three comparisons (IPm to WPm; IPm to NPm; and WPm to NPm) are significantly different from one another and the least difference seen between IPm and WPm, while the highest difference is seen between WPm and NPm.
Table 3: ANOVA results of comparison between sound levels before and after the break during the idle period among the three types of machines
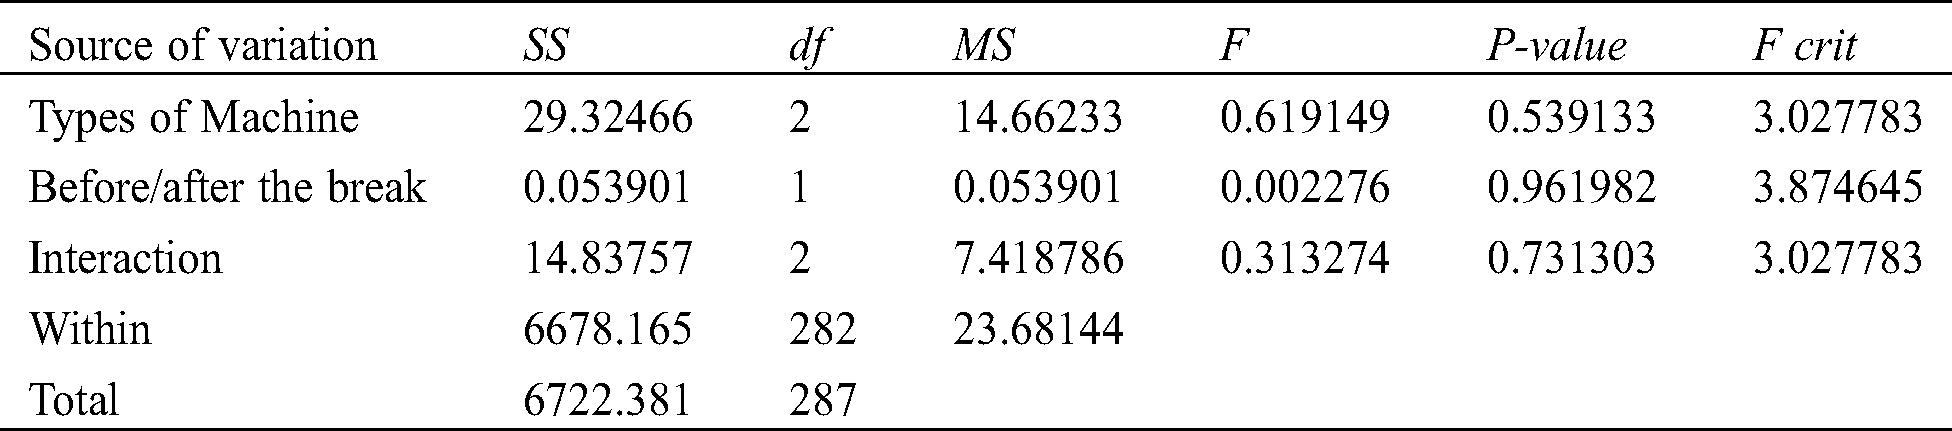
Table 4: ANOVA results of comparison between sound levels before and after the break during the working period among the three types of machines
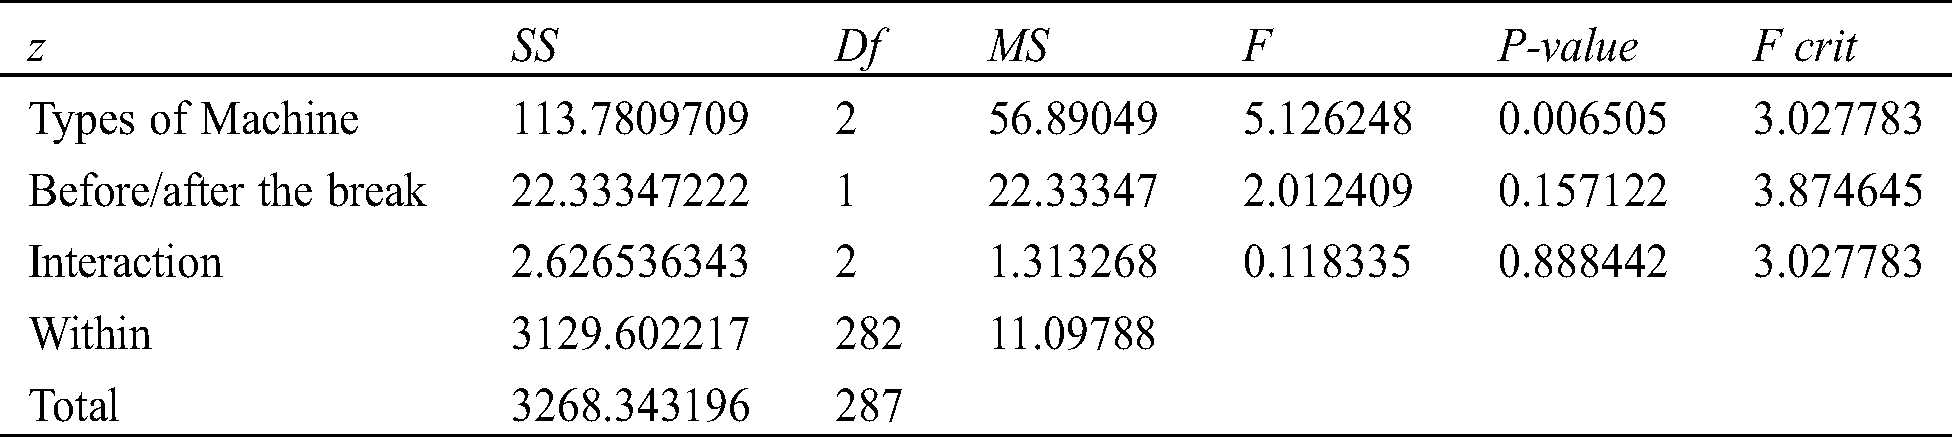
Table 5: ANOVA results of comparison between sound levels before and after the break during NPm in the six states
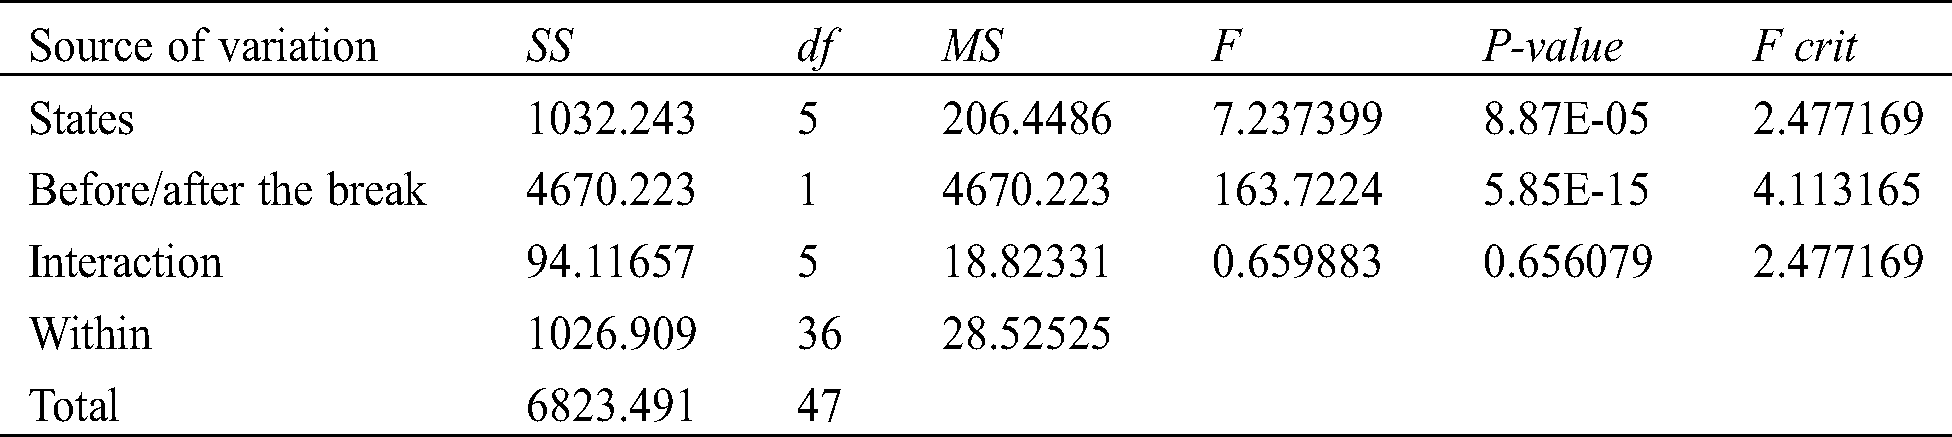
Table 6: ANOVA results of the comparison among IPm, NPm and WPm of CM, PM and BM in the six states
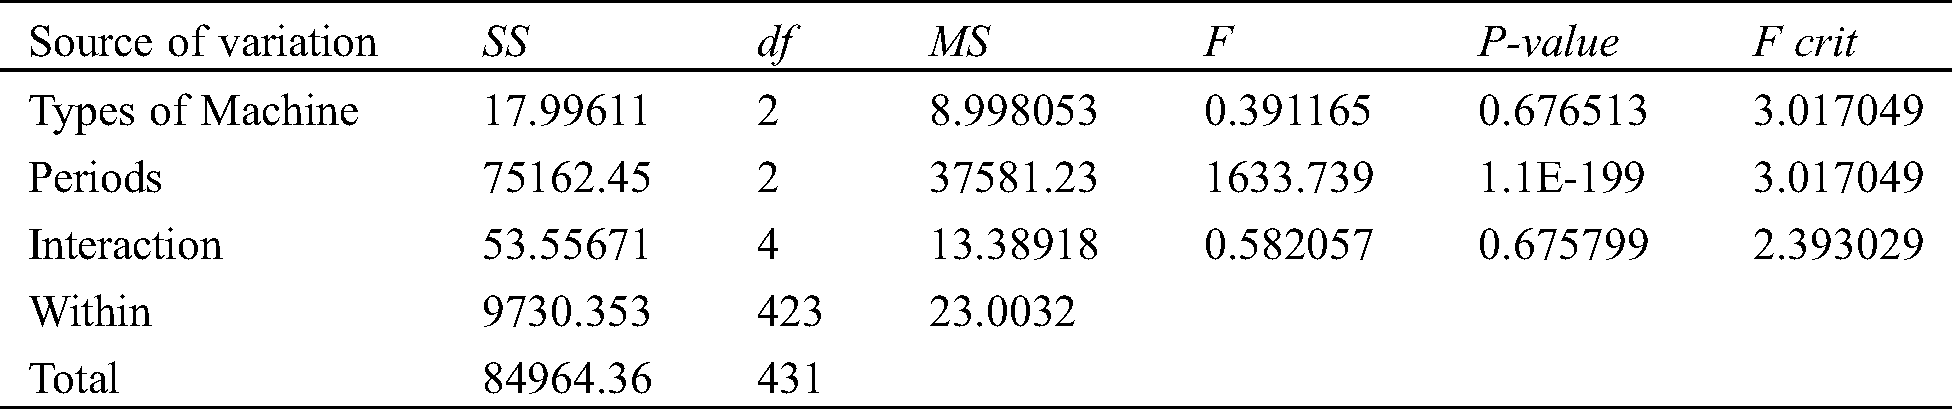
Table 7: Post-Hoc analysis results using Tukey’s HSD test
3.2 Noise Pollution Level Results and Discussion
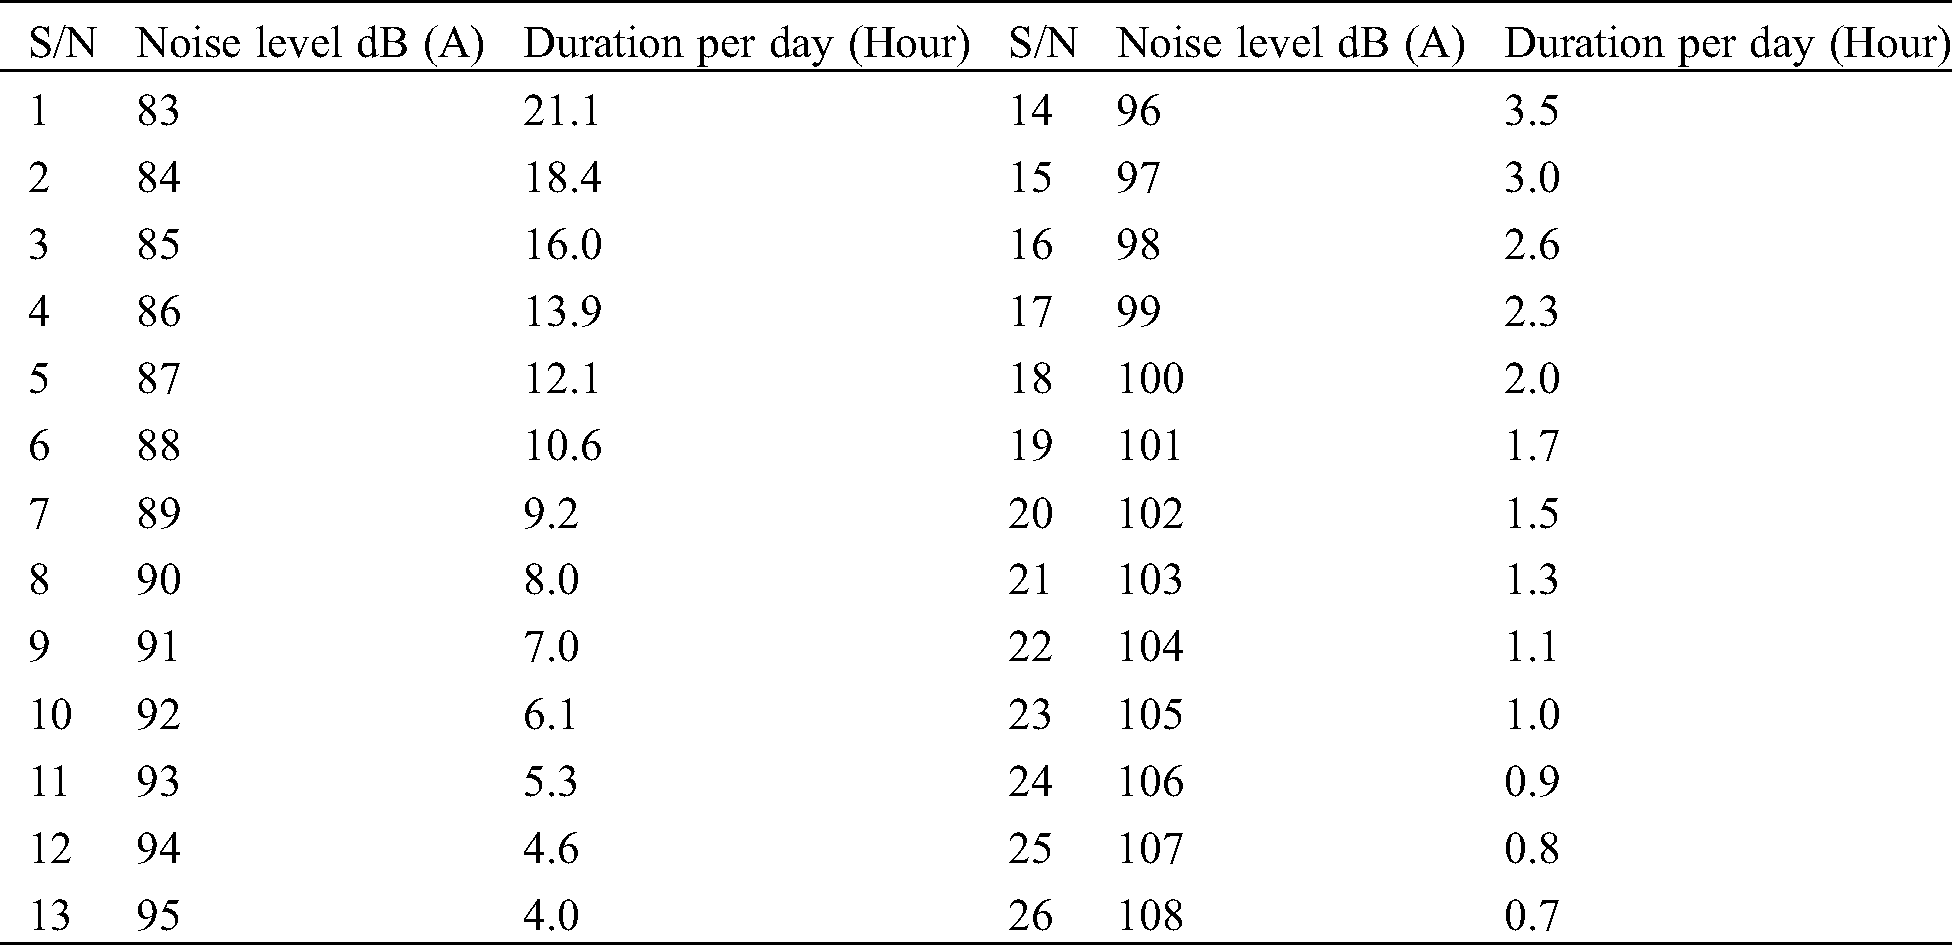
Tab. 8, which is the noise pollution level (Lnp) revealed that during IPm and WPm, noise pollution levels ranged from 83.20 (PM) to 107.65 dB (BM) and 93.42 (CM and PM) to 116.00 dB (BM), respectively. Averagely, IPm gave the least noise pollution level of 95.79 dB, while WPm gave the highest level of 102.88 dB. Comparing Tab. 8 with permissible noise exposure time per day in Tab. 9, only 10.4%, 25% and 12.5% of CM, PM, and BM in all the machines considered were at minimum noise exposure level respectively. These results revealed that all the machines’ Lnp values in the working period are more than the 90 dB acceptable limit [33] while 89.6% of CMs, 75% of PMs and 89.6% of BM had their Lnp above 90 dB in the idle period respectively.
Table 8: Noise pollution level (Lnp) at idle and working periods
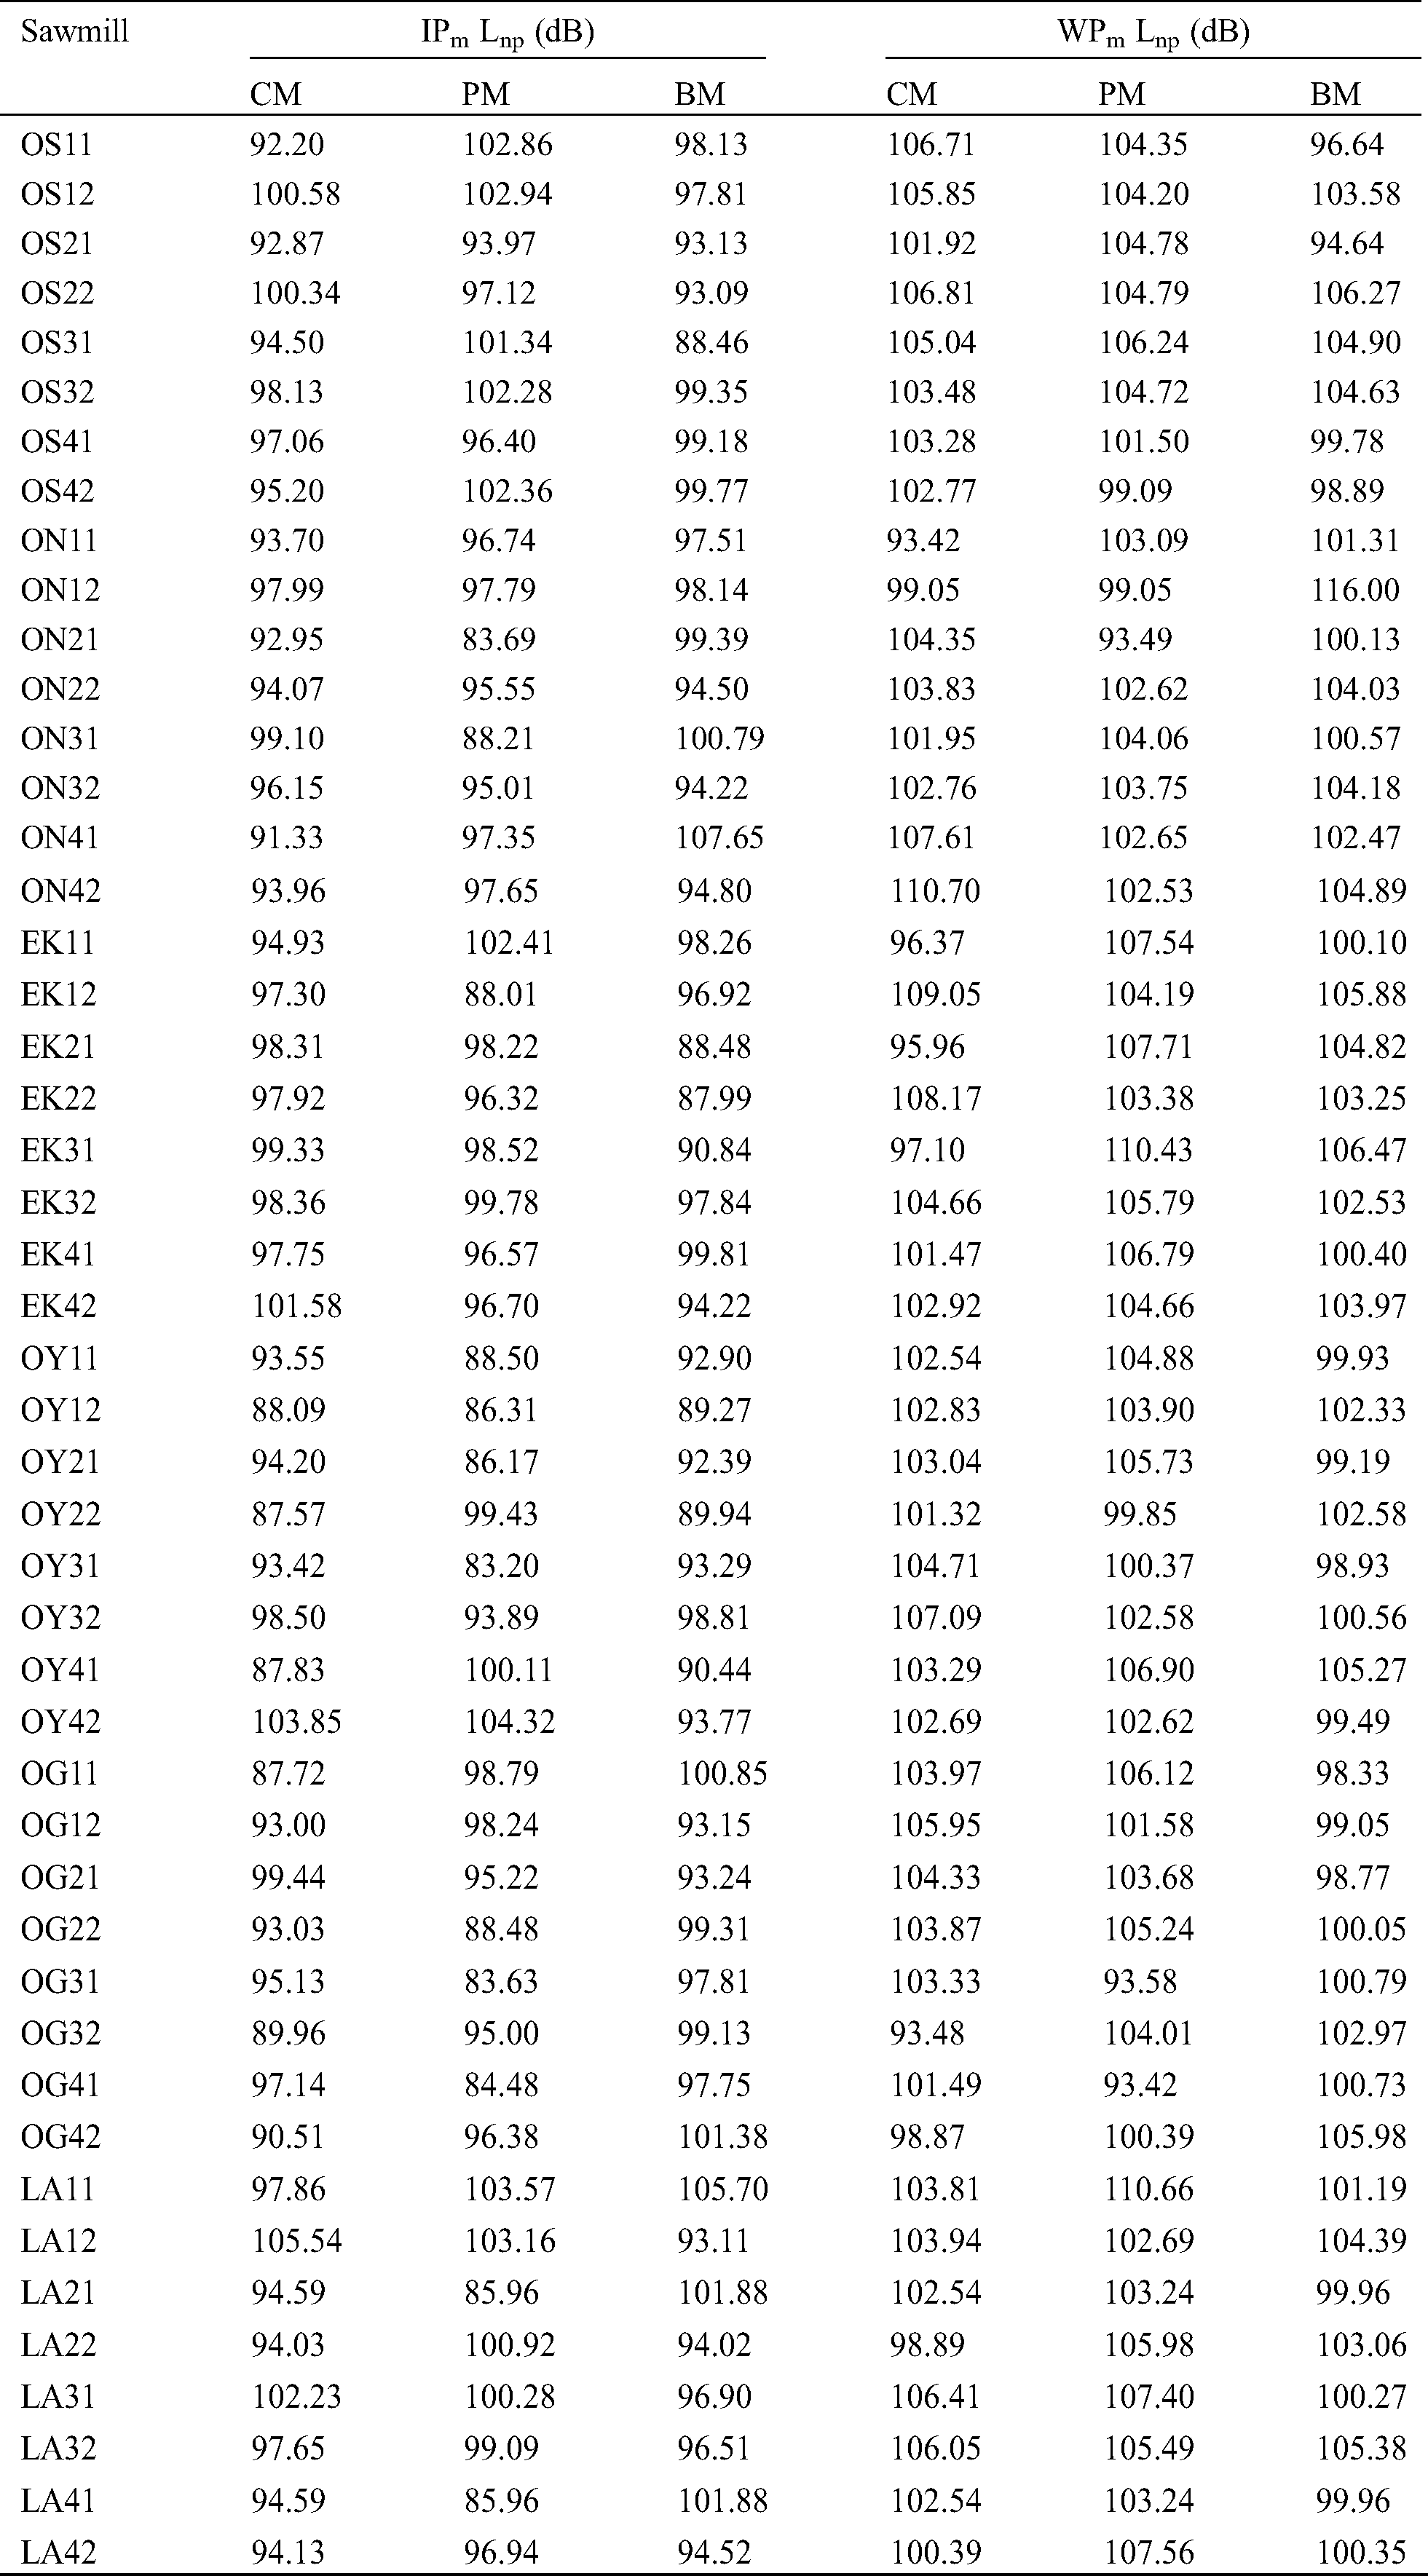
Table 9: Permissible noise exposure time per day
3.3 The Daily Personal Noise Exposure Level Results and Discussion
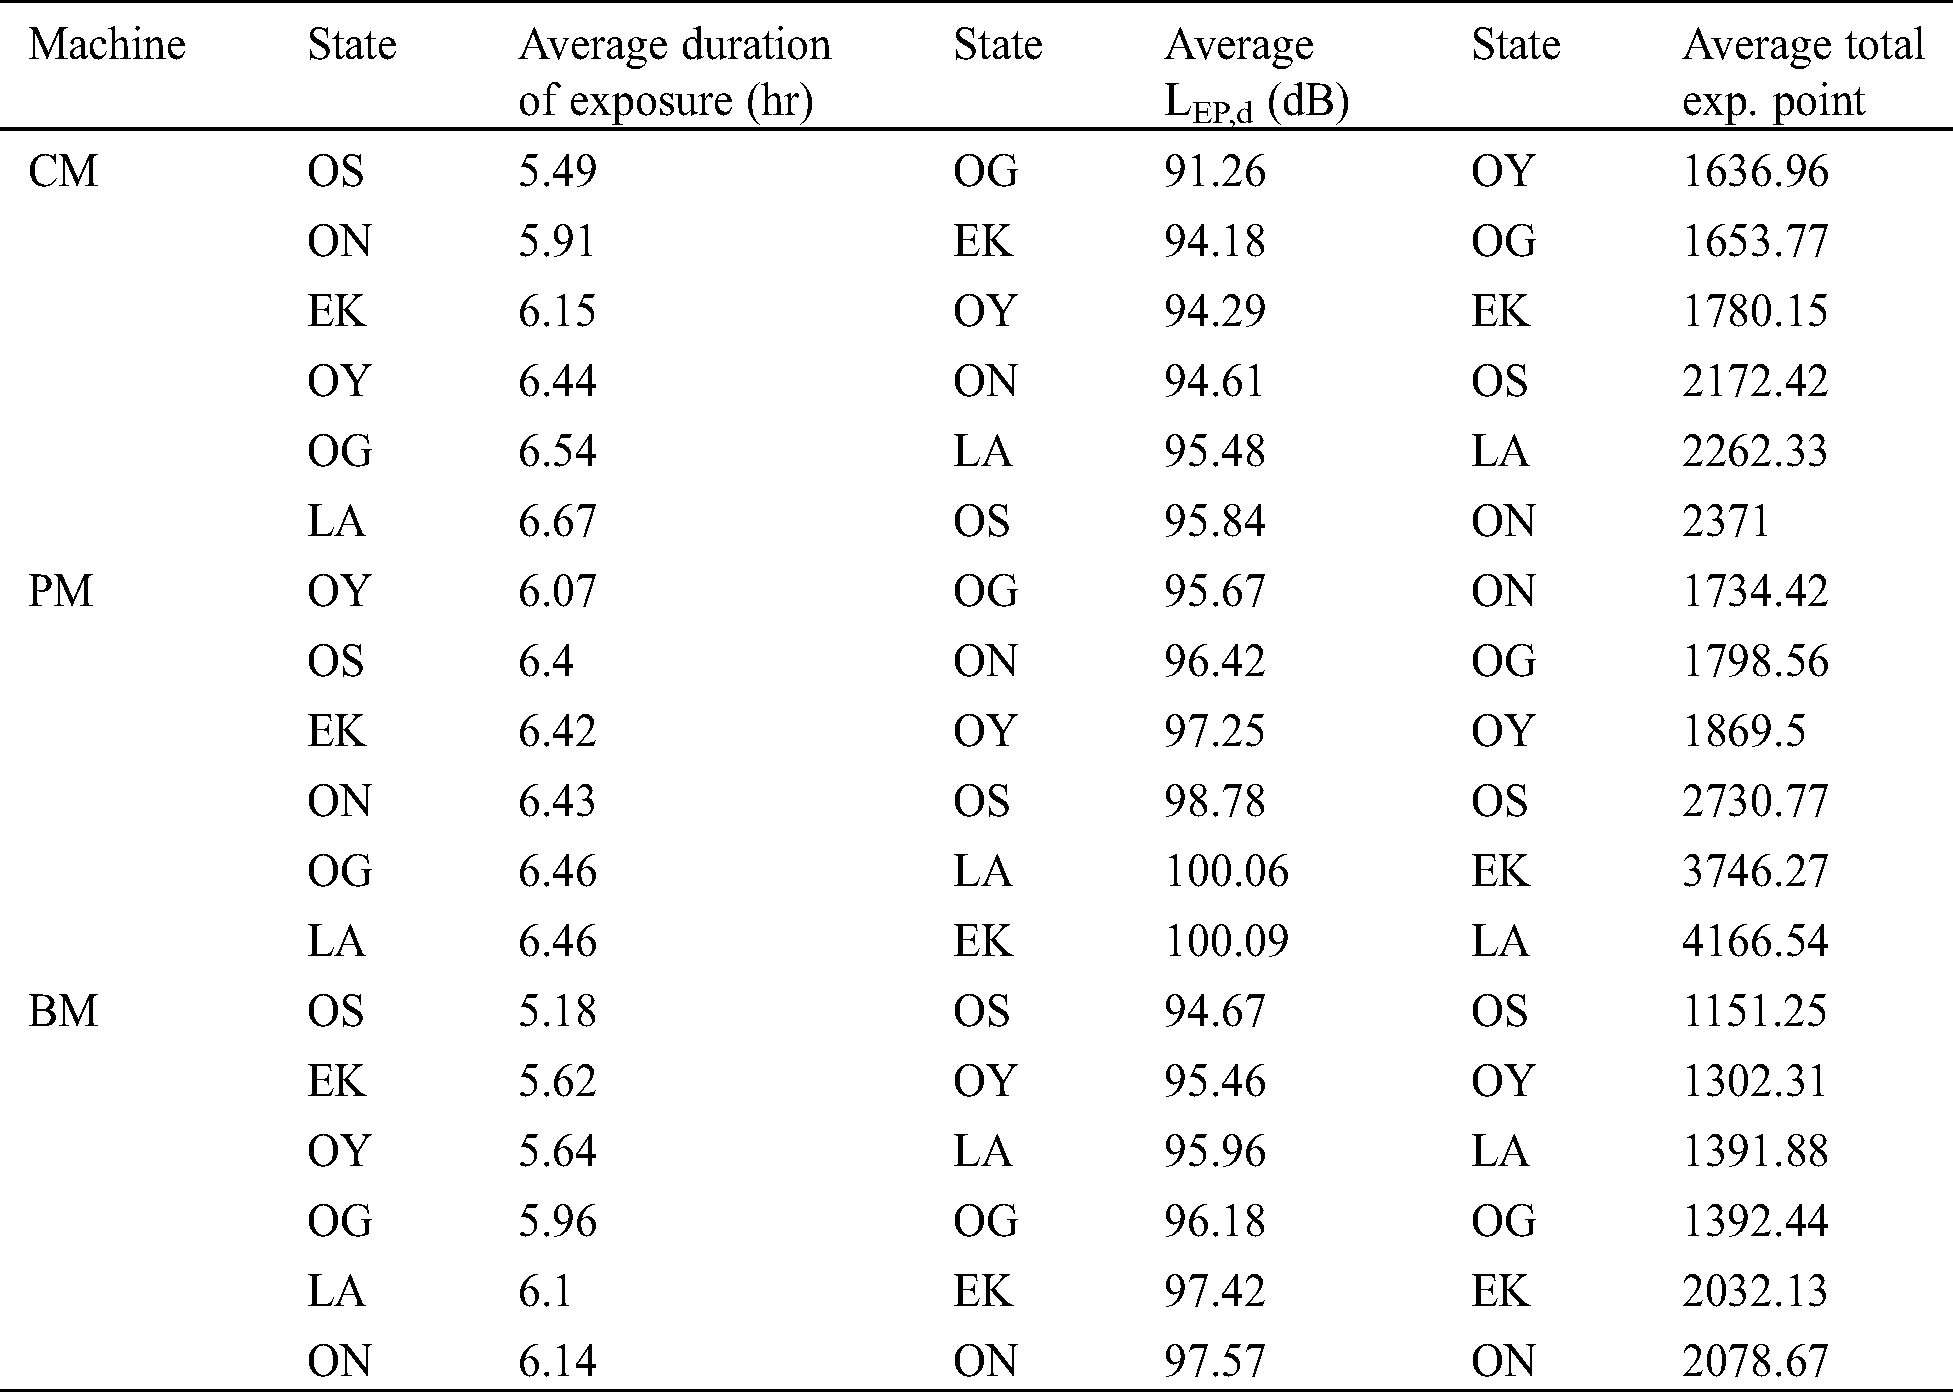
The results for an average duration of exposure, daily personal noise level LEP,d and average total exposure point for each type of machine considered in all the selected sawmills are presented in Tab. 10 while the results for each selected State were presented in Figs. 2–4. In all the sawmills visited, the minimum/maximum average operation time, LEP,d and total exposure point of the CMs, PMs and BMs are 4.65 (OS 41)/8.26 hrs (LA 32); 87.85 (OG 32)/103.35 dB (ON42) and 240 (OG 32)/6862 (ON 42); 5.23 (EK 41)/8.07 hrs (EK42); 88.13 (OG 41)/105.30 dB (LA 11) and 219 (OG 41)/10899 (LA 11); and 4.47 (OS 41)/7.78 hrs (ON 42); 89.40(OS 21)/101.17dB (ON 12) and 278.5 (OS21)/4775.17 (ON12), respectively (as shown in Tab. 10). Averagely, as presented in Figs. 3–5, Lagos (6.67 hrs); Lagos (6.46 hrs) and Ondo States (6.14 hrs) have the highest average duration of exposure for CMs, PMs, and BMs respectively. Likewise, Osun (95.84 dB); Ekiti (100.09dB) and Osun States (97.57 dB) have the highest average LEP,d for CMs, PMs and BMs respectively, while Ondo (2371); Lagos (4166.54) and Ondo States (2078.67) have the highest average exposure point for CMs, PMs and BMs respectively. These results are similar to the findings reported in the studies carried out by [34].
The least LEP,d value and exposure point (87.85 dB and 240 (CM at OG 32)) are higher than the recommended exposure limit values of 87 dB and 160 (Health and Safety, 2005). However, according to the FEPA (1991) [33] standards, only one BM (2.08%) and two machines (4.17%) each of CM and PM have their LEP,d lesser than the recommended 90 dB acceptable limit. Using Tab. 1, 97.92 % of BM and 95.83% of both CM and PM indicated high noise exposure. Averagely, CMs in Lagos and PMs in Ekiti and Lagos have the highest duration of exposure (6.67 hrs), LEP,d (100.09 dB), and exposure point (4166.54) respectively, by State analysis as shown in Tab. 11.
Table 10: Noise exposure results per CMs, PMs and BMs in all the considered sawmills
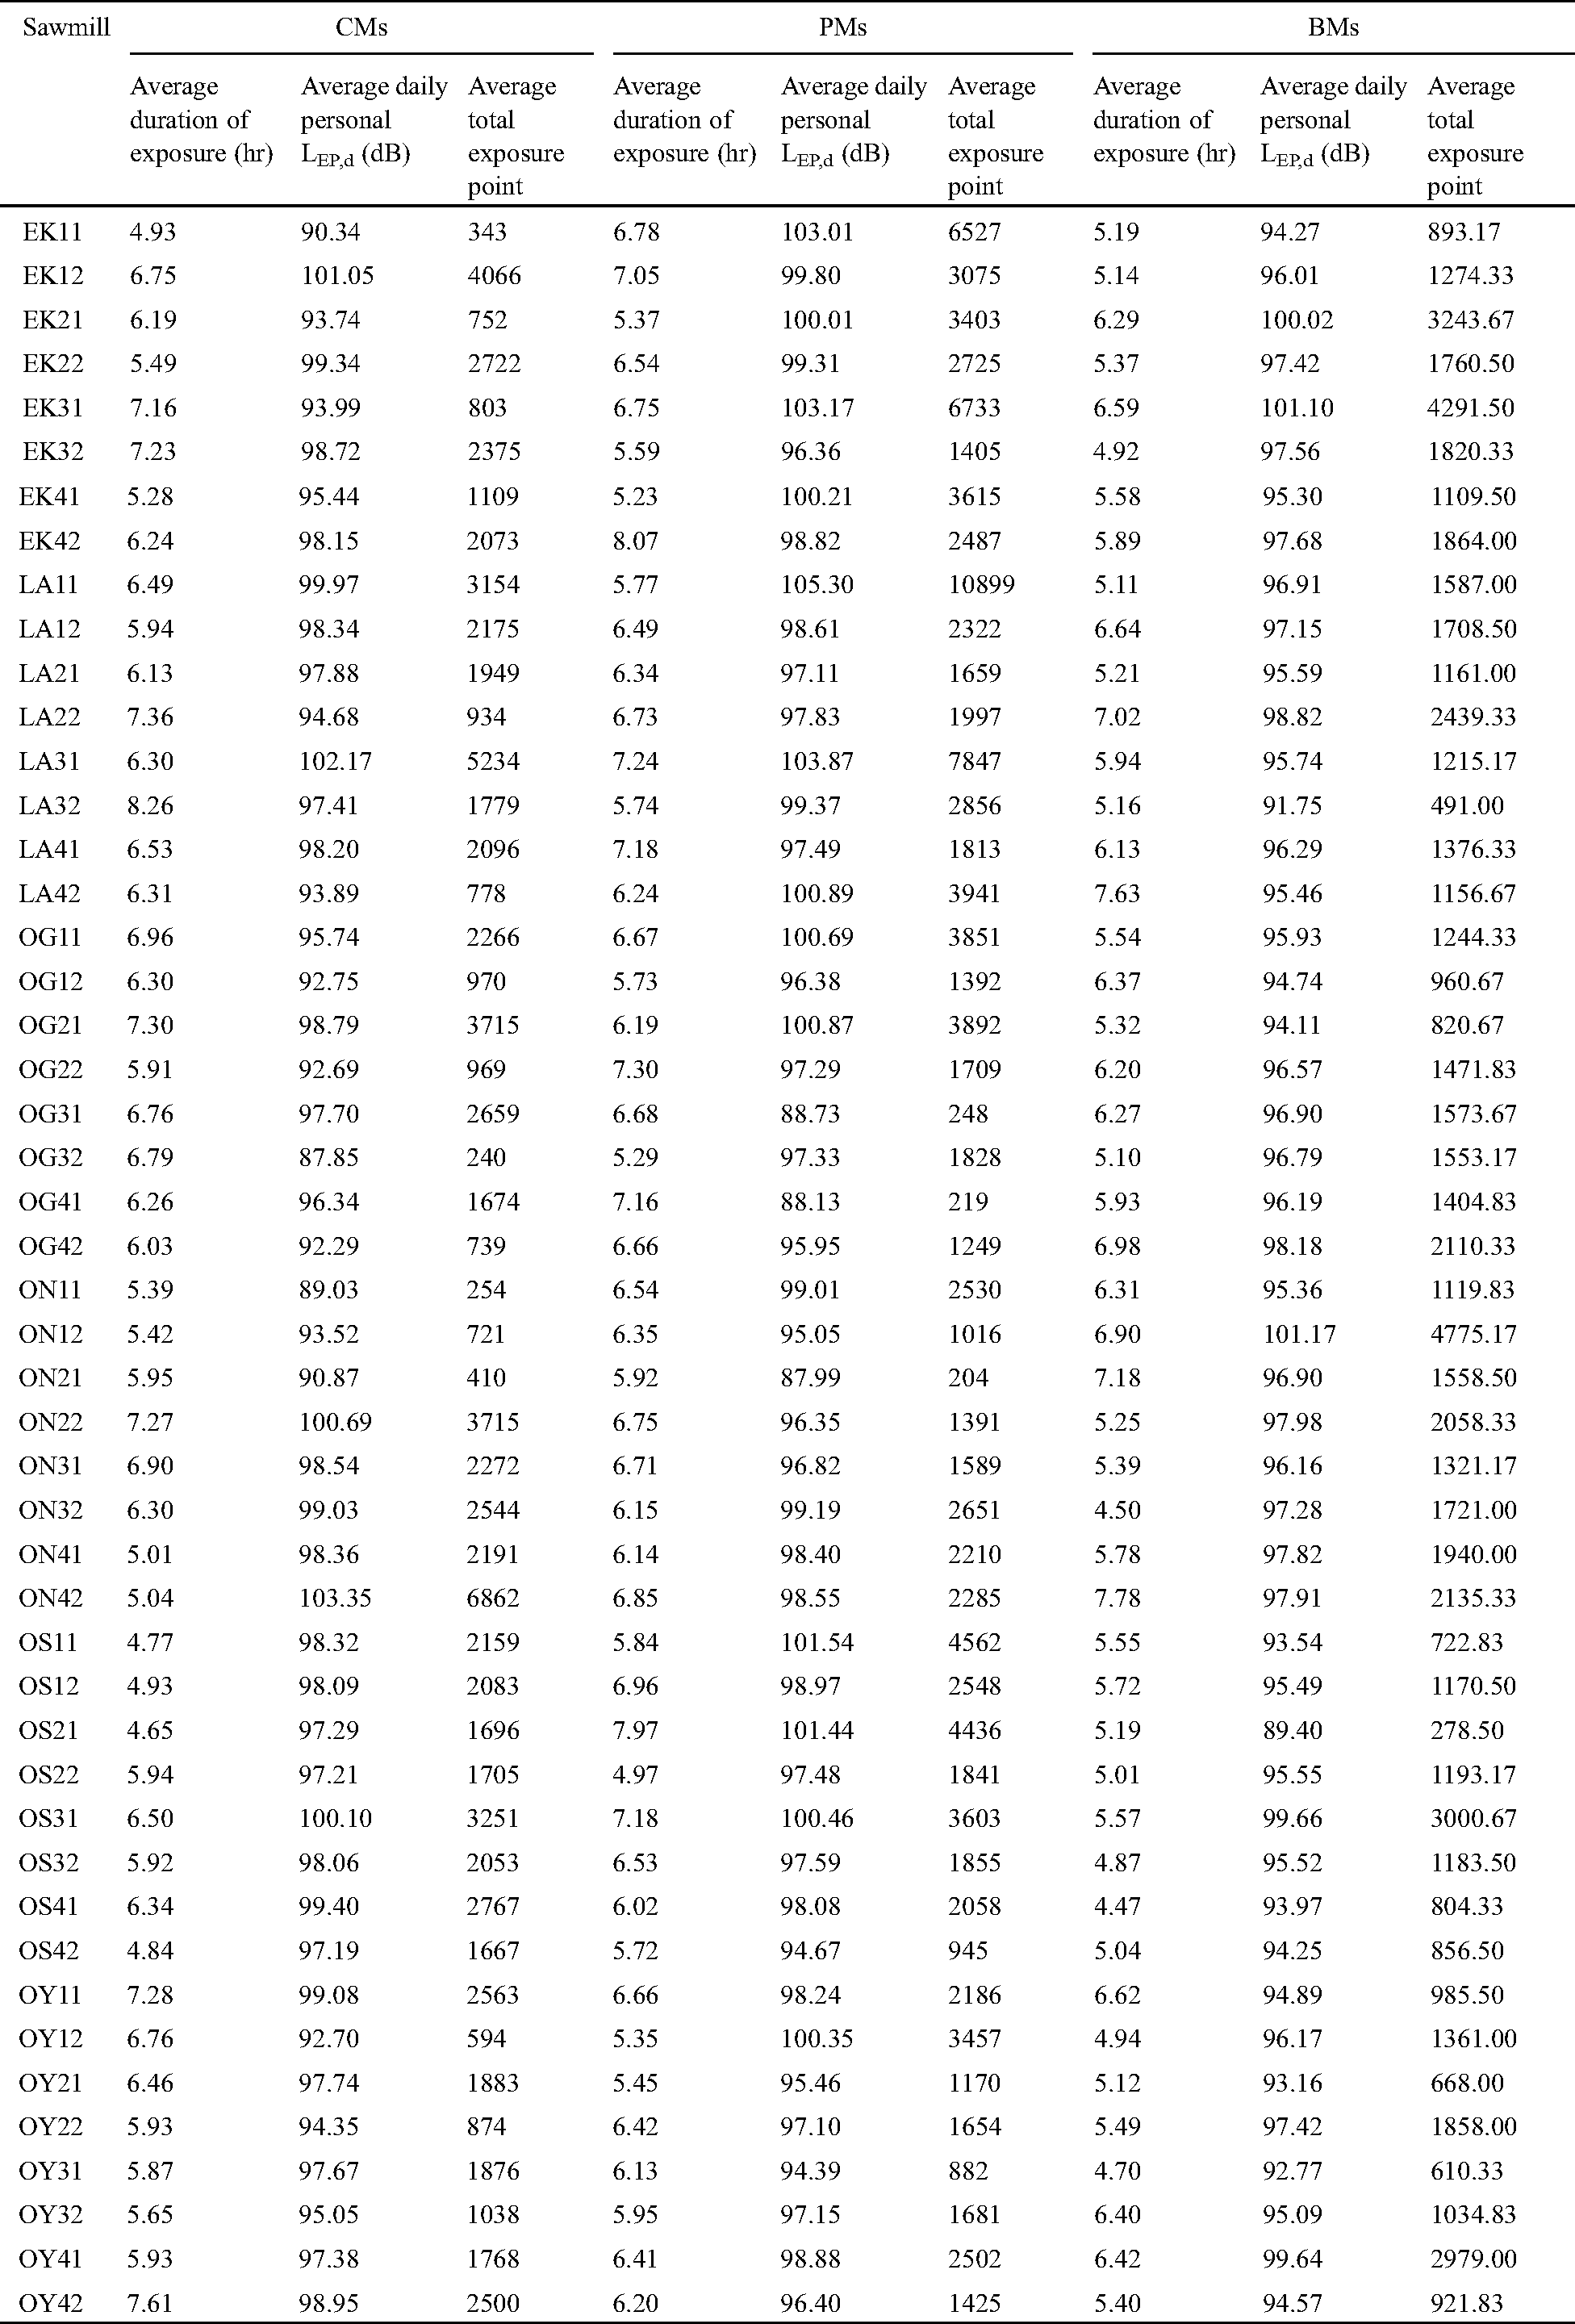
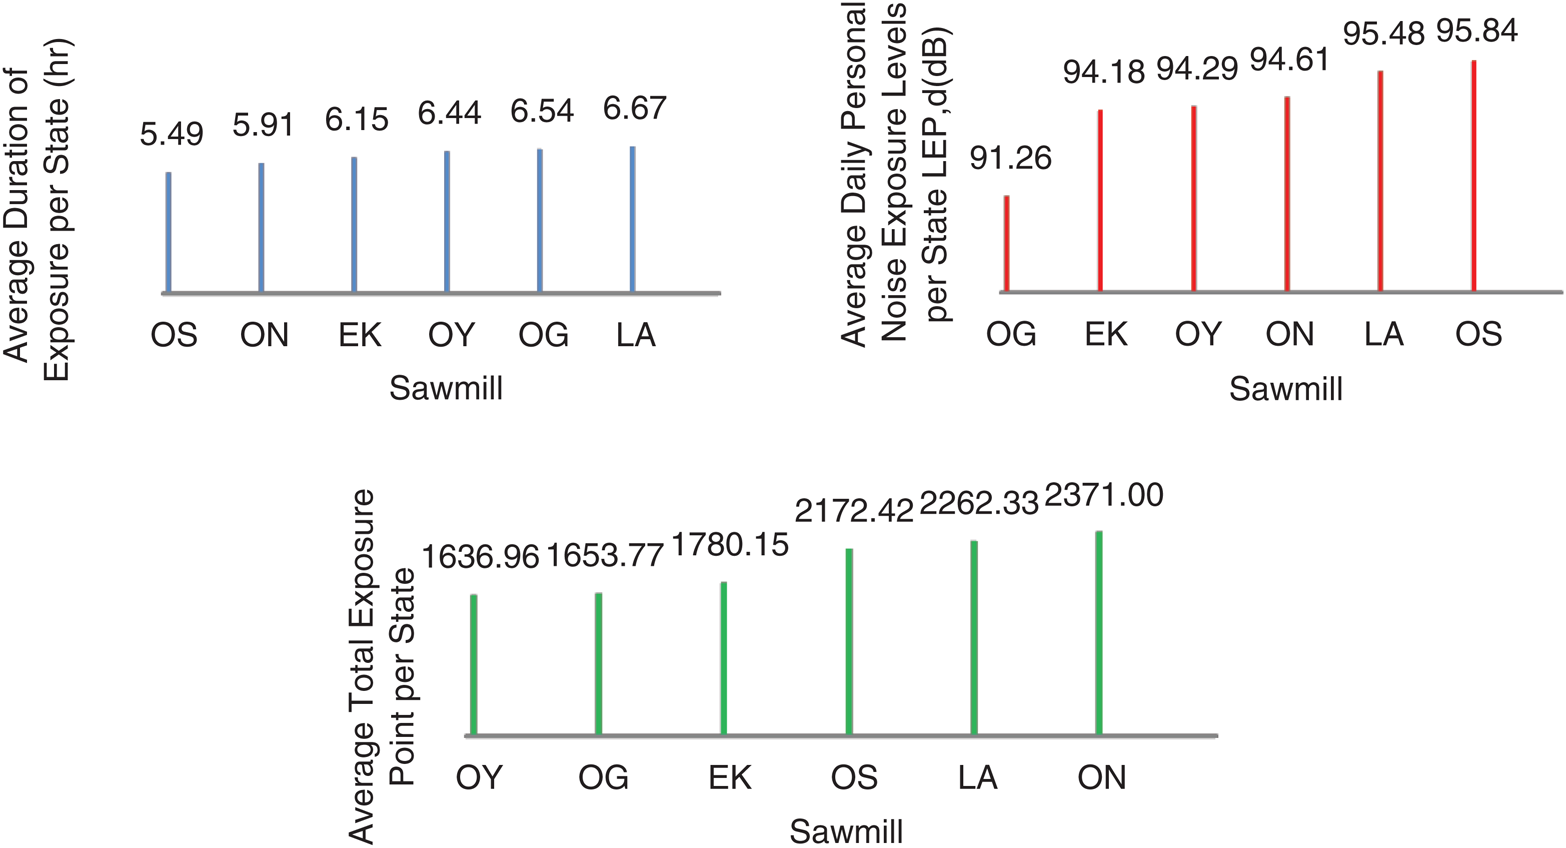
Figure 2: Noise exposure results for circular machines per each state considered
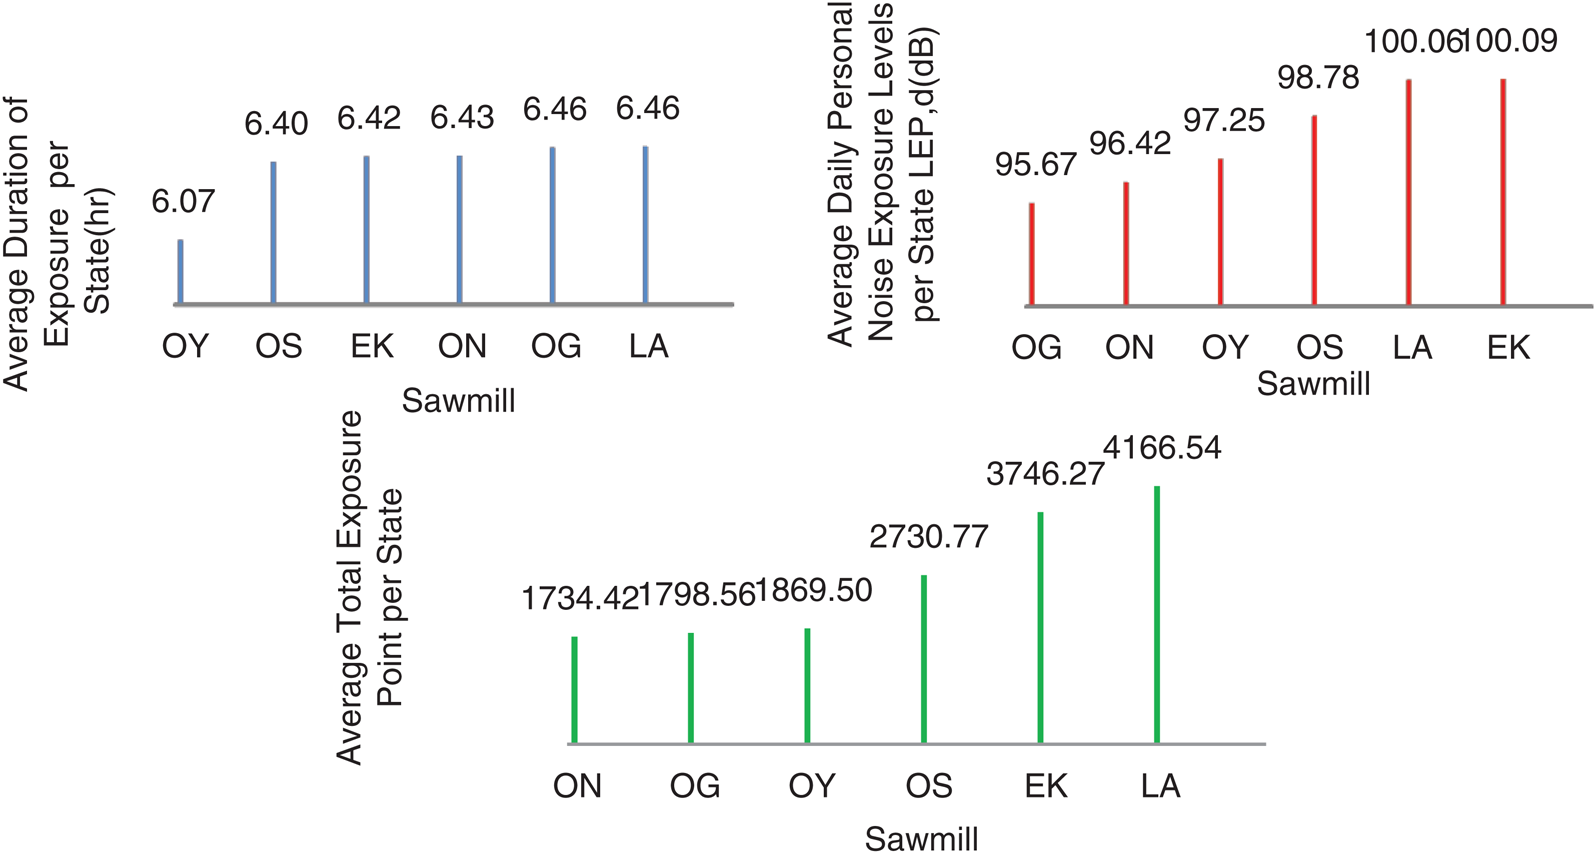
Figure 3: Noise exposure results for panel saw machines per each state considered
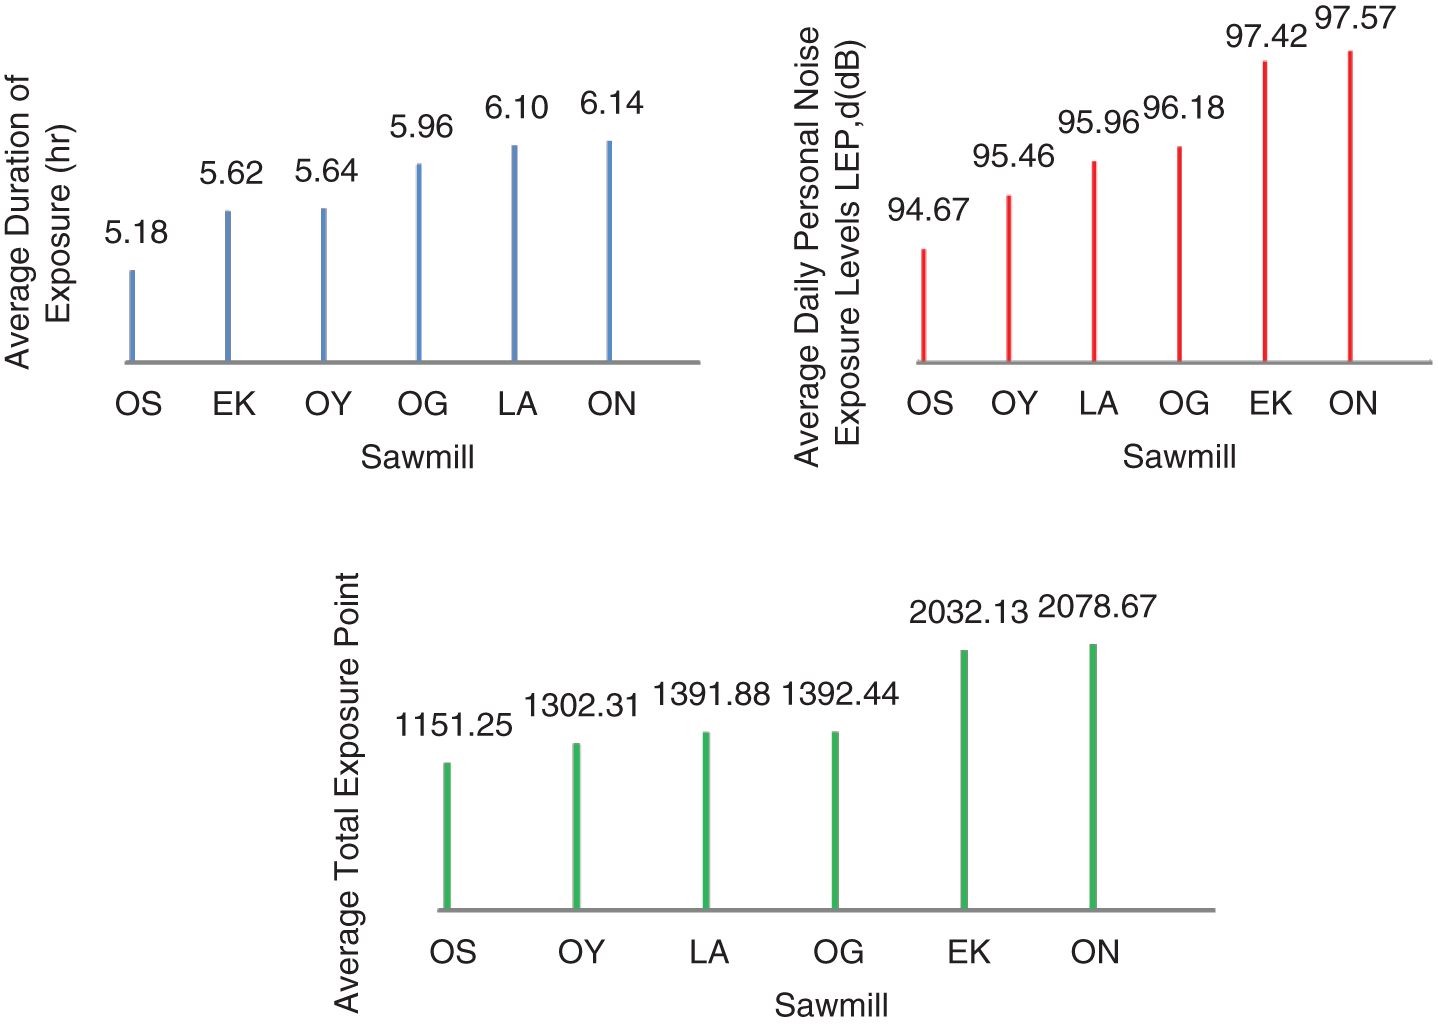
Figure 4: Noise exposure results of band saw machine per each state considered
Table 11: Exposure level analysis by state
3.4 Daily Dose Results and Discussion
The calculated actual noise daily dose levels for each machine considered are presented in Tab. 12. The minimum and the maximum noise dose levels for IPm, WPm, and overall are 0.09 (BM) and 2.37 (CM), 0.50 (CM) and 4.77 (PM) and 0.69 (BM) and 6.64 (PM) respectively. In all the three types of machines considered, the machine noise dose levels ranged from 0.12 (OY22)–4.13 (ON42), 1.21 (OS22)–4.77 (ON22) and 0.09 (OS21)–3.66 (EK31) dB for CM, PM and BM, respectively. The results revealed that the lowest and the highest total noise dose levels experienced while operating the BM and PM, were (0.69/OS21) and (6.64/OG22), respectively. Considering the Total dose levels as shown in Fig. 5, it was revealed that only 8.3%, 0% and 2.1% of the CM, PM, and BM respectively, exposed the operators to the acceptable noise dose level. This revealed that 96.5% of the machines exposed the operators to noise dose levels more than the acceptable level. However, the results showed that 70.8 and 91.7% of CMs and BMs exposed the operators to noise level dose between 1.01, and 3 respectively, while 100% of PMs exposed the operators to noise level dose above 4.01. Therefore, serious noise controls are urgently required to avert hazardous health consequences because of overexposure to noise.
Table 12: Summary of the calculated noise daily dose levels
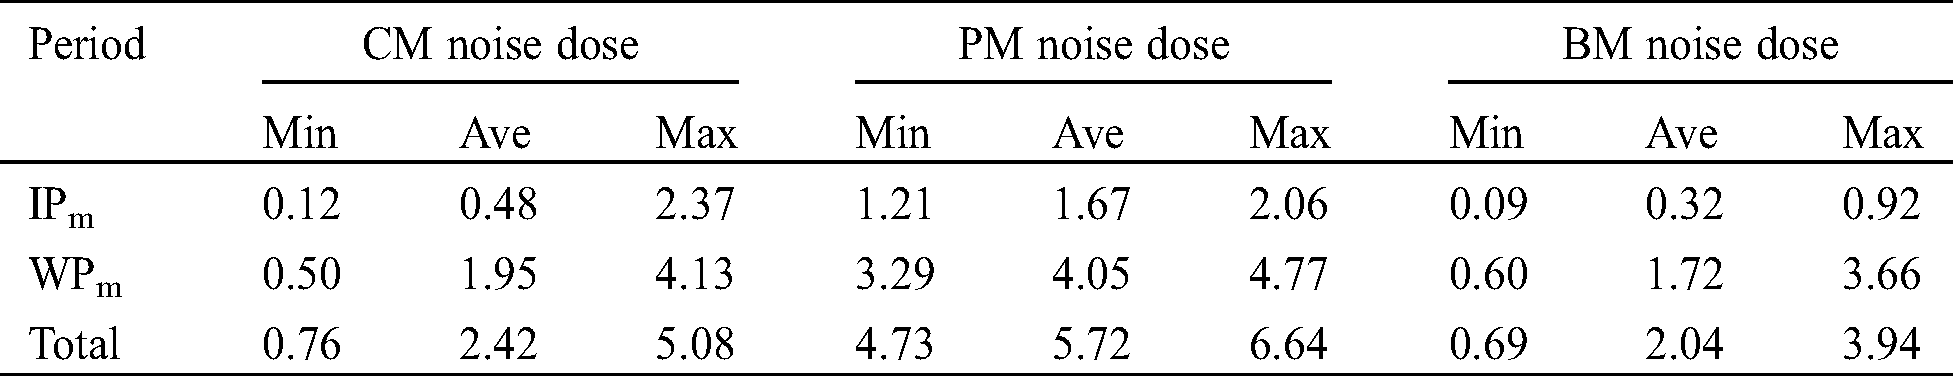
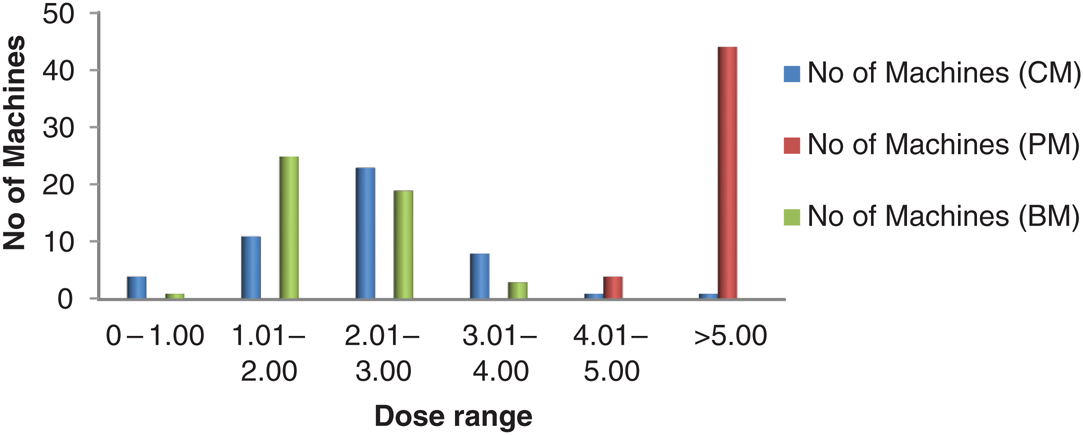
Figure 5: Dose level relationship among CM, PM and BM
Sawmilling activities are obvious sources of noise and are activities that generally involve human actions in trying to make the environment a better place. However, these activities have long term adverse effects on sawmill workers. Therefore, this study concluded that the main fundamental contributing factors that influenced the high noise level and high noise exposure are grouped under three activities, these are the antediluvian machinery (which involves poor maintenance, use of old and obsolete machines.), Poor workshop layout (poor housekeeping strategy and limited space) and the human factor (this includes negligence, lack of Personal Protective Equipment (PPE), and lack of training on occupational safety and health challenges arising from sawmilling activities).
Furthermore, as clearly explained in this research work; not less than 90% and 75% of all the machines in the working and idle periods respectively, generated more than 90 dB acceptable noise level, which is a high level of noise pollution. Moreover, over 95.8% of all the machines exposed the workers to daily personal noise exposure levels above 90 dB and over 96.5% of the machines exposed the operators to noise dose levels more than the acceptable level. These showed that most of the machines produced unacceptable noise, thereby putting the sawmill workers at a significantly high risk of occupational health illnesses and injuries.
It is hereby recommended that proper workplace practices should be implemented, proper maintenance practices should be encouraged, use of PPE should be encouraged, new and modern machines should be procured, alternative electricity generating sets should be placed farther from the working environment, training and occupational safety programmes should be made compulsory for all the workers and all the sawmill workers should be encouraged to go for audiometry tests for early detection of any hearing disorder.
Funding Statement: This work was sponsored by the Tertiary Education Trust Fund (TETFUND) through the Institutional Based Research (IBR) (Ladoke Akintola University of Technology, Ogbomoso, Nigeria) (2016).
Conflicts of Interest: The authors declare that they have no conflict of interest to report regarding the present study.
1. Choudhari, V. P., Dhote, D. S., Patil, C. R. (2011). Assessment and control of sawmill noise. International Conference on Chemical, Biological and Environmental Sciences, (ICCEBS’2011Bangkok, 299–303. [Google Scholar]
2. Peippo, M. M., Hakkala, M. T., Heikkinen, M. O. (2000). Road traffic noise: Turku urban area, PSSD Task Report, Baltic Region Healthy Cities Office, Regional Council of Southwest Finland, 26–27. [Google Scholar]
3. Ouis, D. B. (2001). Annoyance from road traffic noise: A review. Journal of Environmental Psychology, 21(1), 101–120. DOI 10.1006/jevp.2000.0187. [Google Scholar] [CrossRef]
4. Aremu, A. S., Aremu, A. O., Olukanni, D. O. (2014). Assessment of noise pollution from sawmill activities in Ilorin, Nigeria. Nigerian Journal of Technology, 34(1), 72–73. DOI 10.4314/njt.v34i1.9. [Google Scholar] [CrossRef]
5. Skenberg, A. B., Ohrstrom, E. R. (2002). Adverse health effects in relation to urban residential sound-scapes. Journal of Sound and Vibration, 250(1), 151–155. DOI 10.1006/jsvi.2001.3894. [Google Scholar] [CrossRef]
6. Dafis, S. A. (1998). Urban Forestry 2nd Edition. A.U.Th., 45–55. Thessaloniki. [Google Scholar]
7. Alves, J. A., Silva, L. T., Remoaldo, P. C. (2015). The influence of low-frequency noise pollution on the quality of life and place in sustainable cities: A case study from Northern Portugal. Sustainability, 2015(7), 13920–13946. [Google Scholar]
8. Top, Y., Adanur, H., Öz, M. (2016). Comparison of practices related to occupational health and safety in microscale wood-product enterprises. Safety Science, 82, 374–381. DOI 10.1016/j.ssci.2015.10.014. [Google Scholar] [CrossRef]
9. Owoyemi, J. M., Falemara, B. C., Owoyemi, A. J. (2017). Noise pollution and control in mechanical processing wood industries. Biomedical Statistics and Informatics, 2(2), 1–11. [Google Scholar]
10. Uzorh, A. C. (2014). Analysis of industrial noise in a manufacturing company. International Journal of Engineering and Sciences, 3(3), 45–46. [Google Scholar]
11. Mong’are, R. O., Mburu, C., Kiiyukia, C. (2017). Assessment of occupational safety and health status of sawmilling industries in Nakuru County, Kenya. International Journal of Health Sciences, 5(4), 75–102. [Google Scholar]
12. Thepaksorn, P., Siriwong, W., Neitzel, R. L., Somrongthong, R., Techasrivichien, T. (2017). Relationship between noise-related risk perception, knowledge, and the use of hearing protection devices among para rubber wood sawmill workers. Safety and Health at Work, 9(1), 25–29. [Google Scholar]
13. Health and Safety. (2005). The control of noise at work regulations. Statutory Instruments, No. 1643. Schedule 1 Part 1. The Stationery Office Limited Publisher, UK, pp. 53–62. [Google Scholar]
14. Anjorin, S. A., Jemiluyi, A. O., Akintayo, T. C. (2015). Evaluation of industrial noise: A case study of two Nigerian industries. European Journal of Engineering and Technology, 3(6), 1–2. [Google Scholar]
15. WHO. (1991). Report of the informal working group of deafness and hearing impairment programme planning. Geneva, pp. 52–54. [Google Scholar]
16. Wu, T. N., Liou, H. S., Shen, C. Y. (1998). Surveillance of noise-induced hearing loss in Taiwan, ROC: A report of the PRESS-NIHL results. Preventive Medicine, 27(1), 65–69. DOI 10.1006/pmed.1997.0238. [Google Scholar] [CrossRef]
17. Nakai, Y. (2003). Noise-induced hearing loss IFOS NIHL standing committee’s report and NIHL in Japan. International Congress Series, 1240, 273–275. [Google Scholar]
18. Kurmis, A., Apps, S. (2007). Occupationally-acquired noise-induced hearing loss: A senseless workplace hazard. International Journal of Occupational Medicine and Environmental Health, 20(2), 127–136. DOI 10.2478/v10001-007-0016-2. [Google Scholar] [CrossRef]
19. Van der Molen, H. F., de Vries, S. C., Stocks, S. J. (2016). Incidence rates of occupational diseases in the Dutch construction sector, 2010-2014. Occupational and Environmental Medicine, 73(5), 350–352. DOI 10.1136/oemed-2015-103429. [Google Scholar] [CrossRef]
20. Sbihi, H., Davies, H. W., Demers, P. A. (2008). Hypertension in noise-exposed sawmill workers: A cohort study. Occupational and Environmental Medicine, 65(9), 643–646. DOI 10.1136/oem.2007.035709. [Google Scholar] [CrossRef]
21. Lie, A., Skogstad, M., Johannessen, H. A. (2016). Occupational noise exposure and hearing: A systematic review. International Archives of Occupational and Environmental Health, 89(3), 351–372. DOI 10.1007/s00420-015-1083-5. [Google Scholar] [CrossRef]
22. Thepaksorn, P., Thongjerm, S., Siriwong, W., Ponprasit, P. (2020). Occupational hazard exposures and health risks at wooden toys industry in Southern Thailand. Human and Ecological Risk Assessment: An International Journal, 26(8), 2162–2172. DOI 10.1080/10807039.2019.1656053. [Google Scholar] [CrossRef]
23. Thepaksorn, P., Koizumi, A., Harada, K., Siriwong, W., Neitzel, R. L. (2018). Occupational noise exposure and hearing defects among sawmill workers in the south of Thailand. International Journal of Occupational Safety and Ergonomics (JOSE), 25(3), 1–9. [Google Scholar]
24. Arana, M. A., Garcia, A. Y. (1998). A social survey on the effects of environmental noise on the residents of pamplona, Spain. Applied Acoustics, 53(4), 245–253. DOI 10.1016/S0003-682X(97)00067-4. [Google Scholar] [CrossRef]
25. Stansfeld, S. A. (1992). Noise sensitivity and psychiatric disorder: Epidemiological and psycho-physiological studies. Psychological Medicine, 22, 41–42. [Google Scholar]
26. Job, R. F. S., Felix, R. A., William, B. I. (1996). The influence of subjective reactions to noise on health effects of the noise. Environmental International, 22(1), 93–104. DOI 10.1016/0160-4120(95)00107-7. [Google Scholar] [CrossRef]
27. Otoghile, B. K., Onakoya, P. A., Otoghile, C. C. (2018). Auditory effects of noise and its prevalence among sawmill workers. International Journal of Medicine and Medical Sciences, 10(2), 27–30. DOI 10.5897/IJMMS2017.1344. [Google Scholar] [CrossRef]
28. Concha-Barrientos, M., Campbell-Lendrum, D., Steenland, K. (2004). Occupational noise: Assessing the burden of disease from work-related hearing impairment at national and local levels. World Health Organization Protection of the Human Environment. Geneva Environmental Burden of Disease Series, 9, 1–41. [Google Scholar]
29. American Society of Mechanical Engineers. (1956). Handbook for small Sawmill operators. First Edition. New York, pp. 25–33. [Google Scholar]
30. Osibogun, A., Igweze, I. A., Adeniran, L. O. (2000). Noise-induced hearing loss among textile workers in Lagos metropolis. Nigerian Postgraduate Medical Journal, 7(3), 104–111. [Google Scholar]
31. Ahmed, H. O., Dennis, J. H., Badran, O., Ismail, M., Ballal, S. G. et al. (2001). Occupational noise exposure and hearing loss of workers in two plants in eastern Saudi Arabia. Annals of Occupational Hygiene, 45(5), 371–380. DOI 10.1016/S0003-4878(00)00051-X. [Google Scholar] [CrossRef]
32. Sriwattanatamma, P., Breysse, P. (2000). Comparison of NIOSH noise criteria and OSHA hearing conservation criteria. American Journal of Industrial Medicine, 37, 334–338. [Google Scholar]
33. Federal Environmental Protection Agency (FEPA). (1991). NOISE EXPOSURE LIMITS FOR NIGERIA. National Interim Guidelines and Standards for Industrial Effluents, Gaseous Emissions and Hazardous Wastes Management in Nigeria Part I, 69–99. [Google Scholar]
34. Halvani, Gh. H., Zare, M., Barkhordari, A. (2009). Noise induced hearing loss among textile workers of Taban factories in Yazd. Journal of Birjand University of Medical Sciences, 15(4), 69–74. [Google Scholar]
 | This work is licensed under a Creative Commons Attribution 4.0 International License, which permits unrestricted use, distribution, and reproduction in any medium, provided the original work is properly cited. |