DOI: 10.32604/sv.2021.013754
ARTICLE
Experimental Study of Effect of Temperature Variations on the Impedance Signature of PZT Sensors for Fatigue Crack Detection
1Institute of Vibration, Shock and Noise, State Key Laboratory of Mechanical System and Vibration, Shanghai Jiaotong University, Shanghai, 200240, China
2Department of Mechanical Engineering, University of Management and Technology, Sialkot Campus, Sialkot, Pakistan
3Institute of Refrigeration and Cryogenics, Shanghai Jiaotong University, Shanghai, 200240, China
4Department of Mechanical Engineering, National Fertilizer Cooperation (NFC), Institute of Engineering and Technology, Multan, Pakistan
5Department of Mechanical Engineering, Mirpur University of Science and Technology (MUST), Mirpur, 10250, Pakistan
6The School of Information Science and Engineering, Xiamen University, Xiamen, 361005, China
7Mechanical Engineering Department, UET Taxila, Taxila, Pakistan
*Corresponding Author: Saqlain Abbas. Email: saq-abbas@sjtu.edu.cn
Received: 19 August 2020; Accepted: 10 December 2020
Abstract: Structural health monitoring (SHM) is recognized as an efficient tool to interpret the reliability of a wide variety of infrastructures. To identify the structural abnormality by utilizing the electromechanical coupling property of piezoelectric transducers, the electromechanical impedance (EMI) approach is preferred. However, in real-time SHM applications, the monitored structure is exposed to several varying environmental and operating conditions (EOCs). The previous study has recognized the temperature variations as one of the serious EOCs that affect the optimal performance of the damage inspection process. In this framework, an experimental setup is developed in current research to identify the presence of fatigue crack in stainless steel (304) beam using EMI approach and estimate the effect of temperature variations on the electrical impedance of the piezoelectric sensors. A regular series of experiments are executed in a controlled temperature environment (25°C–160°C) using 202 V1 Constant Temperature Drying Oven Chamber (Q/TBXR20-2005). It has been observed that the dielectric constant  which is recognized as the temperature-dependent constant of PZT sensor has sufficiently influenced the electrical impedance signature. Moreover, the effective frequency shift (EFS) approach is optimized in term of significant temperature compensation for the current impedance signature of PZT sensor relative to the reference signature at the extended frequency bandwidth of the developed measurement system with better outcomes as compared to the previous literature work. Hence, the current study also deals efficiently with the critical issue of the width of the frequency band for temperature compensation based on the frequency shift in SHM. The results of the experimental study demonstrate that the proposed methodology is qualified for the damage inspection in real-time monitoring applications under the temperature variations. It is capable to exclude one of the major reasons of false fault diagnosis by compensating the consequence of elevated temperature at extended frequency bandwidth in SHM.
Keywords: Electromechanical impedance; structural health monitoring; piezoelectric sensors; fatigue crack; temperature compensation
The implementation of structural health monitoring (SHM) in any mechanical or civil infrastructure is important to identify the abnormalities and ensure its optimal performance. There are several notable SHM methods to measure the integrity and safety level of in-service structures, including, wave propagation [1], acoustic emission, comparative vacuum monitoring, and electromechanical impedance (EMI) [2–5]. To identify the structural abnormality by using the electromechanical coupling characteristic of piezoelectric sensors, the EMI approach is regarded to be one of the most favorable approaches. It can locate the incipient damage using the piezoelectric sensors which are light in weight and smaller in size [6]. These sensors are bonded on the monitored structure to notice the abnormal behaviour under the operational conditions and ensure its integrity. To detect the presence of a crack, the EMI approach measures the mechanical impedance of structure by using the electromechanical coupling property of piezoelectric sensors because the electrical impedance of piezoelectric sensors is precisely correlated to the mechanical impedance of the monitored specimen. In the next step, the measured impedance is compared with a baseline impedance measurement to evaluate the intensity of damage [7–9]. The electrical impedance should be estimated at higher frequencies to achieve accurate inspection results.
The EMI method has got the attention of a lot of researchers to improve its effectiveness, and numerous research studies [10,11] have depicted that it’s possible to implement EMI method not only in lab-scale work but also in complex configurations. Liang et al. [12] have worked on the theoretical expansion of EMI approach and its application in SHM. Yang et al. [13] analyzed the impact of sensor bonding thickness on the electrical impedance signature by performing the numerical analysis on contact between the monitored structure and bonded PZT. Hamzeloo et al. [14] conducted finite element modelling (FEM) of a hollow cylinder to investigate the effect of crack location and its type on EMI spectrum. However, the requirement of small element size in FEM, particularly in a high-frequency range, has hindered the effectiveness of their work in practical applications in terms of the high cost. Park et al. [15] proposed a spectral element method (SEM) to signify the effective characteristics of a coupled PZT patch and beam structure. To construct stiffness matrices and element mass, SEM utilizes the frequency-dependent shape functions. Therefore, it presents precise dynamic features of a monitored specimen and achieves accurate interpretations even in the high-frequency range [16]. Wongi et al. [17] and Zuo et al. [18] utilized the EMI signals and individually examined the crack breathing phenomenon in pipelines. Zhu and Qing et al. [19,20] worked on composite material structures and analyzed the disbond within the honeycomb sandwich composite material components. Li et al. [21] developed an electromechanical-based analytical approach to investigate the presence of nonlinear vibration in corrugated graphene/piezoelectric (CGP) laminated infrastructures. Despite the fact, the EMI method utilizes small and low-cost sensors, the estimation of the electrical impedance signature, which is the primary step of the whole procedure, is generally achieved by some commercial impedance analyzers, namely, the 4192A and 4294A. However, these high-cost impedance measuring tools cannot be used in real-world applications because of their slow working efficiency. Based on the concept of conventional impedance analyzers, in which each measurement is obtained under steady-state condition within the defined frequency range, numerous researchers have introduced low-cost instruments for overall impedance measurements. Steady-state measurement systems for specific applications in SHM have also been proposed. In a steady-state measurement scheme presented by Panigrahi et al. [22], a function generator was utilized to generate the excitation signal at each frequency step and the corresponding output response at each excitation frequency was observed by an oscilloscope. It is obvious that the proposed steady-state measurement scheme yields accurate and authentic results, however, the measurements normally take a long time because the frequency of the pure sinusoidal signal should be gradually increased step-by-step for the crack identification. This time consumption might be very important if the damage inspection is performed for a wide frequency range with numerous steps.
For over-all SHM utilization, the test setup does not need to measure accurately the electrical impedance. Since the recognition of structural damage is achieved by comparing the two impedance signatures, it is only significant that the test setup should have excellent repeatability between the measured values and high sensitivity for the variations caused by different parameters, such as temperature, in the mechanical impedance of the monitored structure. From these aspects, it is compulsory to develop such EMI-based test setup which not only measures the damage sensitivity but also insensitive to temperature variations.
1.1 Effect of Temperature Variations on PZT Sensors
The impedance-based method is indeed qualified to implement it in complicated infrastructures to identify incipient damage, but some particular factors have hindered the integrity of EMI to real-world applications. In most cases, the component that is being examined is continuously exposed to the several varying environmental and operating conditions (EOCs) and unfortunately, it is considered normal in regular inspections. Environmental parameters that affect the EMI inspection system include variations in applied loading conditions, humidity, temperature and moisture. These variations can impede the inspection process and cause misperception to quantify the damage index. Since the piezoelectric sensors used in the EMI method are also significantly pyroelectric, the temperature is considered as a major environmental factor influencing the EMI inspection procedure. The effect of temperature on the electrical impedance signatures has been measured one of the most serious complications once the electrical impedance signature of the PZT sensor undergoes different changes because of environmental temperature variations. The behaviour of electrical impedance signature of a transducer relies both on the properties of the piezoelectric material and the properties of the examined structure. Therefore, the appearance of any abnormality in the usual trend of impedance signature is the result of changes in both the properties of the piezoelectric material and the mechanical properties of the examined structure due to temperature variation. It has been investigated in the literature that the temperature variations not only influence the geometry of the monitored structure but also the mechanical properties of the material such as Young’s modulus, affecting its dynamic properties. The most significant dynamic variations are the natural frequencies of the examined structure because the electrical impedance signatures exhibit resonance peaks associated with these natural frequencies. Safaeifar et al. [23] studied the fluctuations in the natural frequencies of a monitored structure due to temperature variations. It has been observed that the natural frequency of a structure decreases with the increasing temperature.
Numerous approaches have been proposed for the compensation of temperature variations in SHM. Bhalla et al. [24] examined the impact of environmental temperature on the impedance signatures. A temperature compensation method based on cross-correlation is developed by Sun et al. [25] to optimize the horizontal shift in the electrical impedance signature. Park et al. [26] introduced the appropriate shifts in the vertical and horizontal directions and presented an impedance-based SHM approach under variable operational temperature conditions by taking the root mean square deviations of the acquired signatures into account. Further, Koo et al. [27] reviewed the approach presented by Park et al. [26] and proposed an efficient technique named effective frequency shift (EFS) to compensate for the impact of environmental temperature. However, all of these above-mentioned approaches have been executed in a specific narrow range of temperature with certain limitations. Such as in the case of the wide frequency range, it has been recognized that the higher value of correlation coefficient between the two impedance signatures causes the inaccuracy in the metric indices. Moreover, it is suggested to assume the smaller value of the frequency step in relative to the frequency shifts caused by the structural damage and environmental temperature variations.
To deal with these limitations, the proposed research includes the identification of fatigue crack using electrical impedance signatures of PZT sensors at the evaluated temperature (25°C–160°C) and extended frequency bandwidth (25 kHz–175 kHz). Further, the effective frequency shift (EFS) technique is modified in the current research for the compensation of elevated temperature effect over the electrical impedance signature of the PZT sensor. A series of experiments are conducted using specialized 202 V1 Constant Temperature Drying Oven Chamber (Q/TBXR20-2005) to verify the effectiveness of the adopted procedure in the presence of temperature variations. The acquired experimental results at the extended range of operating conditions confirm the accuracy of the developed measurement system in terms of higher damage sensitivity and temperature compensation as compared to previous research work.
The article is categorized as follows: Section 2 explains the fundamentals of the EMI method including the governing equations for damage sensitivity. The complete description of the experimental setup is provided in Section 3. The results regarding the localization of fatigue crack and parametric analysis of temperature effect are discussed in detail in Section 4. The conclusions of the proposed test methodology and improved temperature compensation approach are described in Section 5.
The electromechanical interconnection between the mechanical impedance of the examined specimen and the electrical impedance of the bonded PZT sensor is the fundamental concept of EMI technique. Therefore, the piezoelectric patch works as a sensor and actuator simultaneously in it, and the acquired electrical impedance signature lies in the defined range of operational conditions.
The piezoelectric materials are assumed as a parallel plate capacitor with reference to the impedance model presented in the previous studies, while the dielectric is a piezoelectric material. Because of possessing the property of piezoelectricity, the excitation signal generates both the electric field and mechanical deformation. However, in case of low voltage of the excitation signal, the piezoelectric effect is considered almost linear [28].
Normally, the thin sized piezoelectric patches are used in the EMI technique. Consequently, as compared to other directions, a small deformation is measured in the thickness direction of PZT which can be neglected. Therefore, only the lengthwise distortion of the examined specimen is evaluated in the case of a one-dimensional problem. According to this assumption, the electrical impedance of the PZT (Lead Zirconate Titanate) sensor derived by Baptista et al. [29] is expressed in Eq. (1):

where  shows the electrical impedance,
  represents the angular frequency,
  displays the static capacitance for a square-shaped PZT of size
  ,
,  shows the piezoelectric constant,
  displays the compliance at a constant electric field,
  expresses the wave-number,
  exhibits the mechanical impedance of the PZT sensor, || indicates a parallel connection, j shows the unit imaginary number and
  demonstrates the mechanical impedance of the monitored structure.
Eq. (1) shows that the electrical impedance ( ) of the PZT patch depends on the mechanical impedance (
 ) of the inspected specimen. Hence, the presence of any abnormality causes the fluctuation in the mechanical impedance of the examined specimen which influences the electrical impedance of the PZT sensors. Thus, it would become easy to examine the structural health by simply evaluating the electrical impedance signatures of the PZT sensors using Eq. (1).
2.1 Governing Equations for Damage Sensitivity
In the EMI method, the damage sensitivity is determined by utilizing suitable metric indices. Correlation coefficient deviation metric (CCDM) and Root mean square deviation (RMSD) are recognized as most generally used indices. Two measured electrical impedance signatures are compared in these indices. The first signature is achieved during a healthy condition which is termed as a reference or baseline, while another signature is achieved in case of structural damage [25,26].
The characteristic of both indices RMSD and CCDM are different from each other. The CCDM index has higher sensitivity for the variation in the shape of the impedance signatures, for example, frequency shifts. Conversely, the RMSD index is considered to be more sensitive to the changes in the amplitude of the impedance signatures. Meanwhile, both indices are considerably influenced by the operational temperature variations [30]. Based on literature assumptions, the CCDM index is chosen in the current research analysis to quantify the sensitivity of fatigue crack as it is less subjected to the amplitude variations caused by sudden instabilities in a measurement system such as inaccurate probes connections, etc. The CCDM index based on the correlation coefficient [31] can be defined as:

where  represents the correlation coefficient which can be calculated by Eq. (3):
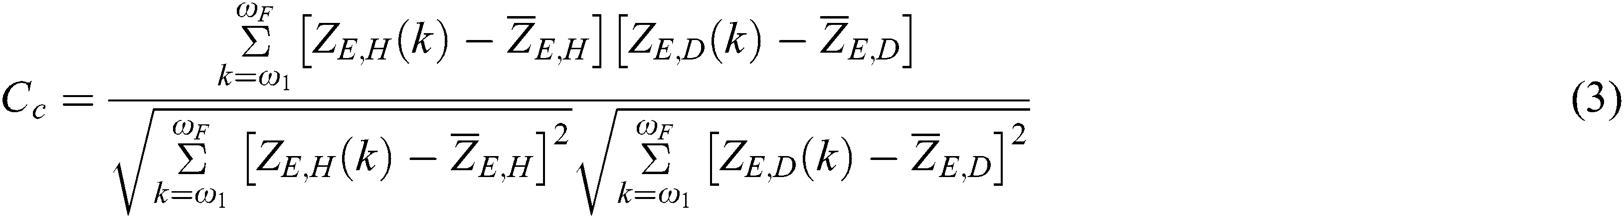
where  and
and  represent the electrical impedance signatures (i.e., the magnitude, the real part or the imaginary part) that are known by Eq. (1) for the structure under healthy and damaged conditions, respectively;
  and
and  exhibit the initial and final frequency, respectively;
  represents the averaged signatures under healthy conditions, while
  shows the averaged signatures under damaged conditions.
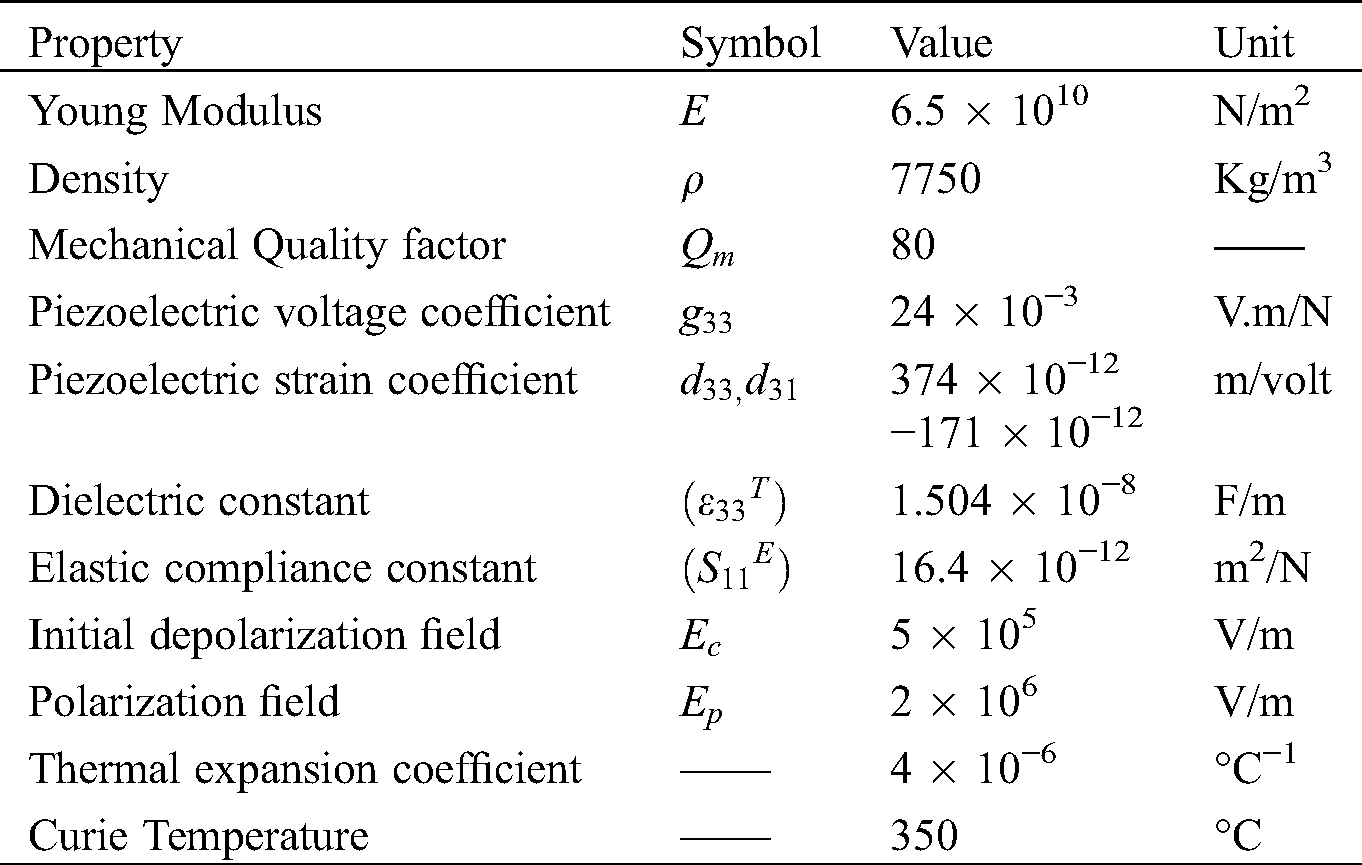
The variation in temperature results in significant changes in the dynamic response of both the PZT sensor and monitored specimen. Electrical impedance of the sensor is greatly influenced by the temperature variations because the piezoelectric materials are considerably pyroelectric. Hence, the temperature can be estimated by analyzing the electrical impedance of the PZT sensors [32,33]. It has already been mentioned that the natural frequency of monitored specimen is also influenced by the temperature variations and its value decreases with the temperature. The presence of resonance peaks in the electrical impedance signatures represent frequency shift caused by the change in natural frequency of structure [34], and it has been verified in the next section. To ensure the integrity and optimal performance of impedance-based SHM measurement systems, the temperature variations must be compensated. The properties of PZT material at room temperature are provided in Tab. 1.
Table 1: Material properties of PZT sensors [35]
3 Development of Experimental Setup
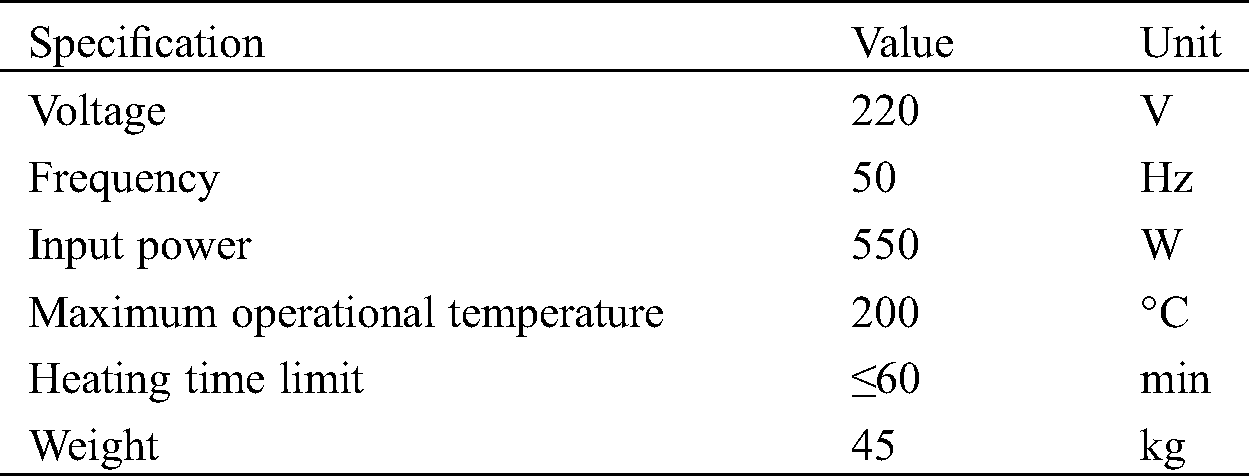
Experiment setup contains stainless steel (304) beam of dimensions 350 mm × 30 mm × 4 mm, PZT sensors, signal wires, function generator, digital phosphor oscilloscope (Tektronix DPO 3014), and 202 V1 Constant Temperature Drying Oven Chamber (Q/TBXR20-2005) to provide a controlled heating environment. Internal view and specifications of Drying Oven Chamber are demonstrated in Fig. 1 and Tab. 2, respectively.
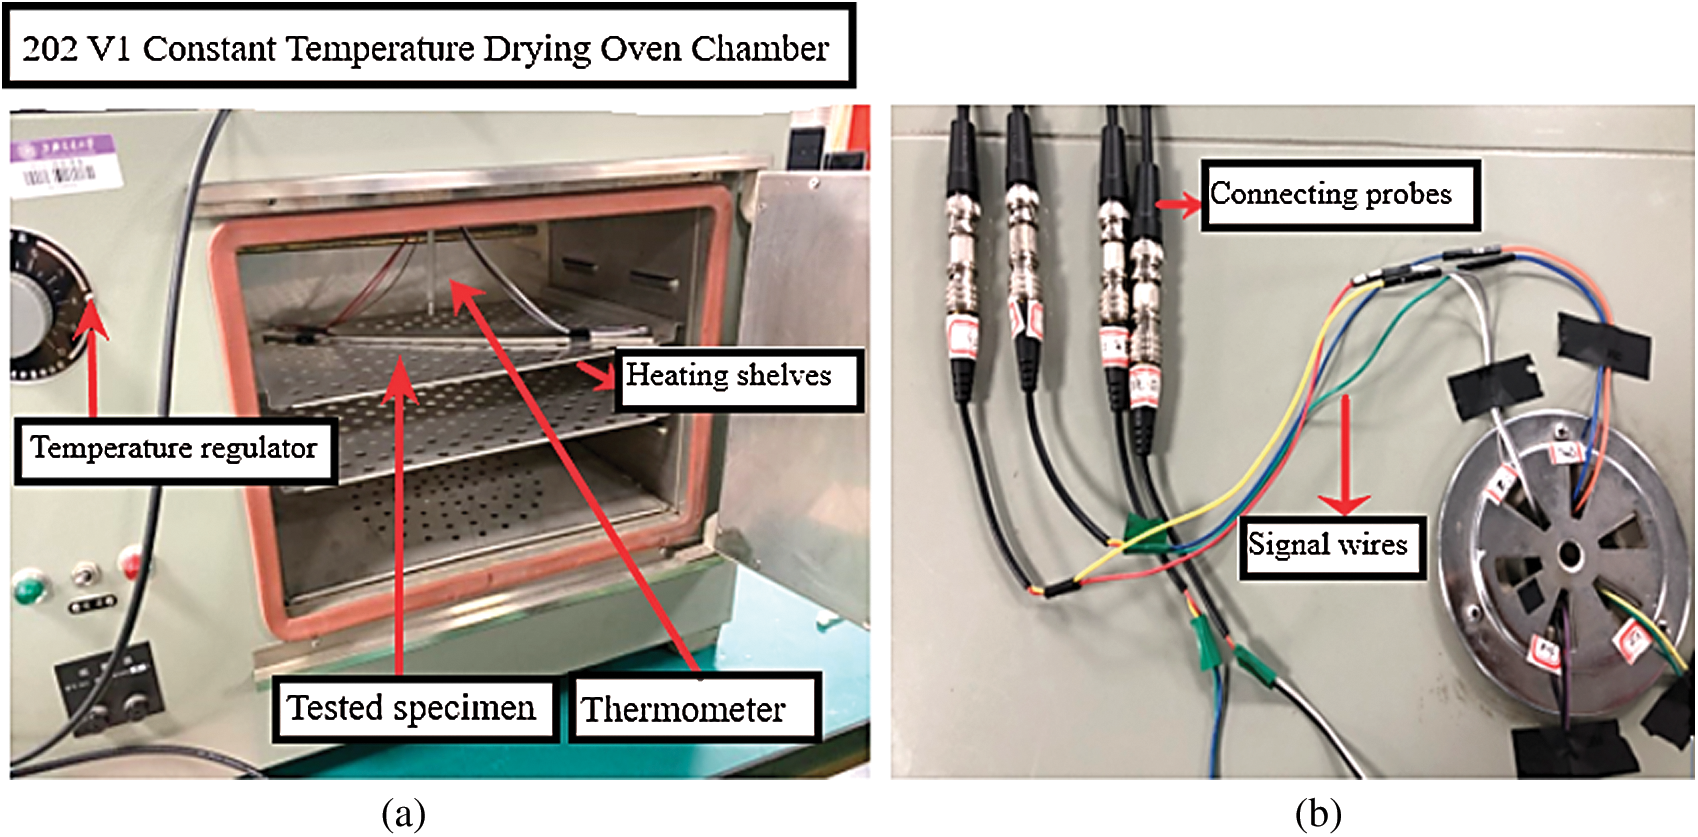
Figure 1: (a) Internal view of Constant Temperature Drying Oven Chamber; (b) Transmission & reflection signals probs network
Table 2: Specifications of 202 V1 Constant Temperature Drying Oven Chamber
To actuate and measure the propagating signal, two PZT patches were bonded at both surface ends of the intact beam and it was excited by five cycle’s sinusoidal wave modulated by Hanning window function. To generate a fatigue crack, a steel beam of a bit larger width (350 mm × 35 mm × 4 mm) was selected. Firstly, a triangular-shaped notch of 5 mm was incised in the middle of the beam as an instant crack. The depth and width of the notch were kept the same. In the next step, the specimen was undergone to a high-cycle fatigue processing provided by fatigue testing platform of MTS with the sinusoidal tensile load of 8 Hz in the range of 0 kN to 15 kN. After approximately 68000 cycles, a slightly visible fatigue crack of 10 mm was generated in the beam. Next, the notch was eliminated by the milling machine. Hence, a beam of required dimensions (350 mm × 30 mm × 4 mm) with fatigue crack was achieved. A slightly visible fatigue crack of 10 mm and the location of PZTs bonded on the beam are shown in Fig. 2.
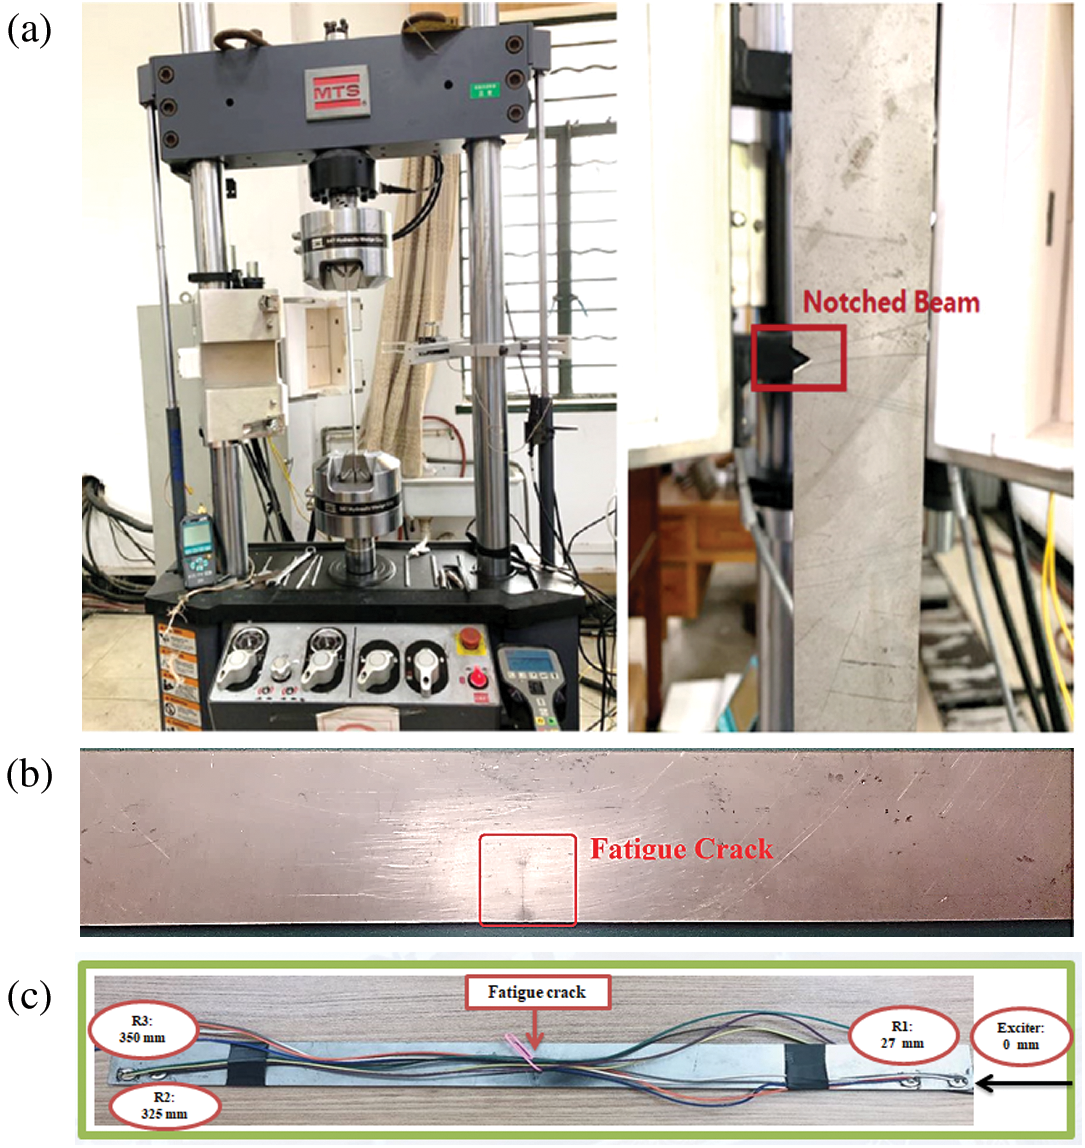
Figure 2: (a) Fatigue testing using MTS; (b) A slightly visible fatigue crack of 10 mm in the beam; (c) Beam geometry with the exact location of bonded PZTs
To examine the effect of temperature on crack opening and closing, the temperature ranging from 25°C to 160°C was assumed in the view of initial experimental results of an intact beam. Both surface-ends of the beam were glued to four PZT sensors including one actuator and three receivers. The diameter of each PZT sensor was 8mm. To create excitation and receive reflection signal, the actuator and one receiver were fixed at one surface end of the beam, respectively. On the other hand, to measure the transmission signal, the remaining two receivers were located at the opposite surface end of the beam. The beam was excited by five cycle’s sinusoidal wave modulated by Hanning window function. Under the variable operational temperature (25°C–160°C) and frequency (25 kHz–175 kHz) conditions, the effect of the central frequency with the step of 25 kHz was analyzed. The complete data of measured signals were received and saved by the digital phosphor oscilloscope (Tektronix DPO 3014), and all the signals were observed after achieving the steady-state temperature. The inside heating oven temperature was monitored by a thermometer. The complete measurement test setup is shown in Fig. 3.
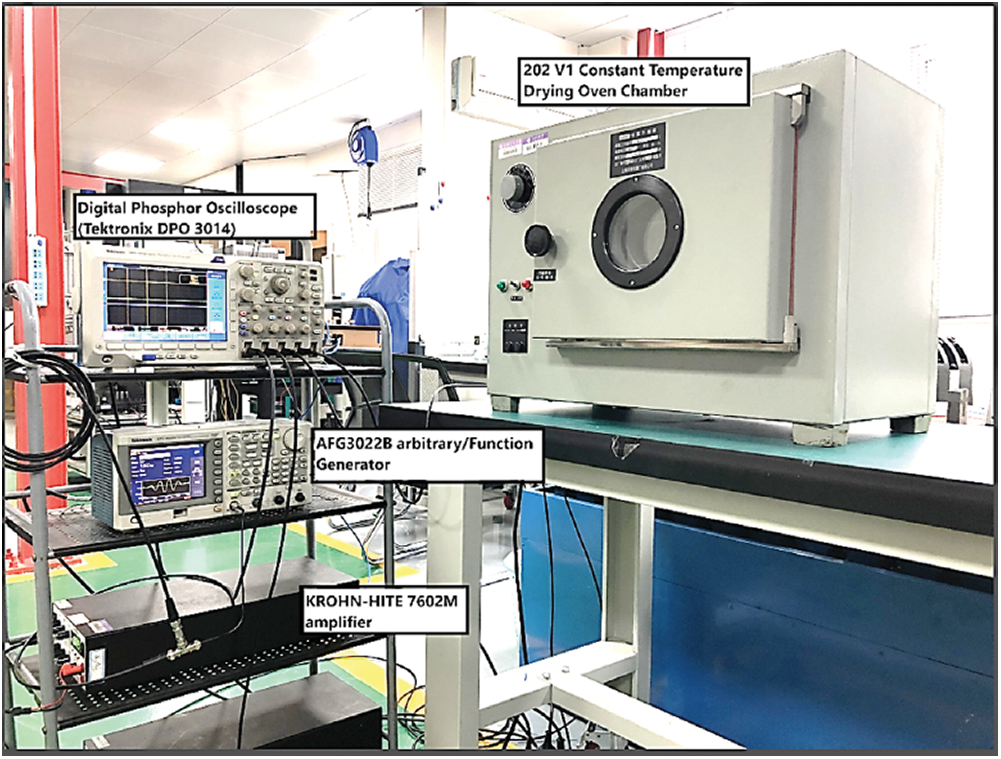
Figure 3: Measurement test setup
Once the temperature in the heating oven is reached to steady-state, it can be controlled automatically within a certain period by the means of electrical control lines according to the required experimental conditions. Each signal is recorded and analyzed after achieving the corresponding steady-state of desired temperature value during the regular series of experiments. The measurements recorded at room temperature were recognized as a reference. The applied temperature was uniformly distributed with a period of 100 ms, while the length of the received signals was 0.6 ms. Later all the measured voltage variables were converted into resistance variables to calculate the electrical impedance of PZT sensors using math formulations. The process diagram of the proposed research is presented in Fig. 4.
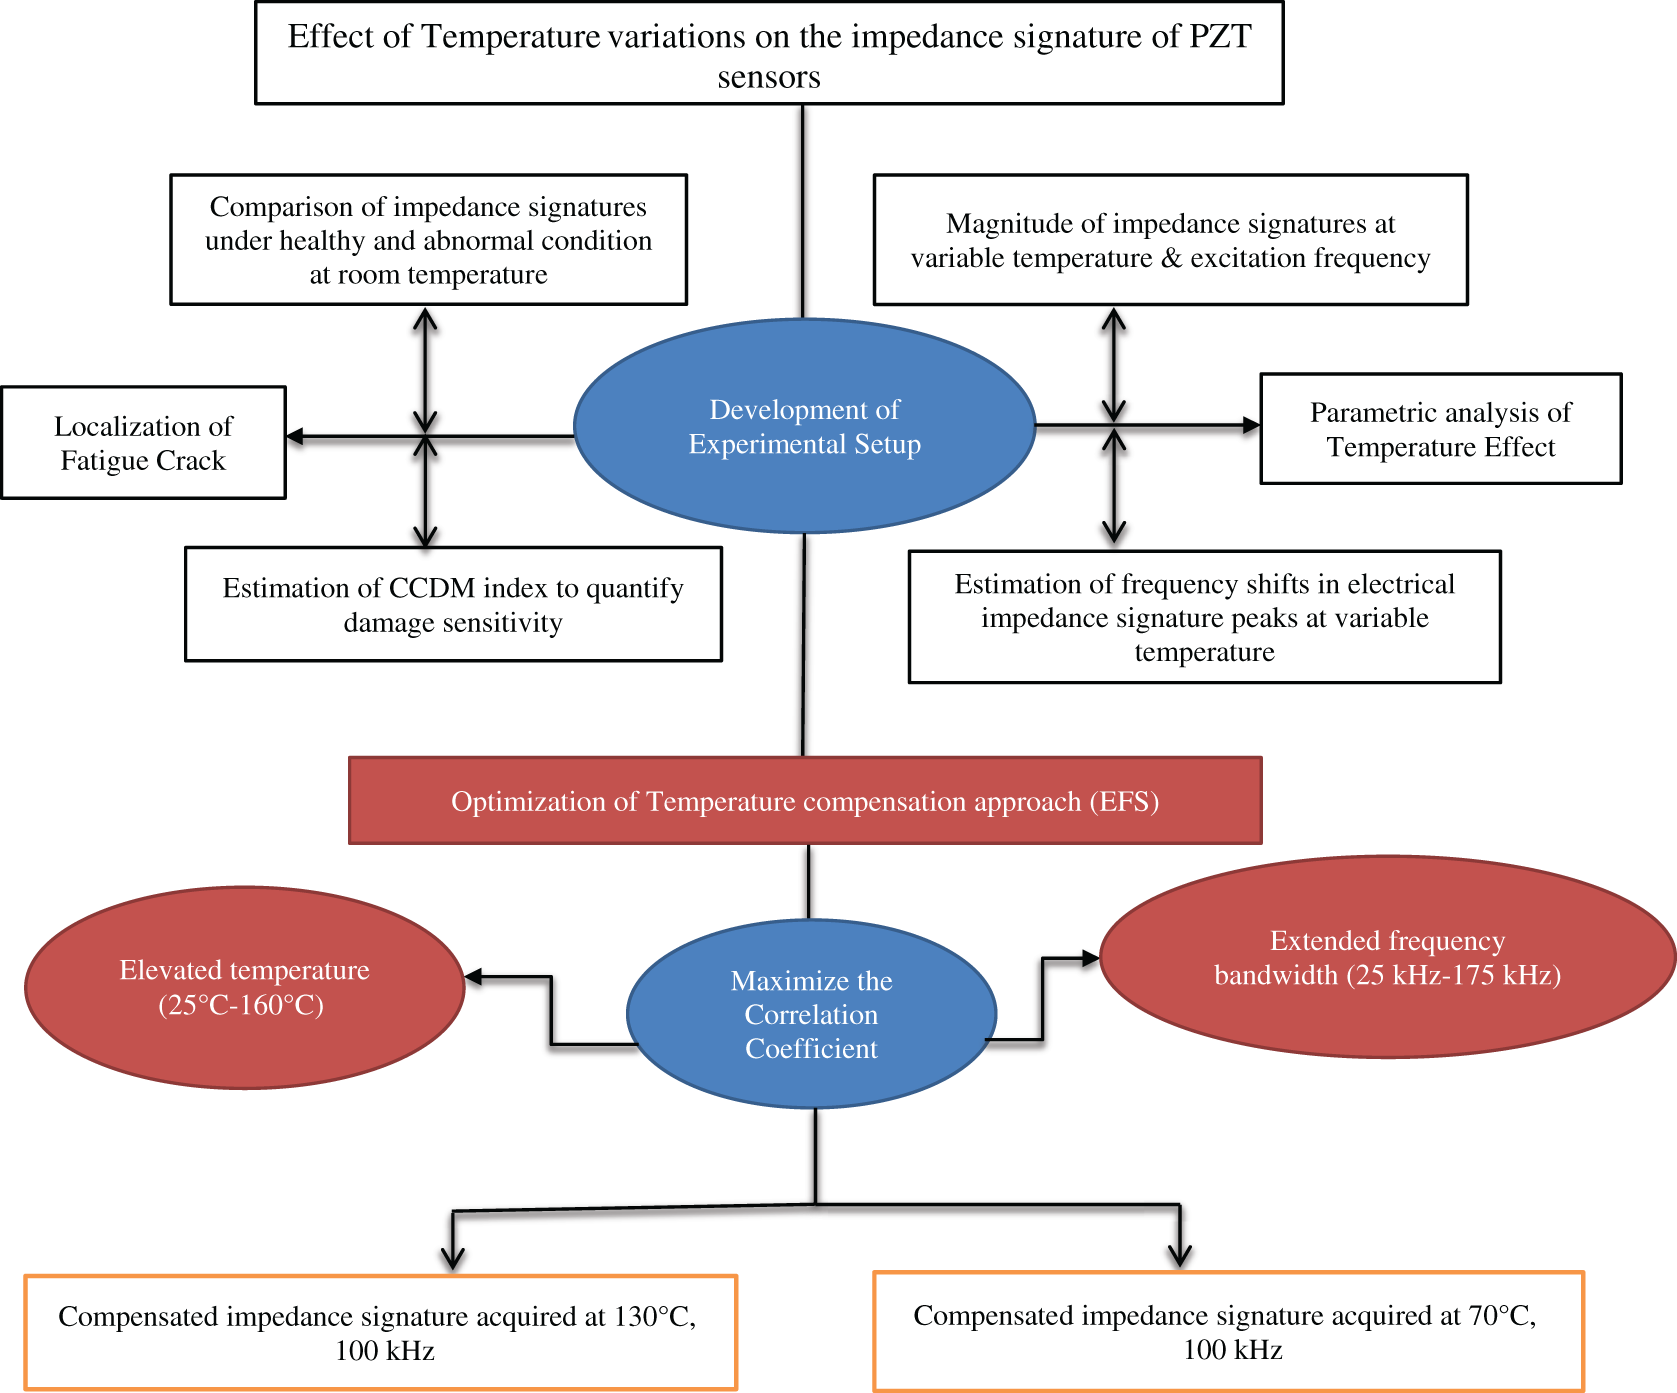
Figure 4: Process diagram
In this section, experimental findings and corresponding results are discussed and interpreted in the following three phases.
4.1 Phase-1: Real-Time Diagnosis and Localization of Fatigue Crack
The capability of the measurement system to accurately identify and locate the real-time damage using the multiple sensors under temperature variations has been investigated in the several experiments performed in controlled temperature environment (25°C–160°C). The presence of fatigue crack was examined by estimating the CCDM indices in an adequate frequency range. As it is recognized, higher damage indices are achieved when the frequency is below 100 kHz. However, it is still quite difficult to select a suitable frequency band because some structural damages are more sensitive to higher frequencies. To approach this issue, the frequency bandwidth of the developed measurement system is increased in the proposed research for the real-time diagnosis and localization of fatigue crack as compared to the previous work [30]. In the current experimental analysis, signal amplitude and its corresponding group velocity are used as indicators to distinguish the performance of the measured signals at normal operating temperature and excitation frequency under different kHz. It has been observed that with the increase of a certain range of excitation frequency (25 kHz-175 kHz), the amplitude of measured signals increases, while the shifting of the signal’s peaks gradually towards the right direction signifies the slight reduction in the magnitude of group velocity. After performing several experiments, it was concluded that the increment in excitation frequency above 100 kHz caused the further reduction in group velocity of measured signals. Hence, the measured voltage signals for both intact and cracked beam at normal operating temperature (25°C) and the excitation frequency of 100 kHz are analyzed in Fig. 5. The amplitude of the measured signal for the cracked beam is found to be smaller than the amplitude of the intact beam because the transmission energy of the signal is decreased due to the presence of a crack.
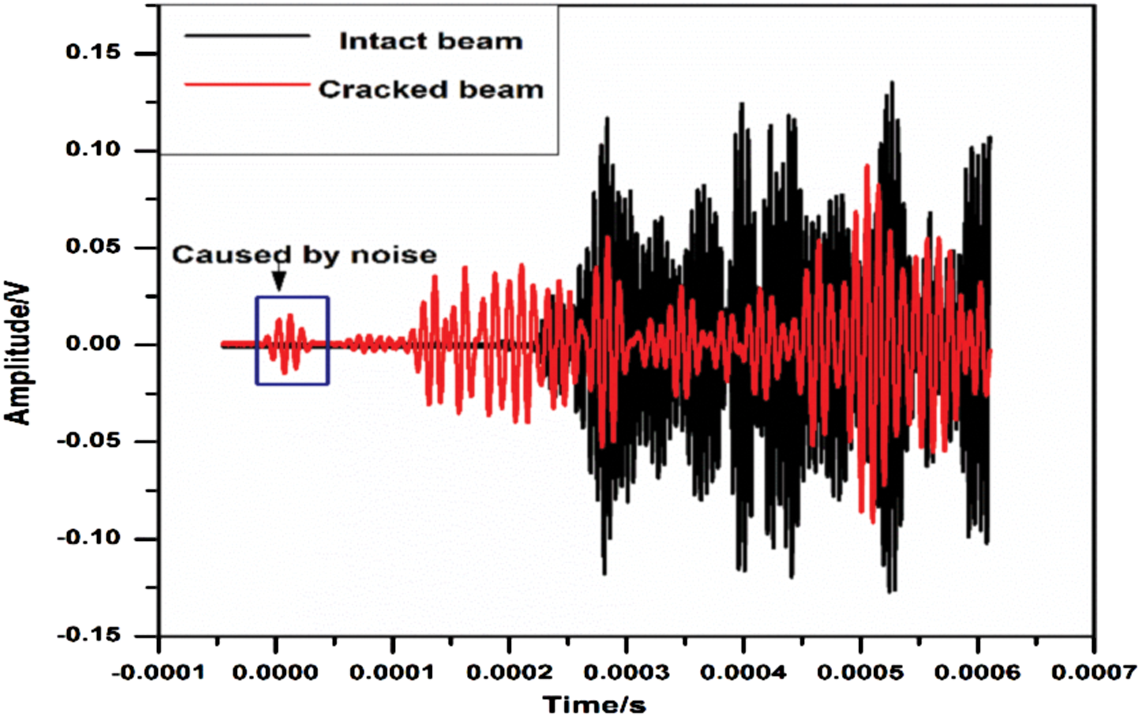
Figure 5: Measured signals at normal operating temperature and excitation frequency of 100 kHz
Furthermore, an obvious advancement of measured signals in the cracked beam reveals the two main facts of this investigation, including, the existence of fatigue crack and the noise of the measurement test setup. The region demonstrated by the blue color signifies the noise and it can be controlled by recognizing the difference of measured signals more instinctively. Hence, the presence of fatigue crack causes the fluctuation in the mechanical impedance of the examined specimen which influences the electrical impedance of the PZT sensors. Thus, it would become easy to examine the structural health by simply evaluating the electrical impedance signatures of the PZT sensors using Eq. (1). To this purpose, measured voltage variables are converted into the resistance variables, and any variation in the electrical impedance of the PZT sensor will be the resultant of fluctuation in the resistance variable caused by the fatigue crack or by some environmental source such as temperature, etc. In this framework, Fig. 6 displays the electrical impedance signatures acquired for intact (baseline) and cracked beam at room temperature.
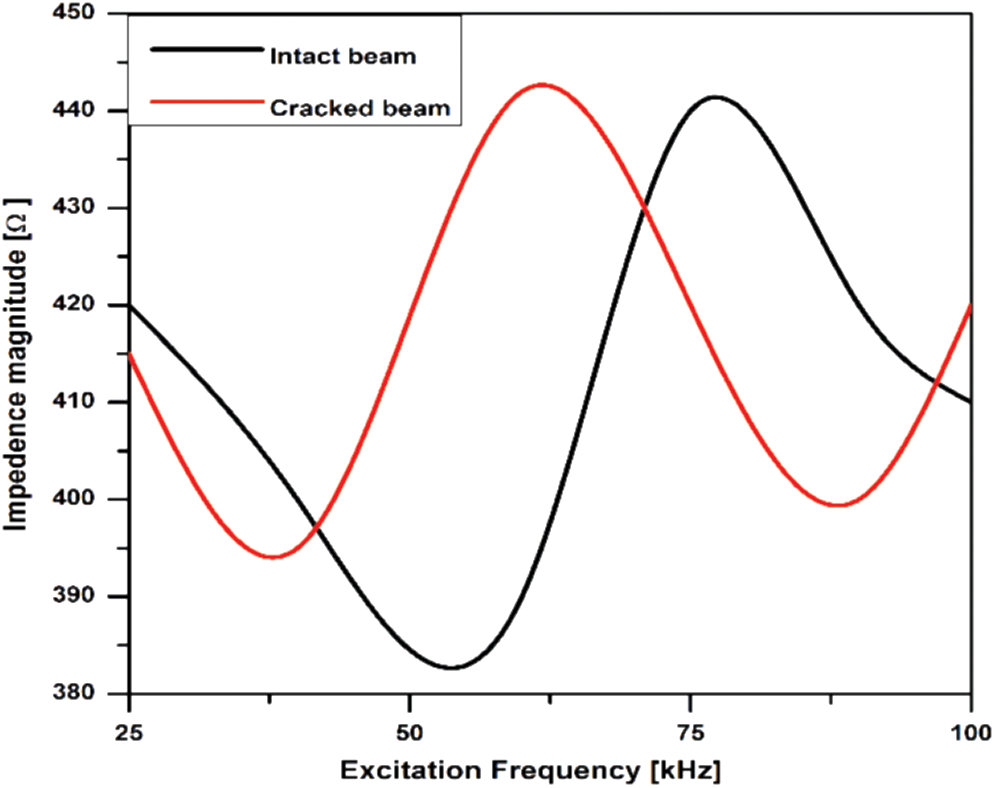
Figure 6: Measurement for the impedance magnitude in case of a fatigue crack
The presence of damage in a structure influences its different properties such as stiffness, mass, damping, etc. Consequently, the mechanical impedance of the structure would be changed. Therefore, any variations in the electrical impedance signatures are associated with the damage or change in monitored structure. Hence, Fig. 6 illustrates the variations in the electrical impedance signatures caused by the presence of fatigue crack in the monitored specimen with respect to the baseline signatures. In the next step, the fatigue crack was identified and quantified by measuring the CCDM indices for the real part of the impedance signatures using Eq. (2) as shown in Fig. 7. The real part of the impedance signatures was supposed to be more sensitive to crack identification [29]. Indices for intact beam were normalized, resulting CCDM = 1.
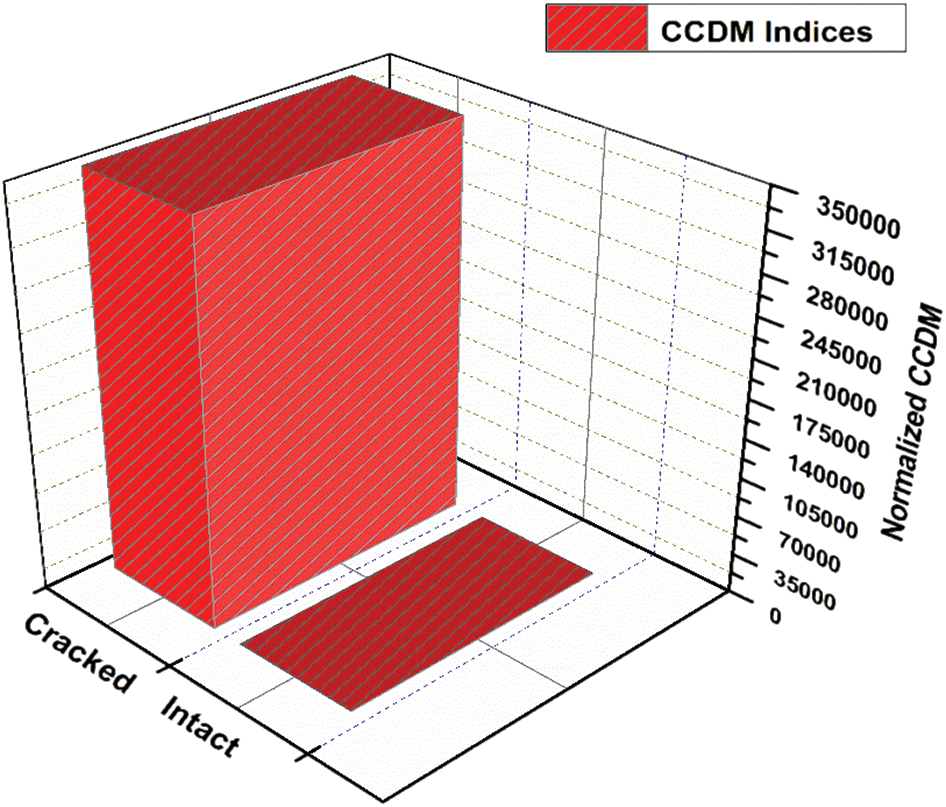
Figure 7: Normalized CCDM indices for the real part of the impedance signatures
In Fig. 7, it can be noticed that the value of the CCDM index for the cracked beam is 350,000 times higher than that obtained for the intact beam. This result not only reveals the higher sensitivity of the measurement system for the identification of structural damage but also encourages measuring the thermal sensitivity of EMI-based structural health monitoring. Electrical impedance of the PZT sensor is greatly influenced by the temperature variations because the piezoelectric materials are considerably pyroelectric. Hence, the fluctuation in temperature consequences the major variations in the dynamic response of both the PZT sensor and monitored specimen. To this purpose, the effect of temperature on measured impedance signatures is analyzed in the following phase.
4.2 Phase-2: Parametric Analysis of Temperature Effect
To evaluate the impact of temperature on impedance signature, next series of experiment was performed in the controlled heating environment (25°C–160°C) using 202 V1 Constant Temperature Drying Oven Chamber (Q/TBXR20-2005). The inside heating oven temperature was monitored by a thermometer. Each signal is recorded and analyzed after achieving the corresponding steady-state of the desired temperature value. To evaluate the impact of applied temperature, only the S0 and A0 modes were selected in the specified range of excitation frequency (25 kHz–175 kHz). The magnitude of impedance signatures acquired at variable temperature and excitation frequency is shown in Fig. 8. The impedance signature measured at 25°C is assumed as a reference in the current analysis.
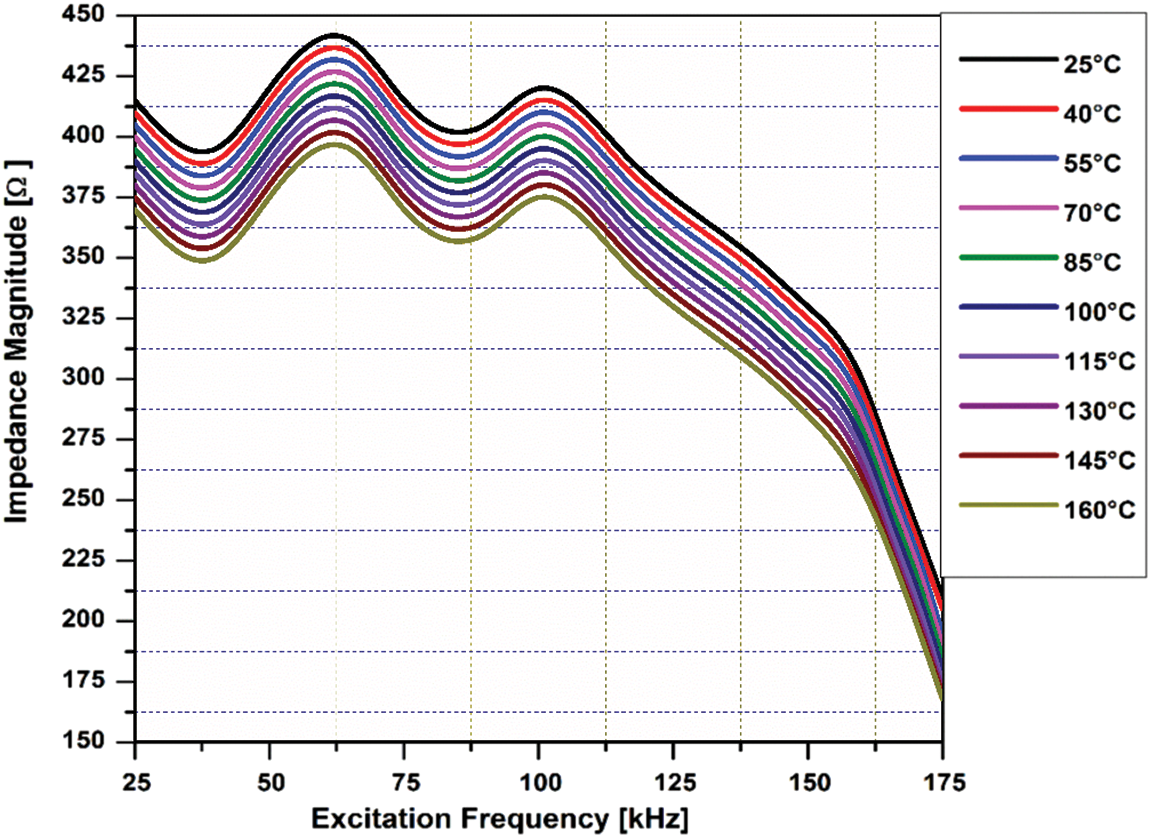
Figure 8: The magnitude of impedance signatures under operational conditions
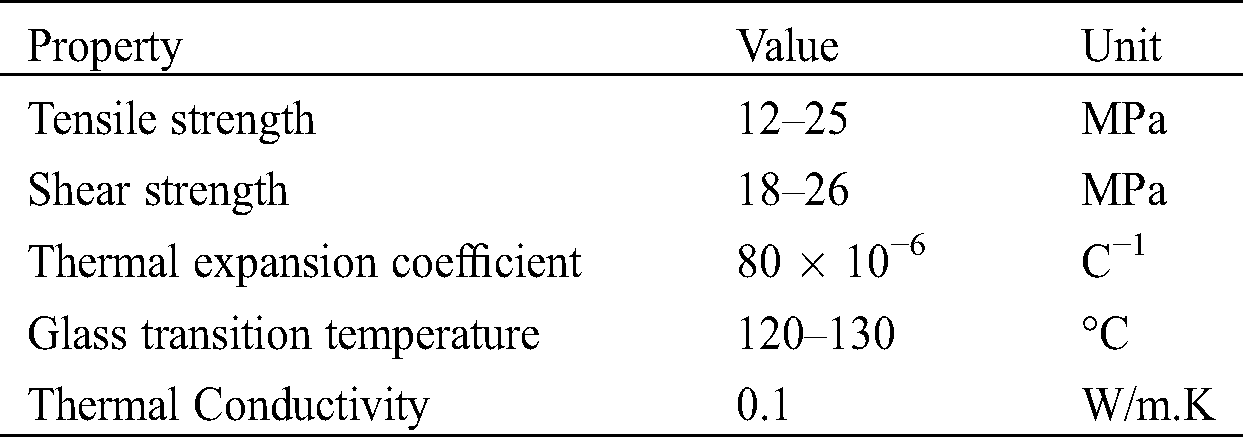
Fig. 8 demonstrates that the amplitude of impedance signatures declines with the increment in applied operational conditions (temperature and excitation frequency). It can be noticed that decreasing trend in the amplitude of impedance signature is more obvious after 130°C because sensor bonding’s characteristics are also affected by the further increment in the temperature and consequently it would become difficult to illuminate the sole impact of temperature on the magnitude of impedance signature. Ailete 502 adhesive is used in the current experimentation to bond the PZT patches at both surface ends of beam to actuate and receive the propagating wave signal. The glass transition temperature of this adhesive is 120°C–130°C but this value can be slightly varied in different applications depending upon the applied heating conditions. The elastic properties of Ailete 502 for steel after curing 24 hours are mentioned in Tab. 3.
Table 3: Elastic properties of Ailete502 (adhesive) for stainless steel-grade 304
It was observed that the dielectric constant  which is recognized as the temperature-dependent constant of PZT sensor has sufficiently influenced the electrical impedance signature.
On the other hand, Young’s modulus and the piezoelectric coupling constant also caused the baseline shift in the impedance signature, but this effect was minute as compared to dielectric constant and it might be neglected. The variation in the impedance signature of the PZT sensors is due to the consequence of fluctuating impedance of inspected specimen with temperature. Moreover, it has already been discussed that the natural frequency of the monitored structure is also influenced by the temperature variations and its value decreases with the temperature [34]. The presence of resonance peaks in the impedance signatures represent the frequency shift caused by the change in the natural frequency of the structure. The natural frequency of the beam is examined in the current study at operational temperature values and results are illustrated in Fig. 9.
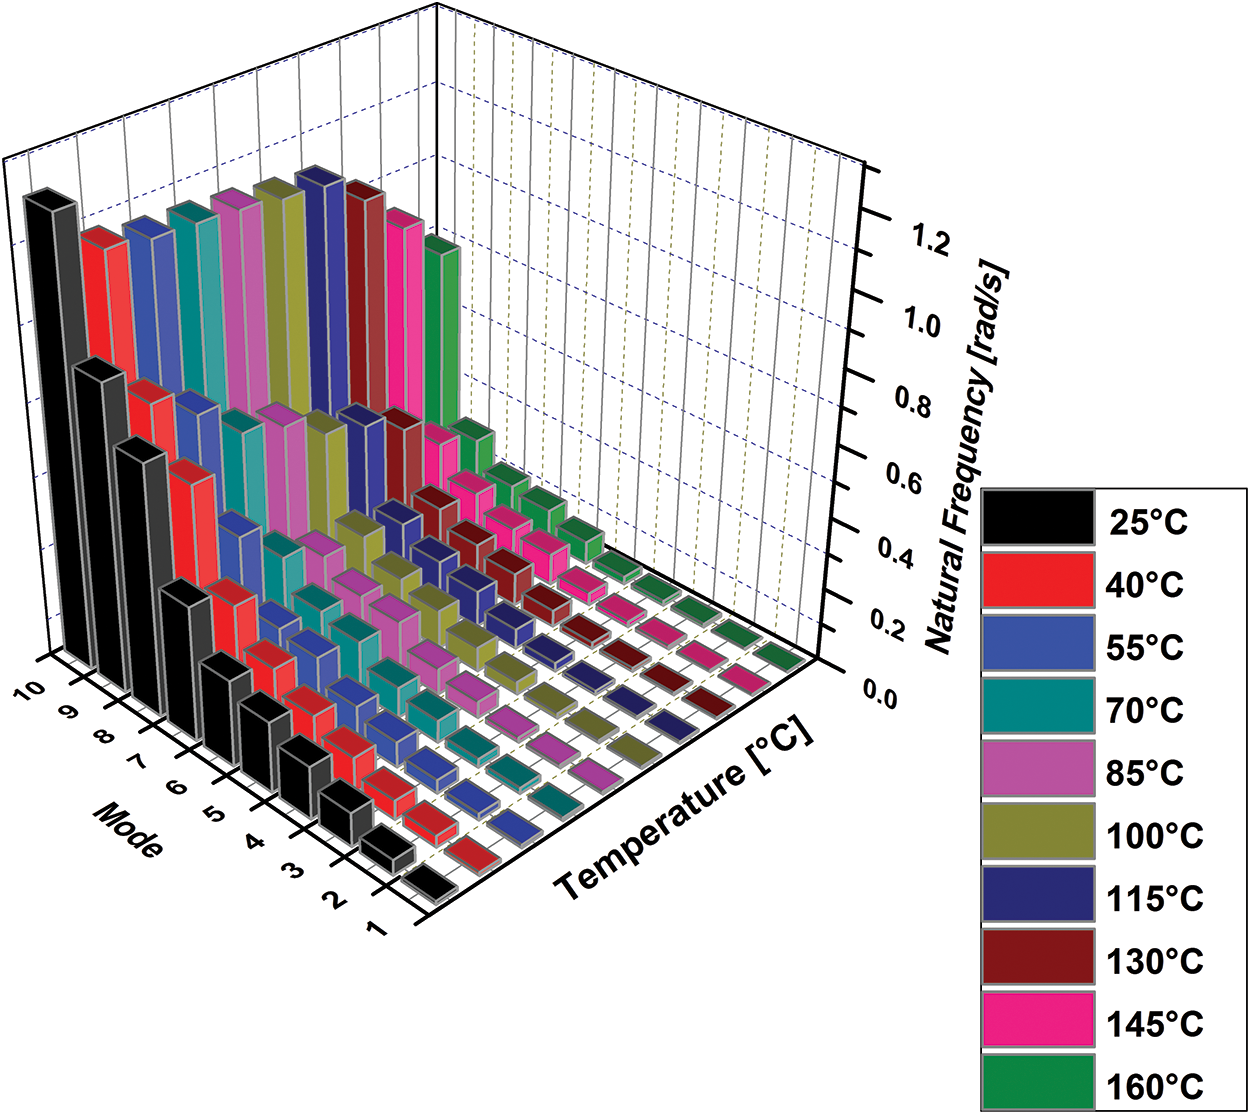
Figure 9: Variation in natural frequency of beam with temperature
Fig. 9 reveals that the natural frequency of beam is significantly declined with temperature due to variations in material properties, in particular, the modulus of elasticity. This variation in natural frequency of beam with temperature results in maximum normalized amplitude of stresses induced in it which instantly influences the phenomenon of crack breathing. Consequently, it affects the arrival time of the signal due to the elongation or shortening of the path between actuator and sensor which leads to a decreasing trend in impedance signature peaks in terms of left frequency shifts as shown in Fig. 8. Hence, the frequency shifts ( ) of each resonance peak at a different temperature is tabulated in Tab. 4. The resonance peaks acquired at a temperature of 25°C is taken as reference.
Table 4: Frequency shifts in electrical impedance signature peaks at variable temperature
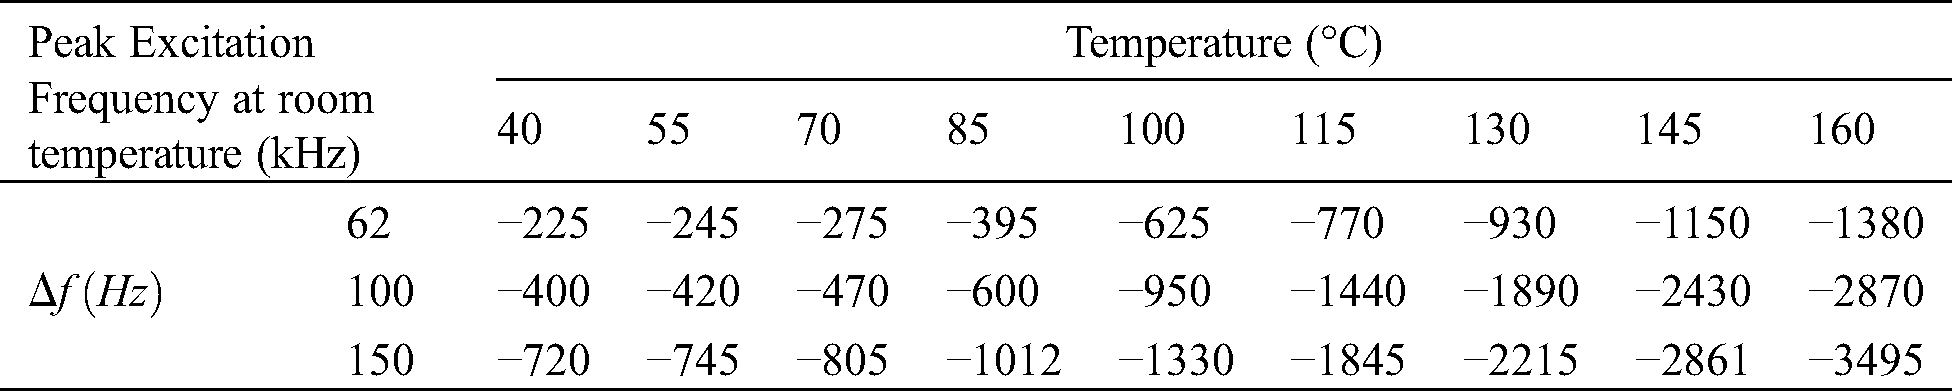
It can be observed that the frequency shifts become more critical with the increment in applied operational conditions (temperature and excitation frequency). One of the major reasons of this deviance is the sensor bonding’s characteristics that are also affected by the further increment in temperature and consequently, it would become difficult to illuminate the sole impact of temperature on impedance signature of PZT sensors. Moreover, it’s not convenient to process the signals and control the number of modes at higher frequencies. Therefore, the accurate selection of excitation frequency range and implementation of a suitable temperature compensation technique is compulsory for the reliable and efficient electromechanical impedance-based SHM, especially in detecting lower damage levels.
4.3 Phase-3: Temperature Compensation Technique
Effective frequency shift (EFS) is supposed to be one of the ideal methods for the compensation of temperature effect in electromechanical impedance-based SHM. In this approach, the correlation coefficient is maximized by shifting the impedance signature at the present temperature with respect to the impedance signature acquired at room temperature (25°C). However, its effectiveness was utilized in a narrow range of applied temperature and excitation frequency in previous literature [30,36]. In the current research work, EFS technique is implemented for a wide range of temperature compensation (25°C–160°C) at the extended frequency bandwidth (25 kHz–175 kHz) of the developed measurement system with efficient outcomes as compared to previous literature results [30]. The temperature compensation process is performed in the following steps:
a) To maximize the correlation coefficient, Eq. (4) is utilized to shift the impedance signature acquired at different temperature in the opposite (right) direction.

where  signifies the frequency step whose value is 2.5 Hz in current analysis assigned by the developed measurement system, and the subscript (i) demonstrates the number of the iteration executed to achieve the maximum value of correlation coefficient in Eq. (3).
b) According to Eq. (5), the impedance signature should be shifted in the left direction for a reduction in the operational temperature.

Hence, the maximum correlation coefficient was achieved and illustrated in Fig. 10 by using the above-mentioned compensation procedure of EFS technique under the operational conditions. Again, impedance signature acquired at 25°C is considered as a reference here.
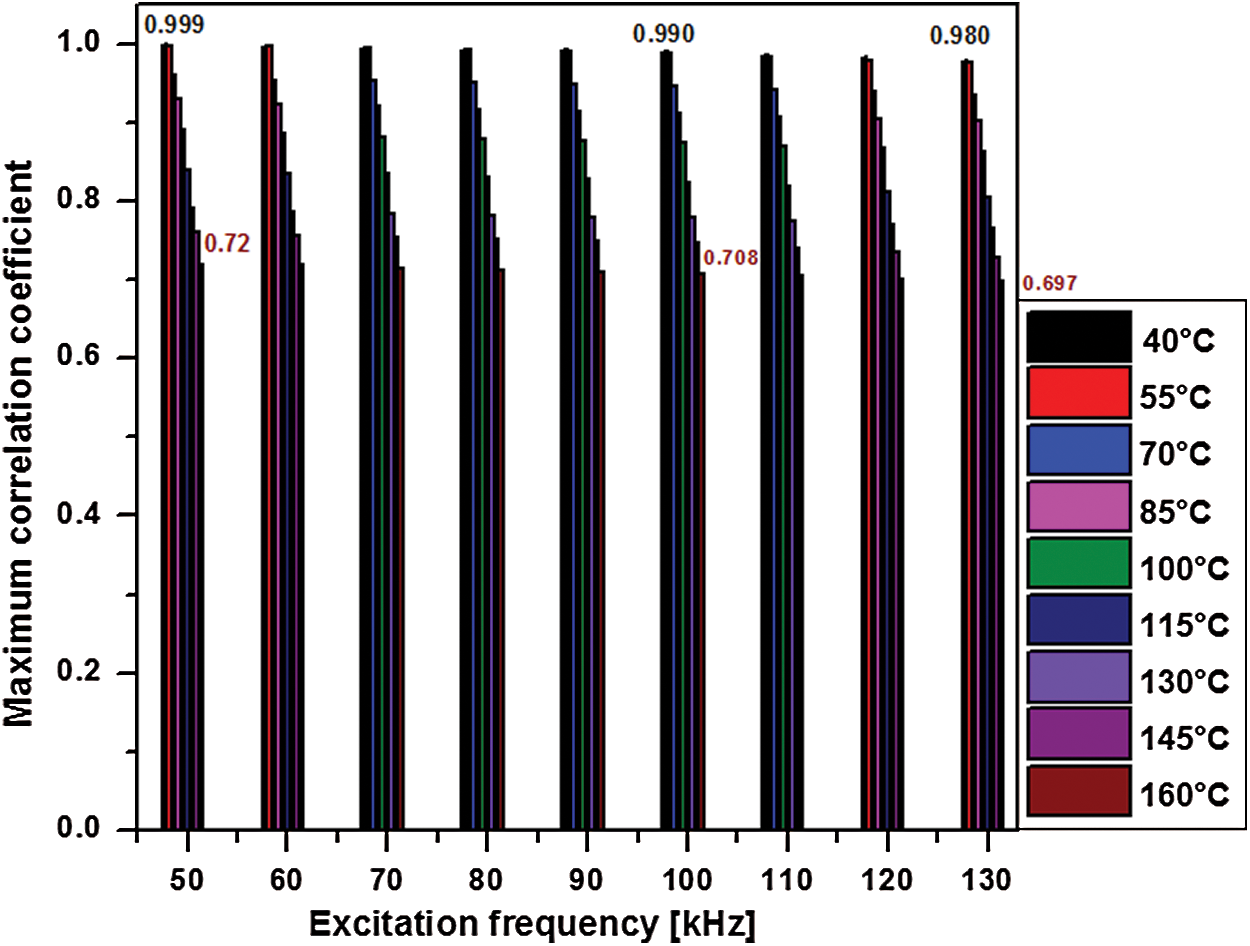
Figure 10: Maximum correlation coefficients acquired by using the real part of the impedance
It can be analyzed that the value of the maximum correlation coefficient is sufficiently reduced as both the frequency and temperature are increased. However, in the framework of previous literature, Fig. 10 illustrates that the correlation coefficient is approximately within the range of 0.990 (at 40°C) to 0.708 (at 160°C) even at excitation frequency of 100 kHz which verifies the accuracy of the developed measurement system for the wide range of temperature compensation at the extended bandwidth of excitation frequency. In the next step, the compensated impedance signature is evaluated under operational conditions using maximized correlation coefficients.
c) A comparison between the compensated and uncompensated real part of the impedance signature is demonstrated in Tab. 5. These impedance signatures were acquired at 70°C and 130°C with reference to the baseline signature obtained at 25°C under the excitation frequency of 50 kHz–130 kHz as shown in Figs. 11 and 12. Compensated Impedance signature at elevated temperature of 130°C illuminates the practicality of developed measurement system and optimized EFS technique.
Table 5: Comparison between the compensated and uncompensated real part of the impedance signature
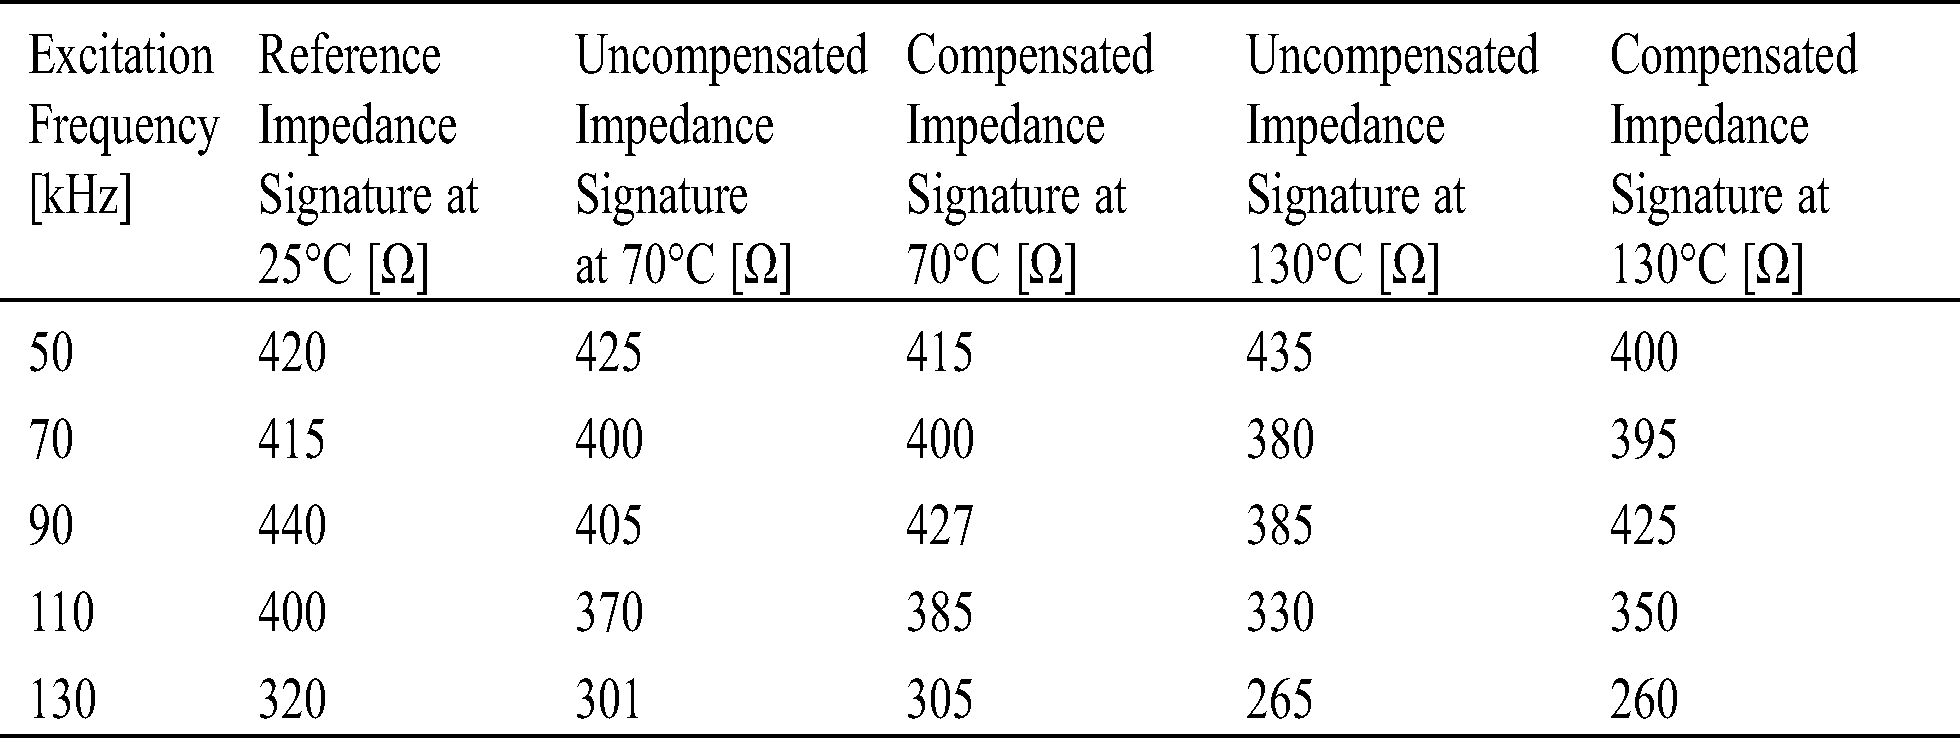
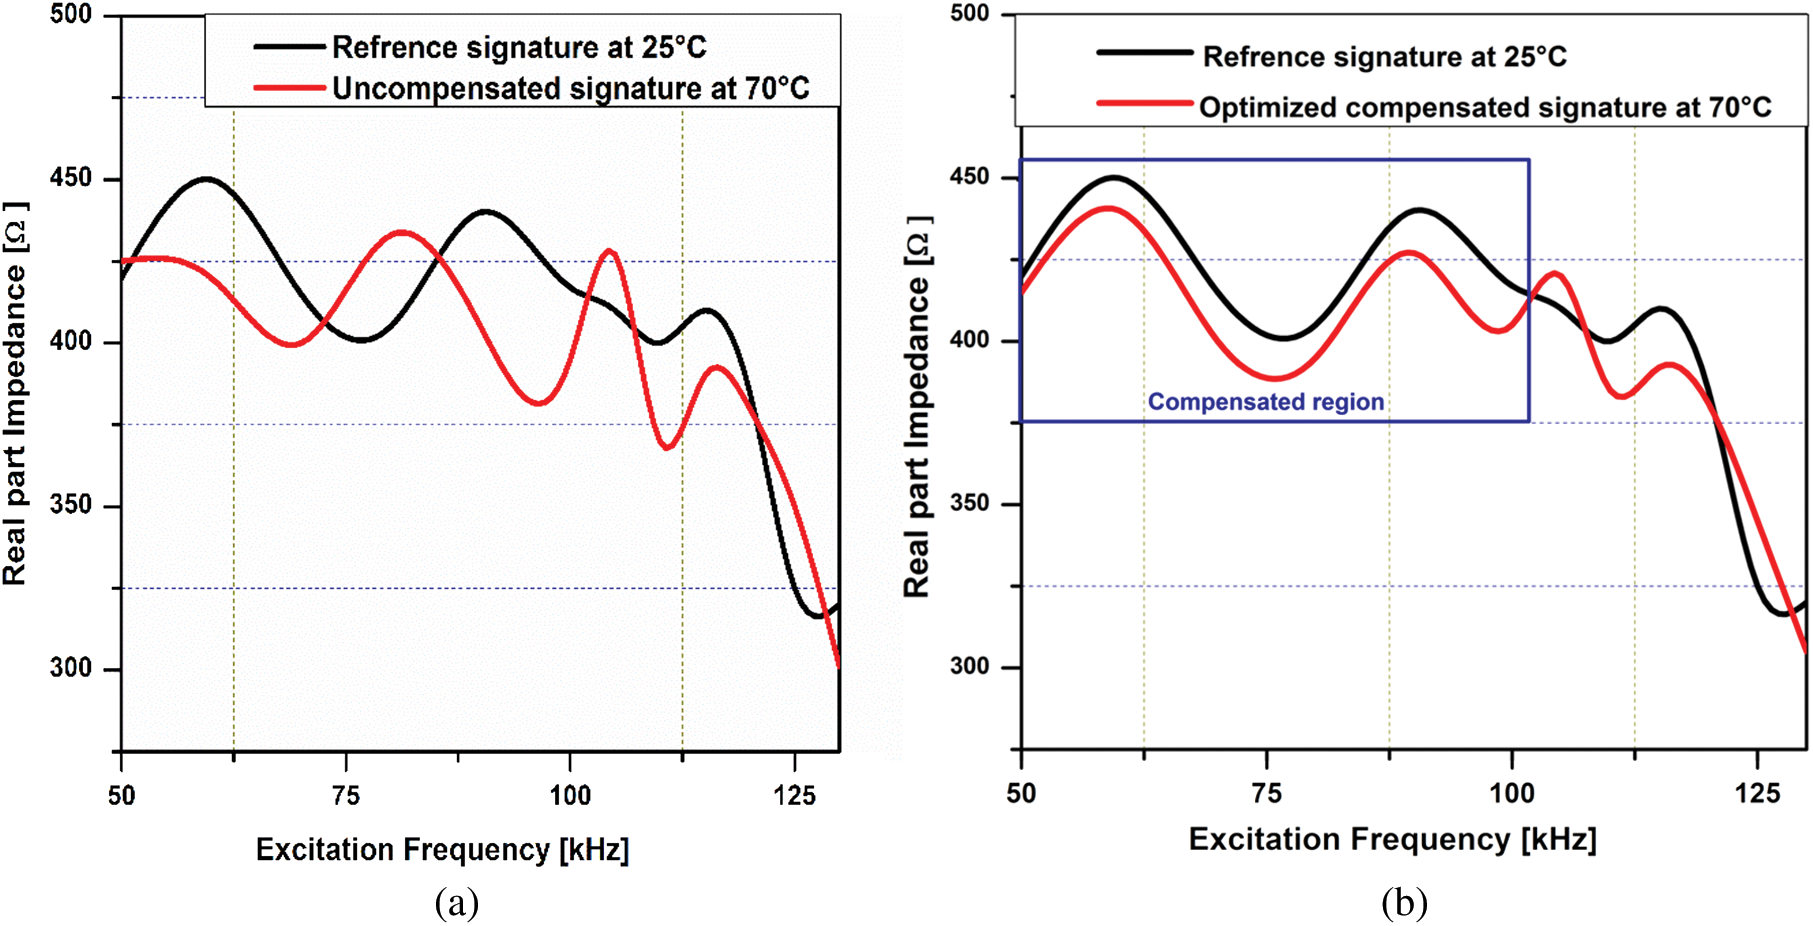
Figure 11: A comparison between the impedance signature acquired at 70°C with respect to the reference signature at 25°C (a) Uncompensated; (b) Compensated
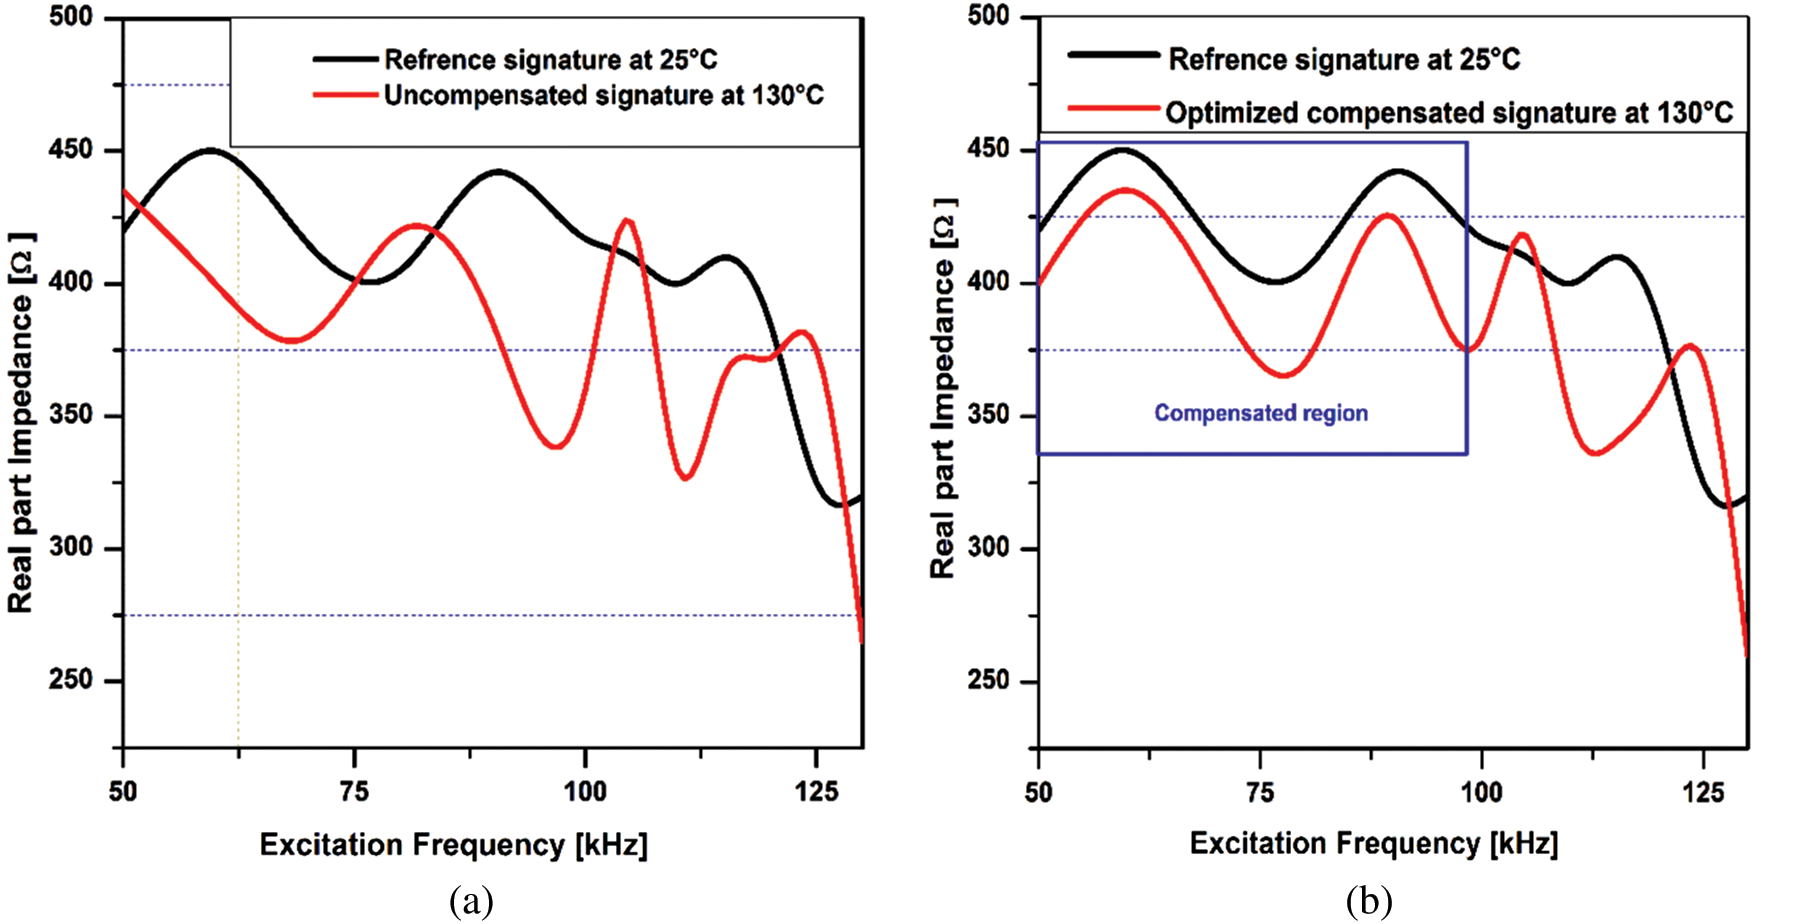
Figure 12: A comparison between the impedance signature acquired at 130°C with respect to the reference signature at 25°C (a) Uncompensated; (b) Compensated
From above comparisons, it can be observed that that EFS technique has been optimized in terms significant compensation for current impedance signature relative to the reference signature within the extended range of 100 kHz excitation frequency and elevated temperature of 130°C. Further increment in excitation frequency and applied temperature decreases the correlation coefficient and consequently affects the compensation process. This result verifies the effectiveness of optimized EFS technique and developed measurement system for the compensation of elevated temperature effect in electromechanical impedance-based SHM at the extended range of excitation frequency as compared to previous research results [30]. Moreover, in the proposed research work, the identification of fatigue crack and estimation of its sensitivity is achieved by comparing the two impedance signatures, which has revealed that the developed experimental setup has good repeatability between the measurements and high sensitivity for the variations in the mechanical impedance of the monitored structure.
In this research work, an experimental setup was developed to identify and quantify the structural damage using electromechanical impedance-based SHM and meanwhile perceive the effect of temperature on the electrical impedance signatures of the PZT sensor. A series of experiment was performed for stainless steel (304) beam in a controlled temperature environment (25°C–160°C) using 202 V1 Constant Temperature Drying Oven Chamber (Q/TBXR20-2005) at the extended frequency bandwidth (25 kHz–175 kHz). It has been observed that temperature variation significantly affects the impedance signature in terms of frequencies shifts which leads to inaccurate inspections results. Further, it was noticed that the frequency shifts become more critical with the increment in applied operational conditions (temperature and excitation frequency). One of the major reasons of this deviance is the sensor bonding’s characteristics that were also affected when applied temperature exceeds 130°C and consequently, it would become difficult to illuminate the sole impact of temperature on impedance signature of PZT sensor. In the current research work, EFS technique has been optimized in term of significant temperature compensation for the current impedance signature of PZT sensor relative to the reference signature at extended frequency bandwidth of the measurement test setup with better outcomes as compared to the previous work. The achievement of compensated Impedance signature of PZT sensor at an elevated temperature of 130°C and excitation frequency of 100 kHz has illuminated the practicality of developed measurement test setup and optimized EFS technique for the real-time health monitoring of complex structures. Hence, the current research also approaches efficiently the critical issue of the width of the frequency band for temperature compensation based on the frequency shift in SHM.
Acknowledgement: The authors would like to gratefully acknowledge the support received from the National Science and Technology Major Project of China.
Funding Statement: The author(s) received funding from the National Science and Technology Major Project of China (No. 2018ZX04011001) for this study.
Conflicts of Interest: The authors declare that they have no conflicts of interest to report regarding the present study.
1. Zhu, Y., Li, F., Bao, W. (2019). Fatigue crack detection under the vibration condition based on ultrasonic guided waves. Structural Health Monitoring. DOI 10.1177/1475921719860772. [Google Scholar] [CrossRef]
2. John, P. M., Matthew, R. P., Pullin, R., Holford, K. M. (2020). Optimization of acoustic emission wave streaming for structural health monitoring. Structural Health Monitoring, 19(6), 2007–2022. DOI 10.1177/1475921720912174. [Google Scholar] [CrossRef]
3. Yee, Y. L., Scott, T. S., Ricardo, V. P., Soh, C. K. (2019). Monitoring of concrete curing using the electromechanical impedance technique: Review and path forward. Structural Health Monitoring. [Google Scholar]
4. Song, Y., Li, S. (2018). Leak detection for galvanized steel pipes due to loosening of screw thread connections based on acoustic emission and neural networks. Journal of Vibration and Control, 24(18), 4122–4129. DOI 10.1177/1077546317720319. [Google Scholar] [CrossRef]
5. Kim, S. K., Choi, J., Park, S., Song, O. (2015). Vibration and stability of laminated composite plates subjected to a combined electromagnetic and thermal field. Journal of Vibration and Control, 21(12), 2325–2339. DOI 10.1177/1077546313511140. [Google Scholar] [CrossRef]
6. Williams, D., Haddad, K. H., Jiffri, S., Yang, C. (2019). Active vibration control using piezoelectric actuators employing practical components. Journal of Vibration and Control, 25(21–22), 2784–2798. DOI 10.1177/1077546319870933. [Google Scholar] [CrossRef]
7. Liang, C., Sun, F., Rogers, C. (1994). An impedance method for dynamic analysis of active materials systems. Journal of Vibration and Acoustics, 116(1), 120–128. DOI 10.1115/1.2930387. [Google Scholar] [CrossRef]
8. Giurgiutium, V., Rogers, C. A. (1997). Electro-mechanical (E/M) impedance method for structural health monitoring and nondestructive evaluation. Proceedings of International Workshop on Structural Health Monitoring, pp. 433–444, Stanford University, CA. [Google Scholar]
9. Park, G., Sohn, H., Farrar, R. C., Inman, D. J. (2003). Overview of piezoelectric impedance-based health monitoring and path forward. Shock and Vibration Digest, 35(6), 451–463. DOI 10.1177/05831024030356001. [Google Scholar] [CrossRef]
10. Giurgiutiu, V., Bao, J., Zhao, W. (2003). Piezoelectric wafer active sensor embedded ultrasonics in beams and plates. Experimental Mechanics, 43(4), 428–449. DOI 10.1007/BF02411348. [Google Scholar] [CrossRef]
11. Bhalla, S., Soh, C. K. (2004). Electromechanical impedance modeling for adhesively bonded piezo-transducers. Journal of Intelligent Material Systems and Structures, 15(12), 955–972. DOI 10.1177/1045389X04046309. [Google Scholar] [CrossRef]
12. Liang, C., Sun, F. P., Rogers, C. A. (1994). Electromechanical impedance modeling of active material systems. North American Conference on Smart Structures and Materials 1994. International Society for Optics and Photonics, Orlando, Florida, USA. DOI 10.1117/12.174216. [Google Scholar] [CrossRef]
13. Yang, Y., Lim, Y. Y., Soh, C. K. (2008). Practical issues related to the application of the electromechanical impedance technique in the structural health monitoring of civil structures: I. Experiment. Smart Materials and Structures, 17(3), 14. [Google Scholar]
14. Hamzeloo, S. R., Shamshirsaz, M., Rezae, S. M. (2012). Damage detection on hollow cylinders by electromechanical impedance method: Experiments and finite element modeling. Comptes Rendus Mécanique, 340(9), 668–677. DOI 10.1016/j.crme.2012.07.001. [Google Scholar] [CrossRef]
15. Park, H. W., Kim, E. J., Lim, K. L., Sohn, H. (2010). Spectral element formulation for dynamic analysis of a coupled piezoelectric wafer and beam system. Computers & Structures, 88(9), 567–580. DOI 10.1016/j.compstruc.2010.01.010. [Google Scholar] [CrossRef]
16. Lee, U. (2009). Spectral element method in structural dynamics. Singapore: John Wiley and Sons. [Google Scholar]
17. Wongi, S., Lee, H. (2016). Experimental investigation for an isolation technique on conducting the electromechanical impedance method in high-temperature pipeline facilities. Journal of Sound and Vibration, 383, 210– 220. DOI 10.1016/j.jsv.2016.07.036. [Google Scholar] [CrossRef]
18. Zuo, C., Feng, X., Zhang, Y., Lu, L., Zhou, J. (2017). Crack detection in pipelines using multiple electromechanical impedance sensors. Smart Materials and Structures, 26(10), 104004. DOI 10.1088/1361-665X/aa7ef3. [Google Scholar] [CrossRef]
19. Zhu, J., Wang, Y., Qing, X. (2019). A real-time electromechanical impedance-based active monitoring for composite patch bonded repair structure. Composite Structures, 212, 513–523. DOI 10.1016/j.compstruct.2019.01.035. [Google Scholar] [CrossRef]
20. Zhu, J., Wang, Y., Qing, X. (2019). Modified electromechanical impedance-based disbond monitoring for honeycomb sandwich composite structure. Composite Structures, 217, 175–185. DOI 10.1016/j.compstruct.2019.03.033. [Google Scholar] [CrossRef]
21. Li, H., Wang, X., Chen, J. (2019). Nonlinear electro-mechanical coupling vibration of corrugated graphene/piezoelectric laminated structures. International Journal of Mechanical Sciences, 150, 705–714. DOI 10.1016/j.ijmecsci.2018.10.052. [Google Scholar] [CrossRef]
22. Panigrahi, R., Bhalla, S., Gupta, A. (2010). A low-cost variant of electro-mechanical impedance (EMI) technique for structural health monitoring. Experimental Techniques, 34(2), 25–29. DOI 10.1111/j.1747-1567.2009.00524.x. [Google Scholar] [CrossRef]
23. Safaeifar, H., Karimi, A. (2015). The effect of temperature on the natural frequency. Teknologi Tanaman, 12(2), 520–528. [Google Scholar]
24. Bhalla, S., Naidu, A. S., Soh, C. K. (2003). Influence of structure-actuator interactions and temperature on piezoelectric mechatronic signatures for NDE. Smart Materials, Structures, and Systems: International Society for Optics and Photonics, 5060. DOI 10.1117/12.514762. [Google Scholar] [CrossRef]
25. Sun, F. P., Chaudhry, Z. A., Rogers, C. A., Majmundar, M., Liang, C. (1995). Automated real-time structure health monitoring via signature pattern recognition. Smart Structures and Materials: Smart Structures and Integrated Systems, International Society for Optics and Photonics, 2443, 236–247. [Google Scholar]
26. Park, G., Kabeya, K., Cudney, H. H. (1999). Impedance-based structural health monitoring for temperature varying applications. JSME International Journal Series a Solid Mechanics and Material Engineering, 42(2), 249–258. DOI 10.1299/jsmea.42.249. [Google Scholar] [CrossRef]
27. Koo, K. Y., Park, S., Lee, J. J., Yun, C. B. (2009). Automated impedance-based structural health monitoring incorporating effective frequency shift for compensating temperature effects. Journal of Intelligent Material Systems and Structures, 20(4), 367–377. DOI 10.1177/1045389X08088664. [Google Scholar] [CrossRef]
28. Busch, V. I. J. (1998). Electromechanical sensors and actuators. Mechanical Engineering Series, Berlin, Germany: Springer, 343. [Google Scholar]
29. Baptista, F. G., Vieira, F. J. (2010). Transducer loading effect on the performance of PZT-based SHM systems. IEEE Transactions on Ultrasonics, Ferroelectrics and Frequency Control, 57(4), 933–941. DOI 10.1109/TUFFC.2010.1497. [Google Scholar] [CrossRef]
30. Baptista, F. G., Budoya, D. E., Almeida, V. A. D., Ulson, J. A. C. (2014). An experimental study on the effect of temperature on piezoelectric sensors for impedance-based structural health monitoring. Sensors, 14(1), 1208–1227. DOI 10.3390/s140101208. [Google Scholar] [CrossRef]
31. Marqui, C. R., Bueno, D. D., Baptista, F. G., Santos, R. B., Filho, J. V. et al. (2008). External disturbance effect in damage detection using electrical impedance. Proceedings of the International Modal Analysis Conference. Orlando, FL, USA. [Google Scholar]
32. Ilg, J., Rupitsch, S. J., Lerch, R. (2013). Impedance-based temperature sensing with piezoceramic devices. IEEE Sensors Journal, 13(6), 2442–2449. DOI 10.1109/JSEN.2013.2256121. [Google Scholar] [CrossRef]
33. Woon, C. E., Mitchell, L. D. (1996). Variation in structural dynamic characteristics caused by changes in ambient temperature: Part 1. Experimental. Proceedings of 14th International Modal Analysis Conference, pp. 963–971, SEM, Dearborn, Michigan, USA. [Google Scholar]
34. Sattar, M. E., Mehdi, S., Aazam, G. (2017). Effect of the multiple damages and temperature changes on the natural frequency. Journal of Theoretical and Applied Mechanics, 55(3), 813–822. [Google Scholar]
35. Butt, Z., Ahmad, N., Pasha, R. A., Qayyum, F., Anjum, Z. et al. (2016). Generation of electrical energy using lead zirconate titanite (PZT-5A) piezoelectric material: Analytical, numerical and experimental verifications. Journal of Mechanical Science and Technology, 30(8), 3553–3558. DOI 10.1007/s12206-016-0715-3. [Google Scholar] [CrossRef]
36. Baptista, F. G., Vieira, F. J., Inman, D. J. (2012). Real-Time multi-sensors measurement system with temperature effects compensation for impedance-based structural health monitoring. Structural Health Monitoring: An International Journal, 11(2), 173–186. DOI 10.1177/1475921711414234. [Google Scholar] [CrossRef]
 | This work is licensed under a Creative Commons Attribution 4.0 International License, which permits unrestricted use, distribution, and reproduction in any medium, provided the original work is properly cited. |