DOI: 10.32604/sv.2021.09417
ARTICLE
Performance Evaluation and Effectiveness of the Reverberation Room
Acoustics Laboratory, National Institute of Standards (NIS), Giza, Egypt
*Corresponding Author: Mohamed Abd-Elbasseer. Email: mbacir@yahoo.com
Received: 12 December 2019; Accepted: 09 April 2020
Abstract: This research presents a thorough evaluation of the reverberation room at Acoustics Laboratory in National Institute of Standards (NIS) according to the related international standards. The evaluation aims at examining the room performance and exploring its effectiveness in the frequency range from 125 Hz to 10000 Hz according to the international standard requirements. The room, which was designed and built several years ago, is an irregular rectangular shape free from diffusers. Its volume is about 158.84 m3, which meets the requirement of the ISO 354 standard Lmax < 1.9V1/3. Cut-off frequencies of one and one-third octave are 63 Hz and 100 Hz respectively; however Schroder frequency is 400 Hz. Calculations of cut-off frequency and modal density showed adequate modes that give acceptable uniformity starting comfortably from frequency of 125 Hz. The room has a reverberation time that is suitable for its size over the frequency range of interest. The room sound absorption surface area and its sound absorption coefficient satisfy the criteria given in ISO 3741 and ISO 354. There is an accepted diffuse sound field inside the room due to the standard deviation of measured sound level, which is less than 1.5 dB over all the frequency range. The only exception was 125 Hz which may be due to a lack of diffusivity of the sound field at this frequency. The evaluation proves that the NIS reverberation room is in full agreement with the international standards, which in turns qualifies the room to host measurements inside without concerns.
Keywords: Reverberation room; cut-off frequency; sound absorption; spatial uniformity; modal counts
Reverberation rooms are of great importance in the field of acoustics. Inside the reverberation room, we can test the performance of loudspeakers and microphones. In addition, we could measure the acoustic power of sound sources and sound absorption coefficient of materials. The Combinations of reverberation rooms are used to evaluate transmission properties of building materials as well as absorption characteristics of noise control products. The reverberation room is considered a special test room that is used to introduce a diffuse sound field. This field is considered to be perfectly diffused in a room of volume V, if the energy density is the same on all points of this room, and it can be built by a superposition of an infinite number of freely propagating plane waves, such that all directions of propagation are equally probable and the phase relations of the waves are random [1]. There have been several attempts in the past to study the characteristics of different reverberation rooms. Mehadi et al. [2] proposed the sizes and shapes of reverberation rooms which give the better diffuse field and consequently the accurate measurements. Scrosati et al. [3] studied the variation of the sample’s sound absorption coefficient due to the variation of the mean free path due to the introduction of diffusing elements. del Rey et al. [4] built an automated small-sized reverberation chamber of volume 1.12 m3, which allows for the testing of samples of 0.3 m2. The standardized reverberation chamber of the Higher Polytechnic School of Gandia was used as a reference when designing this chamber and several comparison studies of the measurements between them are carried out. Alexander [5] successfully created a small scale reverberation room with volume 48 m3, which provides the benefit of accelerating the research and development process, saving both time and resources but causes greater uncertainties at low frequencies. Due to the importance of reverberation rooms, we carried out a detailed study of the NIS reverberation room so as to evaluate its performance and compliance with international standards. The design, cut-off frequency, modal count, modal density, spatial uniformity, reverberation time, sound absorption surface as well as the back ground noise have been tested and presented in this research. ISO 354 [6] and ISO 3471 [7] standards have been taken as reference standards.
2 Methods to Characterize the Reverberation Room
The entire room is constructed from hard concrete walls painted by soft cement. The room floor is slightly inclined and covered with ceramic. The room is of irregular rectangular shape no two corresponding surfaces are parallel. As it is shown in Fig. 1, the room dimensions are (average length Lx = 6.31 m of two lengths 6.30 m and 6.32 m), (average width Ly = 5.975 m of two widths 6.0 m and 5.95 m) and (average height LZ = 4.213 m of three heights 4.18 m, 4.19 m and 4.27 m). The length of the longest straight line (the major diagonal of the room Lmax ≈ 9.66 m), the total volume V = 158.84 m3, the total surface area of the room S = 2(LxLy + LyLz + LxLz) = 178.92 m2 and the sum of the lengths of all edges L = 4(Lx + Ly + Lz) = 65.99 m.

Figure 1: A schematic diagram shows the NIS reverberation room
The instruments used for measuring the sound pressure level and the reverberation time included omni-power sound source of type B&K 4296, power amplifier of type B&K 2716, 1/2 inch microphone type B&K 4189 and attached into sound level meter type 2260 for 1/3 octave band spectrum analysis, are indicated in Fig. 2. The measurement chain was calibrated before each measurement using sound level calibrator type B&K 4231.

Figure 2: Sound level meter, sound level calibrator, microphone with preamplifier, cables and omni-power sound source
The main function of the reverberation room is to produce diffuse sound field. At the middle and high frequencies, the sound field in reverberation room is almost diffused. However it is different at low frequencies. The transition frequency which indicates the low frequency limit of the diffuse field is set in terms of the cut-off frequency. Two cases are used to determine the low frequency limit. The first one is cut-off frequency fc which depends on the room volume only and concerned with the modal count or the least permissible number of modes at a given frequency band. Where, 20 modes per band are commonly used. For one octave band, this number is obtained when the room volume is equal to the wavelength cubed [8]. The cut-off frequency is given by:

where, c is the speed of sound ≈ 343 m/s.
On the other hand, for a one-third octave band this number is obtained when the room volume is equal to four times the wavelength cubed, and the cut-off frequency [9] is given by:

The second case is known as the Schroeder cut-off frequency fsch which marks the transition from individual well-separated resonances to many overlapping modes. fsch is given by [10]:

Schroder frequency depends on the room volume and reverberation time RT. The two different approaches produce different limits and the most commonly used Schroeder limit is too restrictive [8].
To establish a diffuse sound field in the room, adequate normal modes must be stimulated in the measuring frequency range, especially in the low frequency range. The approximate number of modes N(f) with eigenfrequencies lying below a certain frequency f, can be calculated theoretically using the formula [11]:

This equation is valid only for a rectangular room and provides overestimation of the number of modes at low frequencies due to the consideration that it is a continuous function of frequency instead of discrete one [12]. For room with irregular shape, the number of modes formula can be rewritten using statistical concepts, as [13]:

where,  [14]
[14]
Like the modal count, the modal-density n(f) concept is also very useful to characterize the sound field in the reverberation room especially in low frequency. It is the number of normal modes per unit frequency bandwidth, and obtained by differentiating N(f) with respect to frequency [11]. For a regular room, it could be given as:

However, for irregular room it is presented as:

The modal count ΔN in a given frequency band Δf, can also be calculated using this modal-density concept as:

For one-third octave band, Δf is 23% of centered frequency f, and 71% for the on-octave band.
Spatial uniformity of the steady-state reverberant sound energy is one of the criteria that are needed to characterize the diffused field. The standard deviation σSPL of the sound pressure level SPL, which is related to the variance, is used. This quantity is considered as the descriptor to characterize the degree of field diffuseness. The following expression can be used to calculate σSPL [11]:

where, is the number of receiver positions,
  is the SPL at the nth receiver location and
  is the reverberant SPL averaged over all receiver locations. It has been accepted that the sound field in the reverberation room exhibits adequate diffuseness if σSPL remains under 1.5 dB [1], and in order to be more precise, ISO 3741 standard listed the maximum admissible standard deviation in Tab. 1 [7].
Table 1: Maximum admissible standard deviation prescribed by the ISO standard 3741

Reverberation time that measured using the interrupted noise method is considered as the most important quantity for any reverberation room prediction. It is defined as the duration required for the space-averaged sound energy density in an enclosure to decrease by 60 dB after the source emission has stopped, expressed in seconds [15]. RT can be determined from the general form of Sabine’s reverberation time equation as:

This equation is referenced in international standards ASTM C423 and ISO 354 as the reverberation time equation and is used in measuring absorption coefficients, where α is the average absorption coefficient of the room surfaces.
Single-number values of reverberation time can be obtained according to ISO standard 3382 [16], where it can be expressed as a single-number quantity by averaging its values in one-third octave bands from 400 Hz to 1250 Hz and by averaging its values in one octave bands from 500 Hz to 1000 Hz [17].
The standard deviation of the reverberation time σRT can be used as a descriptor to characterize the degree of field diffuseness. The following expression is used to calculate σRT of measured RT [11]:

where, Nrec is the number of receiver positions, RTn is the measured RT at the nth receiver location and  is the RT averaged over all receiver locations.
2.8 Sound Absorption Surface Area
The equivalent sound absorption surface area is an important parameter to qualify the reverberation room. It is depending on RT and vice versa. Sabine’s equation can be rewritten as:

where, A is the total area of sound absorption of the empty room, A = αS metric sabins.
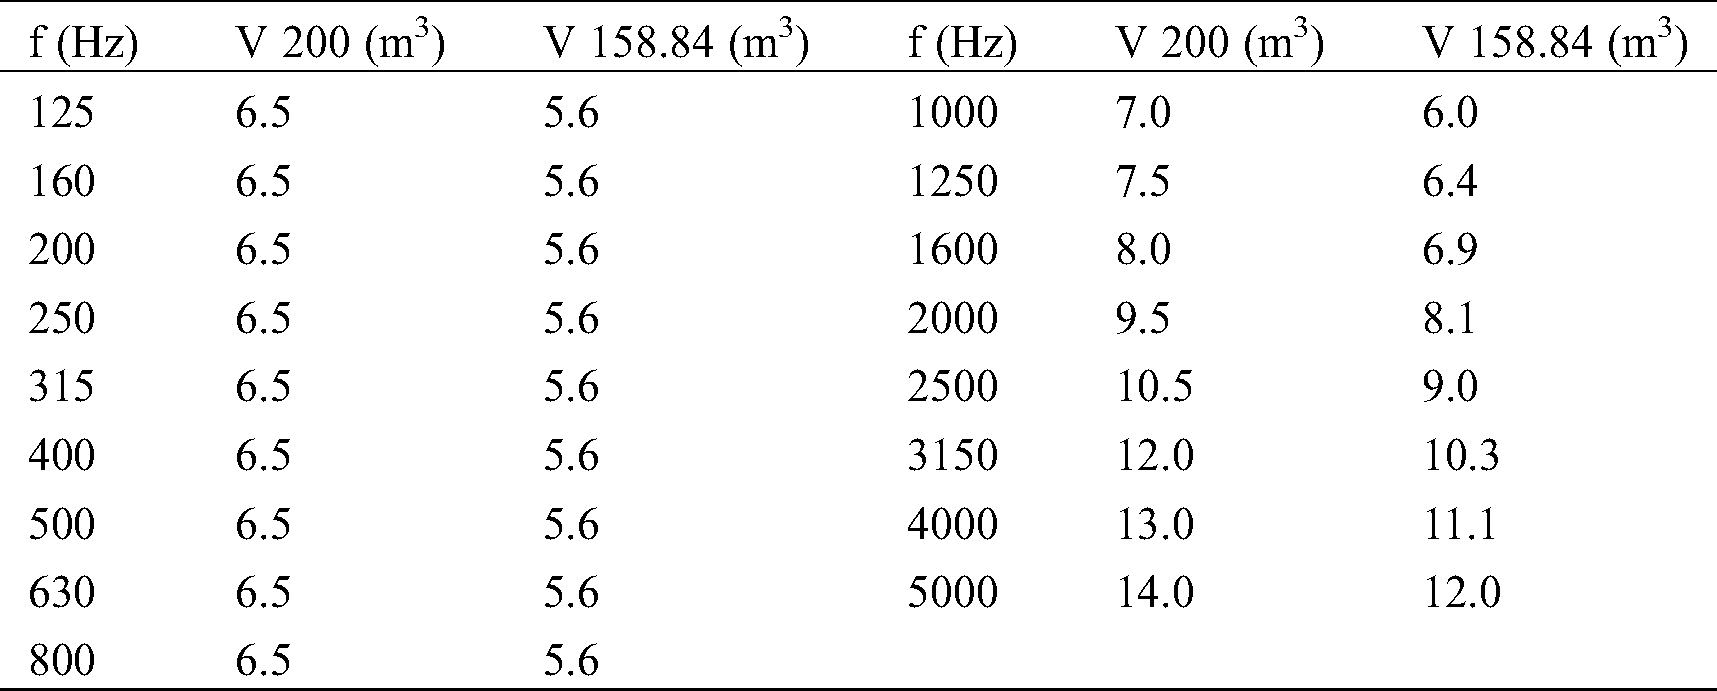
It was specified by ISO 354 standard that in an empty room of V = 200 m3, A shall not exceed the values given in Tab. 2. If V differs from 200 m3, the given values shall be multiplied by (V/200)3/2.
Table 2: Maximum equivalent sound absorption areas prescribed by the ISO 354 standard
Back ground noise is one of the standard requirements for the measurements in reverberation room. So the sound level of back ground noise was measured before each measurement, using the criteria of ISO standard 3741.
The NIS reverberation room was built with an irregular rectangular in shape of volume 158.84 m3. The lowest one-third octave band frequency of interest is 125 Hz according to recommendation of ISO 3741 standard. Lmax fulfills the condition of ISO 354 standard, Lmax < 1.9V1/3.
The cut-off frequency fc: for one-octave band as per Eq. (1), fc is 63 Hz and for one-third octave band from Eq. (2), is 100 Hz. This means that the room has at least 20 modes per octave band [8] at frequency ≥ 63 Hz. However for measurements of one-third octave, it has at least the same number of modes [9] at frequency ≥100 Hz. The obtained results confirmed that the NIS reverberation room has a diffuse sound field above these calculated frequencies, and the measurements inside the NIS room can be performed with adequate modes which give acceptable uniformity starting from frequency of 125 Hz, which is consistent with the recommended room volume by ISO 3741.
The Schroeder cut-off frequency fsch: according to Eq. (3), the calculated Schroder cut-off frequency fsch, which is the transition from individual separated resonances to many overlapping normal modes, is nearly 400 Hz for one octave and one-third octave frequency. This cut-off frequency which is depending on the volume and measured RT of the room confirms that the NIS reverberation room has many overlapping modes and highly diffusivity starting from 400 Hz.
The modal compositions of NIS reverberation room like the number of modes, modal density and the modal count are calculated using Eqs. (5), (7) and (8), respectively. Tab. 3 shows the results that have been obtained.
Table 3: Modal composition of the reverberation room
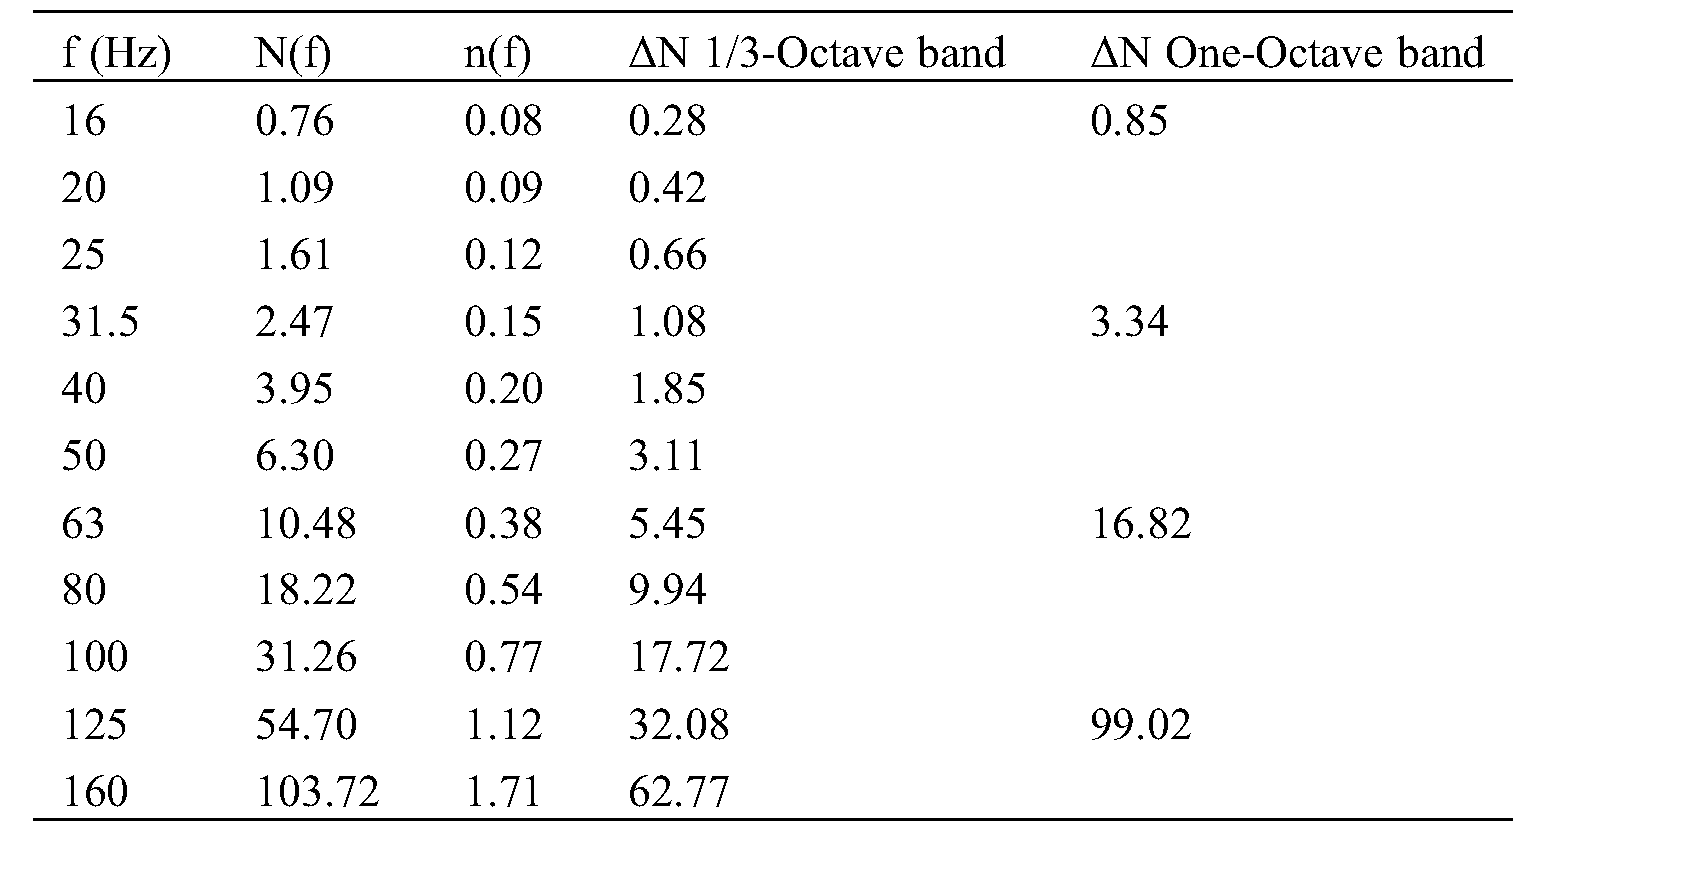
The perfectly diffuse sound field is established when at least 15–20 normal modes are excited within the one-third octave band [18] or it can be established in a rectangular room if there are at least 20–30 modes in the measurement bandwidth [1]. Tab. 3 shows that the calculated numbers of modes, which dependent on room volume, acquire the NIS reverberation room perfect diffused field and make it suitable for measurements starting from 100 Hz. Moreover it can be used comfortably from 125 Hz. It can be seen easily that this results are compatible with the results of cut-off frequency.
Spatial uniformity of the reverberation room was tested by using the measured sound field distribution inside the room. The average sound pressure level was measured using the procedures and requirements of ISO 3741 standard, where a number of 30 points have been chosen that are due to 6 positions of microphones for each 5 locations of the sound source. B&K type 4295 omnidirectional sound source was used to introduce broad band noise. The excited noise was recorded and analyzed using microphone B&K 4189 attached with modular precision sound analyzer B&K 2260. The measured average SPL and σSPL are listed the Tab. 4.
Table 4: Measured sound pressure level and standard deviation of the reverberation room
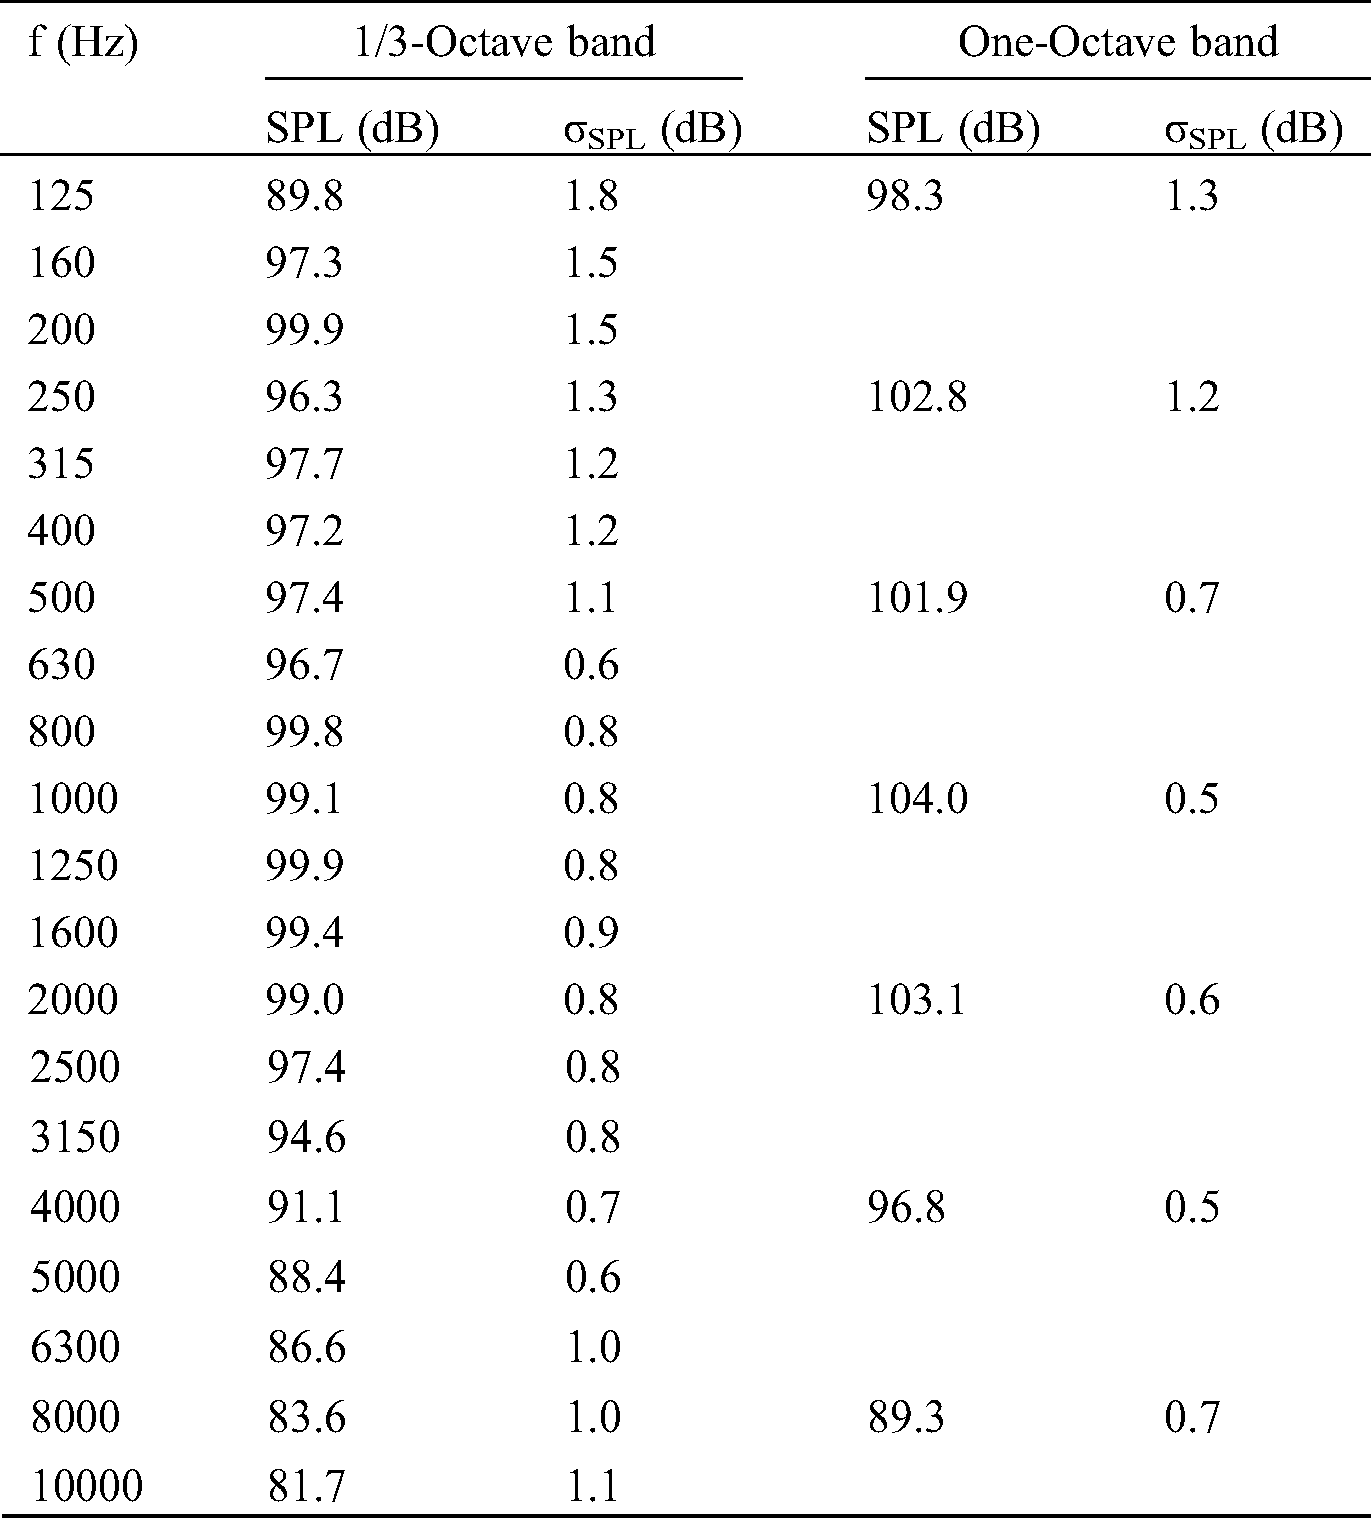
The indicated values of σSPL in Tab. 4 at many frequencies are not satisfying the specified values in Tab. 1, which offers maximum admissible standard deviations prescribed by the ISO 3741 standard. However the values of σSPL are acceptable. The sound field in the NIS reverberation room exhibits adequate diffuseness, because values of σSPL over all the frequency range are less than 1.5 dB [1], except at 125 Hz for one-third octave. Although the volume of the room, calculations of cut-off frequency and modal compositions have shown good agreement for the room at one-third octave frequency band of 125 Hz according to the international standards requirements, however the practical measurements were given otherwise. This may be due to a lack of diffusivity of the sound field at this frequency. The lack of diffusivity may be because the room has no diffusers and the irregularity of its shape is very little.
Measuring B&K system consists of power amplifier type 2716, omnidirectional sound source type 4295, microphone type 4189 and modular precision sound analyzer B&K 2260 with sound analysis software BZ 7830, were used to generate the sound in the reverberation room and record the average reverberation time RT. The average RT inside the reverberation room was measured using the instrumentations, procedures and requirements stated in the ISO 354 standard. The environmental conditions were taken in to account where the temperature and relative humidity were within the conditions of the standard during the period of measurement. The room is not large enough (i.e., those with volumes greater than 500 m3) to cause air absorption at high frequencies. This in turns may lead to inaccurate measurement of the RT. The measured RT and RT standard deviation σRT are shown in Tab. 5.
Table 5: Measured reverberation time and standard deviation of NIS reverberation room
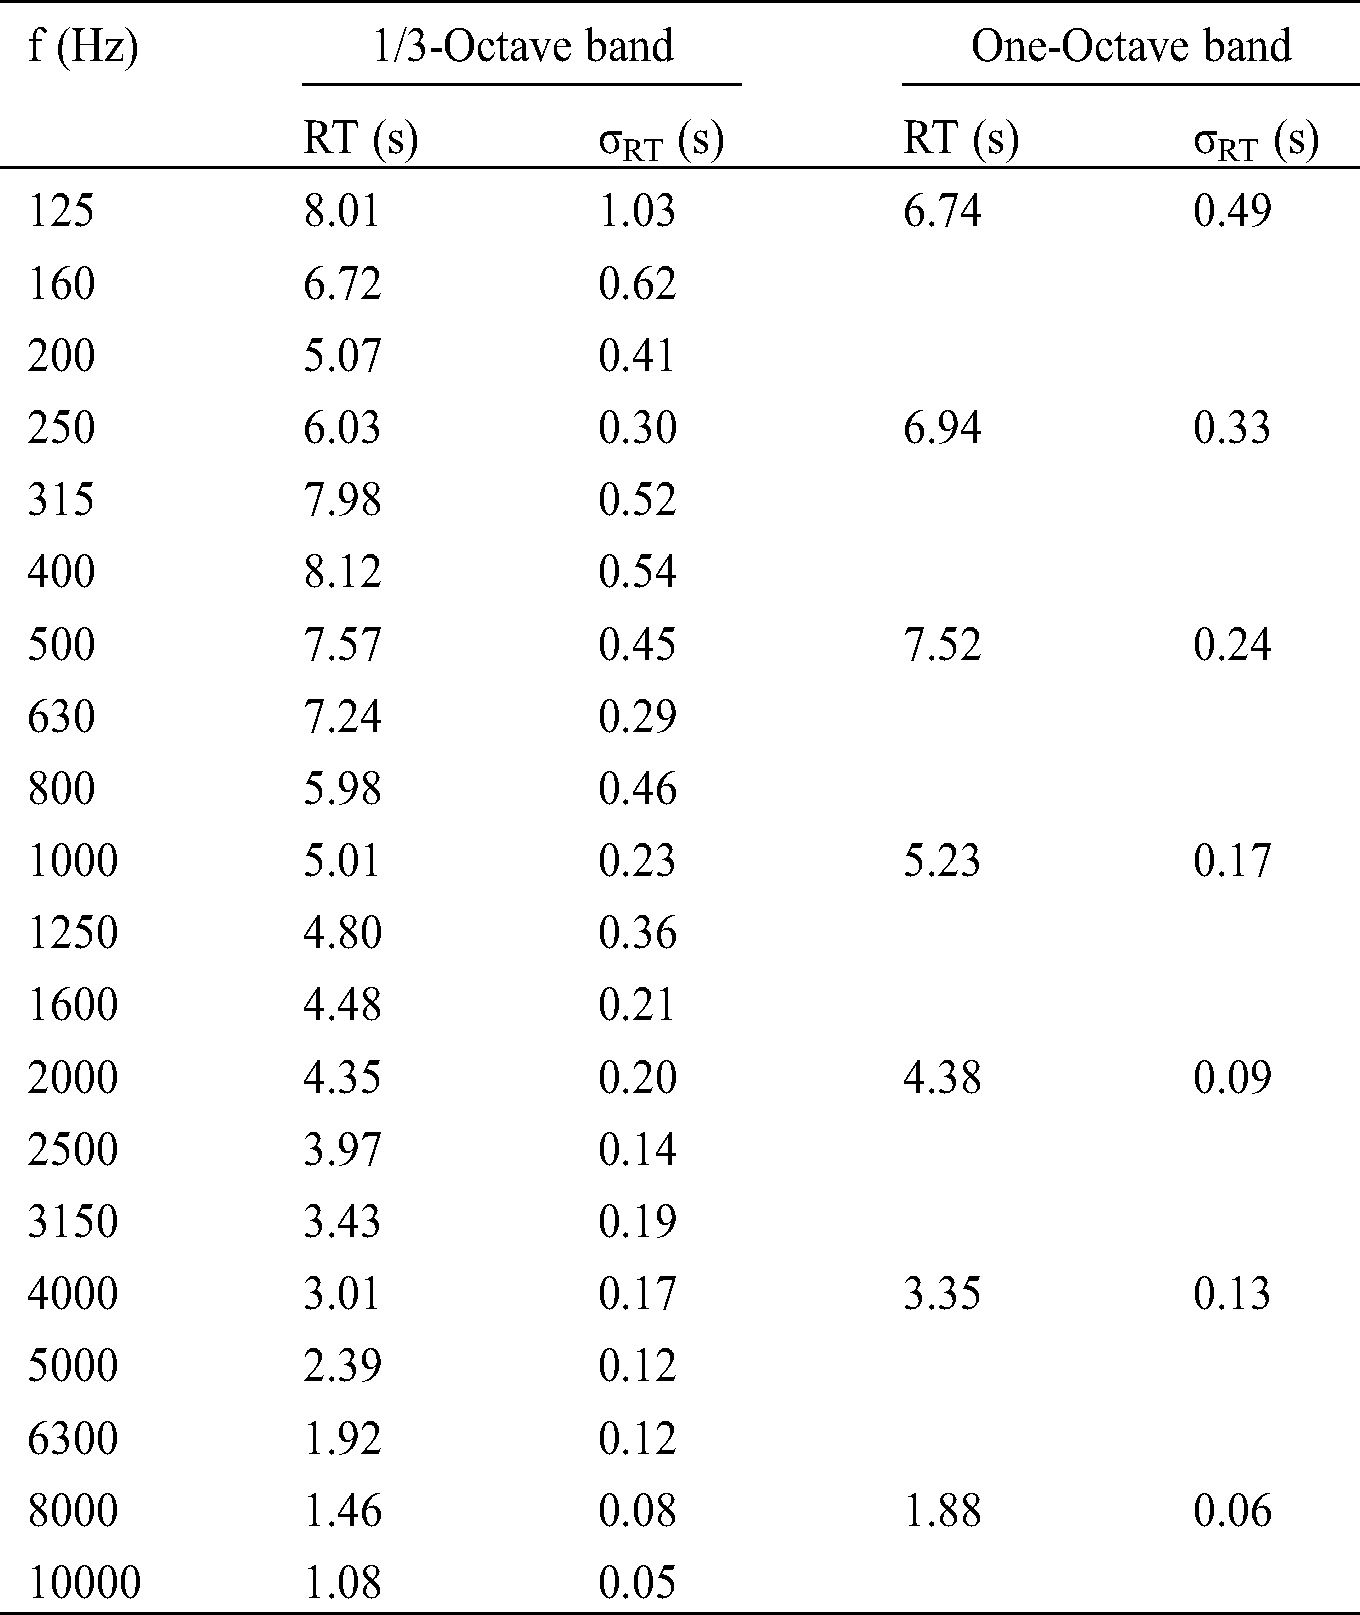
The results of Tab. 5 show that the measured reverberation times of the NIS reverberation room satisfy the condition of ISO standard 3741, so that RT over the frequency range of interest should be greater than V/S. Reverberation time at one-third octave of frequency 125 Hz may be above the real value inside the room, which may due to lack of diffusivity as mentioned in item (3.4). This lack may be treated in the future via using some diffusers inside the room.
According to ISO 3382 standard, the single-number values of measured reverberation time are 6.45 s for one-third octave frequency band, and 6.38 s for one octave frequency band.
It is obvious that the values σRT are below 0.5 s over all one octave frequency bands, while in one-third octave bands they are below 0.5 s for all frequencies except 160 Hz, 315 Hz, 400 Hz and 125 Hz. The given data in Tab. 5 shows small standard deviations [18].
3.6 Sound Absorption Surface Area
The equivalent sound absorption area of the reverberation room was calculated by using Eq. (12), with the aid of measured reverberation time. Tab. 6 shows the calculated equivalent sound absorption area A, and average sound absorption coefficient of the surfaces α for NIS reverberation room.
Table 6: Calculated sound absorption surface area and sound absorption coefficient
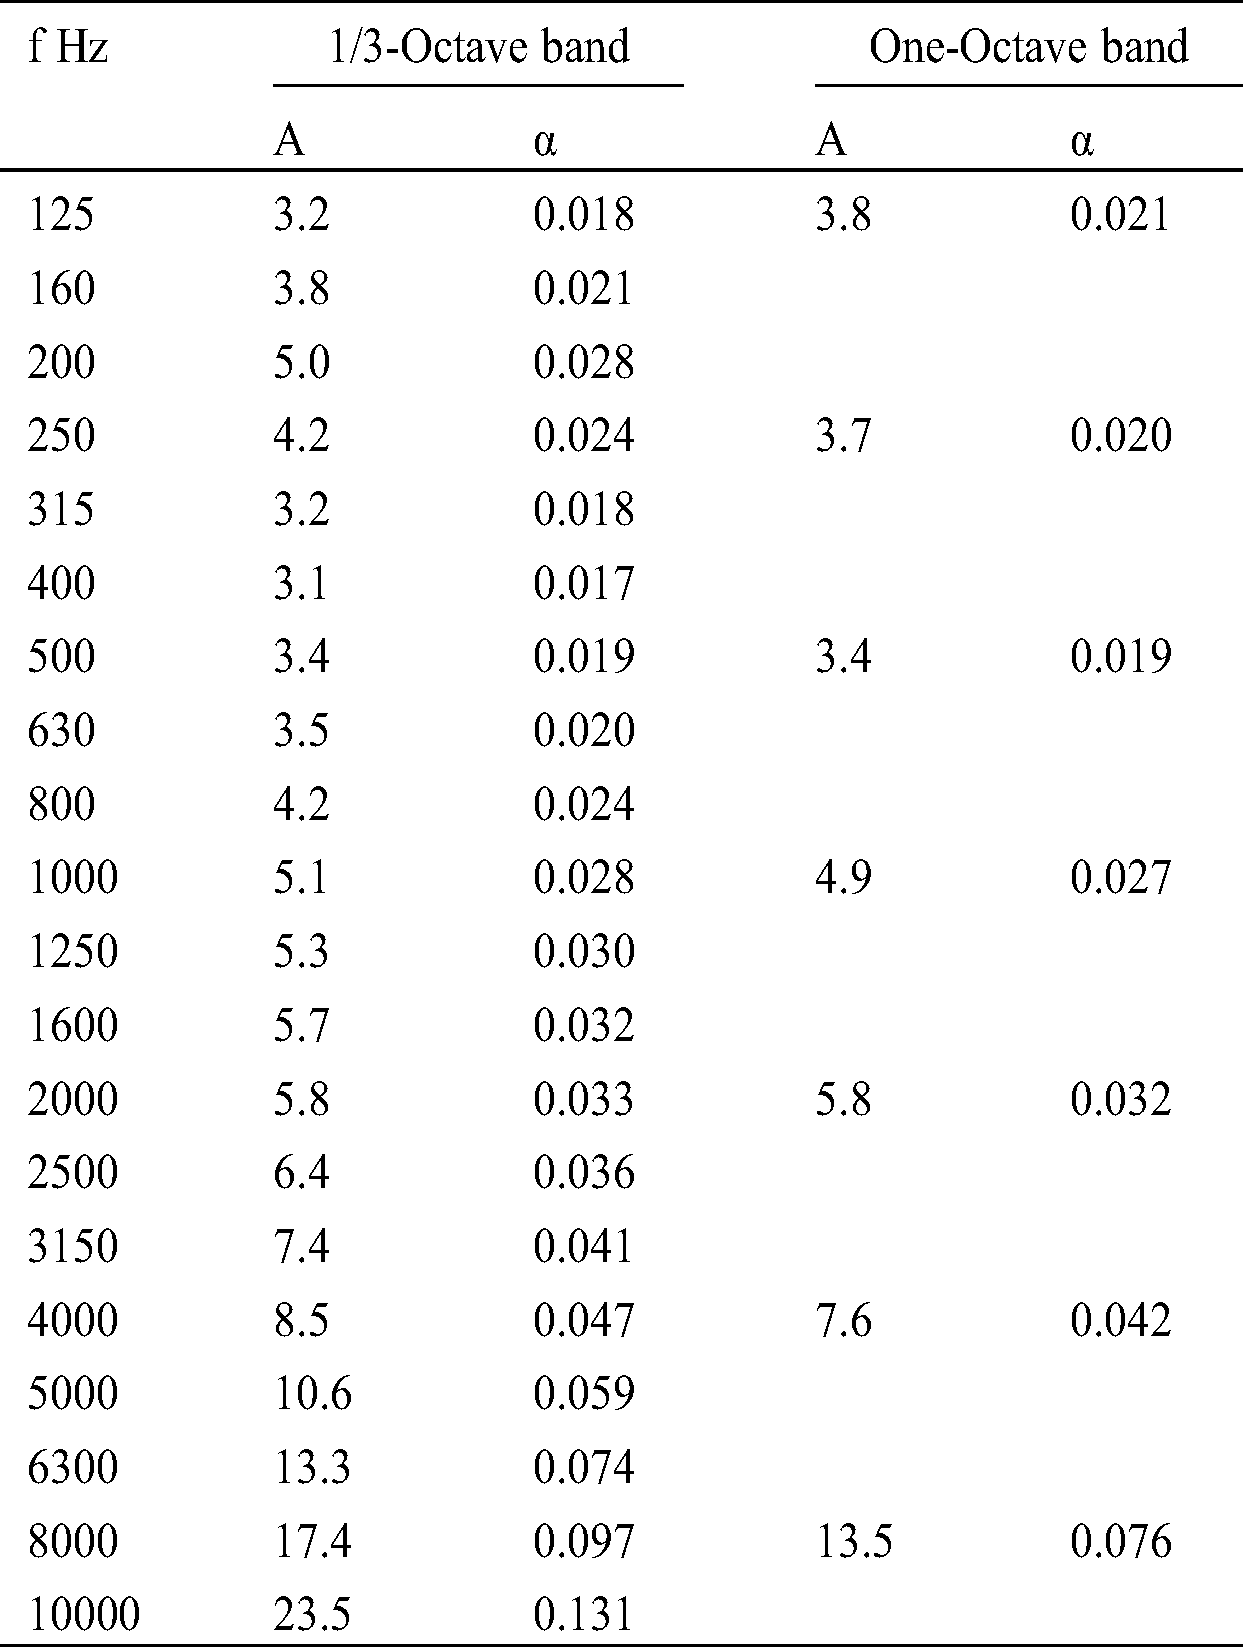
By comparing the results in Tab. 6 with that of the standardized data in Tab. 2 up to 5000 Hz, it is clear that the equivalent sound absorption surface area of the room satisfies the criteria which are given in ISO 3741 standard over the frequency range of interest for one-third octave and one octave. Furthermore the average sound absorption coefficient α of the surfaces for the reverberation room satisfies the condition of ISO 354 standard, where it does not exceed 0.06 to reach the frequency range of 6300 Hz for one-third octave and 8000 Hz for one-octave. We pointed out earlier that there is a doubt in value of measured RT at 125 Hz one-third octave; consequently, there is corresponding doubt in the values of sound absorption area A and the average sound absorption coefficient of the surfaces α at the same frequency. However these values still small enough to satisfy the conditions of ISO 354 standard.
The results of average measured SPLBN for the background noise SPLBN and the standard deviation σBN are shown in Tab. 7.
Table 7: Measured background noise and standard deviation
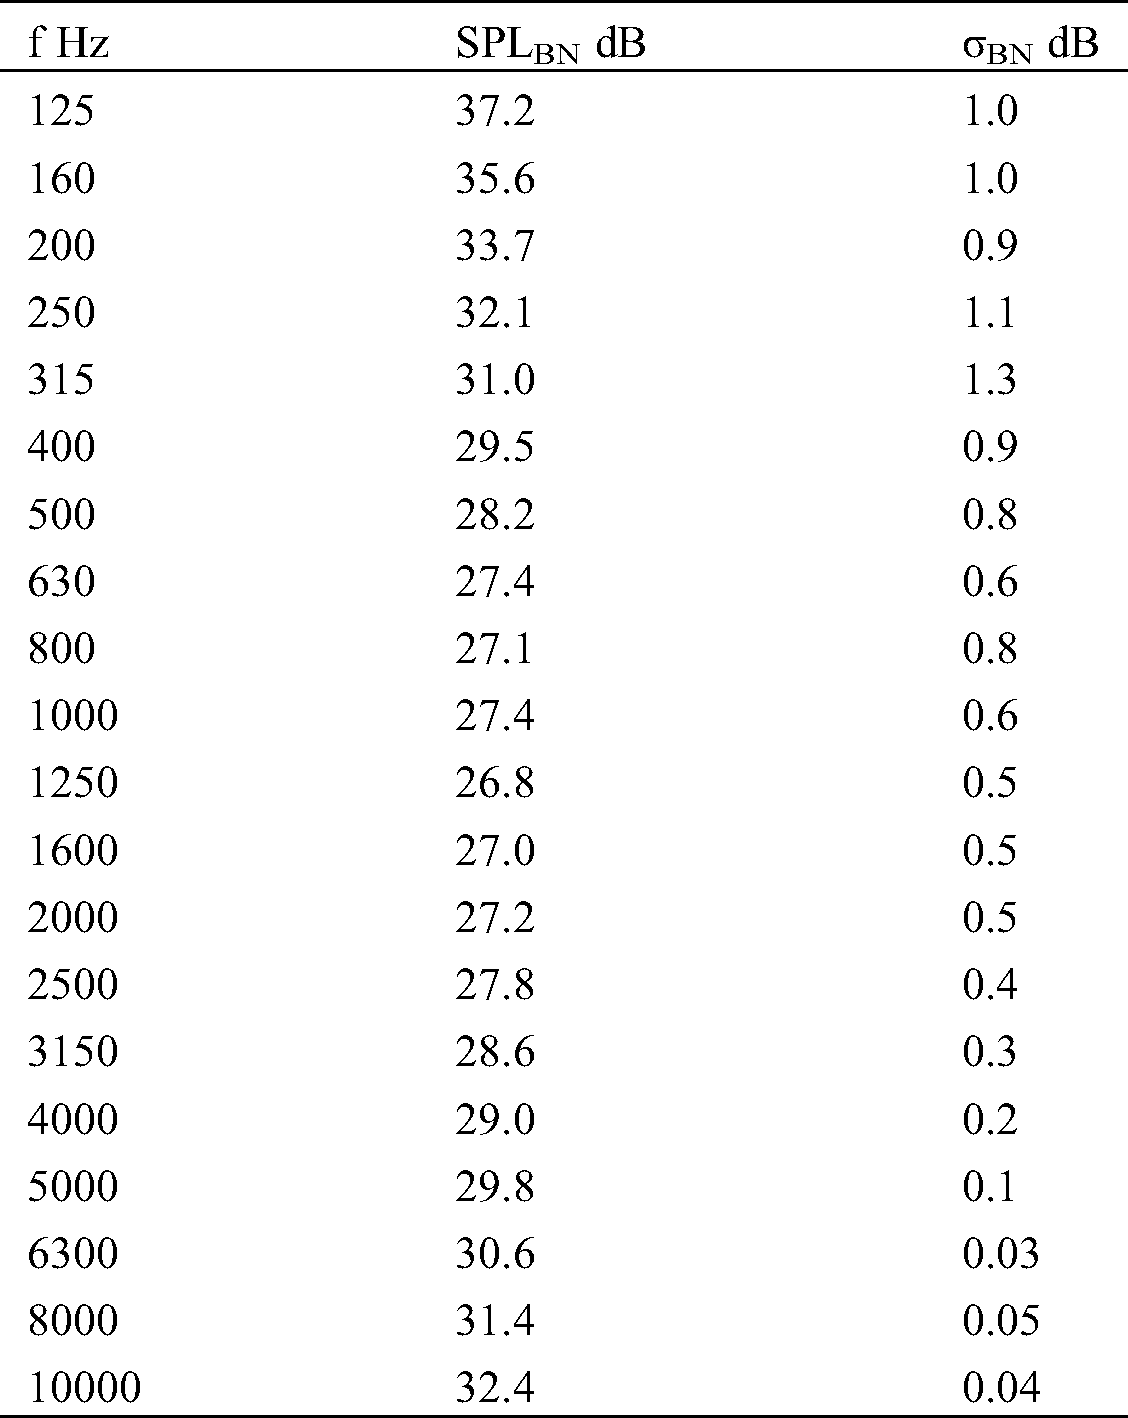
The given results of SPLBN in Tab. 7 are higher than those given in ISO 3741 standard of absolute maximum background noise levels in the test room. Accordingly the requirements of standards for the background noise should be taken into consideration at carrying out the measurements inside the room.
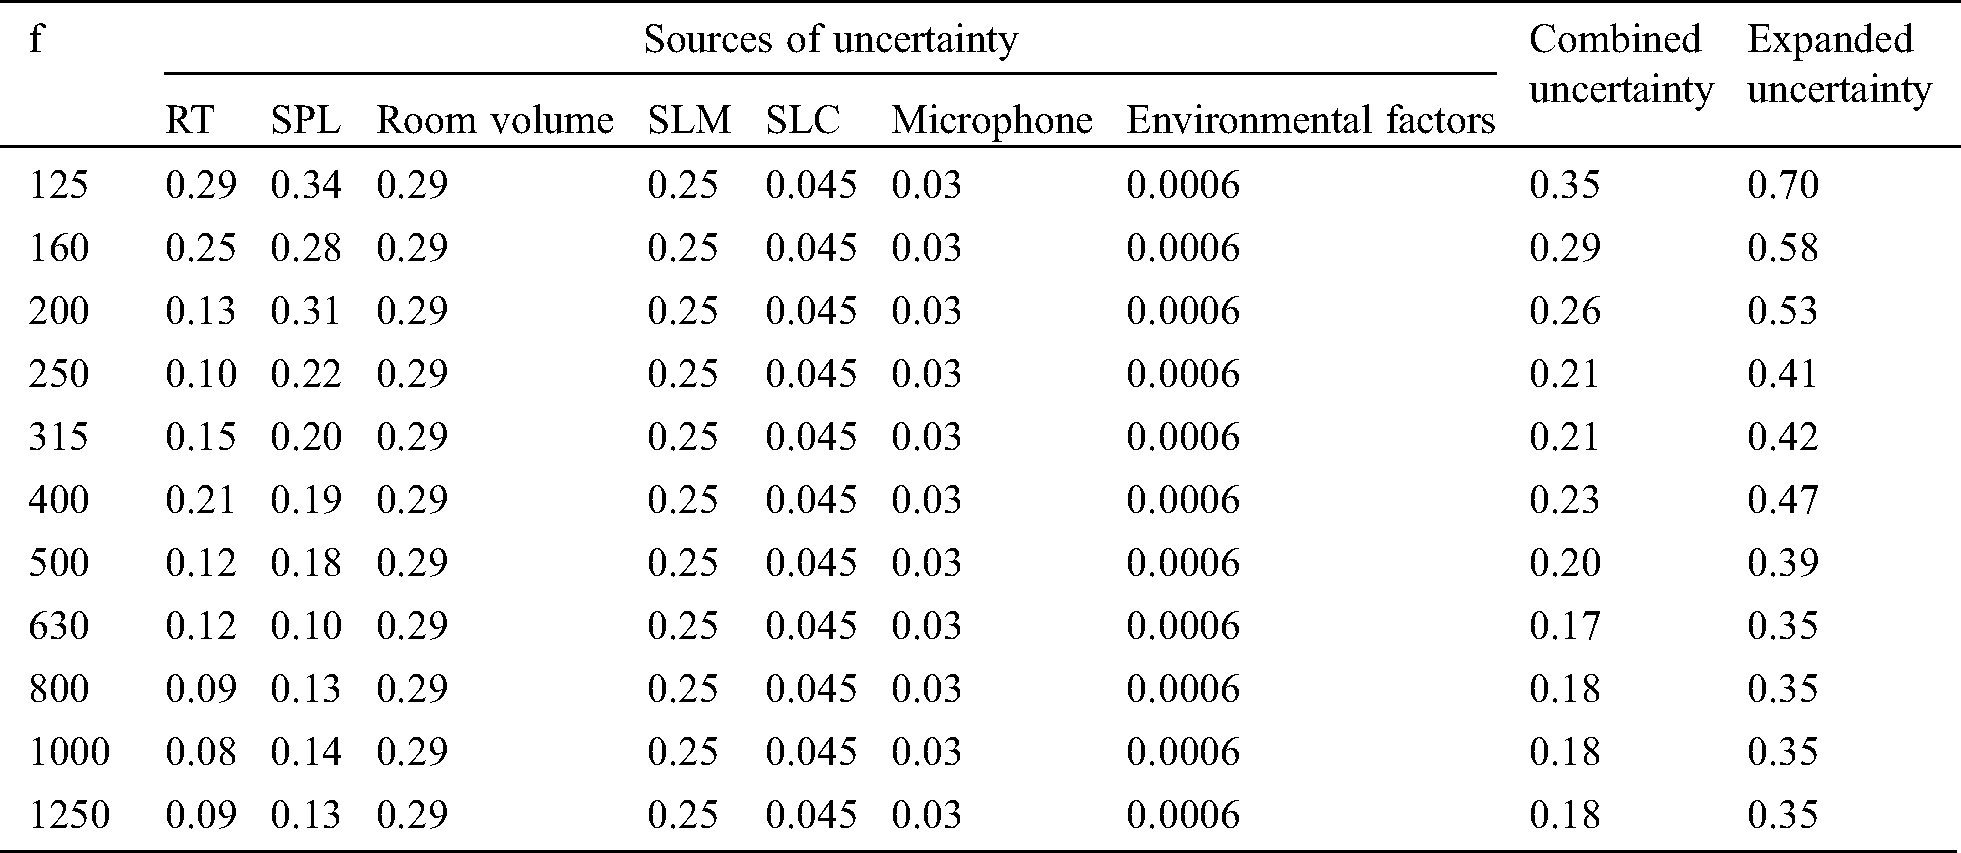
For making the measurements reliable and comparable, the evaluation of uncertainty should be introduced as per the requirements of ISO 17025:2017 [19]. In the case of sound absorption coefficient measurement, the overall uncertainty is influenced by sound pressure level, reverberation time, volume of the room and environmental factors [20]. The budget of uncertainty is shown in Tab. 8.
Table 8: Uncertainty budget of measurements
A thorough evaluation has been carried out on NIS reverberation room and included its design, cut-off frequency and modal compositions, the results showed that the room is efficient and has the ability to produce uniform diffuse sound field inside it, starting from frequency 125 Hz. The experimental part of this study was directed to find the spatial uniformity of the sound field inside the room; the results indicated that there is a lack of diffusivity at 125 Hz one-third octave, which was subsequently resulted in some doubt in values of measured reverberation time at the same frequency. The lack of diffusivity may be overcome in the future via using some diffusers inside the room. NIS reverberation room is fully, or almost compliant with the volume, reverberation time, sound absorption surface area, sound absorption coefficient and sound field distribution of ISO 354 standard or ISO 3741 standard requirements, except the background noise.
Funding Statement: The author(s) received no specific funding for this study.
Conflicts of Interest: The authors declare that they have no conflicts of interest to report regarding the present study.
1. Nélisse, H., Nicolas, J. (1997). Characterization of a diffuse field in a reverberant room. Journal of the Acoustical Society of America, 101(6), 3517–3524. DOI 10.1121/1.418313. [Google Scholar] [CrossRef]
2. Hasan, M., Hodgson, M. (2016). Effectiveness of reverberation room design: Room size and shape and effect on measurement accuracy. 22nd International Congress on Acoustics, Buenos Aires. [Google Scholar]
3. Scrosati, C., Scamoni, F., Depalma, M. (2019). On the diffusion of the sound field in a reverberation room. 26th Congress on Sound and Vibration, Montreal. [Google Scholar]
4. del Rey, R., Alba, J., Bert, L., Gregori, A. (2017). Small-sized reverberation chamber for the measurement of sound absorption. Materiales de, 67(328), 1–9. DOI10.3989/mc.2017.07316. [Google Scholar] [CrossRef]
5. Alexander, R. (2016). Development of a small-scale reverberation room. Proceedings of Acoustics, Brisbane, Australia. [Google Scholar]
6. ISO 354. (2003). Acoustics—Measurement of sound absorption in a reverberation room. [Google Scholar]
7. ISO 3741. 2010). (. Acoustics—Determination of sound power levels and sound energy levels of noise sources using sound pressure—Precision methods for reverberation test rooms. [Google Scholar]
8. Ramani, R., Anant, G. (2008). Reverberation rooms and spatial uniformity. Canadian Acoustics, 36(3), 28–29. [Google Scholar]
9. Schultz, T. J. (1971). Diffusion in reverberation rooms. Journal of Sound and Vibration, 16(1), 17–28. DOI 10.1016/0022-460X(71)90392-0. [Google Scholar] [CrossRef]
10. Schroeder, M. R. (1996). The ‘‘Schroeder frequency’’ revisited. Journal of the Acoustical Society of America, 99(5), 3240–3241. DOI 10.1121/1.414868. [Google Scholar] [CrossRef]
11. Mehadi, Md. (2012). Diffuse sound fields, reverberation-room methods and the effectiveness of reverberation-room designs (Master Thesis). University of Engineering and Technology, Bangladesh. [Google Scholar]
12. Ovsyannikov, S. N. (2000). Modal density in rectangular room. Proceedings KORUS 2000, 4th Korea-Russia International Symposium on Science and Technology, pp. 39–45. Ulsan, South Korea. [Google Scholar]
13. Morse, P. M., Ingard, K. U. (1968). Theoretical acoustics. New York: McGraw-Hill. [Google Scholar]
14. Jacobsen, F. (1979). The diffuse sound field. Report No. 27. The Acoustic Laboratory, Technical University of Denmark. [Google Scholar]
15. BS EN ISO 3382-2. (2008). Acoustics—Measurement of room acoustic parameters — Part 2: Reverberation time in ordinary rooms (ISO 3382-2:2008). [Google Scholar]
16. BS EN ISO 3382. (2000). Acoustics—Measurement of reverberation time of rooms with reference to other acoustical parameters (ISO 3382:1997). [Google Scholar]
17. Draško, M., Mete, Ö. (2013). Analysis of reverberation time field measurement results in building acoustics. Telfor Journal, 5(2), 145–150. [Google Scholar]
18. Xiang, D., Wang, Z., Chen, J. (1991). Acoustic design of a reverberation chamber. Applied Acoustics, 32(2), 83–91. DOI 10.1016/0003-682X(91)90050-O. [Google Scholar] [CrossRef]
19. Standard, B. (2006). General requirements for the competence of testing and calibration laboratories. EN ISO/IEC, 17025. [Google Scholar]
20. Izewska, A. (2007). Measurement uncertainty of sound insulation and sound absorption. 19th International Congress on Acoustics, Madrid. [Google Scholar]
 | This work is licensed under a Creative Commons Attribution 4.0 International License, which permits unrestricted use, distribution, and reproduction in any medium, provided the original work is properly cited. |