| Sound & Vibration |
DOI: 10.32604/sv.2021.016662
ARTICLE
Prioritizing and Providing Sound Pollution Control Strategies at the CPF of North Azadegan Oilfield Project
1Department of Occupational Health, School of Public Health, Tehran University of Medical Sciences, Tehran, Iran
2Department of Occupational Health and Safety Engineering, School of Public Health and Safety, Shahid Beheshti University of Medical Sciences, Tehran, Iran
3Department of Occupational Health and Safety Engineering, School of Public Health and Safety, Shahid Beheshti University of Medical Sciences, Tehran, Iran
4Abadan Institute of Technology, Khuzestan, Iran
5Department of Management and Social Services, University of Applied Science and Technology, Ahwaz, Iran
6Department of Occupational Health and Safety at Work Engineering, Faculty of Medical Sciences, Tarbiat Modares University, Tehran, Iran
*Corresponding Author: Ali Salehi Sahl Abadi. Email: asalehi529@sbmu.ac.ir
Received: 14 April 2021; Accepted: 13 July 2021
Abstract: Among the harmful occupational factors, noise is the most common exposure in the oil industrial workplaces. The present study aimed to prioritize sound pollution areas in central processing facilities (CPF) of an oil field in order to provide corrective action in the studied industry and similar industries. After reviewing the issued permit to work, job description and noise dosimetry test, the evaluated areas were selected then sound pressure levels in the referenced areas investigated according to ISO 9612–2009 (E) next the noise map prepared for all selected areas. For identifying the prioritized areas to implement the control measures NCPI was used. After identifying the first priority area with sound pressure levels greater than 85 dB, the frequency analysis was performed and Isosonic map was prepared by Surfer v10 and AutoCAD 2014. In the last step, in order to provide appropriate corrective action plan, the compatibility of the determined control actions with the production process was examined. The findings of this study indicates that 74% of the aforesaid area has the first priority to perform control measures in the caution zone and the remaining 26% is in the danger zone. In this study it has been demonstrated that implementing control measures for Zone 2 have first priority. The main source of the noise in this zone is fluid (Gas) flow through the piping and HP Gas Compressors. The results of this study shows that using effective factors such as exposure time, sound pressure level and number of exposed persons, can be present suitable model to prioritize noise control.
Keywords: Oil industry; NCPI; noise pollution; noise control; harmful factors
Noise is considered the most common exposure factor among all the occupational physical harmful factors in industrial environments [1], therefore evaluation noise amount, due to large variety of processes and equipment sources in addition to its ultimate health effects is important [2].
Noise is one of the main causes of work-induced injuries [3] that can result in work ability and social disorder [4]. Hearing loss is one of the most important aspects of noise exposure and can intensify high blood pressure, cardiovascular disease, digestion disorder, neurological-psychological and sleeping disorder [5–9]. Noise also can induce communicational problems, thus causing the exposed personnel to not hear sound warnings therefore effect the safety and performance having the ultimate drawback of stress induction and efficiency decrease, however mostly these issues are neglected [7,10–12].
In addition to mentioned items in prevention of noise effects, this subject has economical aspects in a way that there are 16% of hearing loss worldwide is related to work-induced injury as a result of noise exposure and approximately 600 million workers are exposed to harmful noise in their work place. In Iran, it is estimated that more than 2 million workers in industry are exposed to noise level above limit.
Noise Induced Hearing Loss (NIHL) is reported to be second most common work-induced injury. In 2007, 14% of the occupational illnesses was reported as hearing loss and 82% of these cases were caused by noise exposure in industrial work places. According to the published statistics by occupational health and safety association, among 1.2 million workers subjected to occupational medical examination, 23,414 of them had hearing decrease, the most observed occupational illness [13].
Based on available data and statistics, the importance of noise control in work places is obvious [14]. General methods of noise control consist of noise source control, control of noise in environment and propagation path and control in noise receive location, and among these methods, control of the noise source is the most effective method. On the other hand, if noise control in source or along the propagation path is not possible, Personal Protective Equipment (PPE) the most common and economical mean of protection however it has the lowest effectiveness compared to other methods [13,15–18].
In order to prioritize the units in order to control the noise, in addition to the sound pressure level parameter, the number of people exposed and the duration of exposure of those people are also among the influential factors in determining the importance of noise pollution in the units. Presentation of an index considering the mentioned parameters was considered in this study, which used the Noise Control Prioritizing Index. According to the results of studies conducted by Golmohammadi et al. [15], the use of this index is a reliable way to prioritize voice control and the results can be used for other similar and related industries. Noise control and reduction in oil fields is very important. In the study of Nasiri et al. [19], the Noise Control Prioritizing Index was used to investigate noise pollution in petrochemicals [19].
Oil and its related industries, has a strategic and important role in the country. Large number of employees in these industries in addition to results of studies regarding the noise effect, implies the importance of further investigation on the subject of noise control [11]. This investigation was conducted in fall of 2019 with the goal of determining the noise prioritizing index in North Azadegan Oil Field.
This field is located 120 KM south-west of Ahwaz city having 460 square kilometer area along iran-iraq border and in the Hor-Al-Azim wetland. The working shifts in each rotation consists of 450 personnel having an average age of 35–50 years with variance of 7–8 years.
North Azadegan oil field process section consists of surface crude oil treatment unit, with the aim of stabilization and dehydration of the reservoir fluid. Mixture of crude oil, associated gas and formation/injected water is brought to surface by means of Gas-Lift mechanism from 23 production wells. After collecting the fluid in the Oil Gathering Manifolds (OGMs), the crude oil feed is received at the Central Processing Facility (CPF).
CPF consists of various sections however 3 main areas, namely the area 1 (Electrical Power Plant), area 2 (Gas Processing Facility) and area 3 (Oil Treatment and Heating Medium Area) are considered to be investigated due to presence of various noise sources such as: Generators, high- and low-pressure pumps, gas compression system and fluid transport related noise in the piping system. Fig. 1 demonstrates the processing plant layout selected for investigation.
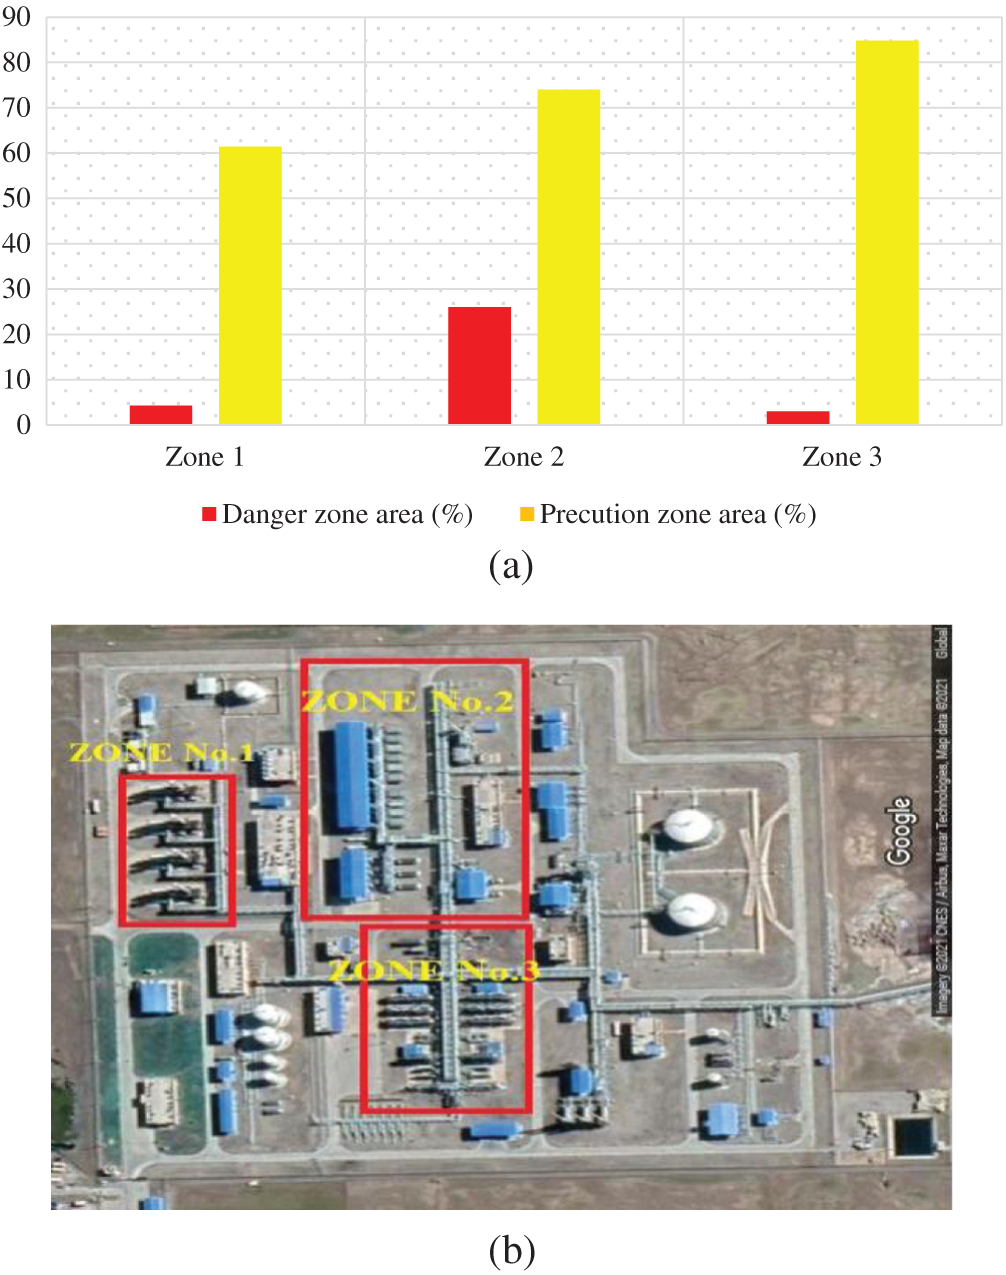
Figure 1: (a) Percentage of area located within the precaution and danger zones, (b) CPF layout
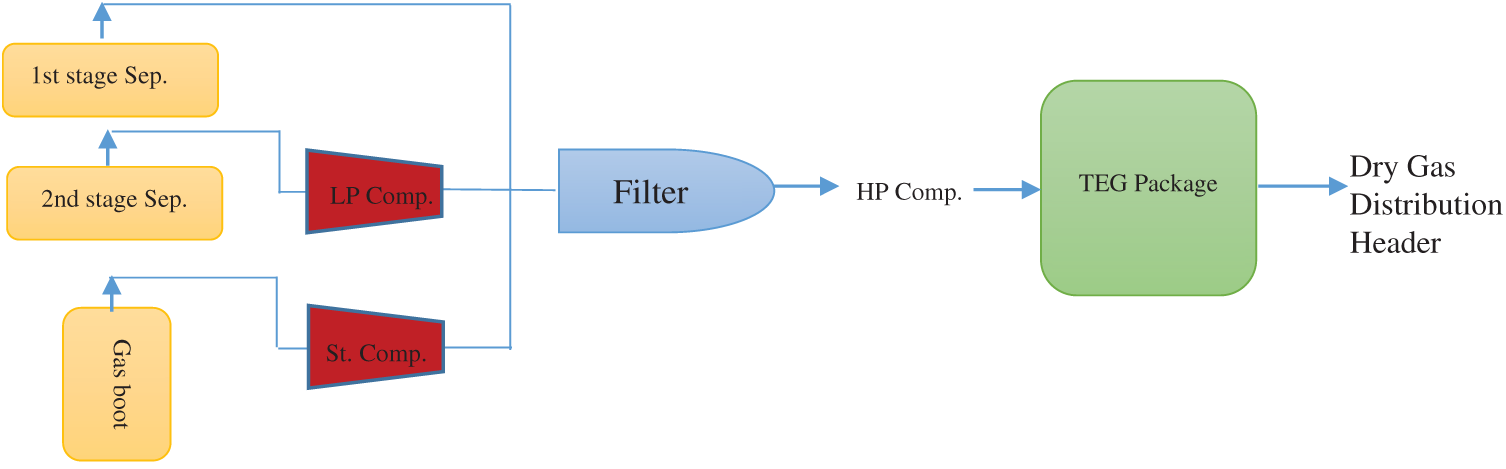
Flow Diagram 1: Gas flow in area 2
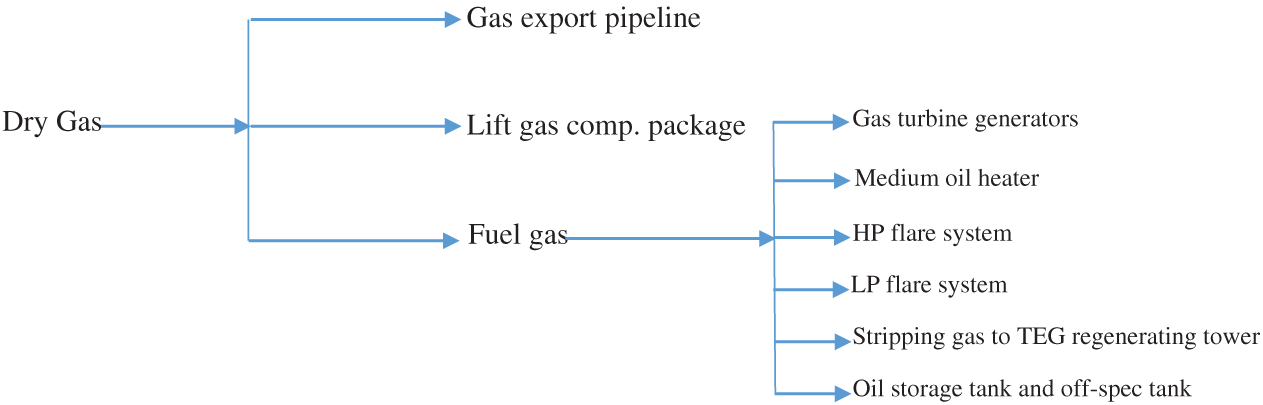
Flowchart 1: Produced gas consumers
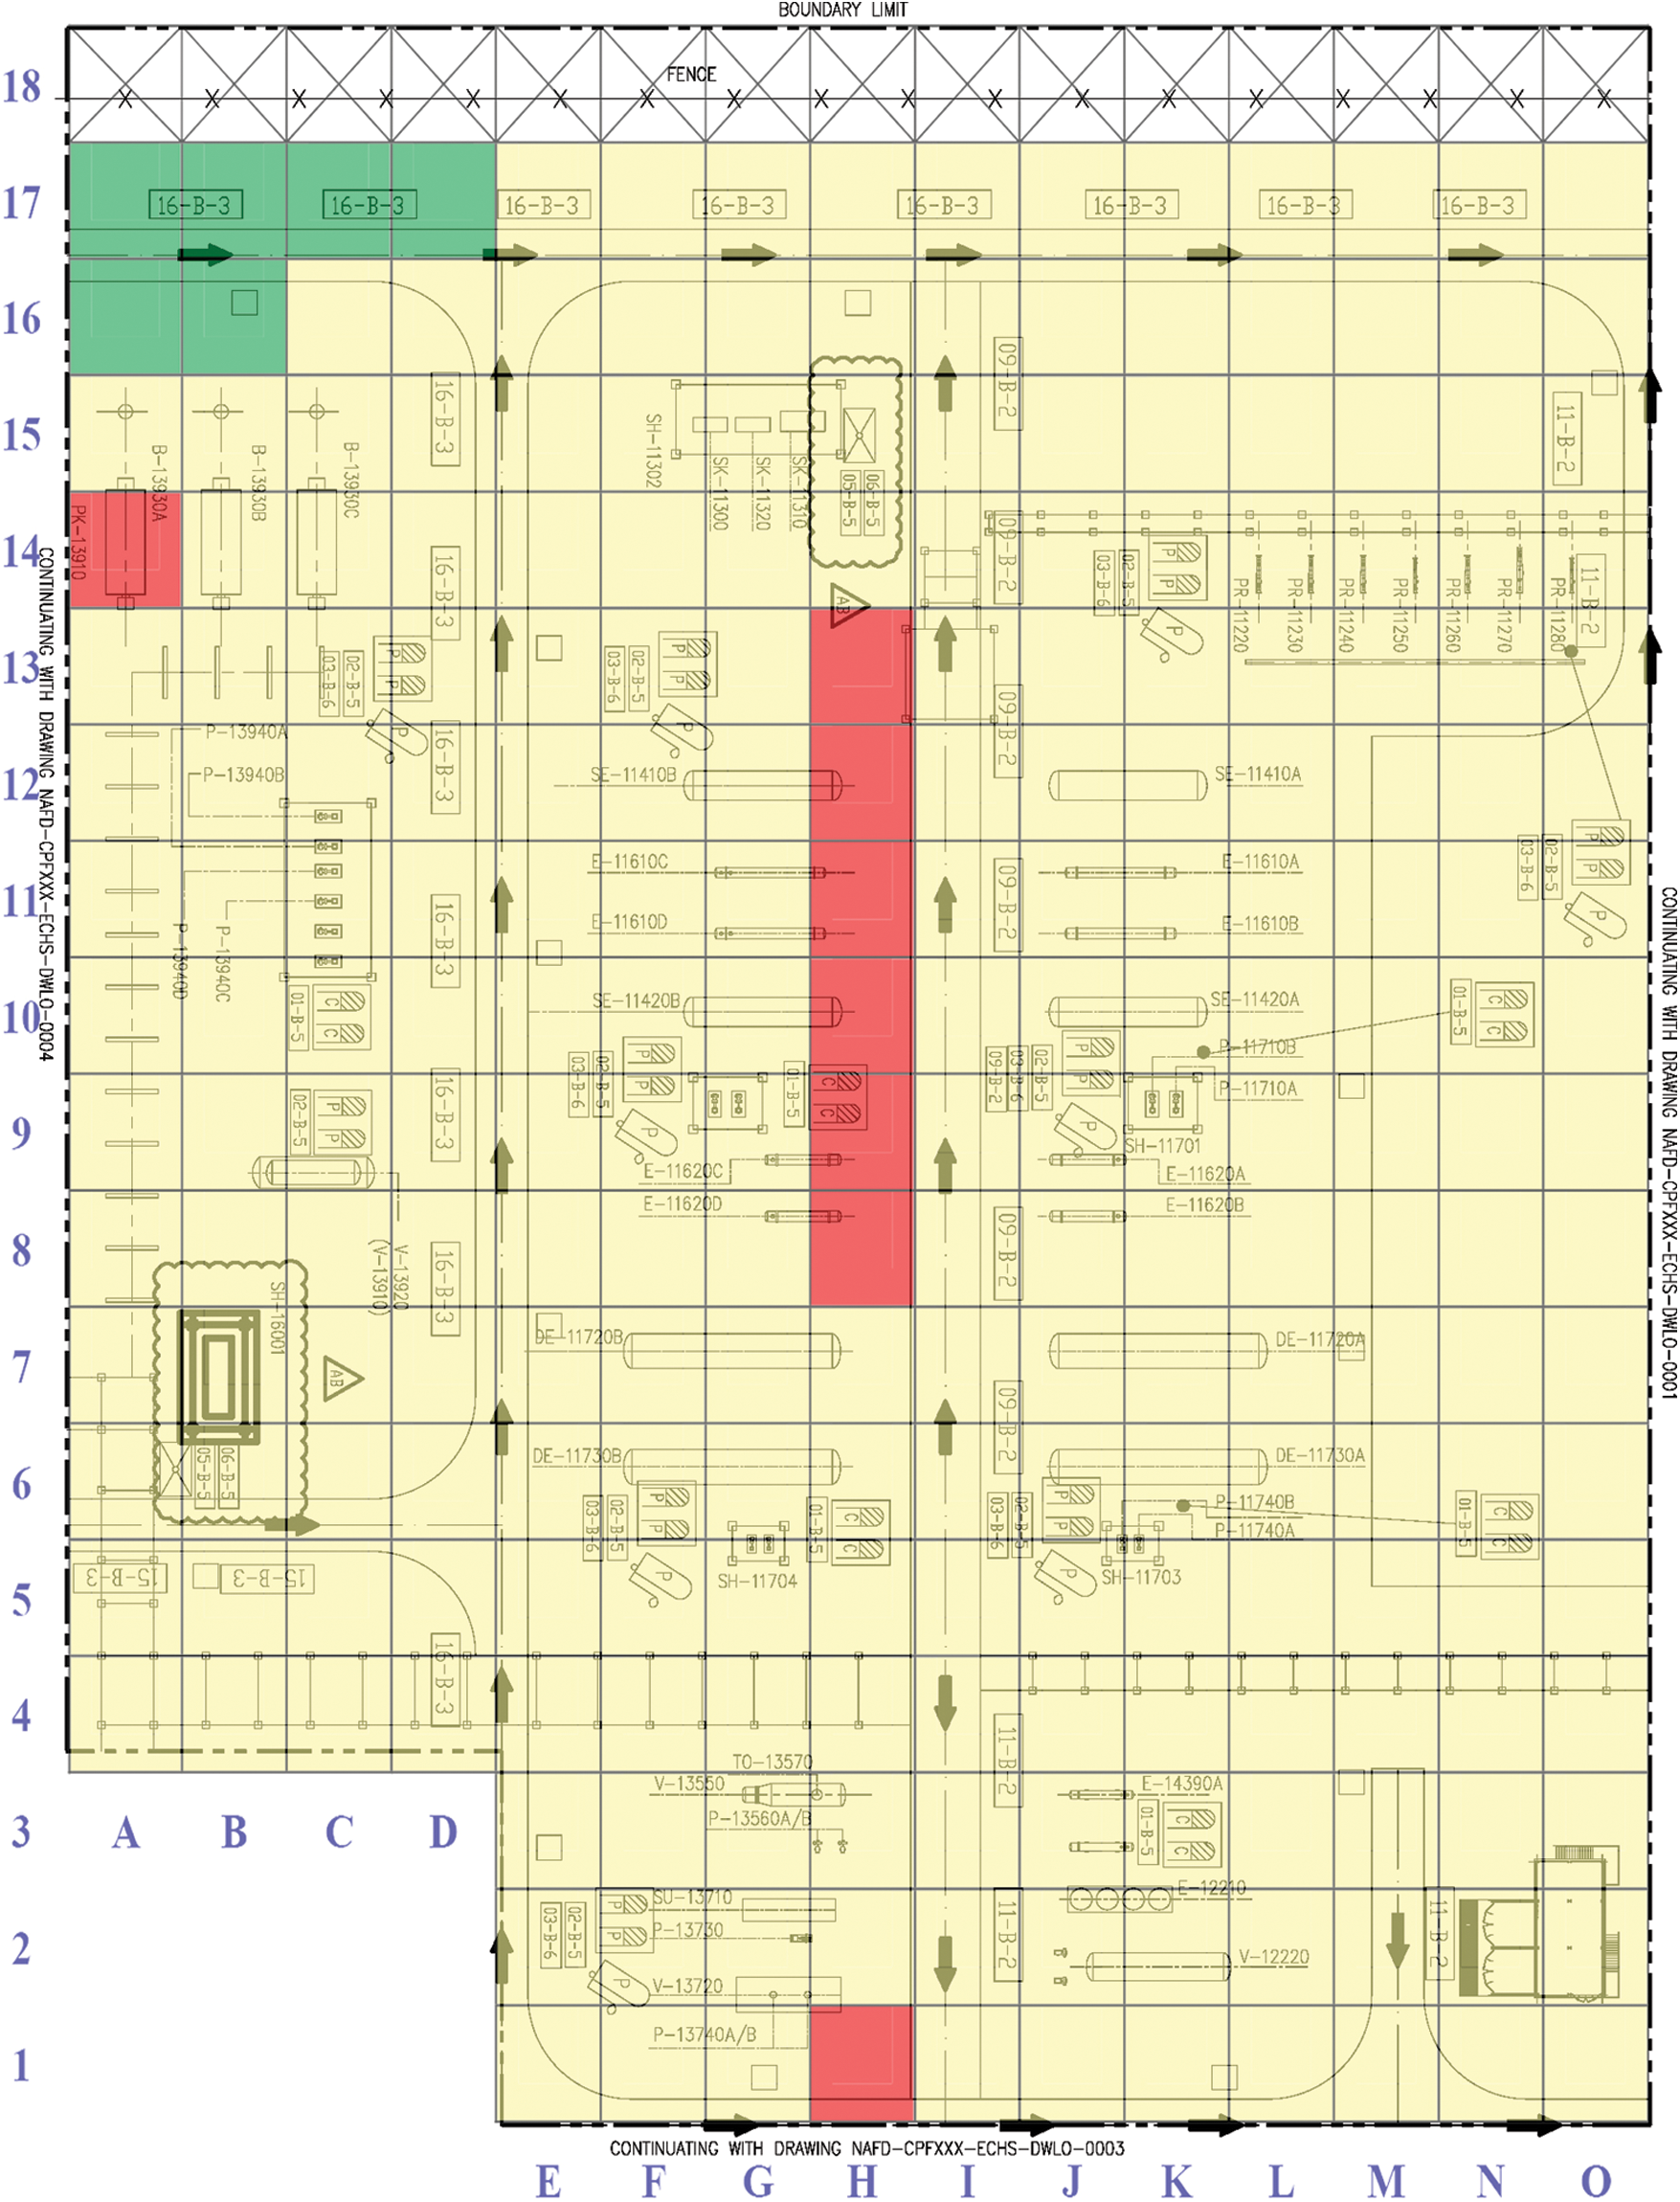
Figure 2: Zoning Map–Zone 1
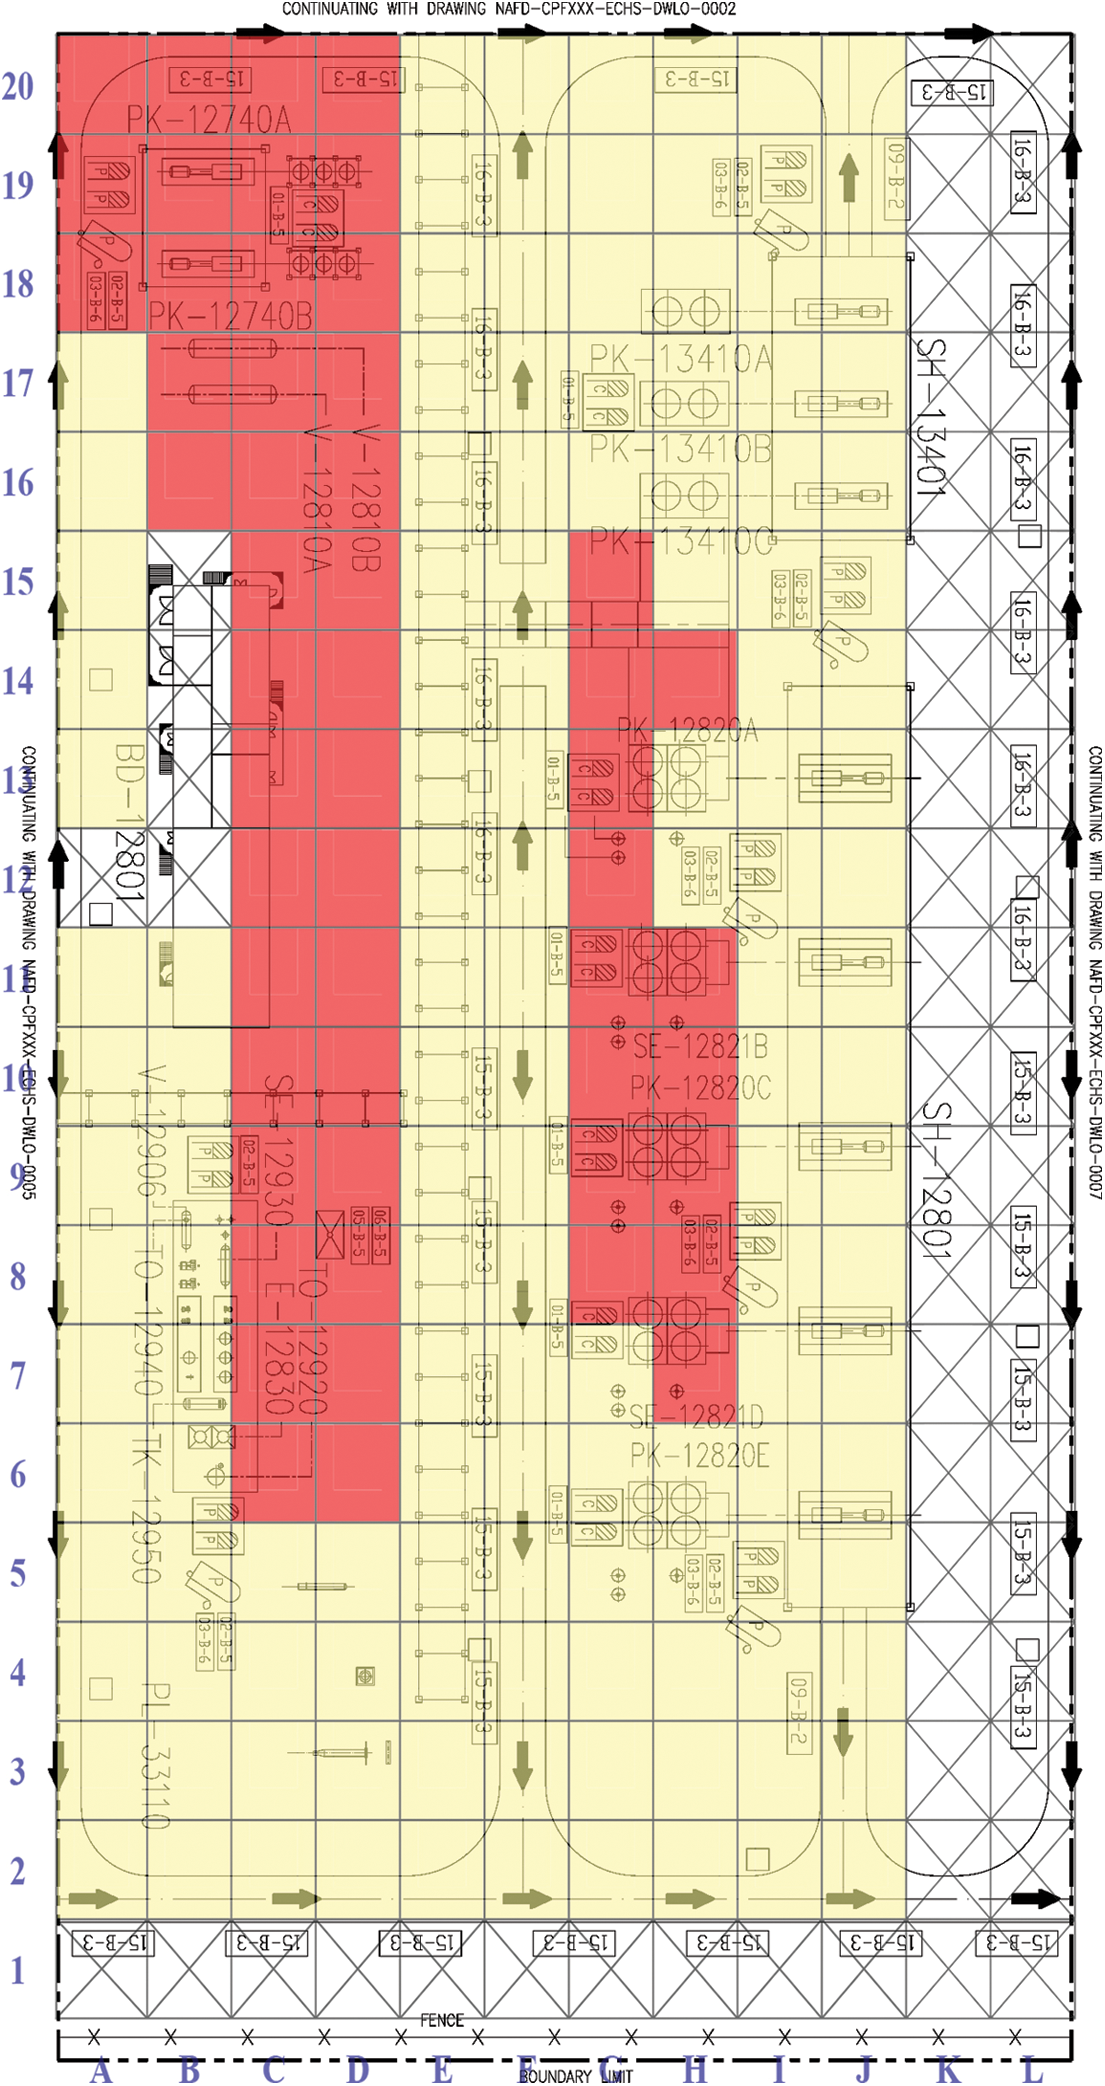
Figure 3: Zoning Map–Zone 2
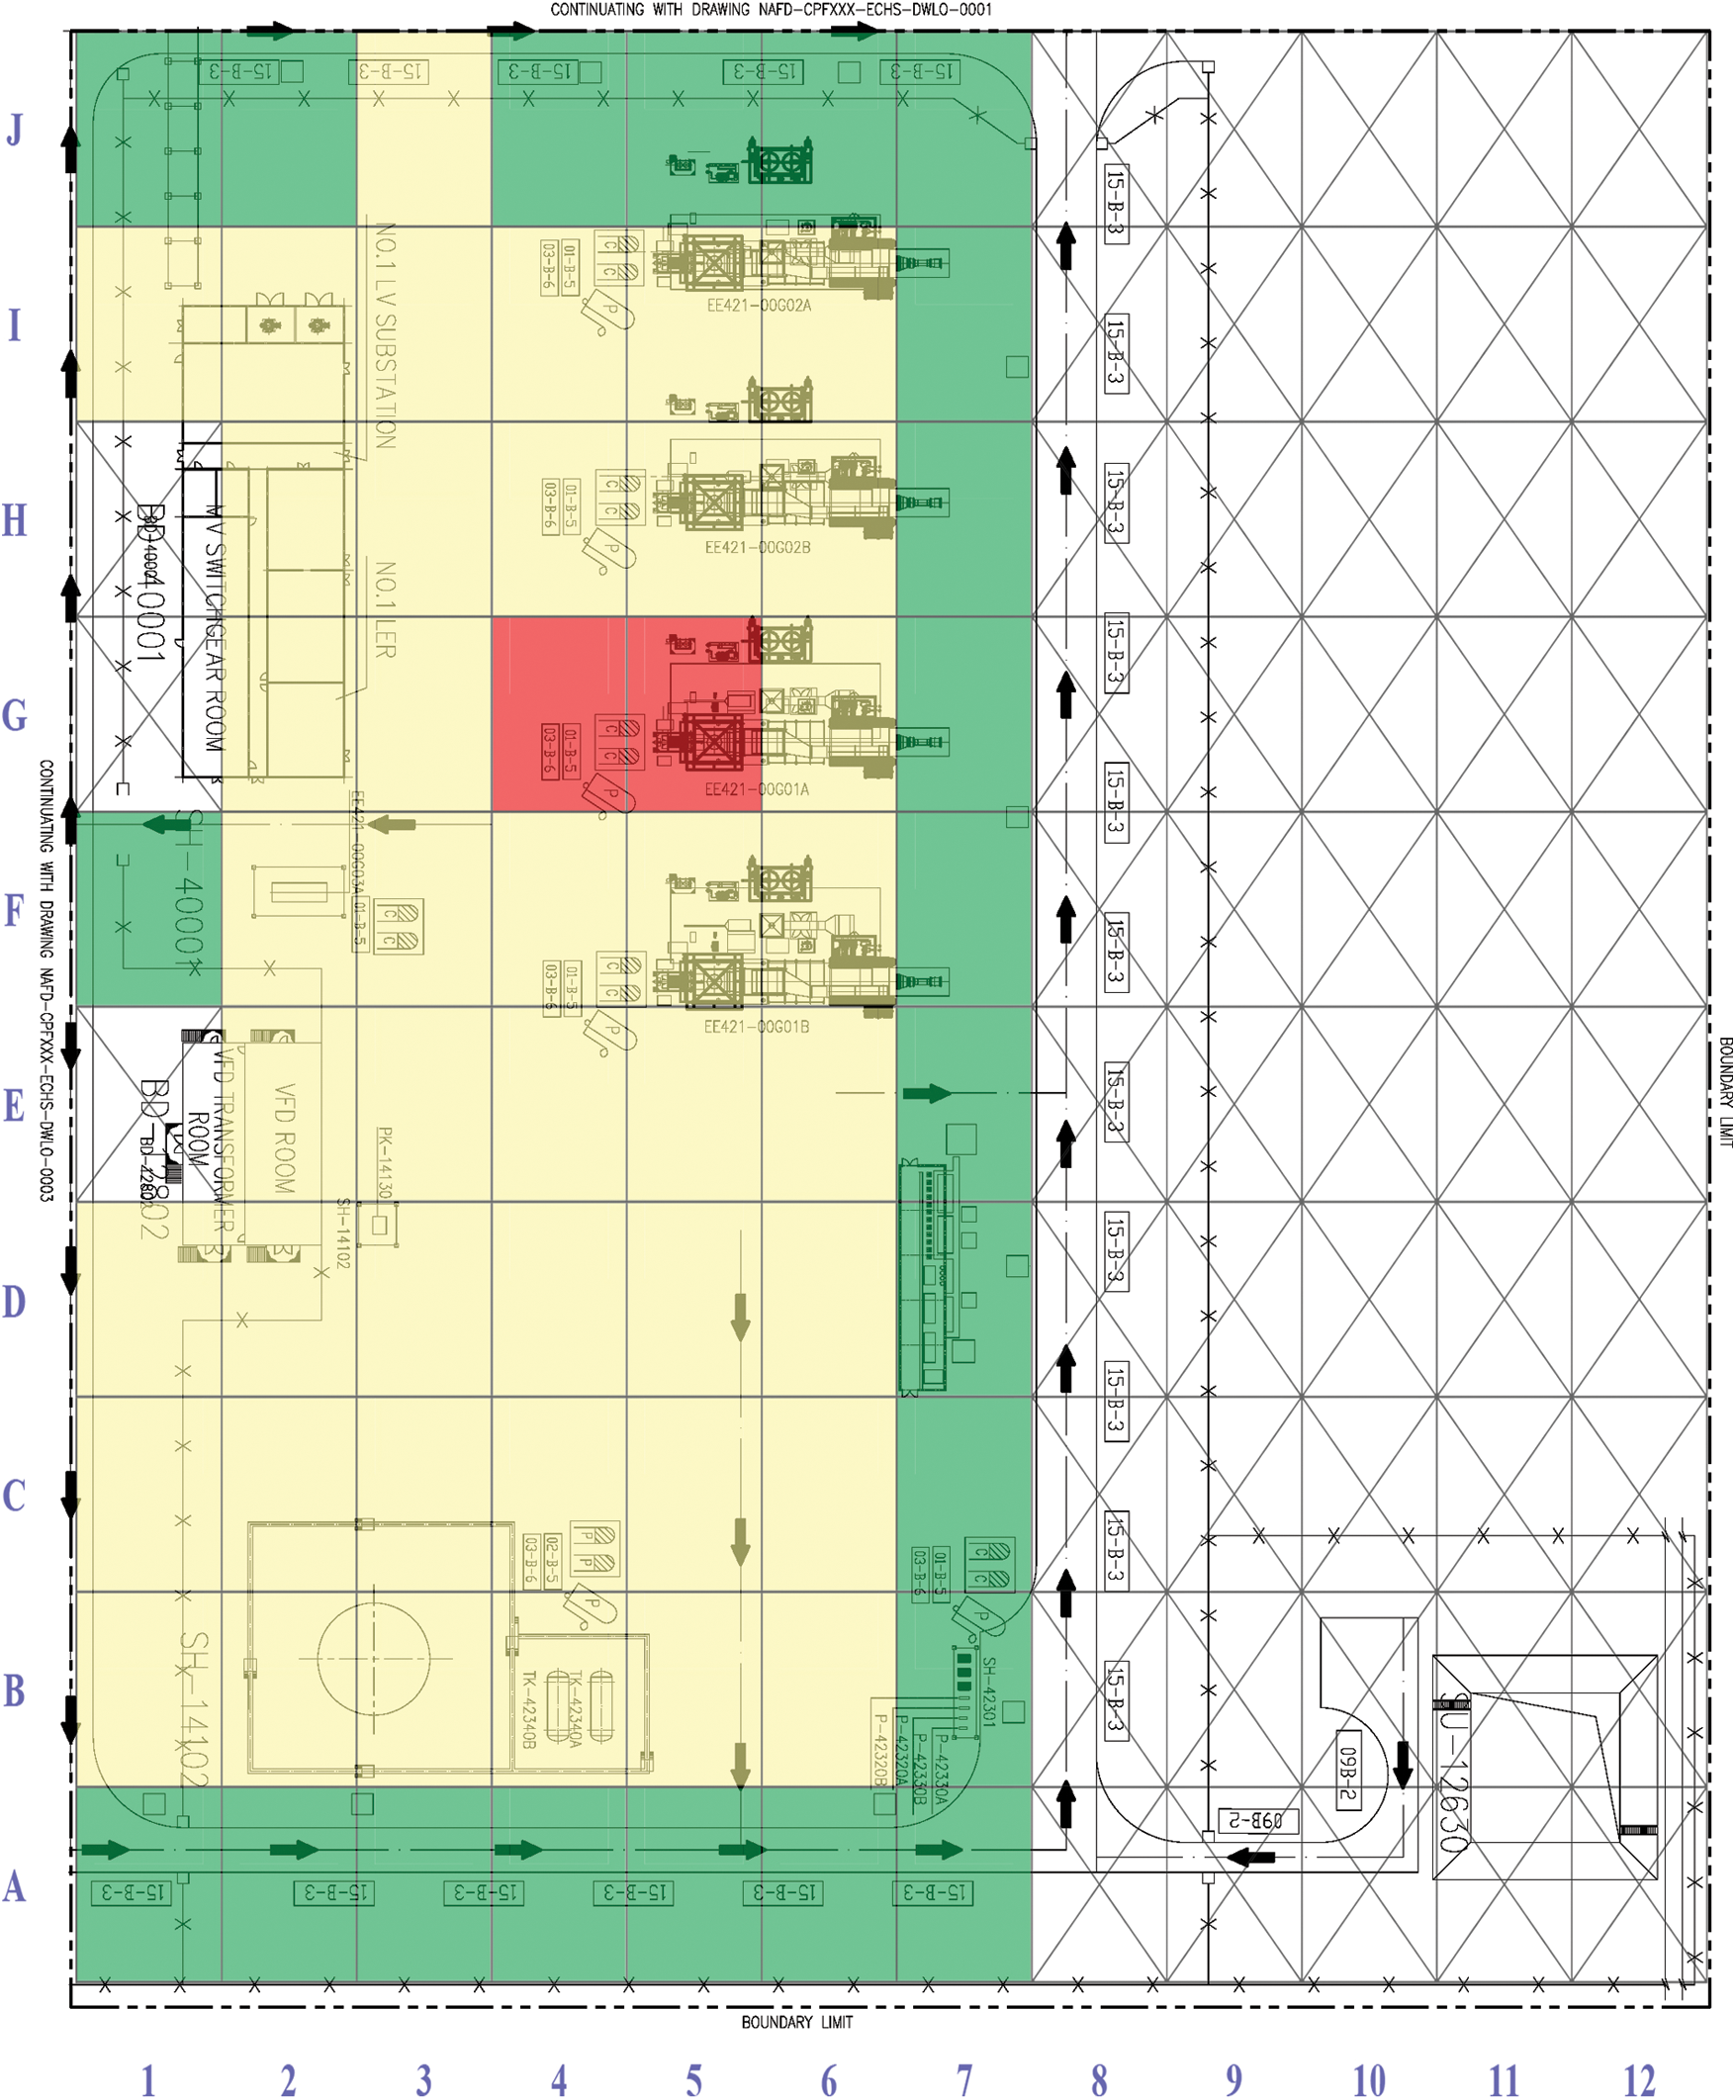
Figure 4: Zoning Map–Zone 3
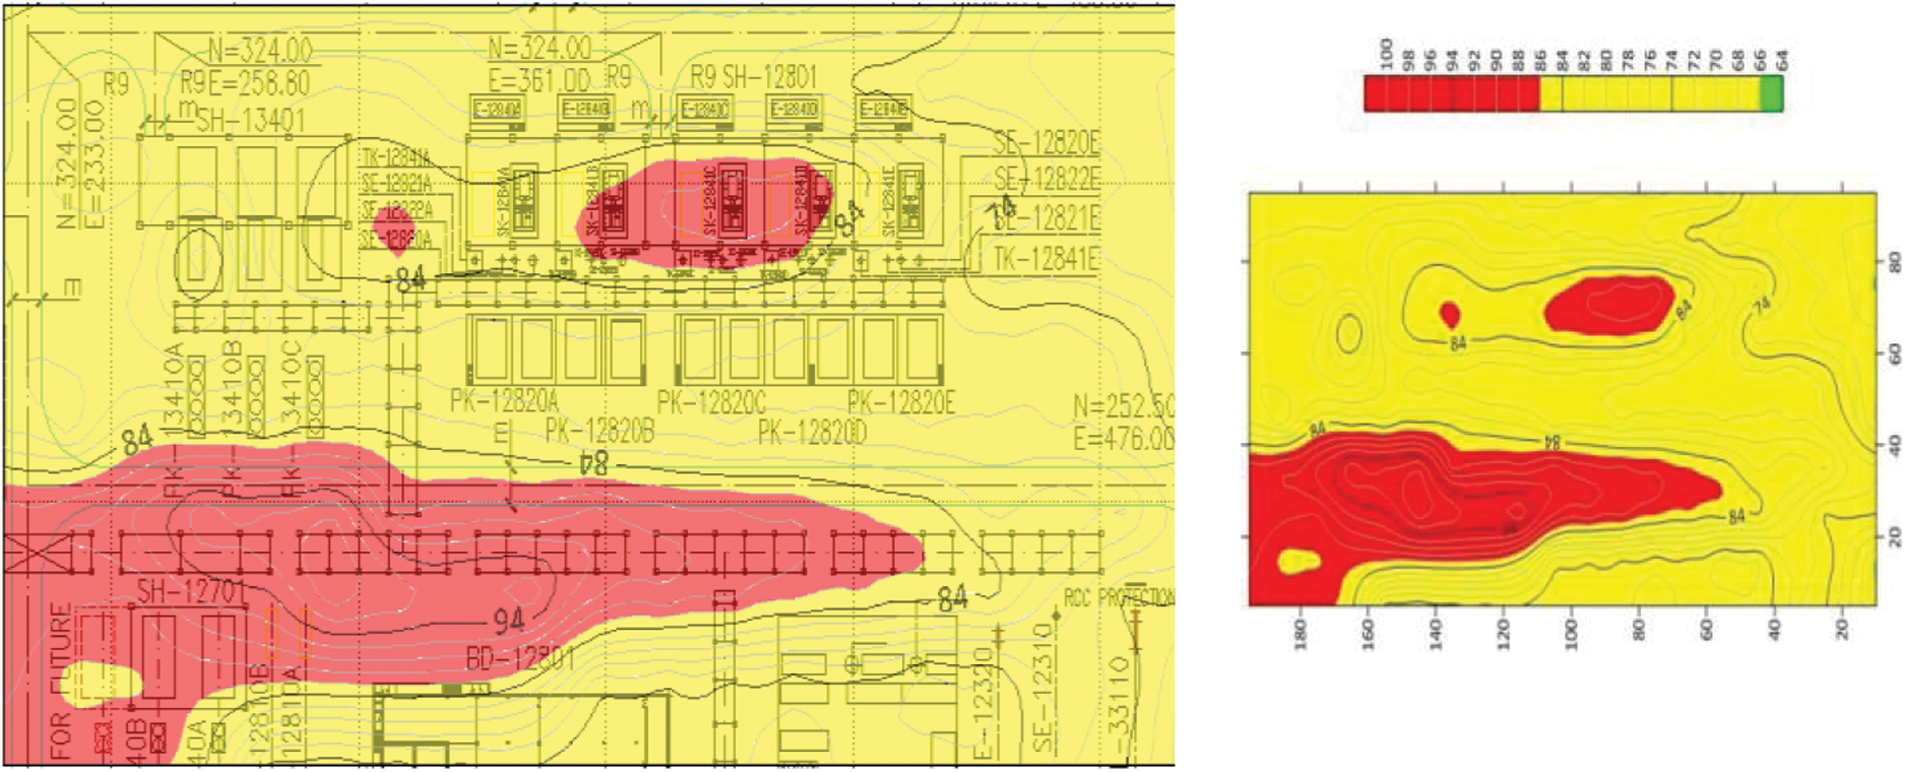
Figure 5: Isosonic Map–Zone 2

Figure 6: Average frequency analysis of sound pressure level in weighted network c
Based on the observable evidence regarding the excessive noise level in the designated locations, first exposure time of various working groups including safety officers, field production operators and maintenance technicians were measured based on the job description and information acquired from the departments.
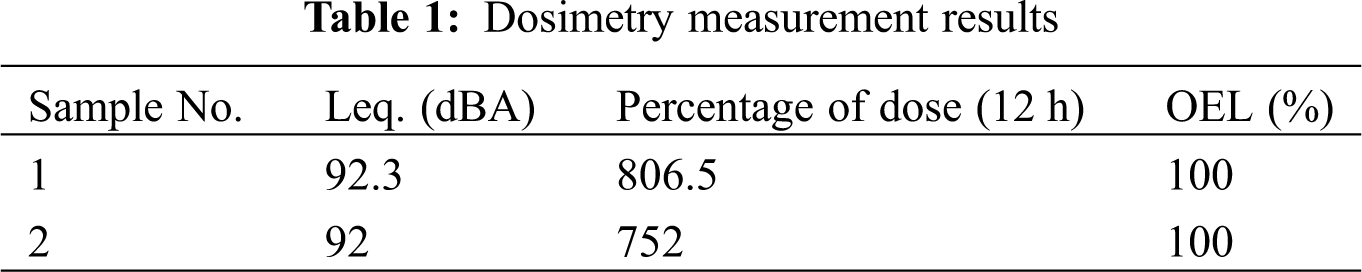
Due to the fact that the safety officers have longest time of exposure equal to 6 h in 12 h shift, this group has been selected to estimate the maximum noise dosage reception. In order to perform dosimetry, CEL-360 device has been used that is able to measure Dose (%) and Leq. according to the standard received dose, if a person is exposed to standard limit, received dose shall be lower or equal to 100. The dose received (%) is calculated from the following equation [20]:
Eq. (1); Percentage of Received Dose:
2.2 Review of Production Process
Based on the plant design, gas from the First Stage separator is routed to the Filter Separators while the discharge gas of the Second Stage separator will first be pressurized in the LP Gas Compressors and then sent to Filter separators and finally the Gas from Gas boot unit will be pressurized in the Stabilized Gas Compressors prior to filter separators. The collected gas exiting the filter separator, will be routed to TEG Dehydration unit after gaining the required pressure by the HP Gas Compressors (Flow Diagram 1).
Clean dry gas will be distributed among consumers after TEG unit (Flowchart 1).
Due to the current circumstance, the majority of the first stage separator gas, all of the Second Stage separator gas in addition to the gas boot produced gas, is sent to HP and LP flares, thus the LP and Stabilized Gas Compressors are out of service and only a fraction of the outlet gas of the first stage separator is process hence the full capacity of the processing plant in this section is not utilized (1st Stage Separator → Filter Separator → HP Compressor → TEG Package → Dey Gas).
2.3 Environment Noise Level Measurement
Following the verification of excess noise level in the selected areas, exact environmental noise measurement based in ordered network method according to ISO-9612 2009 (E) was conducted. In weighted network A, noise level measurement was carried out in center of each station by means of noise level indicator (Device Casella CEL Model 450). In order to assure the correct function of the mentioned device, CEL 110/1 calibrator was utilized. Minimum, maximum and average value of noise level in each of the stations has been incorporated into the noise zoning map that is prepared for each area. Safe, caution and dangerous limits were specified in the next step and following this, the number of stations in addition to corresponding percentage of stations in each of the mentioned safe, caution and dangerous limits were determined [1,15,21]. During the field measurement of the noise, in order to assure the data accuracy, the measuring device was placed in the height equal to personnel hearing height also sponge protection was employed so that air current noise be negligible [22].
2.4 Noise Control Priority Index (NCPI)
In order to prioritize the zones for noise control, based on the mentioned patterns in previous investigations, number of exposed personnel and exposure time in addition to noise level measurement results are considered as influential factors [10,15]. According to pattern presented, Eq. (2) has been used and for more convenient result comparison, numerator and denominator of the equation is multiplied by 100. After determining the zone index and priority of remedial action, Surfer v10 and AutoCAD v2014 were employed for developing the iso-sonic map of the related zone. In zone with first priority, for stations having noise pressure level above 85 db, personnel standing locations and locations with maximum personnel traffic, noise frequency analysis based on OEL-NV-9505 in network C was conducted [22].
Eq. (2); Noise Control Priority Index
In which:
wi: weighted factor corresponding to noise pressure level
pi: Number of exposed personnel located in intended zones of noise level
ti: Exposure time (hours)
P: Total number of personnel
T: Total exposure time
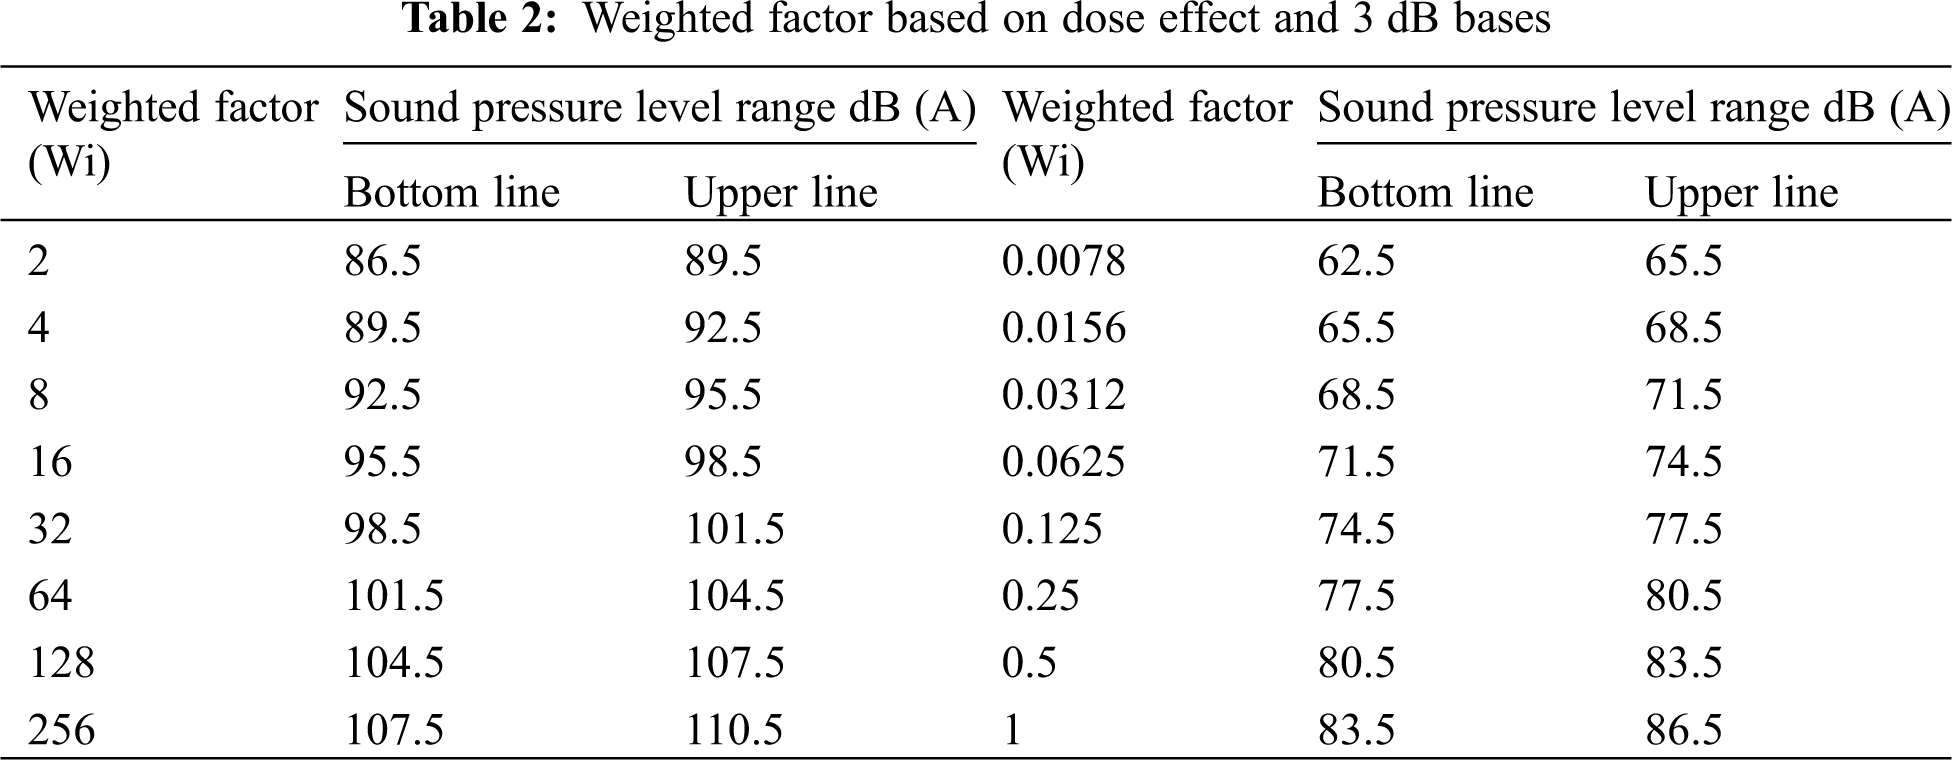
Tab. 1 demonstrates the dosimetry results of two 12 h consecutive shifts in which it is concluded that received dose, in chosen areas, by the pre-study selected group (Safety officers) is 8 and 7.5 times the allowable limit. Tab. 2 presented the Weighted factor based on dose effect and 3 dB bases.
3.2 Environmental Noise Measurement Results
The map of the three zoned areas was presented in Figs. 2 to 4. The isosonic map of region 2 was also shown in Fig. 5. Among 3 selected areas, total of 594 stations were investigated in which for each station, minimum noise pressure level (LAS min), maximum noise pressure level (LAS max) and average noise pressure level (LAS) has been recorded and demonstrated in Tab. 3. In order to obtain the number of exposed personnel in the dangerous perimeter, job description and 2,166 Permit to work (PTW) registered to perform various operations in the areas under investigation, over the past year, has been utilized. Average frequency analysis of sound pressure level in weighted network c shown in Fig. 6.
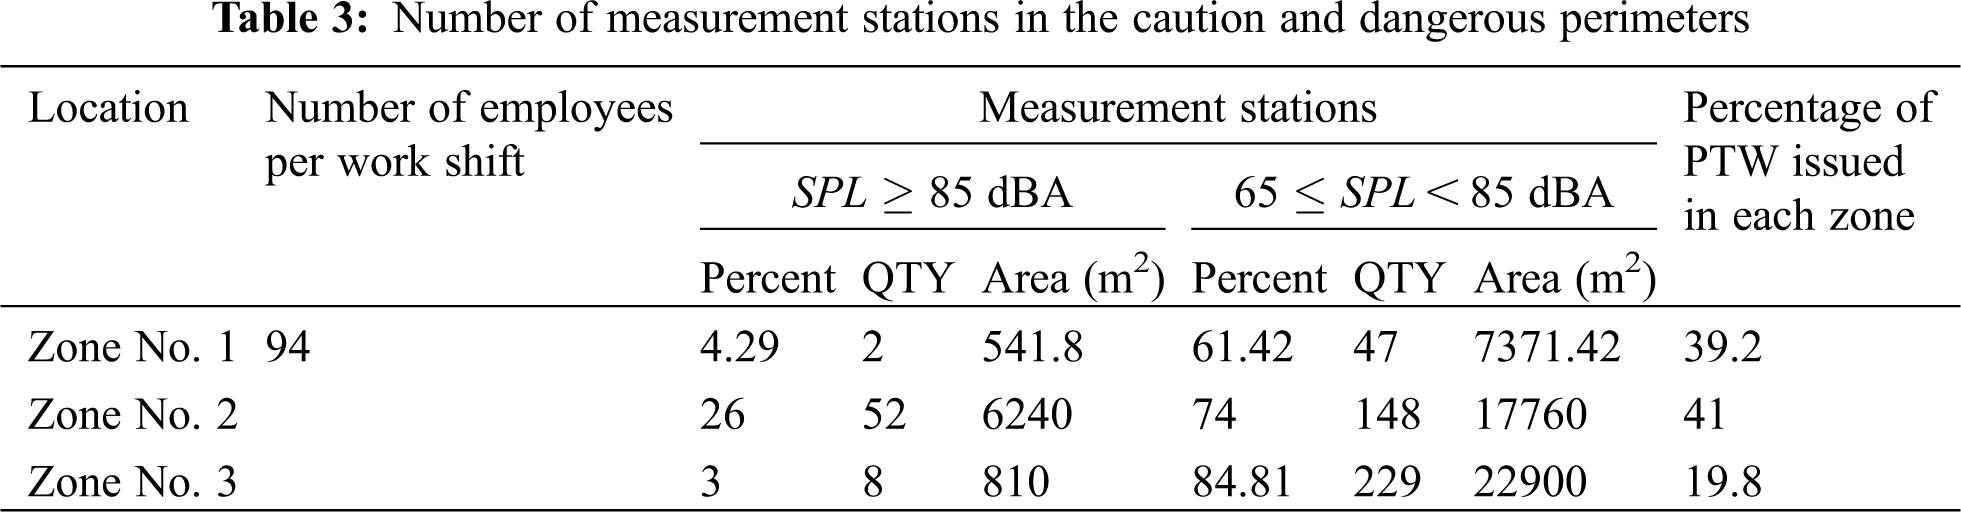
Among 3 zone under investigation in CPF, reviewing of 2,166 Permit to works of the past year and job description suggests that 32.9% of the work of shift personnel is performed in area 1 (Electrical Power Plant), 41% of their work in area 2 (Gas Processing Area) and 19.8 of the work in area 3 (Oil Treatment and Heating Medium Exchanger) (Tab. 3). Also, Tab. 5 indicates that from total of 94 personnel of safety, maintenance and operation disciplines, present in site location, 38.3% of personnel are located in zone 1%, 42% in Zone 2 and 19.7 in Zone 3.
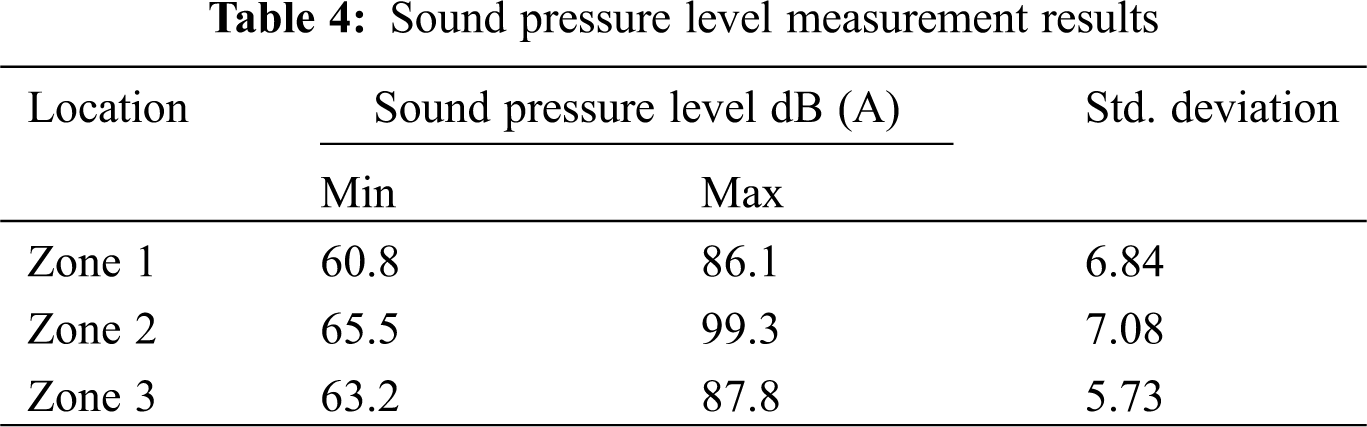
Environmental noise measurement results obtained from 539 stations were assessed for which 53 stations include locations such as office buildings, control rooms, storage tanks and other unmeasurable blind spots. Results of remaining 486 stations indicates that Zone 2 has maximum noise pressure level equal to 99.3 dB on the while area 1 has the minimum noise pressure level equal to 60.8 dB, it is seen that the difference between minimum and maximum of nosie pressure level in these zones is equal to 33.8 dB (according to Tab. 4).
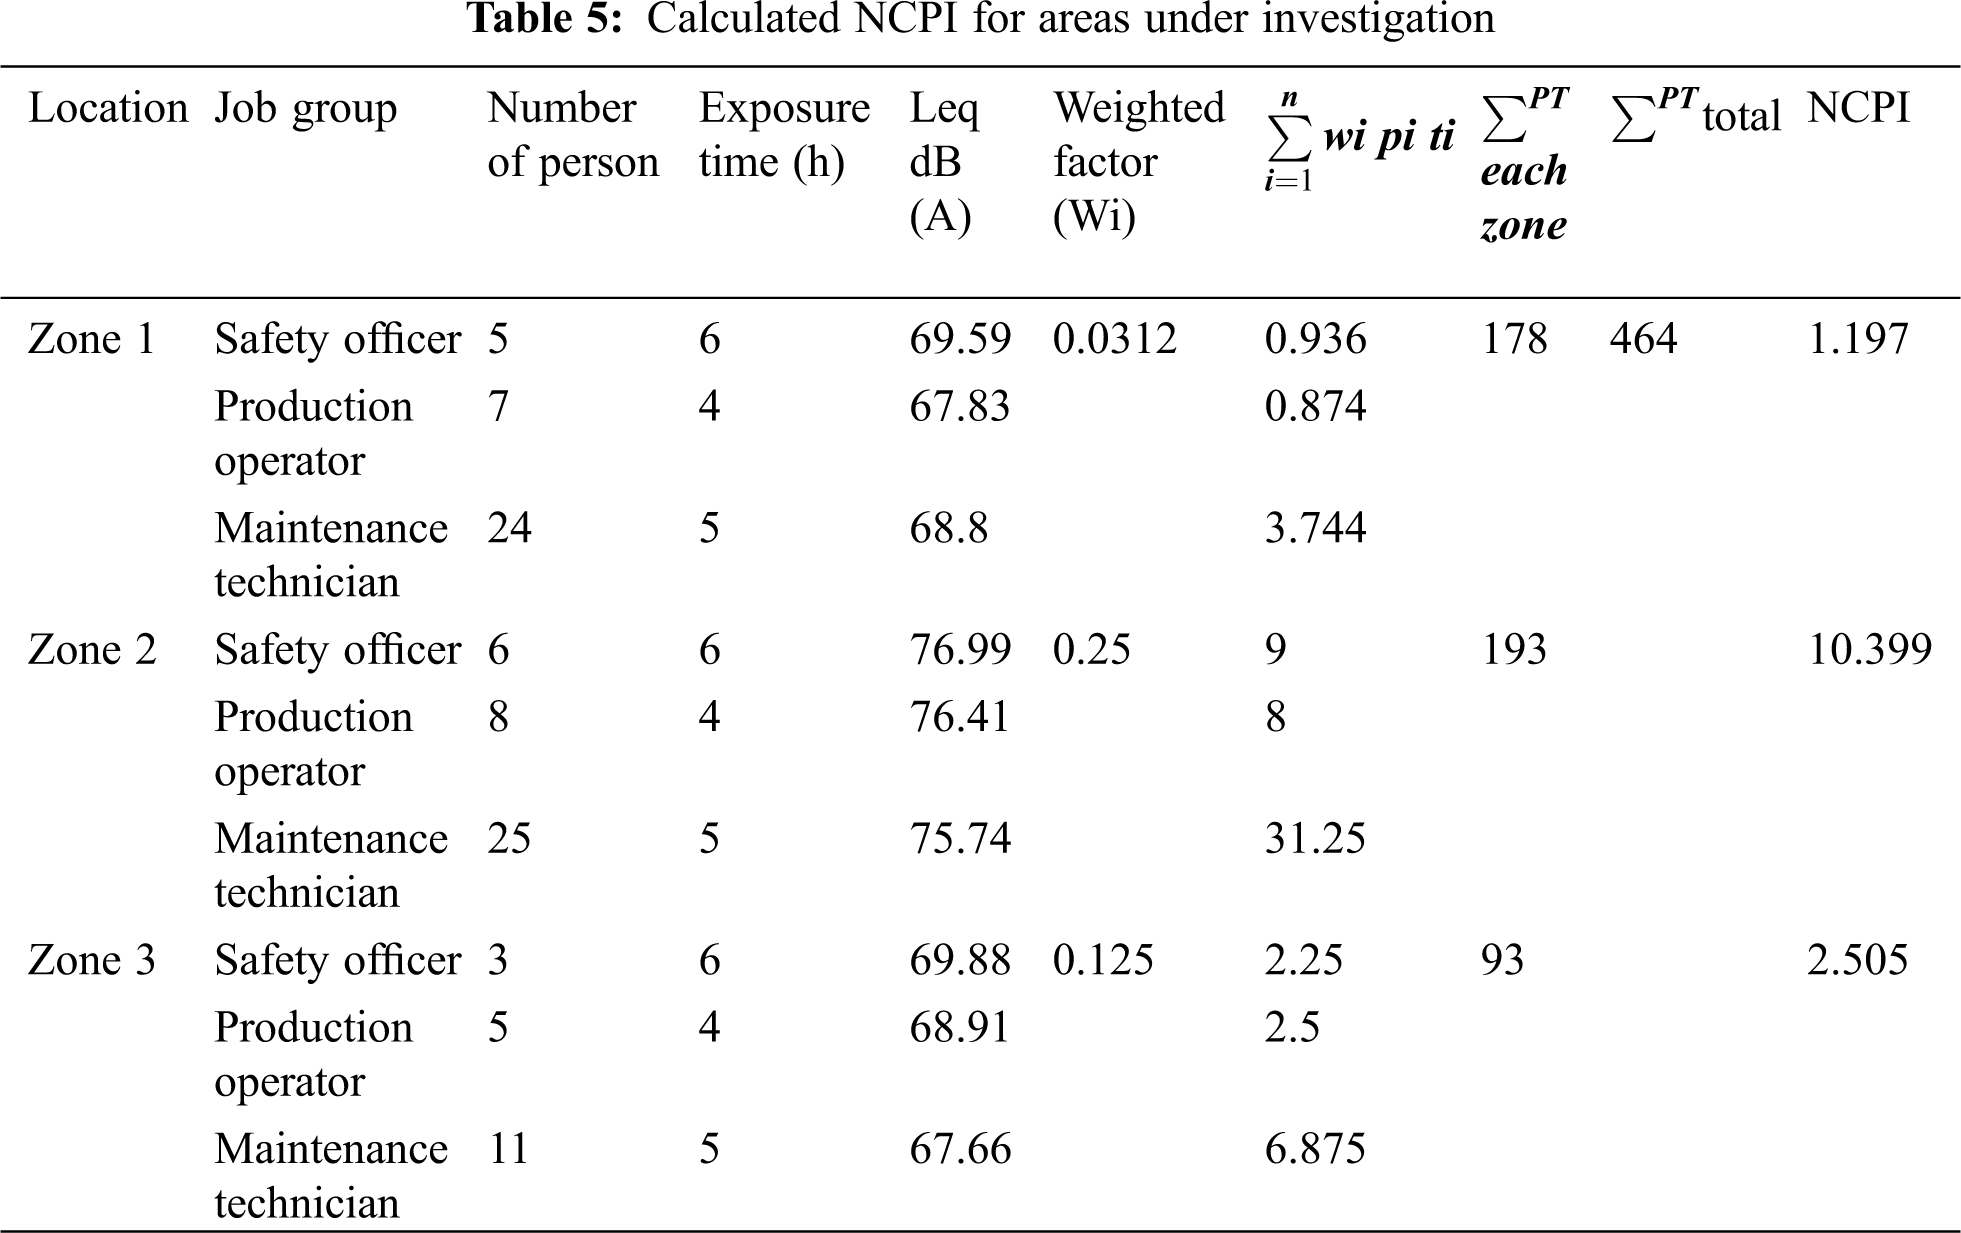
Based on the presented results in Tab. 3, Zone 3 possess the largest area while Zone 1 has the lowest in addition Zone 2, 1 and 3 with 26%, 4.29% and 3% of their area within dangerous perimeter, respectively. As shown in Tab. 5, maximum value of NCPI was obtained for Zone 2 equal to 10.399 while, minimum value of NCPI was calculated to be 1.197 for Zone 1.
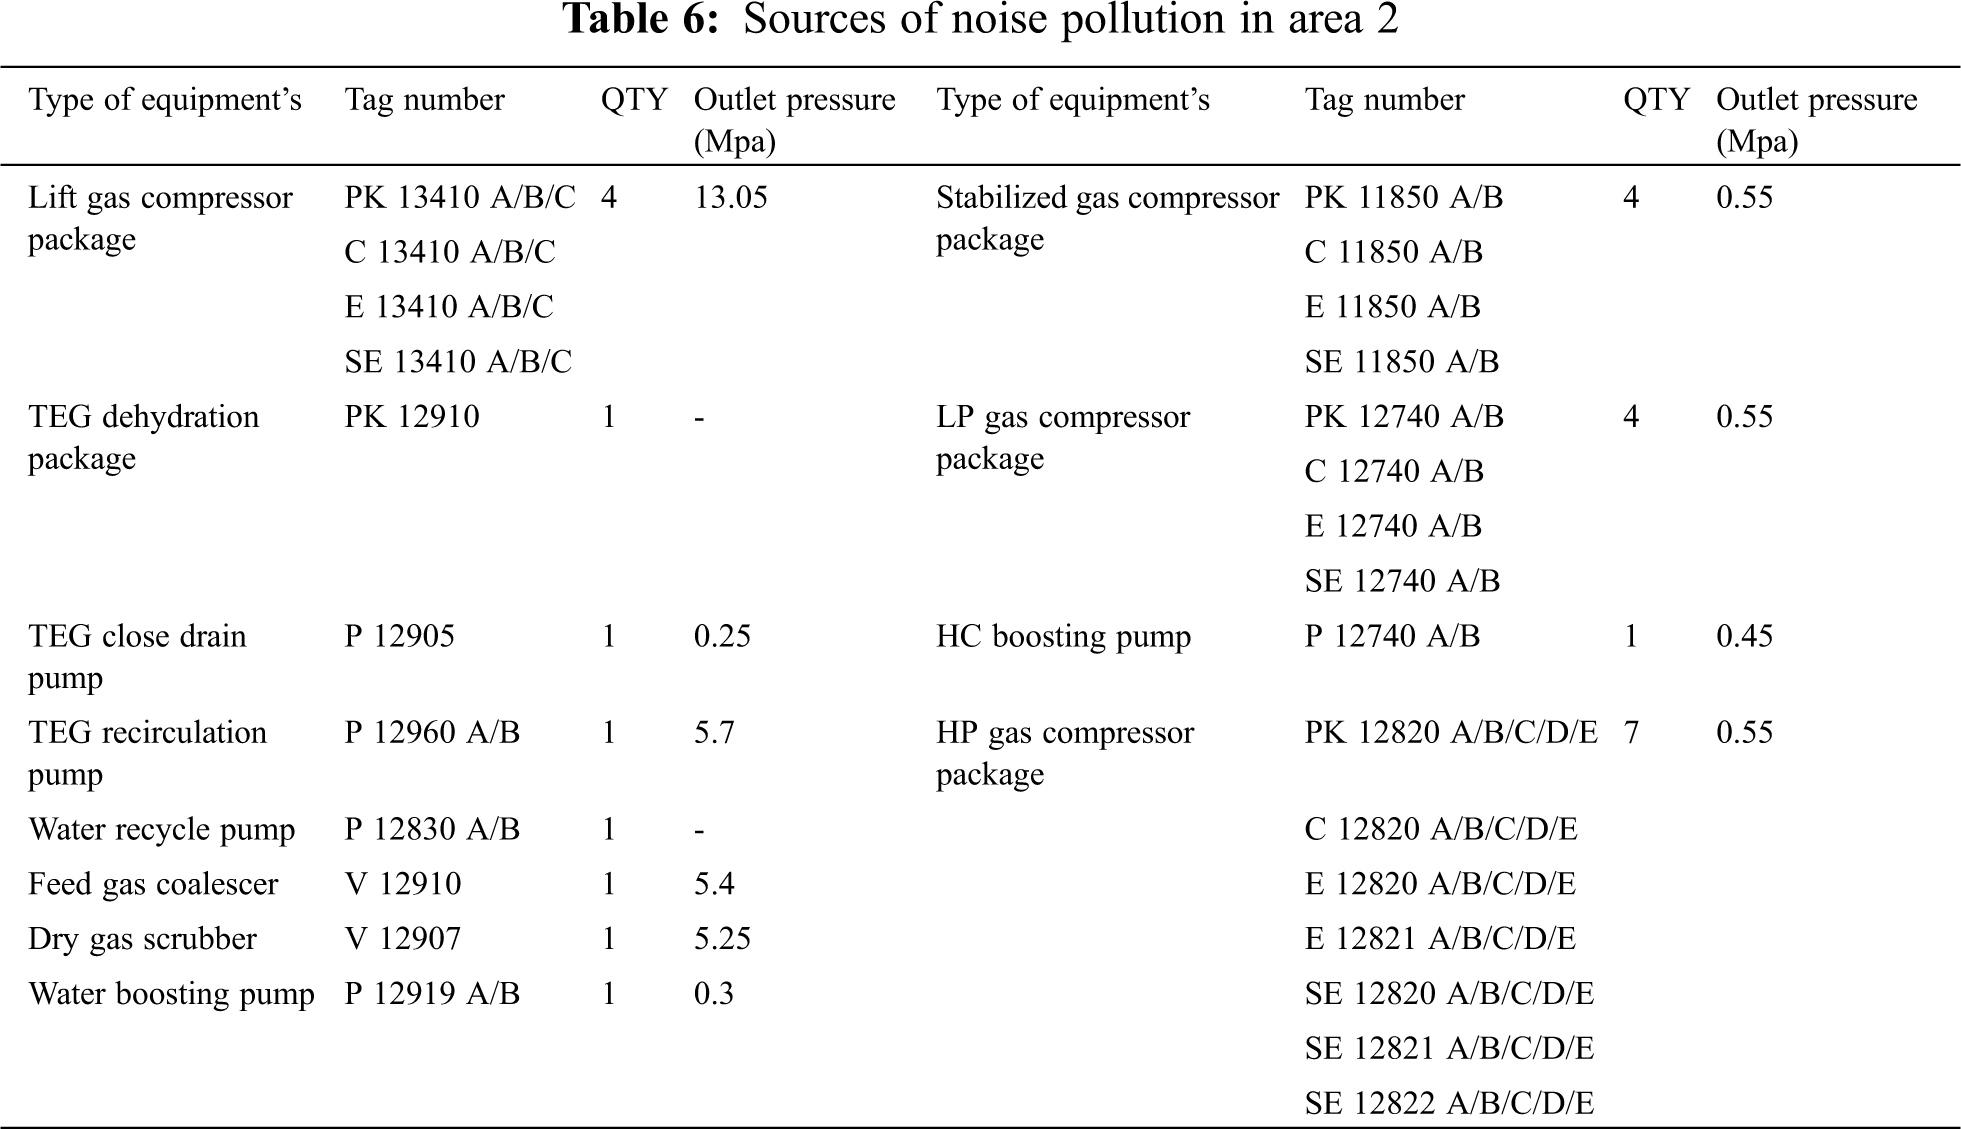
Further investigation on Zone 2 according to iso-sonic plot of this zone, indicates that fluid flow through the pipelines and HP Gas Compressors have noise pressure level above 85 dB respectively thus are considered in dangerous perimeter and this equipment’s are considered main noise pollution in Zone 2 (Tab. 6). In agreement with the results of Golmohammadi et al. [15] and Nasiri et al. [19], this investigation indicates that effective factors such as exposure time, noise pressure level and number of exposed personnel can be used to achieve a proper noise control prioritizing pattern.
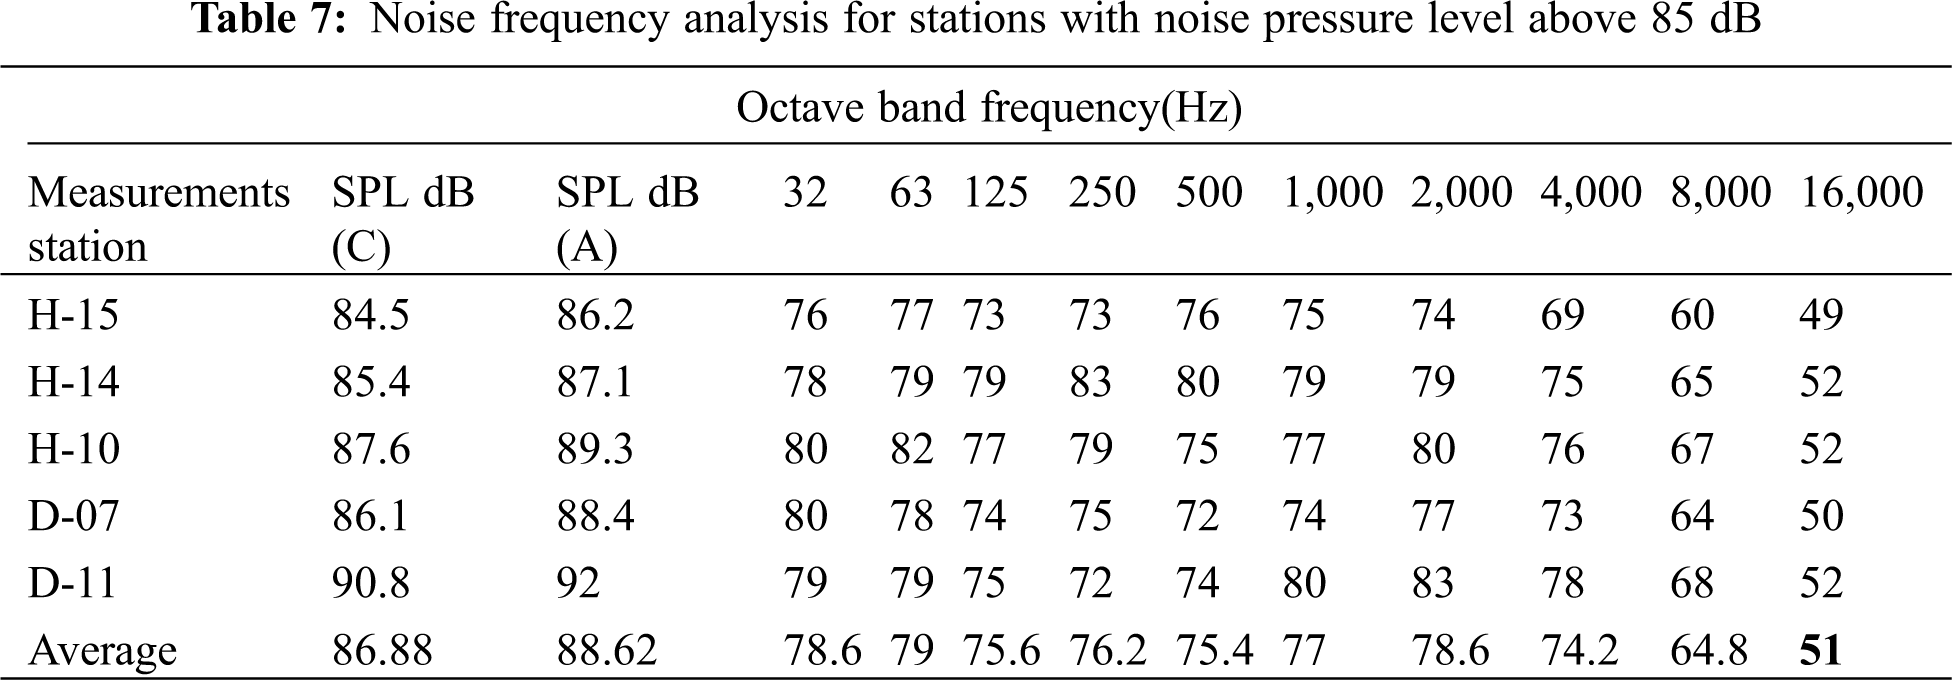
In order to further analyze the above-mentioned stations, noise frequency analysis in network C was conducted and results presented in Tab. 7 suggests that minimum noise pressure level is in frequency of 8,000 Hz, equal to 51 dB while maximum noise pressure level is in frequencies 32 and 2,000 Hz equal to 78.6 dB.
Tab. 5 shows that in zones under investigation, maximum equivalent noise level is related to safety work group for which in Zone 2 the equivalent noise level equals 76.99 dB. In Zone 3 this value is 67.76 and belongs to maintenance work group. Ultimately considering engineering remedial work having higher priority (removing and replacing, barricading and using sound barrier) than the rest of control measures [9,13,15]. Investigating the process and design documents of this system, contact area, flowing gas velocity and environment temperature, considerable heat transfers between gas and surrounding environment does not take place thus, temperature decrease along the path is due to gas expansion and therefore gas pressure drop (heat loss to environment has a negligible share of the temperature drop). The only constraint for the gas temperature is the TEG inlet gas temperature that in case of fluctuating by a few degrees, resulting from noise insulation installing, the unit inlet air cooler can easily adjust the temperature. It is concluded from the investigations and previous statements, addition of noise barriers does not interfere with the gas processing operation even with small changes in the heat transfer coefficient between piping and surrounding environment.
The main source of the noise in this zone is fluid (Gas) flow through the piping and HP Gas Compressors. Considering the mean noise pressure level of 80 dB to be caution limit for zones under investigation and working shifts are 12 h, in order to reduce the side effects of noise exposure, it is suggested to prioritizing engineering remedial works (removing and replacing, barricading and using sound barrier) in the noise source, in addition to implementing management control programs such as Hearing Conservation Program [9,13,15–18].
Based on the current situation and production process analysis results in Zone 2, insulating the piping with flexible noise insulation (such as Glass Wool or chemical based foams with incombustible coatings), that have effective noise absorption factor according to noise frequency analysis data (Tab. 7), can significantly control the noise pressure level in this zone. It is recommended that in studies, cost-benefits analysis methods be employed to further improve the investigation results and organization management decision-makings.
Acknowledgement: The authors with to thank all who contributed to the completion of this research paper including management, head of HSE and the personnel of the company used in this research.
Funding Statement: The authors received no specific funding for this study.
Conflicts of Interest: The authors declare that they have no conflicts of interest to report regarding the present study.
1. Dehghan, S. F., Nassiri, P., Monazzam, M. R., Aghaei, H. A., Moradirad, R. et al. (2012). Study on the noise assessment and control at a petrochemical company. Noise & Vibration Worldwide, 44(1), 10–18. DOI 10.1260/0957-4565.44.1.10. [Google Scholar] [CrossRef]
2. Kaliakatsos, D., Mirabelli, G., Pizzuti, T. (2015). Noise risk assessment in the workplace: The case of a waste selection plant. Noise & Vibration Worldwide, 46(5), 8–17. DOI 10.1260/0957-4565.46.5.8. [Google Scholar] [CrossRef]
3. Sravani, P. A. P. M., Sowmya, M. A. K. P., Manasa, P. N. S. G. (2016). Noise pollution and Its impact on human health and social behavior using systems approach-A case study in Kurnool City. Order. 2016, 8(7), 70–80. [Google Scholar]
4. Monazzam Esmaielpour, M. R., Laal., F., Majlessi, F., Fallah Madvari, R., Rahimi Foroushani, A. et al. (2017). Investigating the effect of increasing duration time of using the protective device on hearing loss among tile industry workers: Application of the BASNEF education model. Health and Safety at Work, 7(4), 319–328. [Google Scholar]
5. Tak, S., Davis, R. R., Calvert, G. M. (2009). Exposure to hazardous workplace noise and use of hearing protection devices among US workers—NHANES, (1999–2004). American Journal of Industrial Medicine, 52(5), 358–371. DOI 10.1002/ajim.20690. [Google Scholar] [CrossRef]
6. Gomes, J., Lloyd, O., Norman, N. (2002). The health of the workers in a rapidly developing country: Effects of occupational exposure to noise and heat. Occupational Medicine, 52(3), 121–128. DOI 10.1093/occmed/52.3.121. [Google Scholar] [CrossRef]
7. Koopaei, A. (2004). Principle of industrial hygiene, 1st ed. Tehran, Iran: Ahvaz University Medical of Science. [Google Scholar]
8. Karimi, A., Nasiri, S., Kazerooni, F. K., Oliaei, M.(2010). Noise induced hearing loss risk assessment in truck drivers. Noise and Health, 12(46), 49. DOI 10.4103/1463-1741.59999. [Google Scholar] [CrossRef]
9. Münzel, T., Schmidt, F. P., Steven, S., Herzog, J., Daiber, A., Sørensen, M. (2018). Environmental noise and the cardiovascular system. Journal of the American College of Cardiology, 71(6), 688–697. DOI 10.1016/j.jacc.2017.12.015. [Google Scholar] [CrossRef]
10. Forouharmajd, F., Nassiri, P., Monazzam, M. R. (2012). Noise pollution of air compressor and its noise reduction procedures by using an enclosure. International Journal of Environmental Health Engineering, 1(1), 20. DOI 10.4103/2277-9183.96143. [Google Scholar] [CrossRef]
11. Zare, M., Nasiri, P., Shahtaheri, S., Golbabaei, F., Aghamolaei, T. (2007). Noise pollution and hearing loss in one of the oil industries. Hormozgan Medical Journal, 11(2), 121–126. [Google Scholar]
12. Valentin, O., John, S. M., Laville, F. (2017). Using auditory steady-state responses for measuring hearing protector attenuation. Noise & Health, 19(86), 1–9. DOI 10.4103/1463-1741.199238. [Google Scholar] [CrossRef]
13. Eghtesadi, H. (2011). Noise in workplace training package, 1st ed. Tehran, Iran: TUMS, Institute of Environmental Science. [Google Scholar]
14. Ghanbari, M., Yartire, H., Ashtarian, H., Salimi, K., Pourman, D. et al. (2015). A study of sound pressure level, frequency analysis and sound spectrum levels calculation in crepnaz factories of kermanshah city(2014). Journal of Clinical Research in Paramedical Science, 3(4), 294–302. [Google Scholar]
15. Golmohammadi, R., Moazaz, F., Aliabadi, M. (2017). The noise control prioritizing index in a tire manufacturing company. Journal of Occupational Hygiene Engineering, 4(3), 41–48. DOI 10.21859/johe.4.3.41. [Google Scholar] [CrossRef]
16. Awad, I. (2009). The global economic crisis and migrant workers: Impact and response. Geneva, Switzerland: International Labour Organization. [Google Scholar]
17. Hansen, C. H. (2005). Current and future industrial applications of active noise control. Noise Control Engineering Journal, 53(5), 181–196. DOI 10.3397/1.2839255. [Google Scholar] [CrossRef]
18. Rout, B., Sikdar, B. (2017). Hazard identification, risk assessment, and control measures as an effective tool of occupational health assessment of hazardous process in an iron ore pelletizing industry. Indian Journal of Occupational and Environmental Medicine, 21(2), 56. DOI 10.4103/ijoem.IJOEM_19_16. [Google Scholar] [CrossRef]
19. Nassiri, P., Dehghan, S. F., Monazzam, M. R. (2013). A prioritization approach for noise risk management in a petrochemical complex. Journal of Occupational Health, 55(3), 204–210. DOI 10.1539/joh.12-0237-OA. [Google Scholar] [CrossRef]
20. Hassanvand, D., Zare, S., Ghotbi-Ravandi, M. R.(2019). Noise assessment and sound map projection using surfer and noise at work tools in a tire manufacturing complex in Iran, 2018. Journal of Occupational Health and Epidemiology, 8(2), 109–117. DOI 10.29252/johe.8.2.109. [Google Scholar] [CrossRef]
21. Farhang Dehghan, S., Monazzam, M., Nassiri, P., Haghighi Kafash, Z., Jahangiri, M. (2013). The assessment of noise exposure and noise annoyance at a petrochemical company. Health and Safety at Work, 3(3), 11–24. [Google Scholar]
22. Rostam, G. (2016). OEL-NV-95 assessment guideline for noise and vibration, 1st ed. Tehran, Iran: Daneshgo, Ministry of Health and Medical Education. [Google Scholar]
 | This work is licensed under a Creative Commons Attribution 4.0 International License, which permits unrestricted use, distribution, and reproduction in any medium, provided the original work is properly cited. |