| Sound & Vibration |
DOI: 10.32604/sv.2021.017000
ARTICLE
Vibration Control of Vertical Turbine Pump by Optimization of Vane Pitch Tolerances of an Impeller Using Statistical Techniques
1Kirloskar Brothers Limited, Corporate R&D, Pune, 411045, India
2Department of Mechanical Engineering, MES College of Engineering, Pune, 411001, India
*Corresponding Author: Ravindra Birajdar. Email: ravindra.birajdar@kbl.co.in
Received: 18 April 2021; Accepted: 23 July 2021
Abstract: The objective of the study is to find the tolerance on vane pitch dimensions of a Vertical Turbine (VT) pump impeller. For this purpose, the study is divided into two parts viz. to find the critical hydraulic eccentricity of a VT pump impeller by way of numerical simulations and design of experiments to find the vane pitch tolerance using critical hydraulic eccentricity. The effect of impeller vane pitch deviations on hydraulic unbalance is examined for a vertical turbine pump using Design of Experiments (DOE). A suitable orthogonal matrix has been selected with vane pitch at different axial locations of an impeller as the control factors. Hydraulic eccentricity, which is the output of the DOE experiments is analyzed using S/N ratio, ANOM and regression analysis to find the significant control factor effecting the hydraulic unbalance and hence vibrations. The vane pitch deviation at outlet and inlet of impeller shroud geometry are found to be the most critical factor affecting the pump vibrations.
Keywords: Vertical turbine pump; vibrations; design of experiments; hydraulic eccentricity
Optimization of certain parameters in industrial applications involves huge cost and time. For this purpose, design of experiments using orthogonal matrix method reduces the time and cost. The improvement of an impeller performance is always challenging due to involvement of various design, manufacturing factors and operating conditions. Douglas [1] and Taguchi et al. [2] described that tolerance prediction for a product becomes easier with use of Design of Experiments (DOE) methods. The procedure for adopting design tolerance with balance between quality and cost are prescribed in JIS Z-8403 as a part of standard. Three quality characteristics are defined in standard to determine the tolerance. These are Nominal the better characteristics, Smaller the better characteristics and Larger the better characteristics. One of these quality characteristics is selected based on target objective of characteristics to be optimized. ISO [3,4] is used as an experimental method to estimate the vibration displacement limits of certain stator and rotor components.
The special property of orthogonal matrices is the appearance of combination of variables between two pair of columns. It appears equal number of times. The effects of the other variables can be interrelated with a relative value compared to the levels of a variable [5]. This is used in the current research paper.
The reasons for vibrations in a pump unit ranges over a broad range of causes which includes the pump type (radial, mixed flow or axial), operating points at site, system resistance of pumping system, type of fluid, design of impeller and flow intake conditions. The other important phenomenon which can cause vibrations is suction cavitation. All these factors are to be considered as the possible causes of the severe vibrations which may further lead to shaft failure and hence the operational loss to customer [6]. Apart from the individual components the coupled impact also affects the vibrations. A theoretical study has been conducted independently for an impeller under two-dimensional conditions. It concluded that the flow non-uniformity created by a rotating impeller affects the volute casing performance also [7].
The impeller unbalance has been divided into two types viz. Mechanical or structural unbalance and Hydraulic unbalance. Mechanical unbalance is purely related to the manufacturing deviation due to mass distribution of rotating component. It is defined as the deviation between mass centerline of an impeller and the shaft axis. Hydraulic unbalance is defined as flow unevenness between impeller vanes passages which is due to variation in vane pitch dimensions. The non-uniform vane pitch in impeller which arises during manufacturing stage results into the hydraulic unbalance. This unbalance force rotates with rotor speed and it increases as the rotating speed increases. Apart from the speed of the impeller the flow rate also increases the unbalance forces [8].
The objective of a pump designer is to improve the performance of pump in operating region along with the reliability [9]. Finding the cause of vibration for any pumping system at site is not a single step method. It is a step wise method to troubleshoot the vibration problem at site by cause wise elimination. The study of pumping system is recommended to find the cause and provide the solution. From manufacturing point of view, any deviation in the impeller design results in enhancing the sub synchronous vibrations which further lead to shaft failure in vertical turbine type pumps [10].
Impellers are designed and developed with combination of numerical simulations and design of experiments. It helps in developing new products with reliable quality. de Souza et al. [11] conducted a study and demonstrated, how Computational Fluid Dynamics (CFD) and DOE can be effectively used for turbomachinery applications in new product development. They provided the description of procedure, outline of steps required for a successful CFD and DOE study for single blade impeller design. Wang et al. [12] presented guidelines based on extensive research to establish the relationship between part geometry, quality during manufacturing process, tooling material, fabrication method and production tolerances.
In quality engineering, the generally used orthogonal arrays are L12, L18 and L36. Sung et al. [13] investigated the effect of meridional geometry using Response Surface Method (RSM) with commercial CFD software on characteristics of the impeller in centrifugal pump. Here L12 is used for two-level factors, L18 for three-level factors and L36 for simulation. The impact of design parameters in vane shape development plays important role on the performance of impeller. These parameters are focused on the vane-angle distributions through the impeller in a fixed meridional geometry. 2nd factorial design has been used to identify the important design parameters. It is found that the incidence angles and the exit blade angle are the most significant parameters contributing to the performance of the pump.
The improvement of an impeller performance is always challenging due to involvement of multiple design factors and operating conditions. Ling et al. [14] conducted optimization study using orthogonal matrix for a pump geometry using design parameters. Numerical simulation study conducted for the combinations mentioned in the matrix and pump performance is noted. In line with the optimized matrix results, pump is manufactured and tested in a test rig to obtain the test data. The comparison of numerical results with test data are in very good agreement. This gives confidence on the DOE for using Orthogonal matrix method. During this optimization study total five impeller geometrical configurations are selected, and the best method has been selected using variance analysis method. It is also found that the optimization process needs to be done for the combined impeller and volute geometry for better results.
Abhijeet et al. [15] discussed the application of quality control tools for improving the quality of the casting by reducing the rejection rate. It is stated that casting rejection is major problem in the industries. Hence, it indicates there is scope for improvement of casting quality, especially to maintain the desired dimensions to avoid possible unbalance in the castings.
The blade parameters which can impact the vibrations are blade exit angle, wrap angle. Han et al. [16] conducted numerical experiments along with the experiments to check the impact of the blade wrap and exit angles for optimum design of centrifugal pump.
Si et al. [17] conducted experimental investigations, overall performance comparisons between two different centrifugal pump designs presented under two-phase flow conditions for different inlet void fractions and rotational speeds. Sensitivity analysis is carried to understand gas and liquid mixture. Engineering standard on casting inspection [18], specifies the general guidelines and tolerances on dimensions of castings without specific reference to the performance of the pumps. Hydraulic Institute Standard (HIS) [19] specifies guidelines related to pump vibrations and limits for the vibration. It also states the guidelines for location of probes for measurement of vibration readings in a centrifugal pump.
Dynamic balancing of a rotating system can be used to limit the mechanical unbalance which is a direct method [20]. However, there is no direct method to correct hydraulic unbalance in the impeller of centrifugal pump.
Previous work: The literature clearly indicated that the hydraulic unbalance of an impeller is one of the parameters which defines the quality of a rotating part. Therefore, a method to find the limiting value of hydraulic eccentricity of a rotating part is necessary in pump industries. Birajdar et al. [21] conducted the research work to find the impact of hydraulic unbalance on pump vibrations using multi-physics numerical approach which is “one-way FSI method”. The numerical simulations were conducted on two impellers in which one is as per design and the other is with the hydraulic unbalance. The flow induced forces in terms of pressure and the hydraulic unbalance are the inputs to find the resulting vibrational displacements. The numerical predictions are compared with the experimental test data of vibration displacements on motor top location. It is observed that the impeller with hydraulic unbalance shows increase in motor vibrations in lateral directions, which is purely due to hydraulic unbalance. The rotating parts like shaft, suction bearing, and impeller are found to be mostly affected due to hydraulic unbalance resulting in high vibration displacements. The predicted vibrational displacements from numerical approach are found in line with test data. Hence, it is concluded that the one-way FSI method is suitable for predicting the hydraulic unbalance impact in terms of vibration displacements.
Based on the literature study, the information is not available to control and define the tolerance on hydraulic dimensions like vane pitch of impellers. It is essential to define the appropriate tolerances on vane pitch considering the manufacturing process and its feasibility so that vibrations are controlled for reliable mechanical performance of vertical turbine pumps. Under this premise, current study attempts to investigate the effect of vane pitch deviations on hydraulic eccentricity and in turn on vibration.
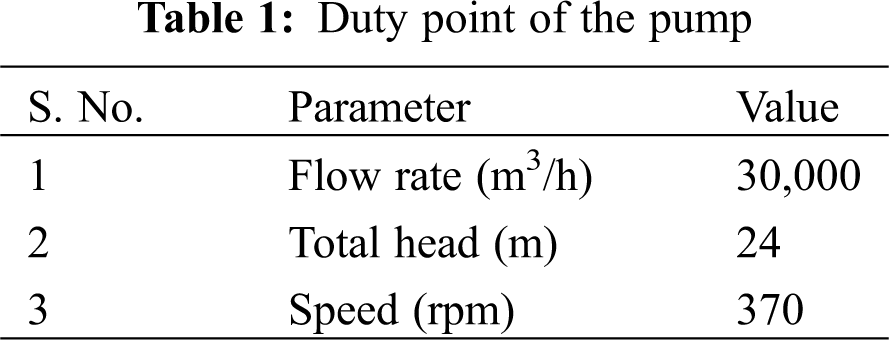
The objective of the study is to find the tolerance on vane pitch dimensions of a Vertical Turbine (VT) pump impeller. The duty point of the VT pump considered for numerical simulations is given in Tab. 1.
To find the vane pitch tolerance of present VT pump impeller, the present study is divided in two part:
Part 1: Numerical simulations to find the critical hydraulic eccentricity of a VT pump impeller.
Part 2: Design of experiments (DOE) to find the vane pitch tolerance to control the critical hydraulic
eccentricity.
In the following sections both the parts are discussed in detail.
Part 1: Numerical simulations to find the critical hydraulic eccentricity of a VT impeller
The prediction of hydraulic eccentricity impact on VT pump vibrations is involved in multi-physics problem which is “Fluid Structure Interaction (FSI)”. The available two numerical methods of FSI are (1) One-way FSI (2) Two-way FSI. For the present research, one-way FSI methodology is selected due to the following major reasons,
1. One-way FSI is relatively less time consuming in terms of solver time compared to two way FSI. Though two-way FSI is more accurate in predicting the flow induced deformations, it involves more solver time due to information transfer between CFD and FE solver for each iteration. Since, the number of numerical experiments involved in this research are enormous, the time optimization is the prime factor.
2. The method is also consistent in predicting the vibration displacements with good accuracy. The solver is validated prior conducting the numerous experiments [21].
The process included the validation of the solver first and then conducting the numerical simulations with hydraulic eccentricity as a variable in the analysis.
Solver validation: Birajdar et al. [21] conducted validation experiments of one-way FSI numerical simulations to assess the reliability of the Ansys–Workbench solver for deformation predictions and process settings. The output parameters are vibration displacements in X, Y&Z directions on motor (top) for which the experimental test data is available. The impact of hydraulic load and hydraulic eccentricity are included in the process. The key part of the FSI simulations is the mapping process. Hence, the error in the mapping is checked first for an optimized mesh. It is found within 5%. The output of the simulations is compared with the test data and found that the vibration displacements are close to test data predictions with maximum deviation in the results is within 10%. For a set of assumptions and appropriate boundary conditions, it is proved that the one-way FSI is a good option to predict the flow induced vibrations for a VT pump. Hence, the one-way FSI methodology is adopted for further simulations in which the hydraulic eccentricity is the primary input variable.
Critical hydraulic eccentricity: After validation of the solver for further iterations successfully, the next step follows the prediction of critical hydraulic eccentricity. It is defined as the deviation of center of mass of the impeller hydraulic mass at which the vibration deformations on motor component will be exceeding the limit of 100 μm magnitude. The magnitude of maximum vibration limit is specified as per HI standards for safe operation of VT pumps. The iterations are conducted on the geometry by inducing the hydraulic eccentricity variation numerically. The hydraulic eccentricity values used are 0 (design), 0.2, 0.3, 0.4, 0.5 and 0.688 mm to predict the critical hydraulic eccentricity to limit the vibration to 100 μm.
Part 2: Design of experiments to find the vane pitch tolerance to control the hydraulic eccentricity
Numerical analysis is successfully carried out and predicted the critical hydraulic eccentricity for the present VT impeller. But, in industries it is very difficult to predict the hydraulic eccentricity of a manufactured impeller directly. It needs a process of 3D scanning following up with 3D model preparation to find the hydraulic eccentricity. All these steps are involved with cost and time resources. Hence, a simple procedure is required, which relates the hydraulic eccentricity with vane pitch values of a manufactured impeller. For this purpose, a well-known statistical method, DOE is much applicable to decide the acceptable deviation of vane pitch dimensions at different locations on impeller periphery.
There are two aspects of any experimental problem, the design of experiments and the statistical analysis of the data. When many factors control the performance of a system, then it is essential to find out significant factors which need special attention either to control or to optimize the system performance. For this purpose, the use of statistical methods is applied, which has many applications to find industrial solutions. DOE is a statistical technique which has wide applications to study the effect of multiple parameters (factors or variables) simultaneously. It is highly preferred technique wherever and whenever it is suspected that the output performance is controlled by more than one parameter. Although DOE has the most applications in industries using experiments, it is equally preferred in applying for numerical simulations.
Taguchi Orthogonal method of design of experiments is planned to minimize the variation in impeller vane pitch dimensions. Generally, orthogonal method uses the original results of the prototype testing. However, considering the manufacturing process and number of experiments, it needs high accuracy and longer period, the error is also inevitable in the prototype test. Hence, for each run impeller, impeller geometry is created for experimentation with desired deviation and validated by regression method to predict the effect on response factor as eccentricity. By this approach error will be lower. Moreover, it saves the manufacturing time and cost.
The most fundamental step prior to commencement of the DOE study is the identification of the control factors to be varied. The primary objective of the research work is to determine the impact of vane pitch dimensions on hydraulic eccentricity and vibration. These control factors should be selected in such a way that the required objective is served with minimum number of experiments or attempts.
The impeller considered for DoE study consists of four vanes and the profile of the vane is mixed flow with semi-open type impeller. The four vanes of the impeller result in four hydraulic parts of the impeller. Hydraulic eccentricity is a function of the geometric variation of the hydraulic profile and hence the vane pitch. The control factors are vane pitch variation at the shroud side for the inlet portion, mid portion, and outlet portion along with the vane thickness. Considering the geometry of impeller, L27 matrix (thirteen-three level factors) is selected with thirteen control factors and three levels. The Fig. 1 shows the actual impeller with details about control factors selected.
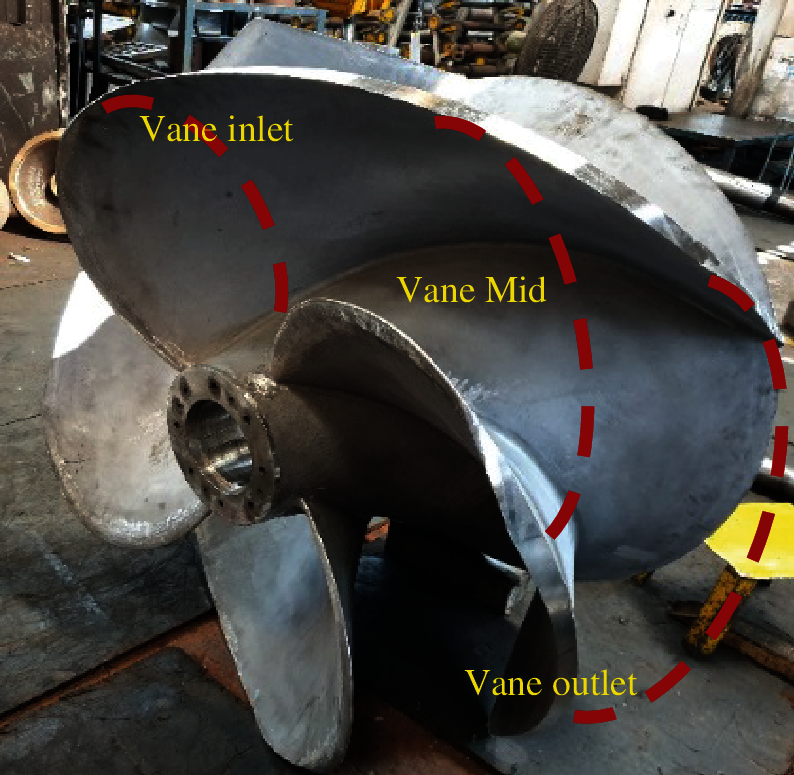
Figure 1: Impeller control factors
For each experiment, three quality attributes are measured. The results of the experiments are analyzed to obtain the following objects:
a) To predict the optimum conditions by means of Signal to Noise (S/N) Ratio analysis.
b) To predict the contribution of individual parameters using ANOVA to prioritize the most important parameters.
c) Regression analysis.
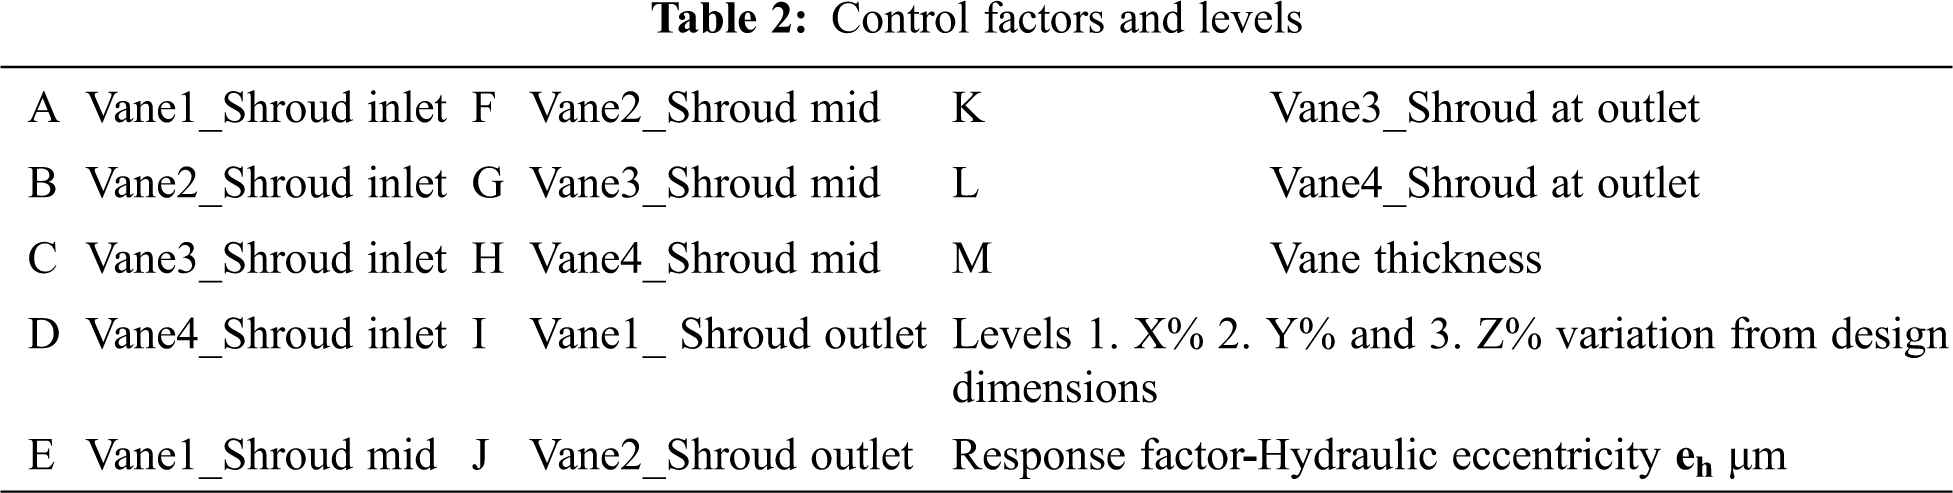
The thirteen control factors and levels are mentioned in Tab. 2. Based on the selected control factors and levels, Hydraulic eccentricity is evaluated for each model, by geometrically constructing the impeller for the impeller vane pitch variations.
The results of are discussed in two parts in line with the objective of the work as below.
3.1 Part 1: Numerical Simulations to Find the Critical Hydraulic Eccentricity of a VT Impeller
The numerical simulation approach adopted in this work is a multi-physics continuum solver approach. The reliability of numerical simulation output depends on the variation of solver output with respect to mesh quantity. Hence, mesh independence study is also carried out on both solvers (CFD and FE-Structure) independently. Ansys-CFX has been used for CFD purpose and Ansys-Work bench is used for FE analysis purpose. Following sub sections describes the mesh independence study of each solver in detail.
(a) Mesh independence study (CFD)
The unstructured mesh is created using triangular elements for 2D surfaces and tetrahedron elements for 3D flow domain using Ansys ICEM CFD. The hydraulic geometry of pump is divided into four domains: bell mouth, impeller, bowl and column pipe. 3 layers of prism layers are generated near impeller blade wall surfaces to resolve the boundary layer near rotating wall. The mesh is independently created in fluid domains like impeller, bowl geometry, discharge column pipes and assembled for analysis purpose. Denser mesh is created near impeller vanes and bowl vanes regions. In order to restrict the influence of grid number on the numerical results, a mesh independence study has been conducted with four different sets of mesh. The value of the relative deviation of total head for each mesh with its subsequent mesh for 4 points are shown in Tab. 3. Mesh 3 is with 1.7% deviation and Mesh 4 is 0.5% deviation with respect to Mesh 3. It means that Mesh 3 and Mesh 4 are producing same consistent results. So, it is decided to consider the Mesh 3 as optimized mesh with total node quantity of 0.97 million. Fig. 2 shows the plot of total bowl head with respect to mesh numbers.
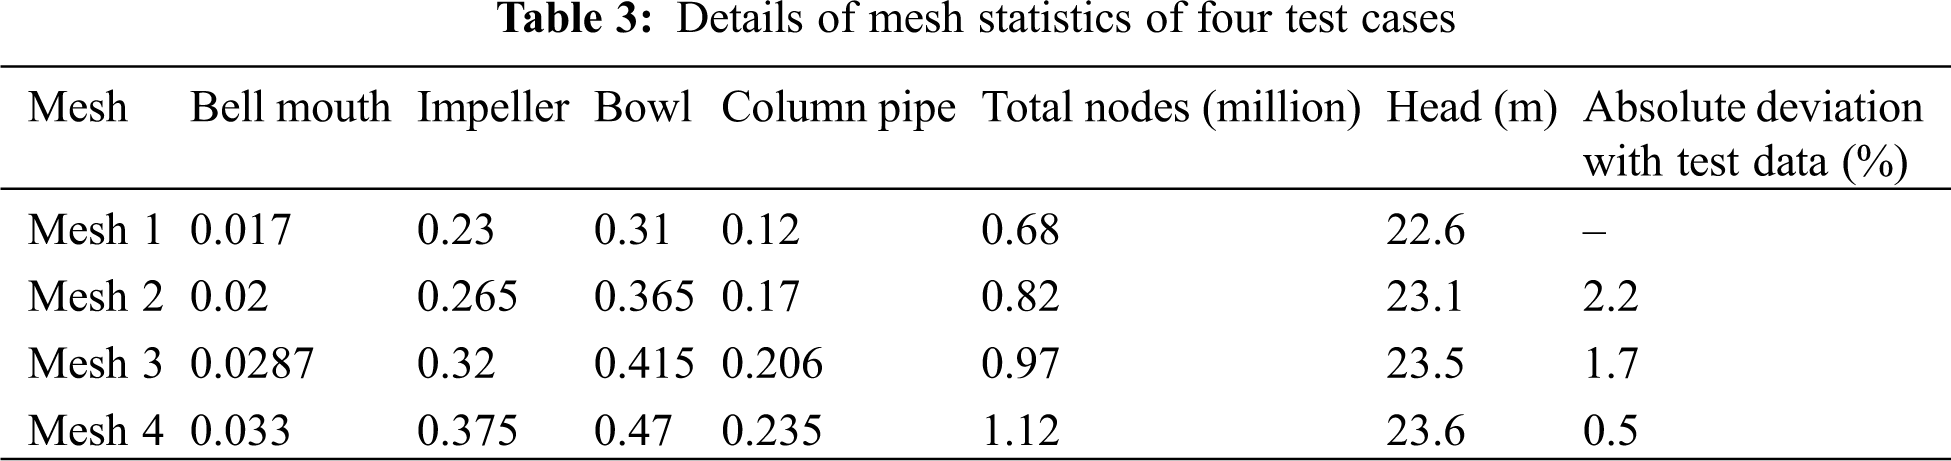
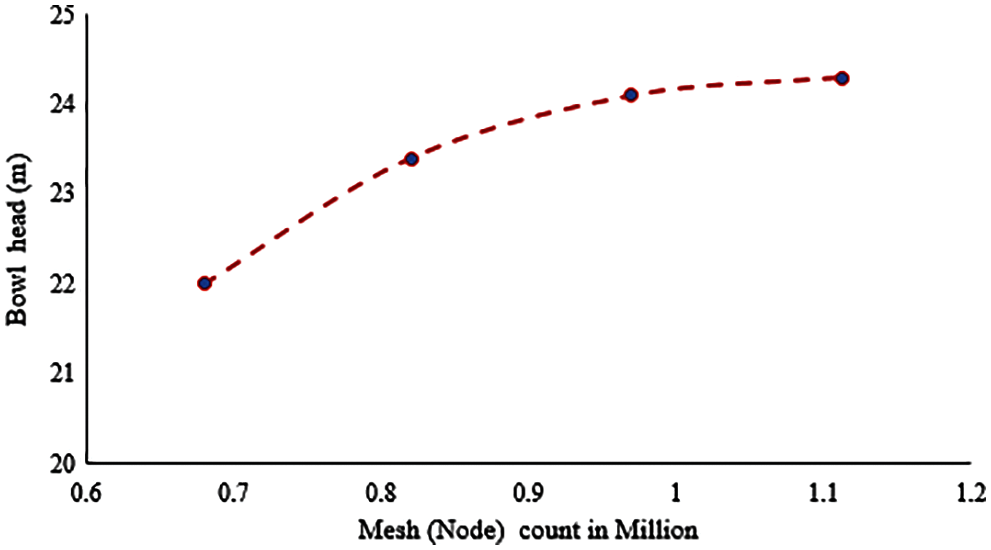
Figure 2: Mesh independent study (CFD) of the pump
(b) Mesh independence study (FE-Structure)
The FE mesh is used to subdivide the CAD model into smaller areas called elements, based on which a set of equations are solved. These equations approximately present the governing equation of interest with a set of functions which are polynomial defined over each element. As the mesh is refined by making them smaller and smaller, the computed solution will converge to the true solution. However, computation or simulation time increases as the mesh elements decrease in size. Therefore, an optimum mesh is required to validate any FE simulation through mesh independence.
In this analysis, the mesh independence study is carried out on FE solver using three different mesh sizes to estimate the variation in results such as displacements, stresses, etc. Firstly, a coarse mesh was taken for analysis and subsequent finer meshes are taken with same loading and boundary conditions.
The results from mesh independence study are plotted between ‘Total number of elements’ in model (abscissa) vs. ‘maximum displacements’ (ordinate) for all three directions. As seen from the Fig. 3, the variation between Mesh 2 and Mesh 3 results is within ±1%. It is observed that the number of elements in Mesh 3 is almost 1.5 times (involves higher computation time) as compared to second mesh, but the change in deformation value is less than 1%. Hence, the Mesh 2 with 775858 elements is optimum and used for further analysis. Fig. 4 shows the 3D model and the corresponding finalized mesh.
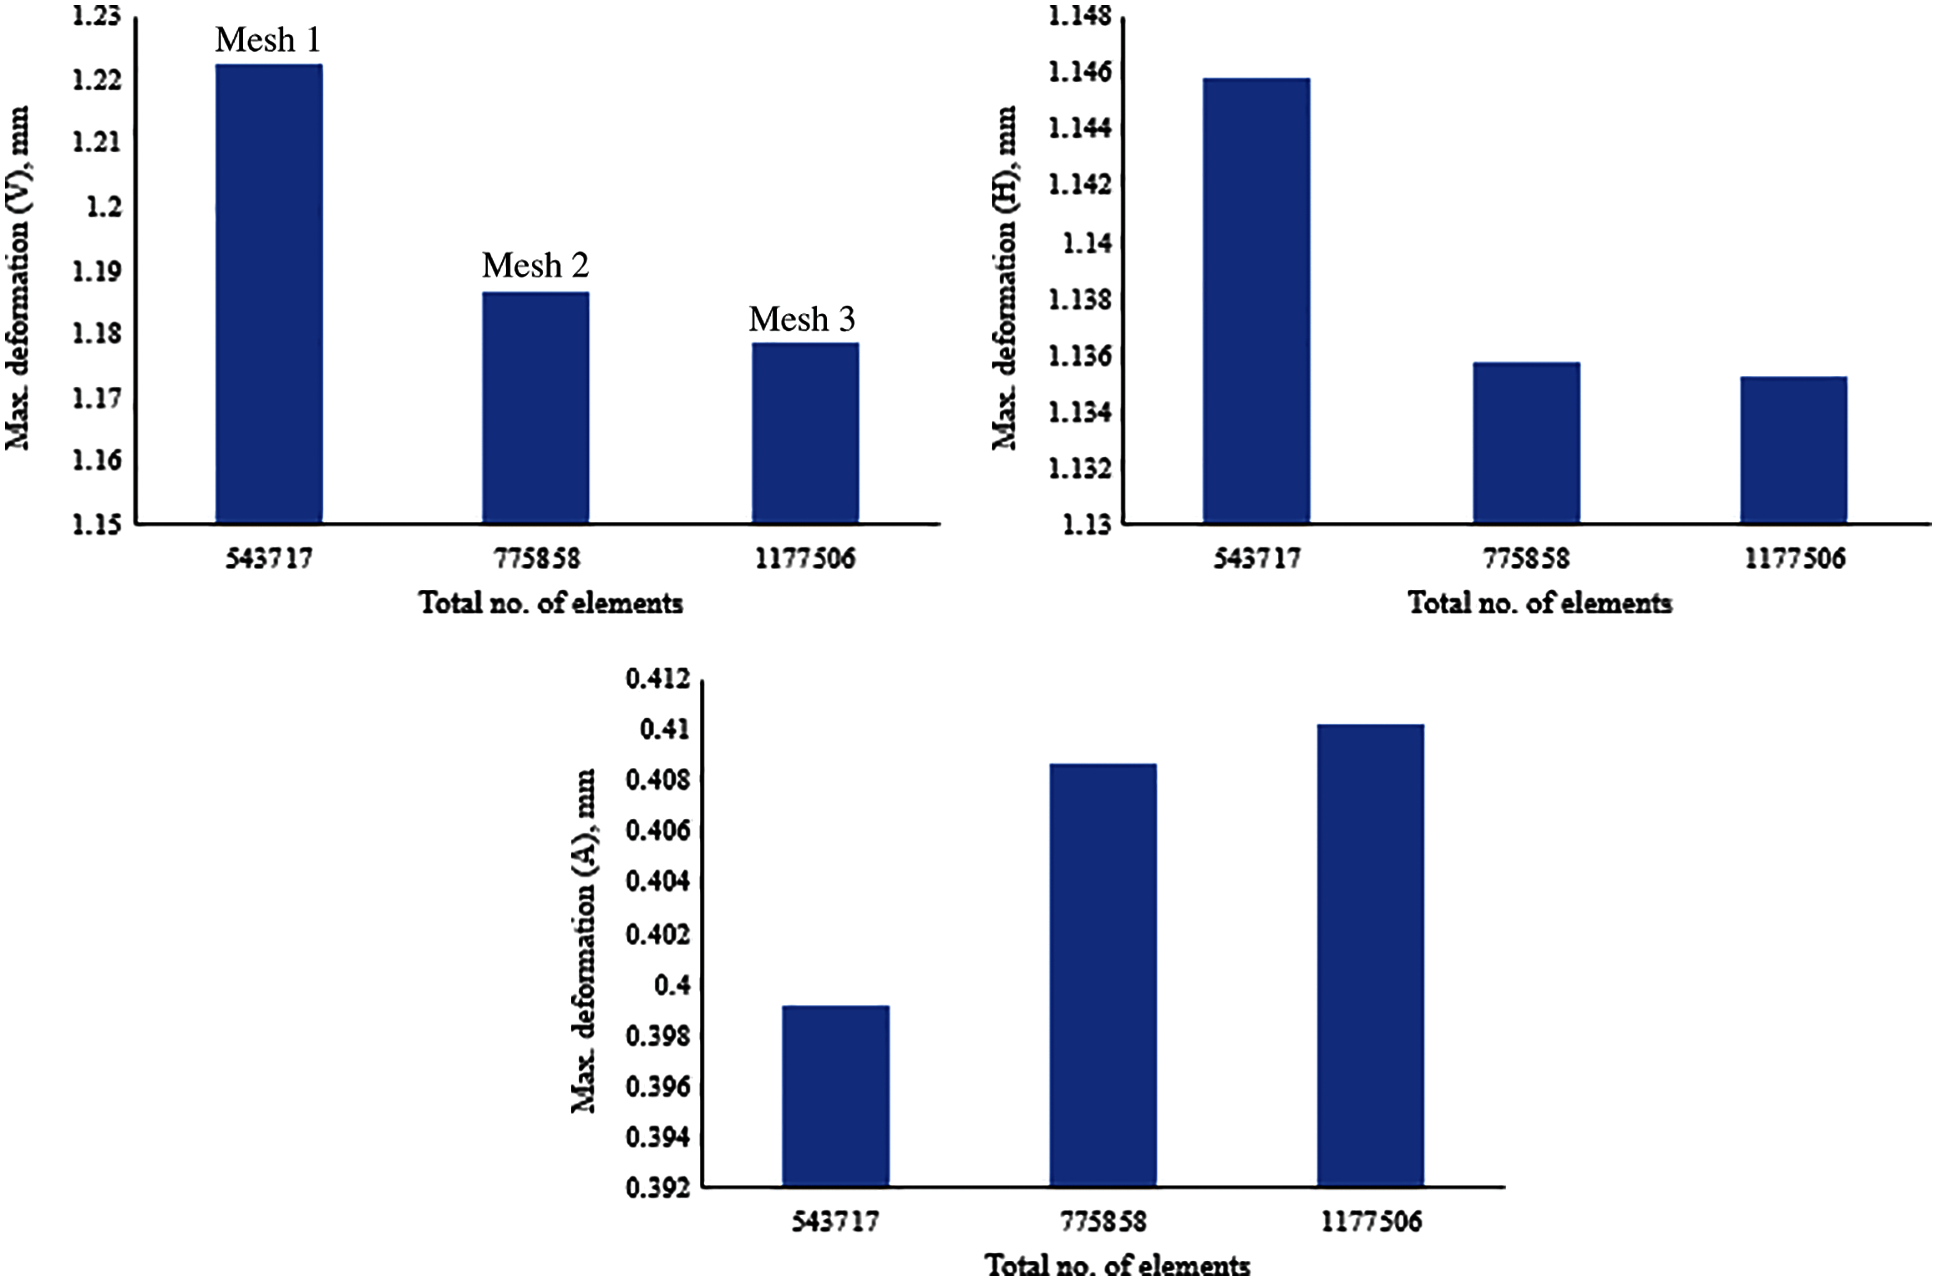
Figure 3: Mesh independence study plots of FEA model
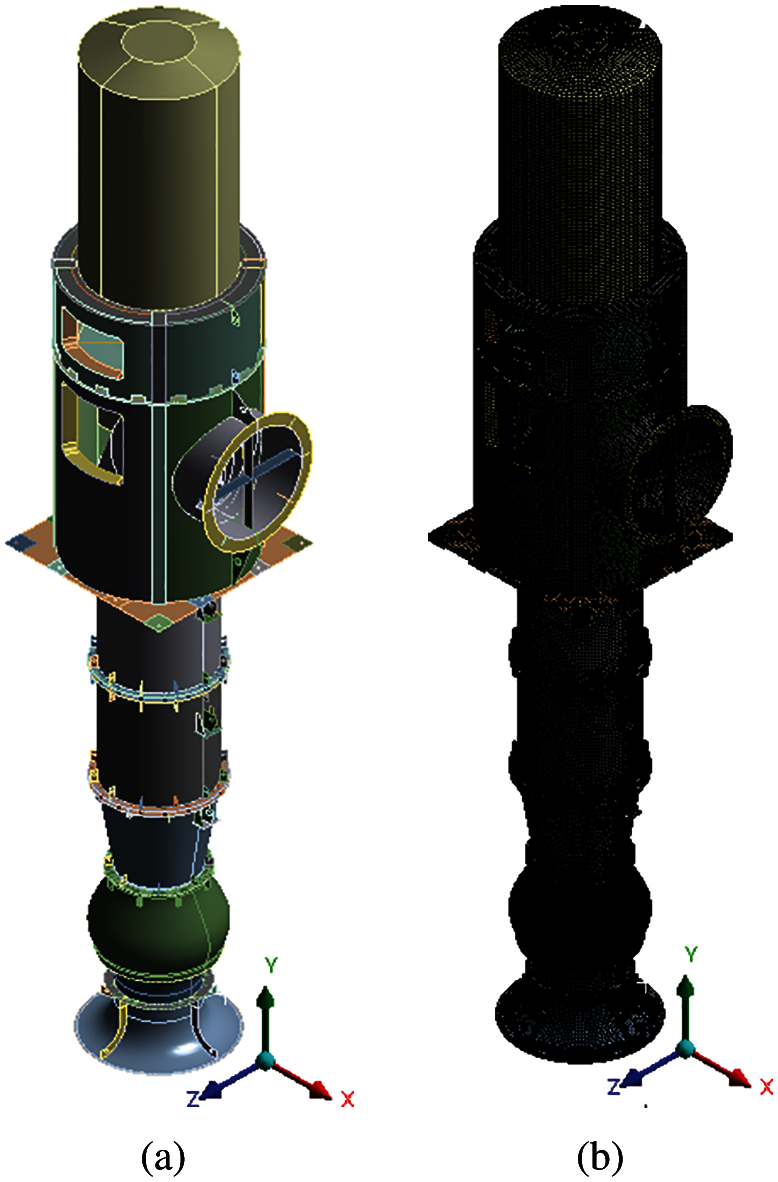
Figure 4: Geometry and finalized mesh of pump-motor assembly (a) 3D model (b) FE mesh (Mesh 2)
3.1.1 One-Way FSI Numerical Simulations Results
One-way Fluid Structure Interaction (FSI) numerical simulations are conducted using Mesh 3 of CFD and Mesh 2 of FE solver. The simulation results are discussed quantitatively in terms of vibration displacement magnitudes and qualitatively in terms of displacement contours on motor component. The selected components for monitoring the vibration displacements are shaft, impeller, suction bearing (rotating parts) and bell mouth, discharge bend and motor (stationary parts). The numerical simulation has been conducted and results are noted for a set of hydraulic eccentricity magnitude varying between 0 and 0.688 mm. The value zero corresponds to the design geometry with no sign of hydraulic unbalance whereas 0.688 mm is corresponding to maximum hydraulic unbalance at which heavy vibrations in pump observed at site [21].
The maximum magnitude of vibration displacements is given in Tabs. 4 and 5 on the specific components with respect to hydraulic unbalance magnitude variation. Tabs. 4 and 5 show the vibration displacements in lateral directions which is X and Y, respectively. The description of the results is given below for stationary and rotating components respectively.
Stationary parts: From values of Tab. 4, it is observed that bell mouth is found to be with maximum magnitudes acting as a cantilever column fixed at one end and a hydraulic unbalance force acting on the free end. Discharge bend is found to be on safe side with displacements below limiting value of 100 μm. But, in motor component, the limiting value is crossed when the hydraulic unbalance lies between 0.4 and 0.5 mm. The close location of discharge bend near the fixed base frame imposes relatively good stiffness compared to motor. Hence higher vibration magnitudes are found in motor component relative to discharge bend. Similar observations are found from Tab. 5 too which is in Y direction.
Fig. 6 shows the displacement contours on motor component in X, Y&Z directions. It is observed that, in both lateral directions (X&Y) the maximum magnitudes are observed on motor free end. This is due to the free end of motor from the base plate location similar to cantilever column.
Rotating parts: The entire rotating shaft is considered as a single component and noted the maximum displacements. Impeller is modelled as lumped mass and suction bearings are modelled as spring connected to shaft nodes. So, the vibration magnitudes at node are noted for each hydraulic unbalance. From the Tabs. 4 and 5, it is observed that the shaft displacements near to bell mouth are much higher compared to displacements at impeller and bearing locations. The vibration displacements are also plotted with respect to hydraulic unbalance for the mentioned components. Fig. 5 shows the displacement variation in X and Y directions. From the Fig. 5, it is observed that with increase in hydraulic unbalance the vibration displacements of all components are increasing. The slope is more for shaft and impeller components implying that these parts are much sensitive to the hydraulic unbalance.
Figs. 7–9 show the contours on motor, shaft, impeller node and suction bearing node, respectively. It is found that the shaft part has maximum magnitude at its free end. Though the stiffness is provided to shaft at appropriate bearing locations, the end part is observed with high vibration magnitudes. This is due to the close proximity of hydraulic unbalance of impeller node near the shaft end.
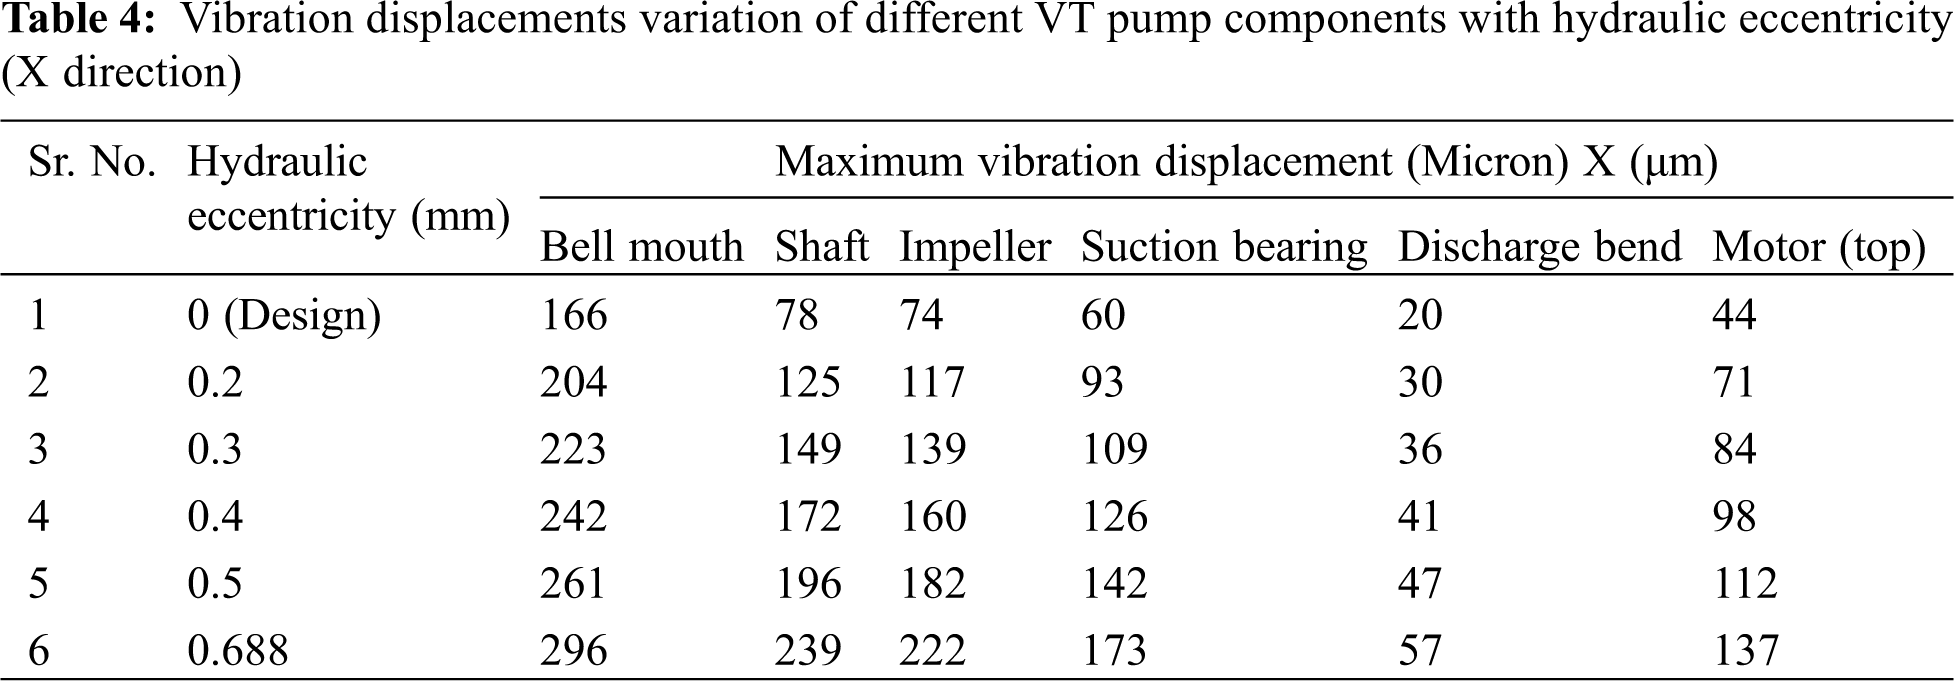
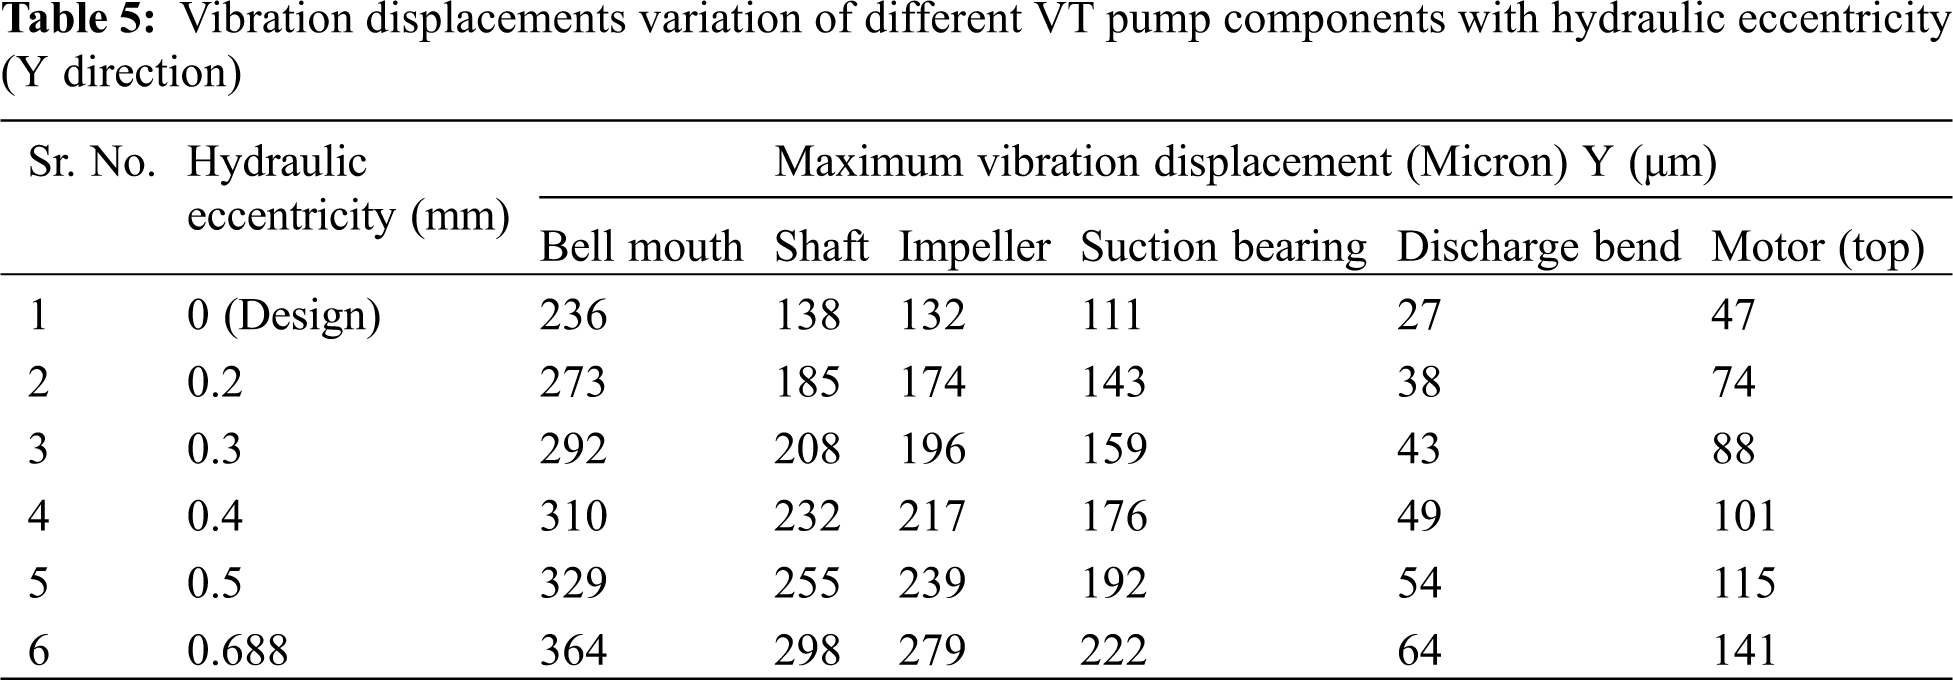
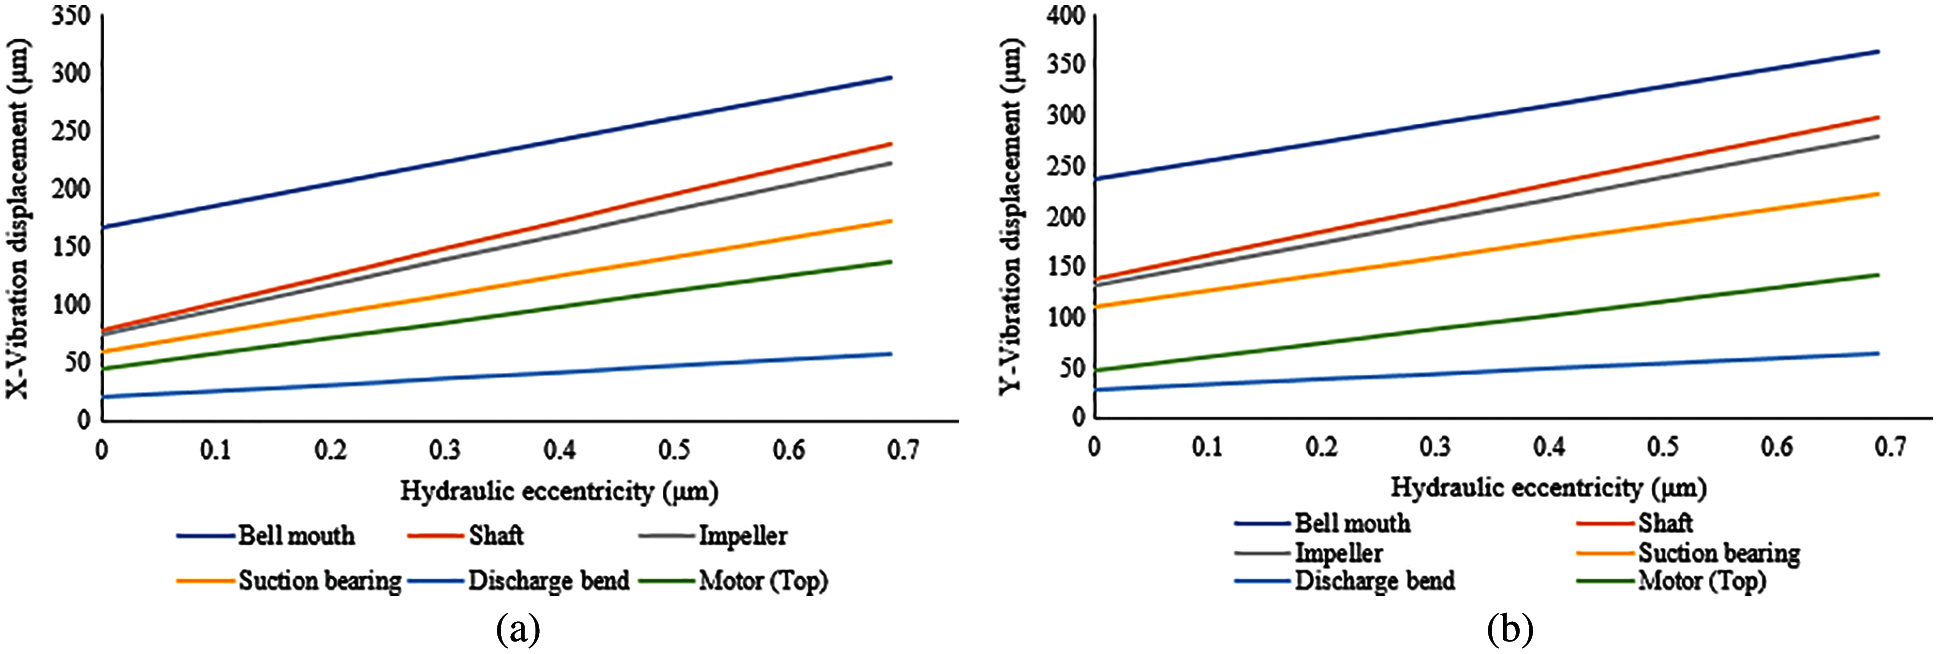
Figure 5: Graphical representation of vibration displacements in X and Y direction based on numerical simulation
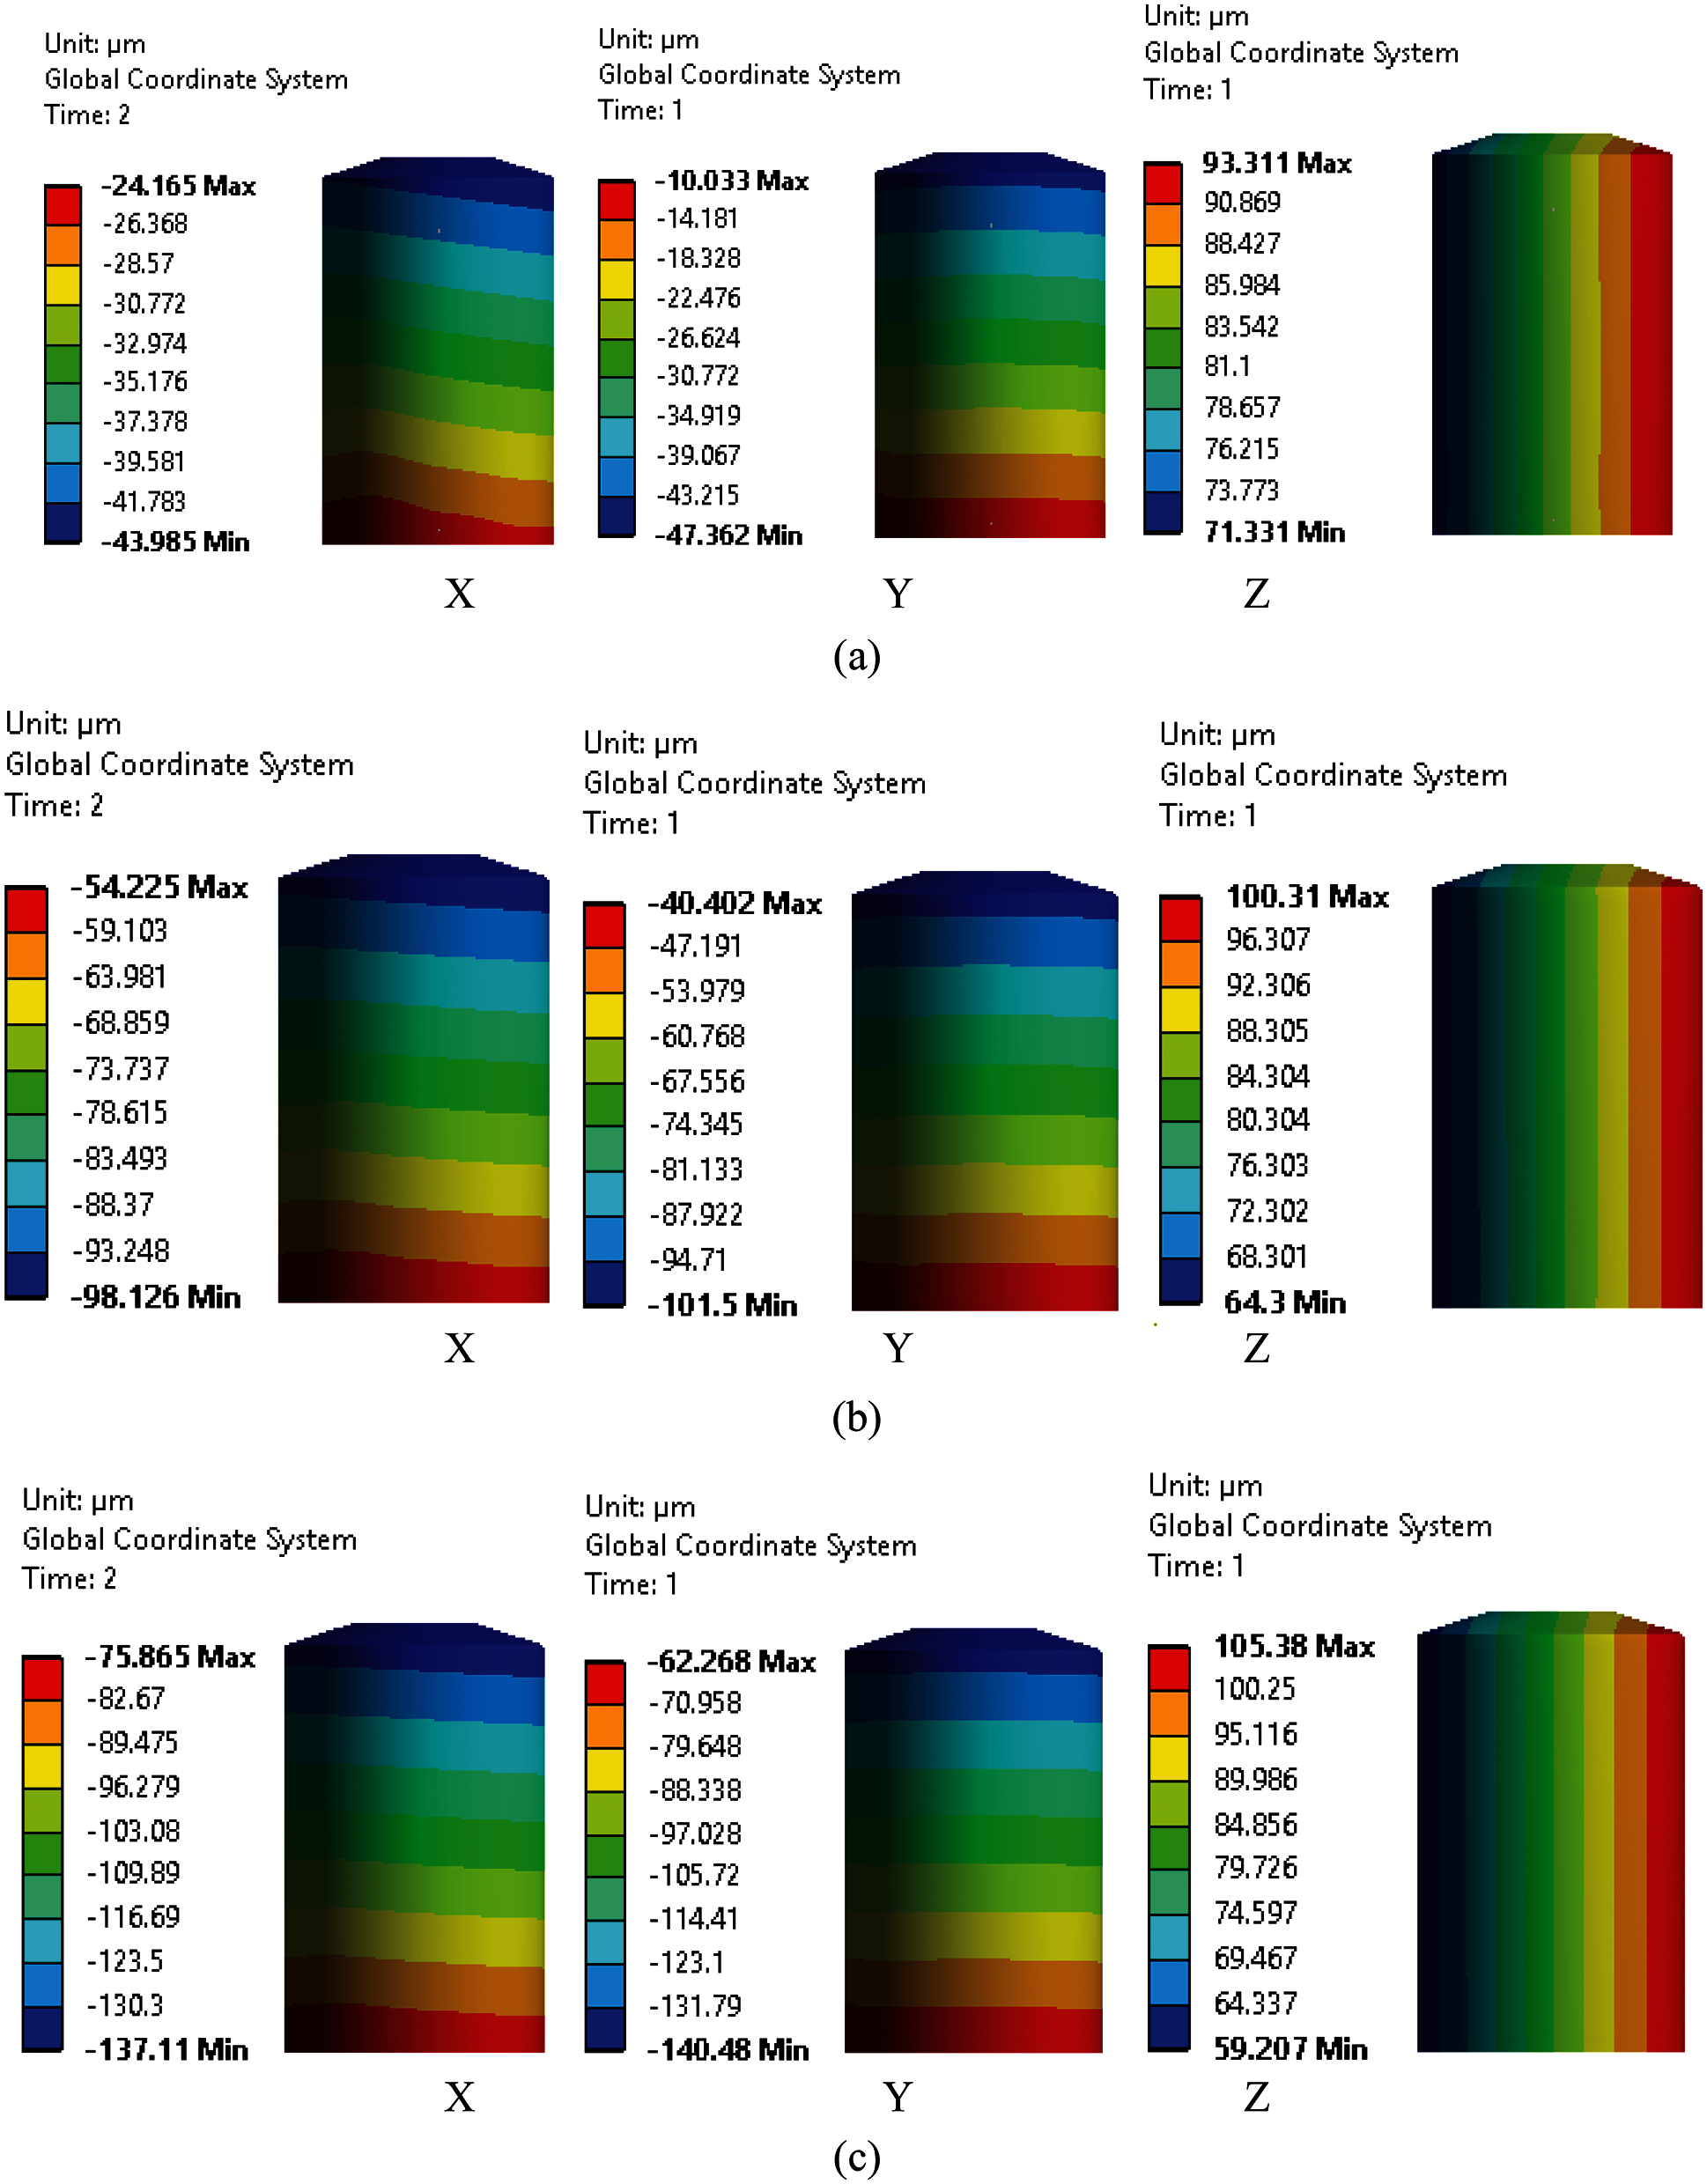
Figure 6: Displacement contours on motor component in three directions (a) Design (b) 400 microns (c) 688 microns
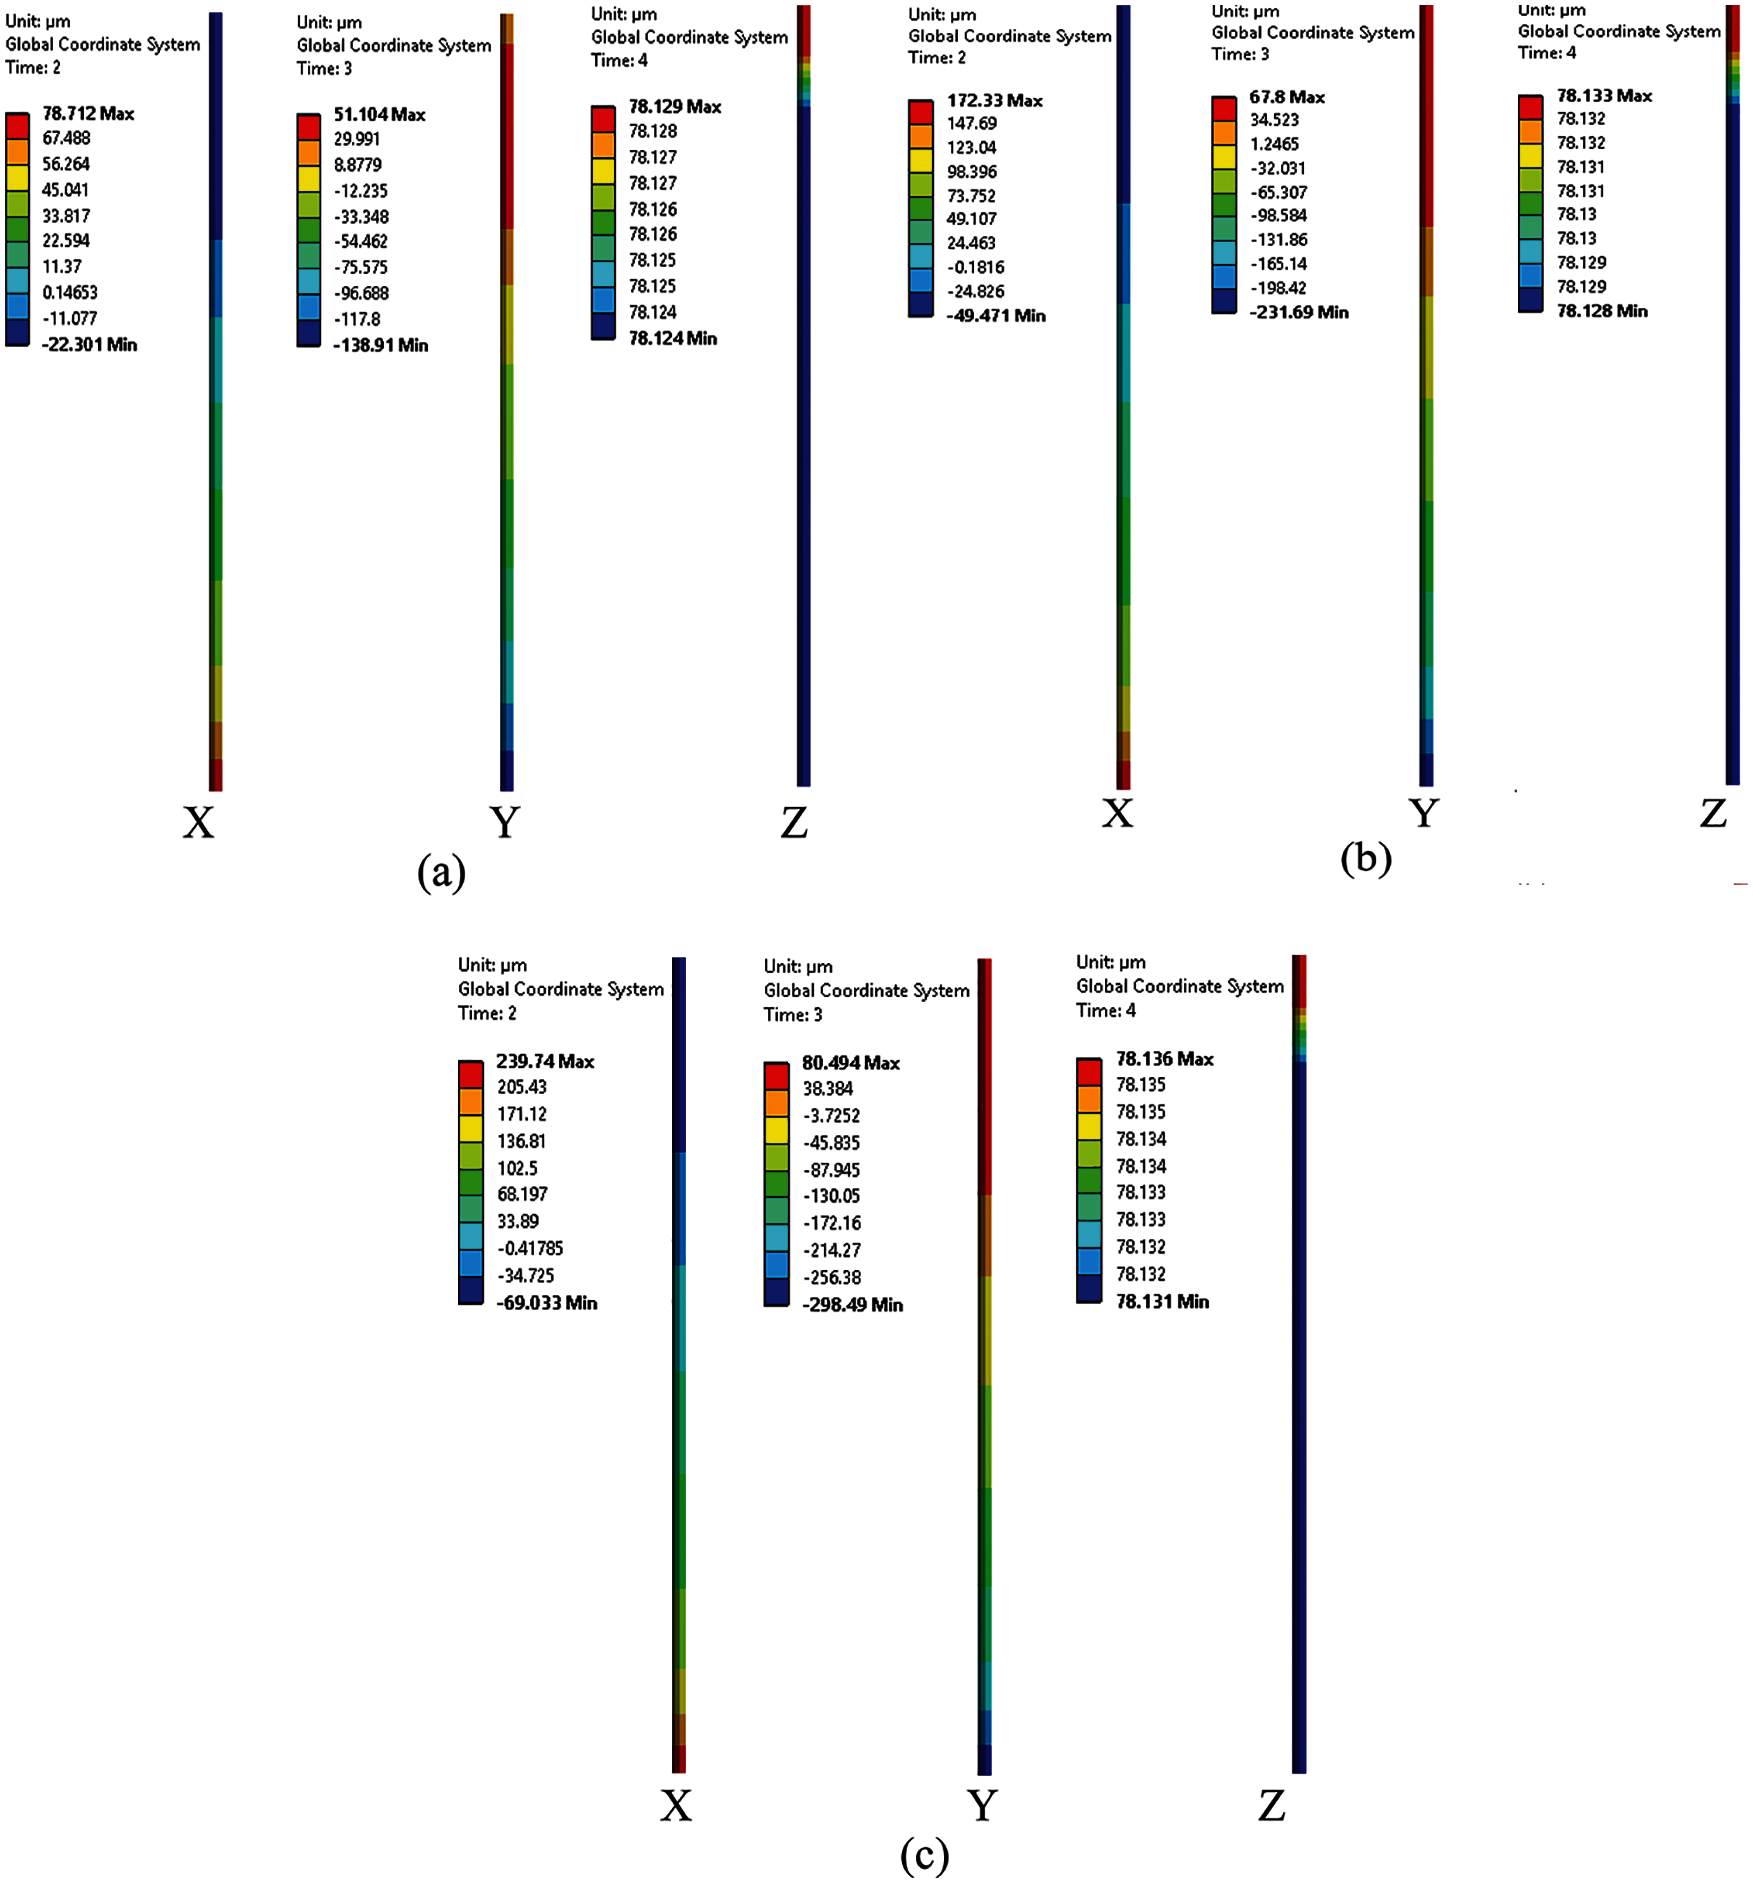
Figure 7: Displacement contours on shaft component in three directions (a) Design (b) 400 microns (c) 688 microns
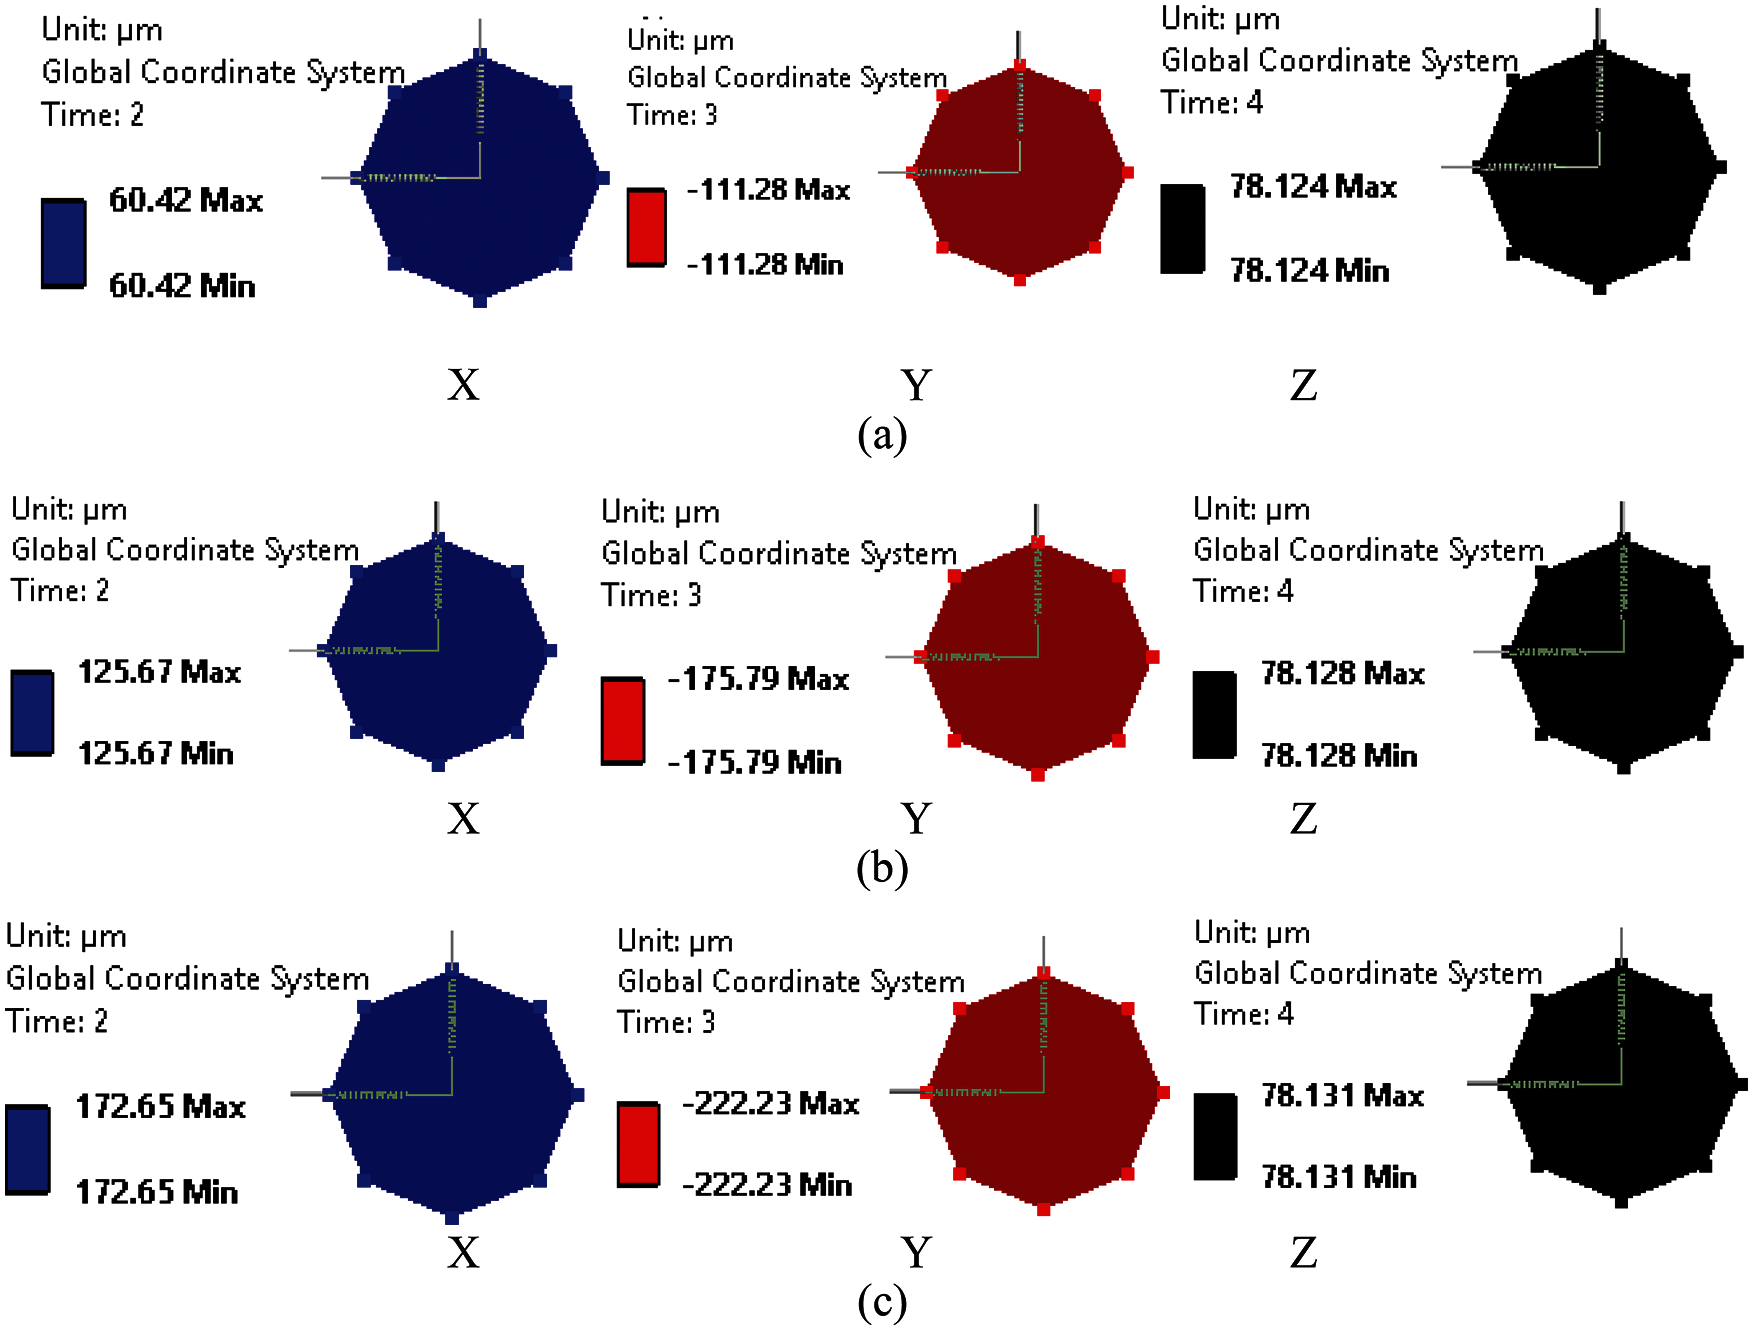
Figure 8: Displacement contours on suction bearing component in three directions (a) Design (b) 400 microns (c) 688 microns
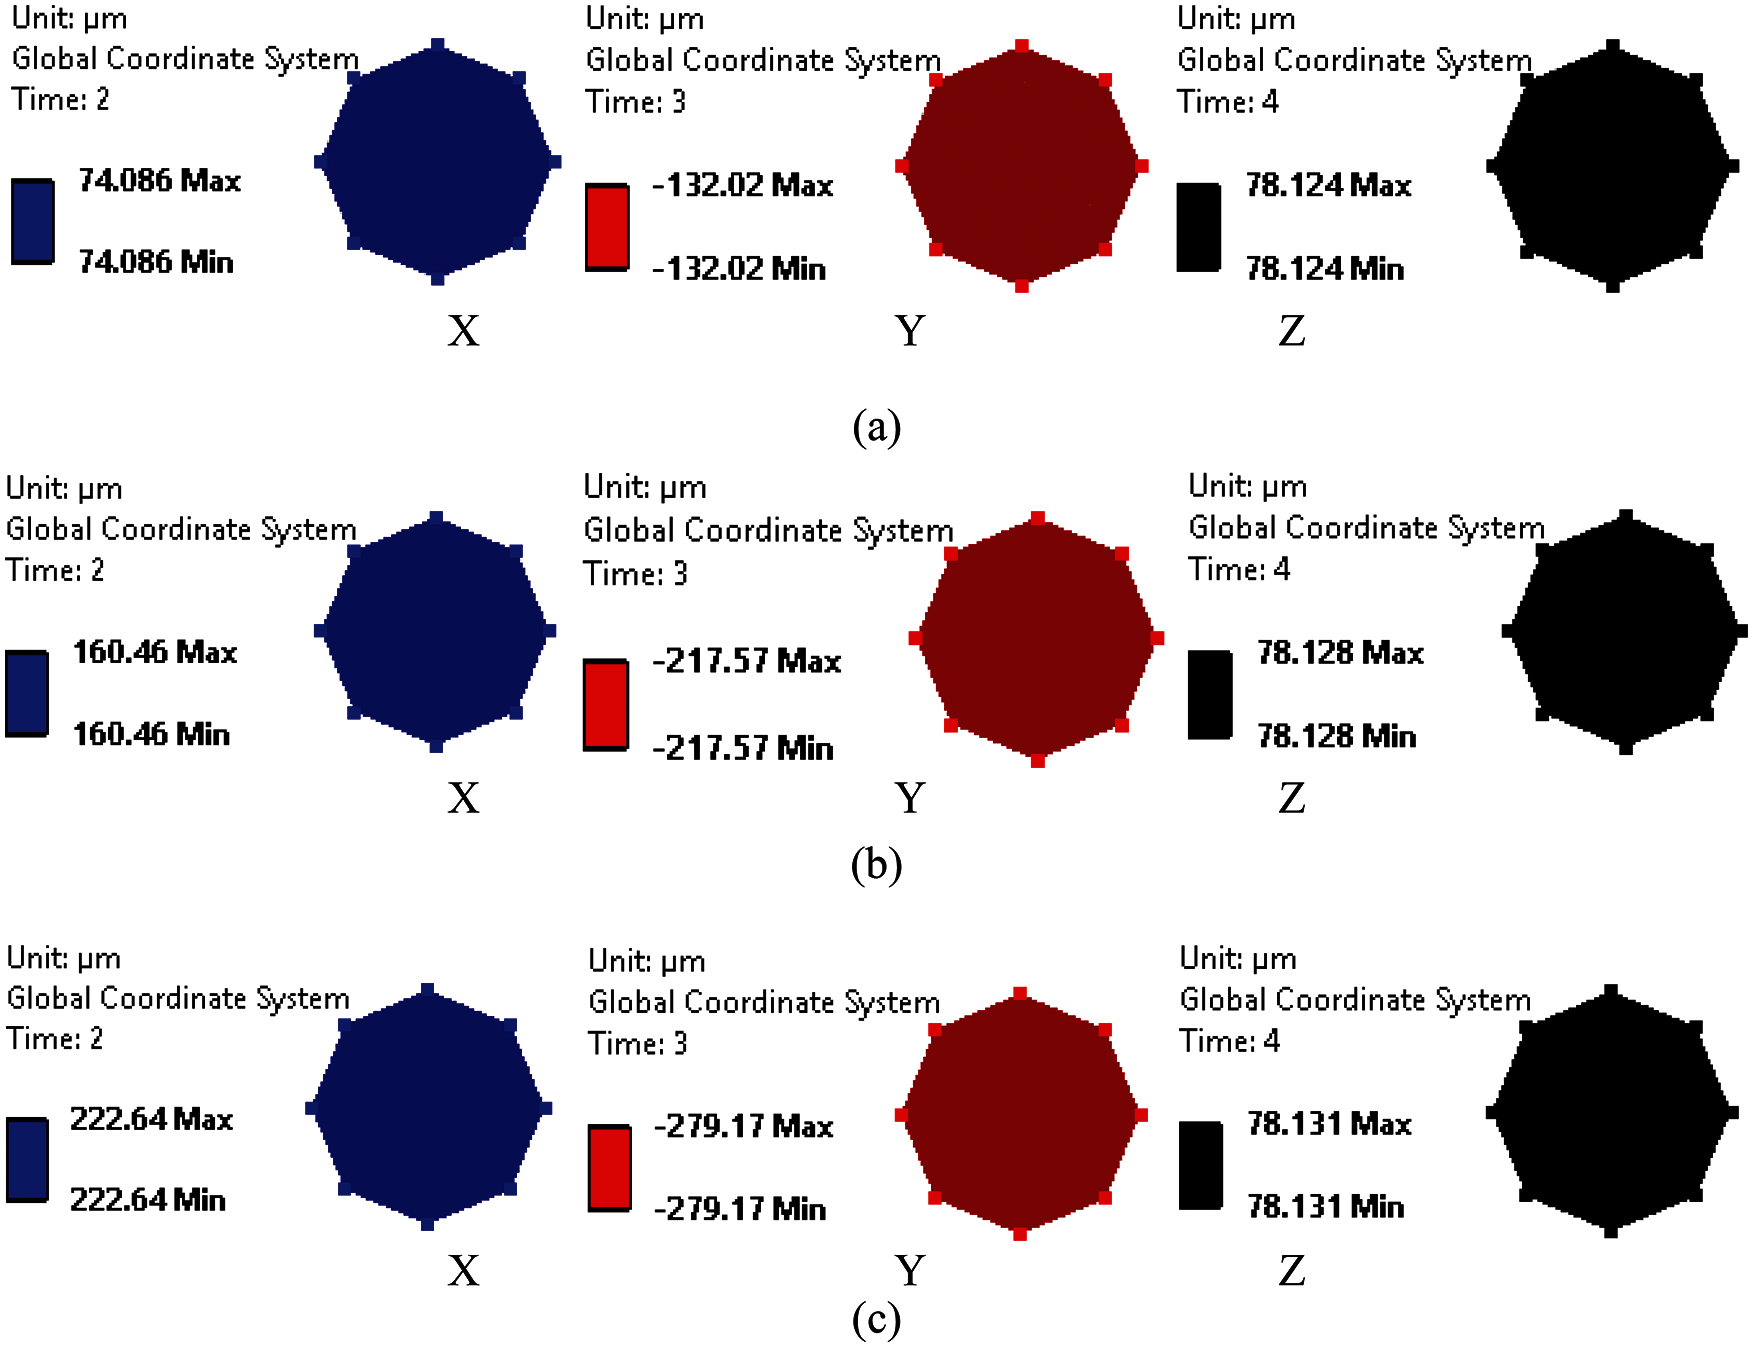
Figure 9: Displacement contours on pump impeller in three directions (a) Design (b) 400 microns (c) 688 microns
To verify the numerical analysis results, the vibration displacement values are compared with actual test data of five pumps. Fig. 10 shows the measurement locations at site location in 3 directions on motor component. Fig. 11 shows the X and Y direction vibration magnitude variation of the motor component due to hydraulic eccentricity. The experimental test data for the motor component is also plotted. The numerical simulation predicted results are found within 10% with respect to the experimental test data. With this validation, the critical hydraulic eccentricity magnitude is deduced from the graph.
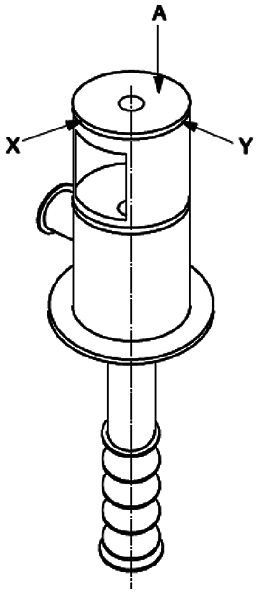
Figure 10: Vibration measurement location
To find the critical hydraulic eccentricity to comply with HIS standard, the vibration displacement near the motor is limited to 100 μm in both X and Y directions as per guidelines of Hydraulic Institute standard. For the limiting value of 100 μm vibrational displacement in X direction, the critical hydraulic eccentricity is found 405 μm. Similarly, for the limiting value of 100 μm vibrational displacement in Y direction, the critical hydraulic eccentricity is found 400 μm. From the Fig. 11 it can be noted that, the pumps P2 and P3 are having higher vibration than limit of 100 microns given in HIS.
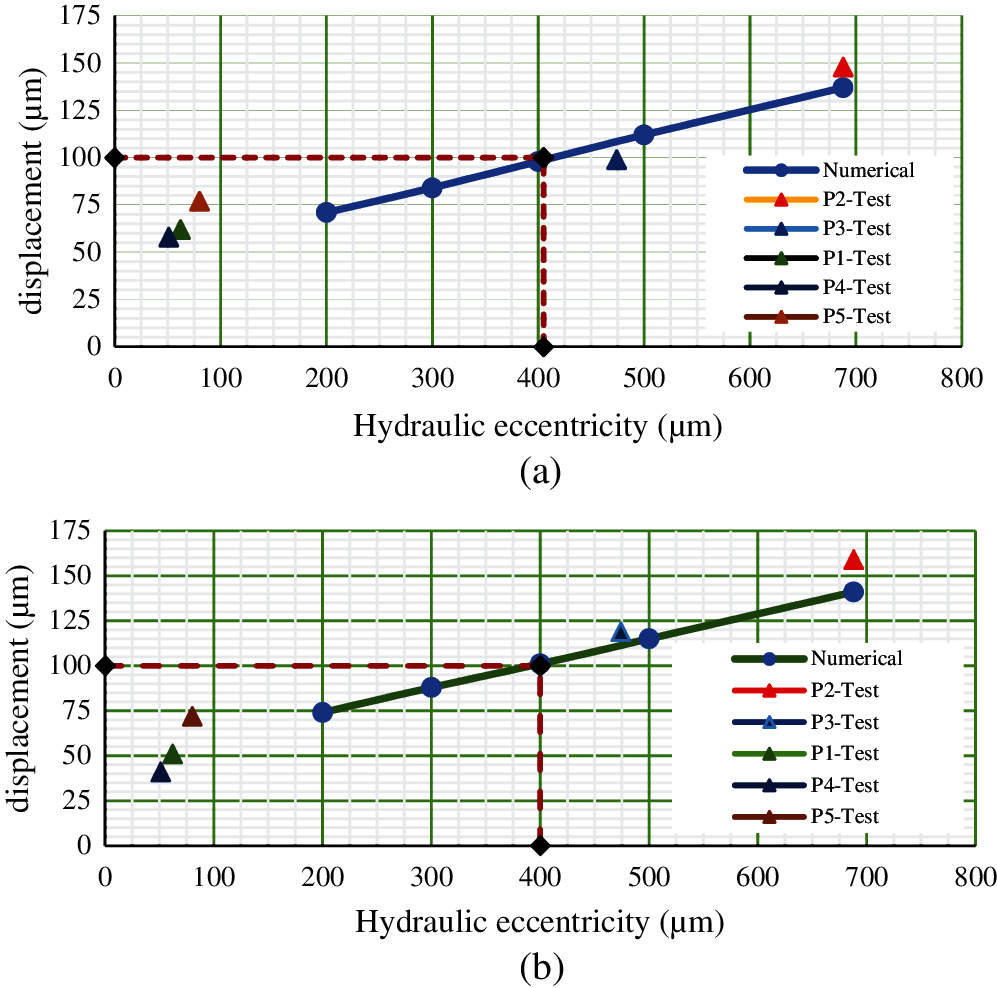
Figure 11: Vibration displacement on motor in X&Y direction with hydraulic eccentricity and experimental test data (a) Vibrational displacements in X direction and experimental test data (b) Vibrational displacements in Y direction and experimental test data
3.2 Part 2: Design of Experiments to Find the Vane Pitch Tolerance to Control the Hydraulic Eccentricity
The next part of research work is to correlate the critical eccentricity to vane pitch of the pump. Measuring a critical eccentricity for a manufactured impeller is not a direct step as practically it is not feasible to measure eccentricity. The alternative method is to measure the vane pitch dimensions of an impeller and predict the hydraulic eccentricity of respective impeller. But, the estimation of eccentricity from vane pitch measurements needs a set of experiments based on which the factors affecting critical hydraulic eccentricity is to be estimated.
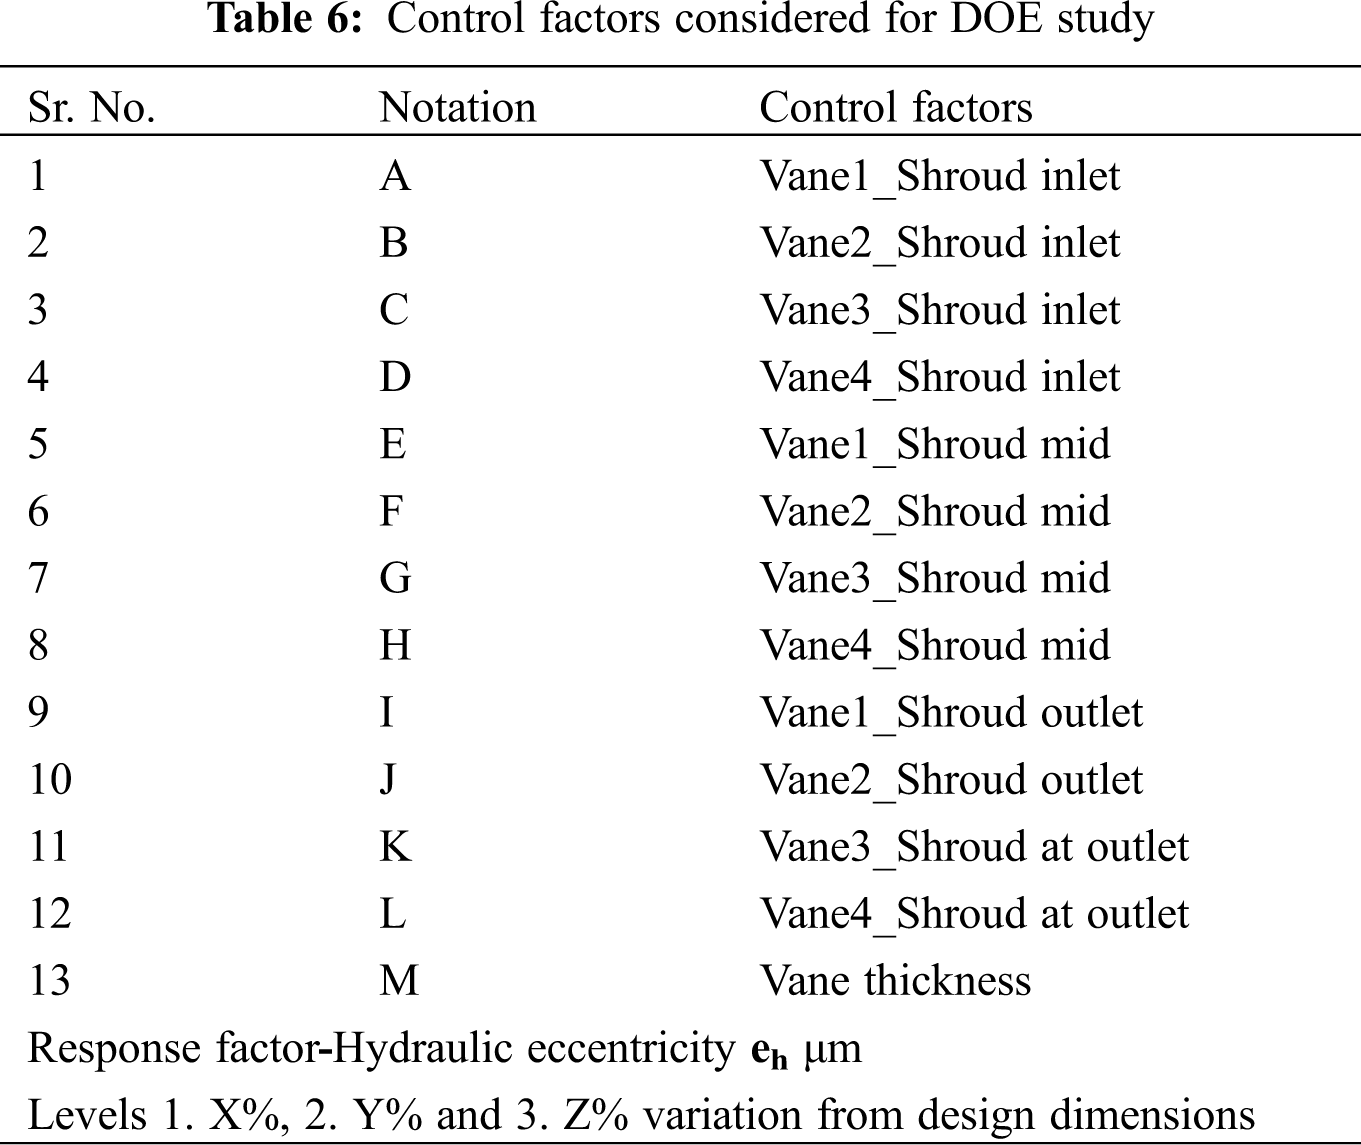
In general, the vane pitch dimensions are different in a mixed flow type impeller at different sections. Hence, there are many parameters in terms of vane pitch which can impact the hydraulic eccentricity. To study the effect of these different parameters on the hydraulic eccentricity, a set of experiments can be examined by using the orthogonal experimental design. All parameters or control factors envisaged to affect hydraulic eccentricity (eh) are ranked in perceived order. The top thirteen factors selected are listed in Tab. 6 in which one or more of the factors may have a significant impact on hydraulic eccentricity. Considering the impeller geometry, and thirteen selected factors, a L27 orthogonal array is selected with 13 control factors and 3 levels. In an impeller, the shroud location is with maximum radius location. Hence a small percent deviation of vane pitch causes high magnitude in deviation. So, the control factors are selected for all vanes at shroud locations.
Generally, the orthogonal method uses the original results of the experimental testing. However, considering the manufacturing process of impeller and number of experiments, it needs a longer period with high accuracy. The error is also unavoidable during testing. Hence, for each run of DOE, the 3D impeller geometry (Fig. 12a) is created for experimentation to predict the effect on response factor as hydraulic eccentricity. By this approach error will be minimum and saves cost of the manufacturing and time.
Tab. 6 shows the list of 13 control factors and 3 levels. Fig. 12b shows the control factors considered for the hydraulic portion of one of the vanes. Similarly, for four vanes, there are 12 control factors (3 each) and 1 control factor as vane thickness.
To fix the exact levels, initially it is planned to conduct 3 different experiments. Experiment 1 with vane deviation of 5% in all vanes. Experiment 2 is with vane deviation of 3% in all vanes. Experiment 3 with vane deviation of 1% in all vanes. From the experiments it is noted that with these variations, the eccentricity is noted as 741, 533, and 378 μm, in Experiments 1, 2 and 3, respectively. These hydraulic eccentricities are quite higher than critical eccentricity as deduced earlier. Hence, based on the outcome of these experiments, three levels are selected viz. 3%, 2% and 1%. Tab. 7 shows the finalized levels for DOE experiments. The 3D geometry of impellers with such variation are created to find the hydraulic eccentricity and are tabulated in Tab. 8.
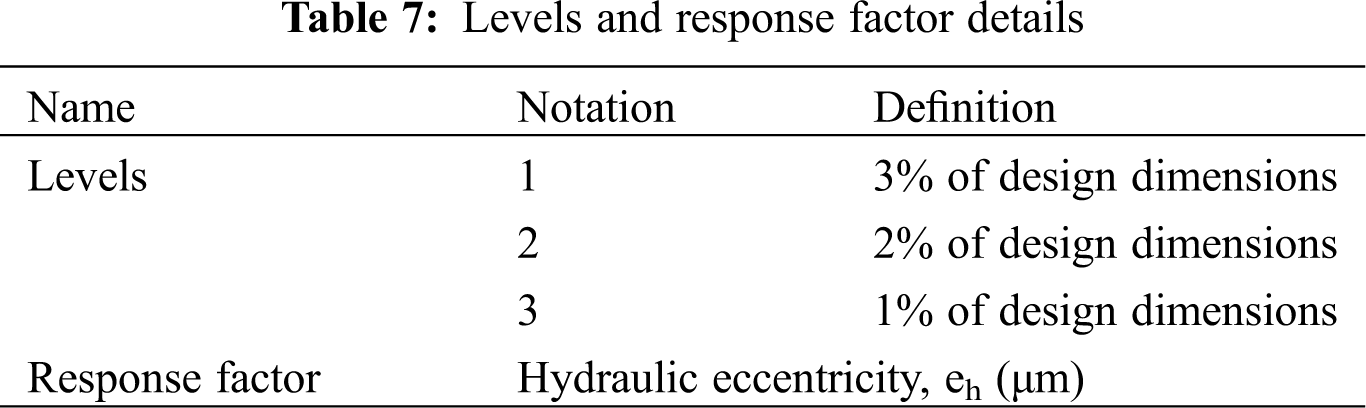
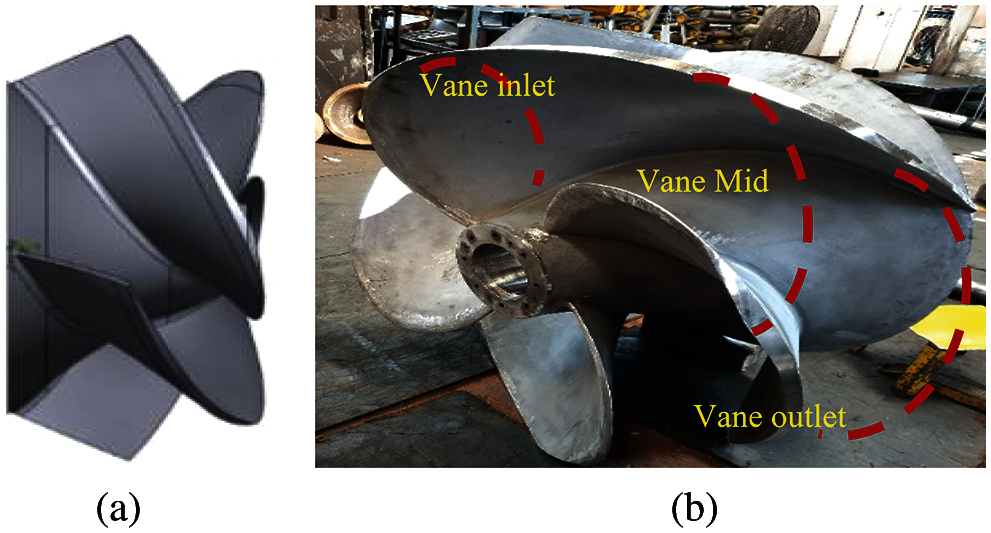
Figure 12: Impeller geometry (a) 3D model of impeller (b) Manufactured impeller
Tab. 8 shows the L27 matrix with hydraulic eccentricity values achieved for each impeller under various configurations of control factors (A to M) with Levels (1–3). Total 27 3D models are prepared based on each configuration and noted the hydraulic eccentricity magnitudes (ech) due to change in vane pitch. The data will be used to find the control factors which affect the hydraulic eccentricity.
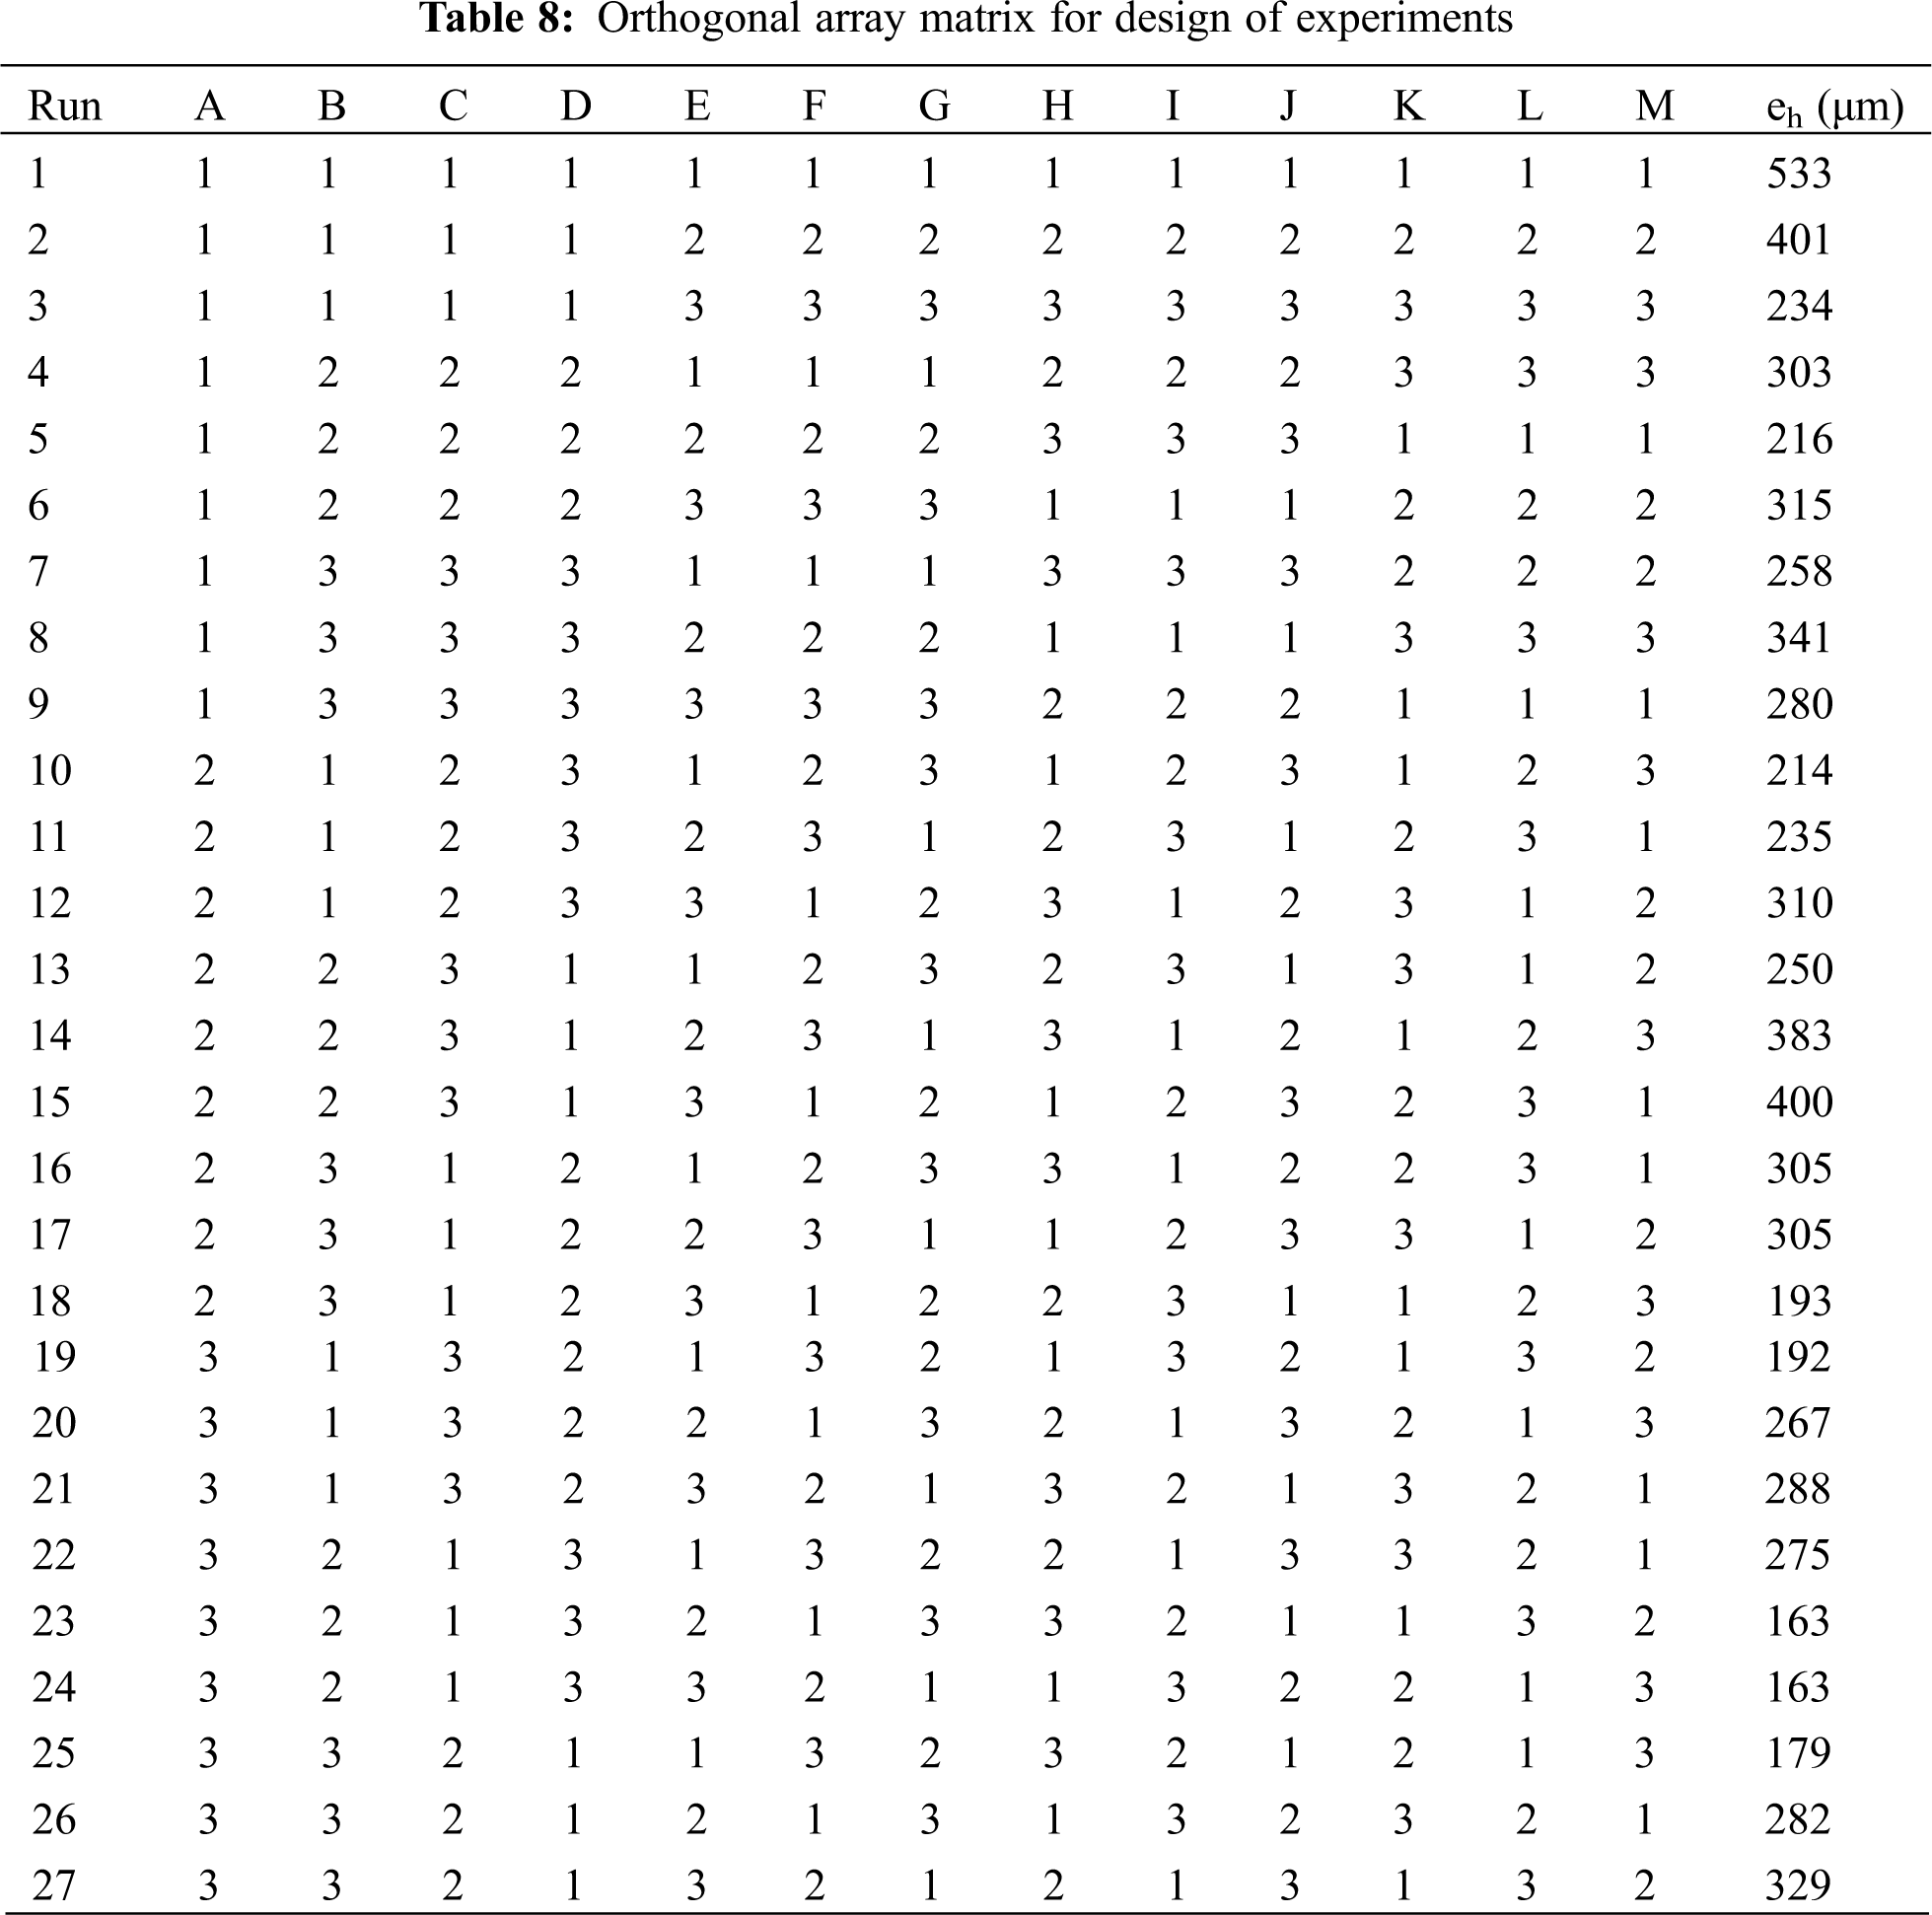
The hydraulic eccentricity value is measured for total 27 3D models and tabulated (Tab. 8). To find the vane pitch tolerance for a critical hydraulic eccentricity of 400 μm, the data from the Tab. 8 will be used for analyzing the results. The statistical methods selected for this are S/N ratio, Analysis of means (ANOM) and Linear regression analysis. Each method is described below to analyze the results.
a) S/N (Signal to Noise) ratio
In the present case, since the lower the response factor (which is critical hydraulic eccentricity) lower the vibrations. Smaller the better option is used when the objective is to minimize the output value and there are no negative data. Hence as per Taguchi’s method smaller is better option is selected to minimize the vibrations.
For each experiment, the hydraulic eccentricity is calculated and signal to noise ratio is obtained considering the hydraulic eccentricity as response factor. Tab. 9 shows the values of S/N ratio for response factor of hydraulic eccentricity which is obtained using the variation of different control factors at three different levels as planned earlier. The S/N ratio for each combination of different control factors has been calculated and then the average S/N ratio for each level of each control factor. The two key parameters Delta and Rank are obtained for the experiments and listed in Tab. 9. Delta is the difference between the maximum and minimum average response (signal-to-noise ratio or standard deviation) for the factor and Rank defines the delta value order in descending order. Ranks 1 to 4 are highlighted in the Tab. 9. From the values, it is clear that Rank 1 with the highest delta value which is for control factor ‘I’ and Rank 2 is for control factor ‘A’. Rank 3 is for control factor M and Rank 4 is for control factor D. Hence, the vane pitch at Vane 1 shroud outlet (Delta 3.285) has the major impact on the hydraulic eccentricity, followed by Vane 1 at shroud inlet (Delta 2.566). the control factors which dominate the hydraulic eccentricity are shroud outlet and inlet locations. To understand the main effects through pictorially, response curves are plotted for each control factor. Fig. 13 shows the main effects plots for all control factors.
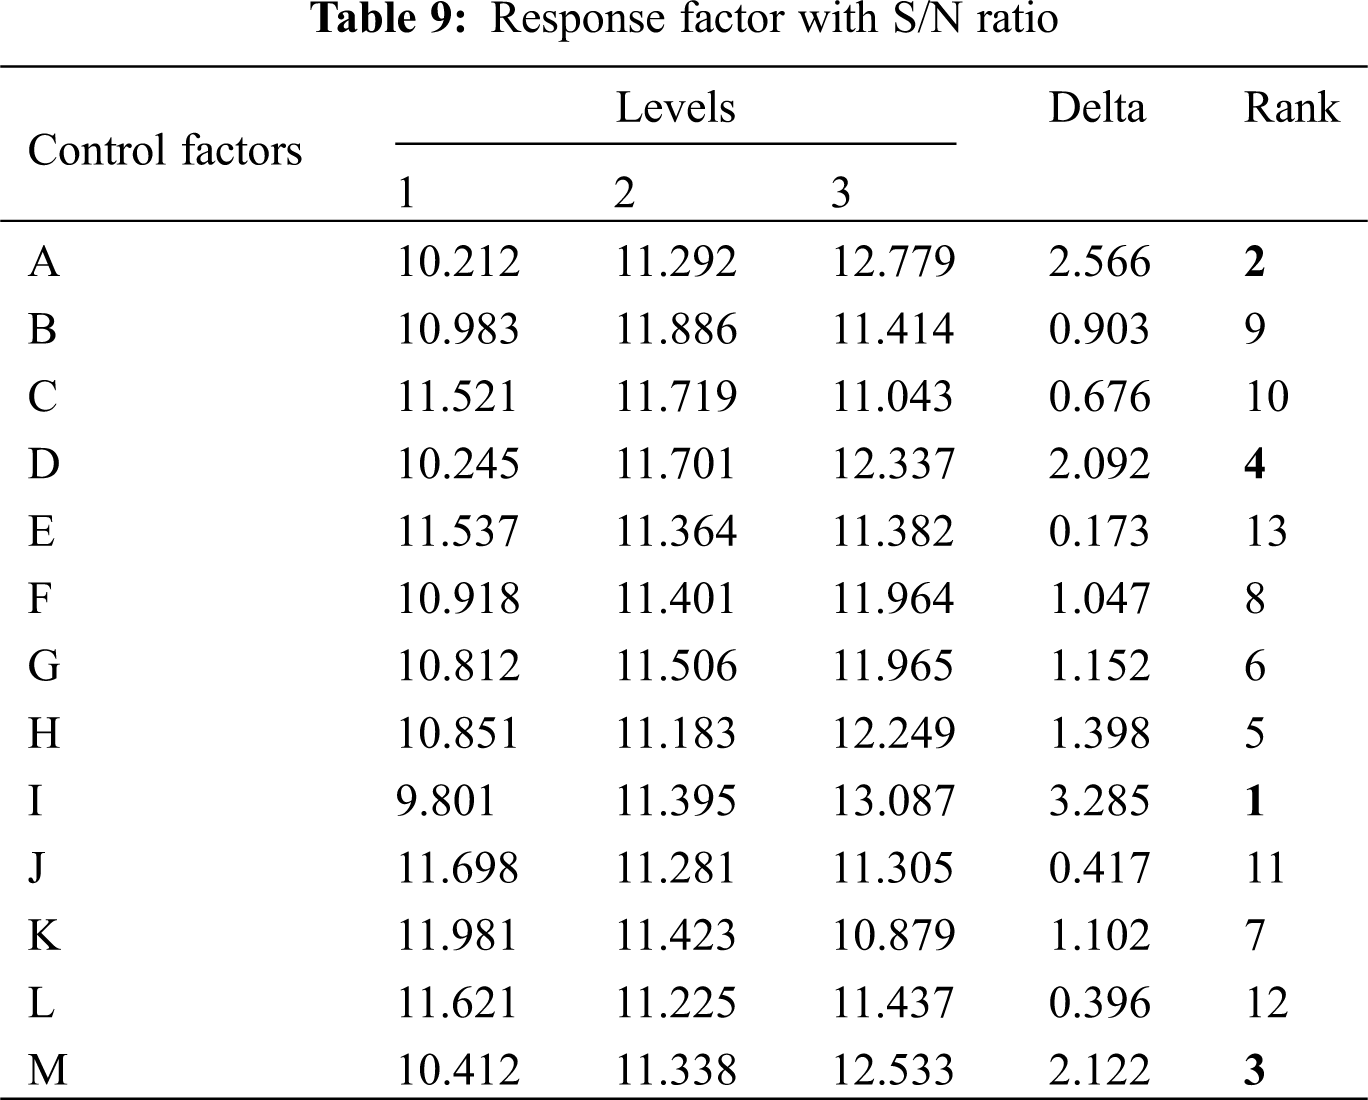
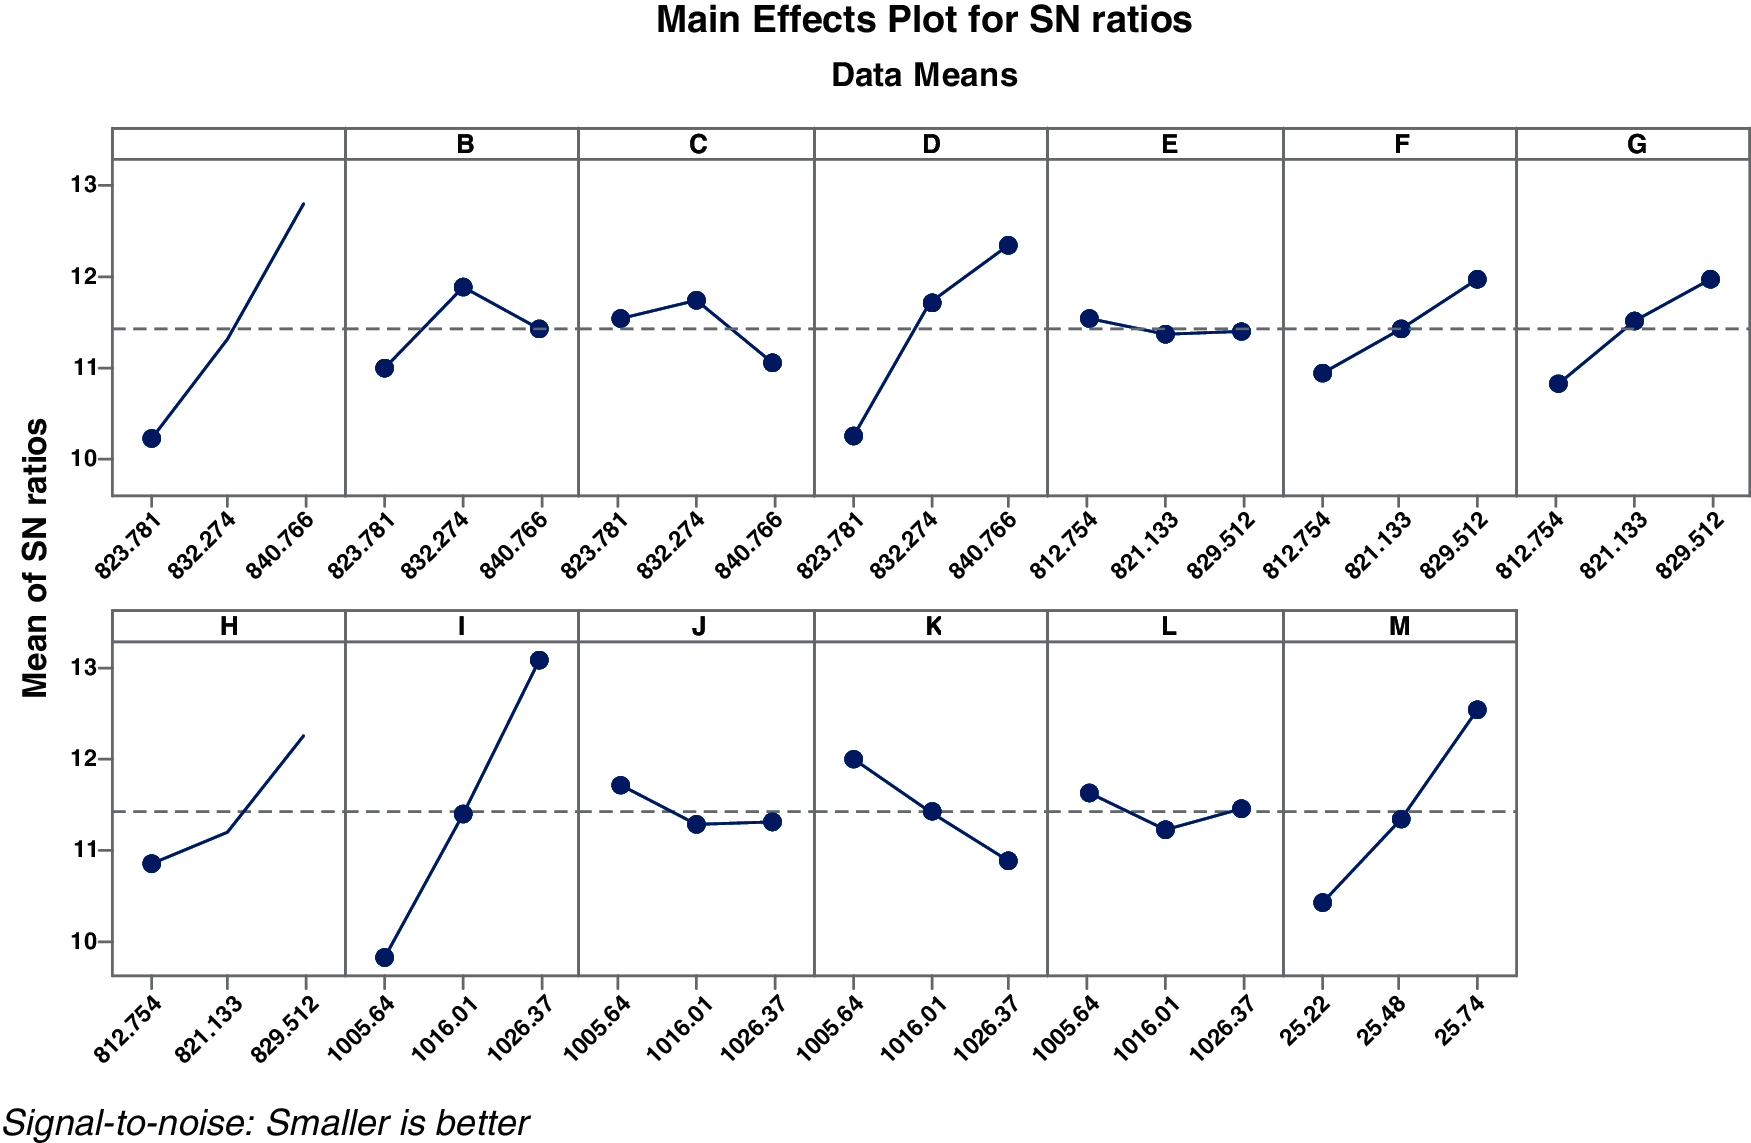
Figure 13: Main effects plots for S/N ratio
b) Analysis of means
Analysis of means (ANOM) is a graphical substitute to ANOVA which tests the equality of data means. Data mean is all elements average that meet the selection criteria for a group. The graph (Fig. 14) displays mean for each factor level, decision limits and the overall mean. If any point in the graph for any factor falls outside of the limit, it means there is an important difference between factors mean and the data mean. Tab. 10 shows the ANOM data in terms of Delta and Rank. Mean plots also plotted and shown in Fig. 14. The rank of the control factors and mean plots is found to be same as in S/N ratio results which confirms the vane pitch deviation at outlet and inlet as the major contributors for hydraulic eccentricity.
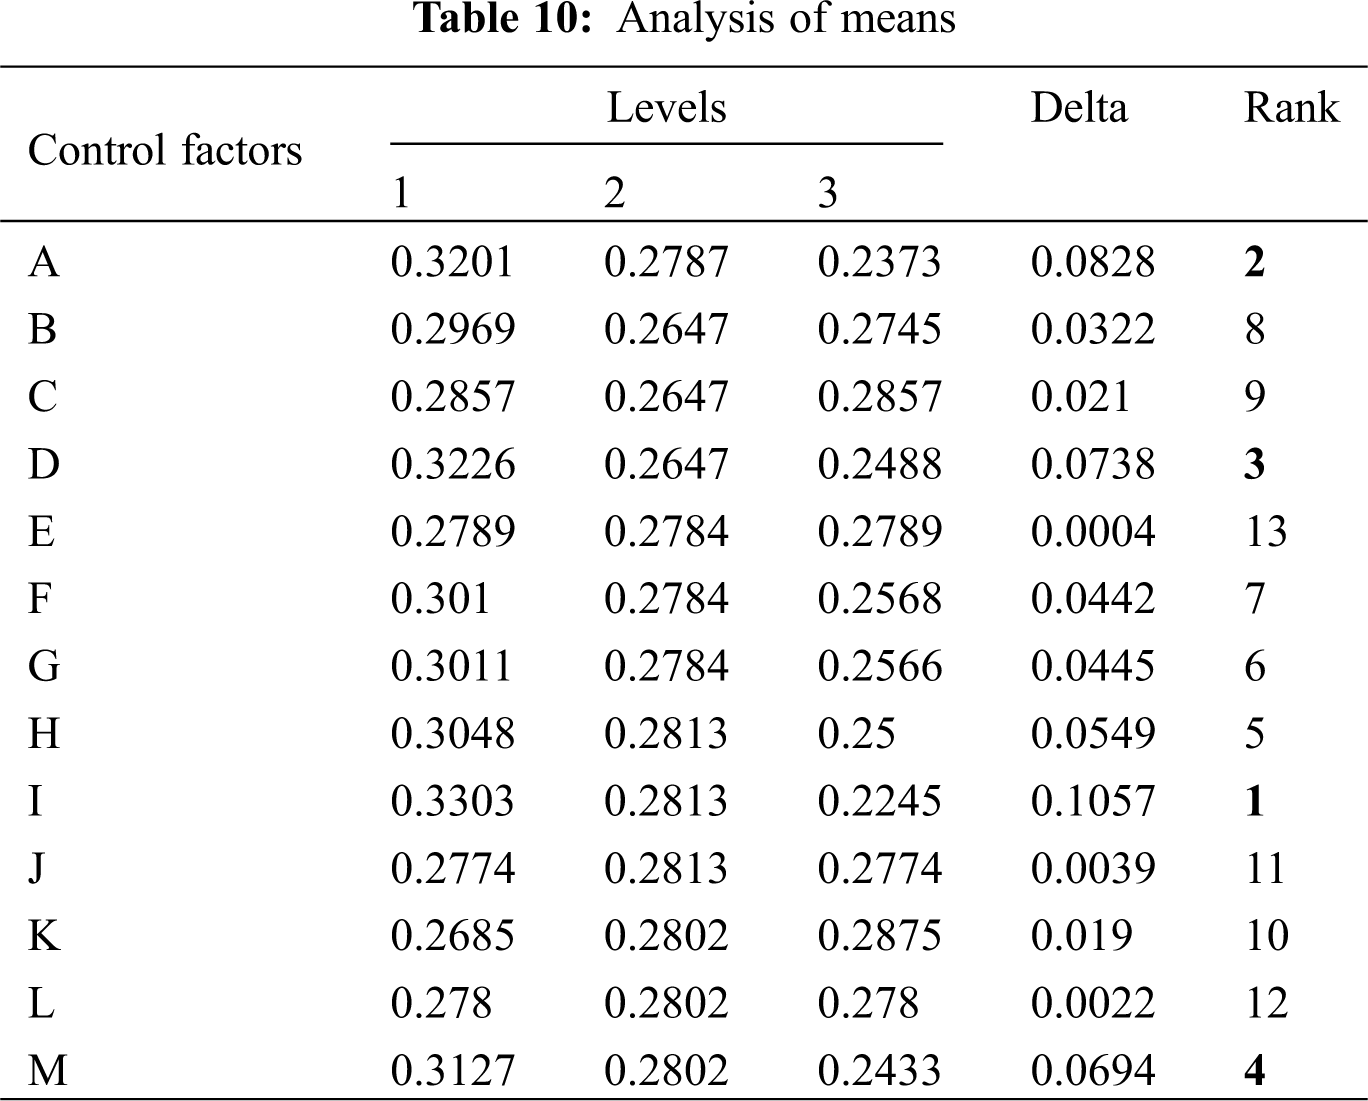
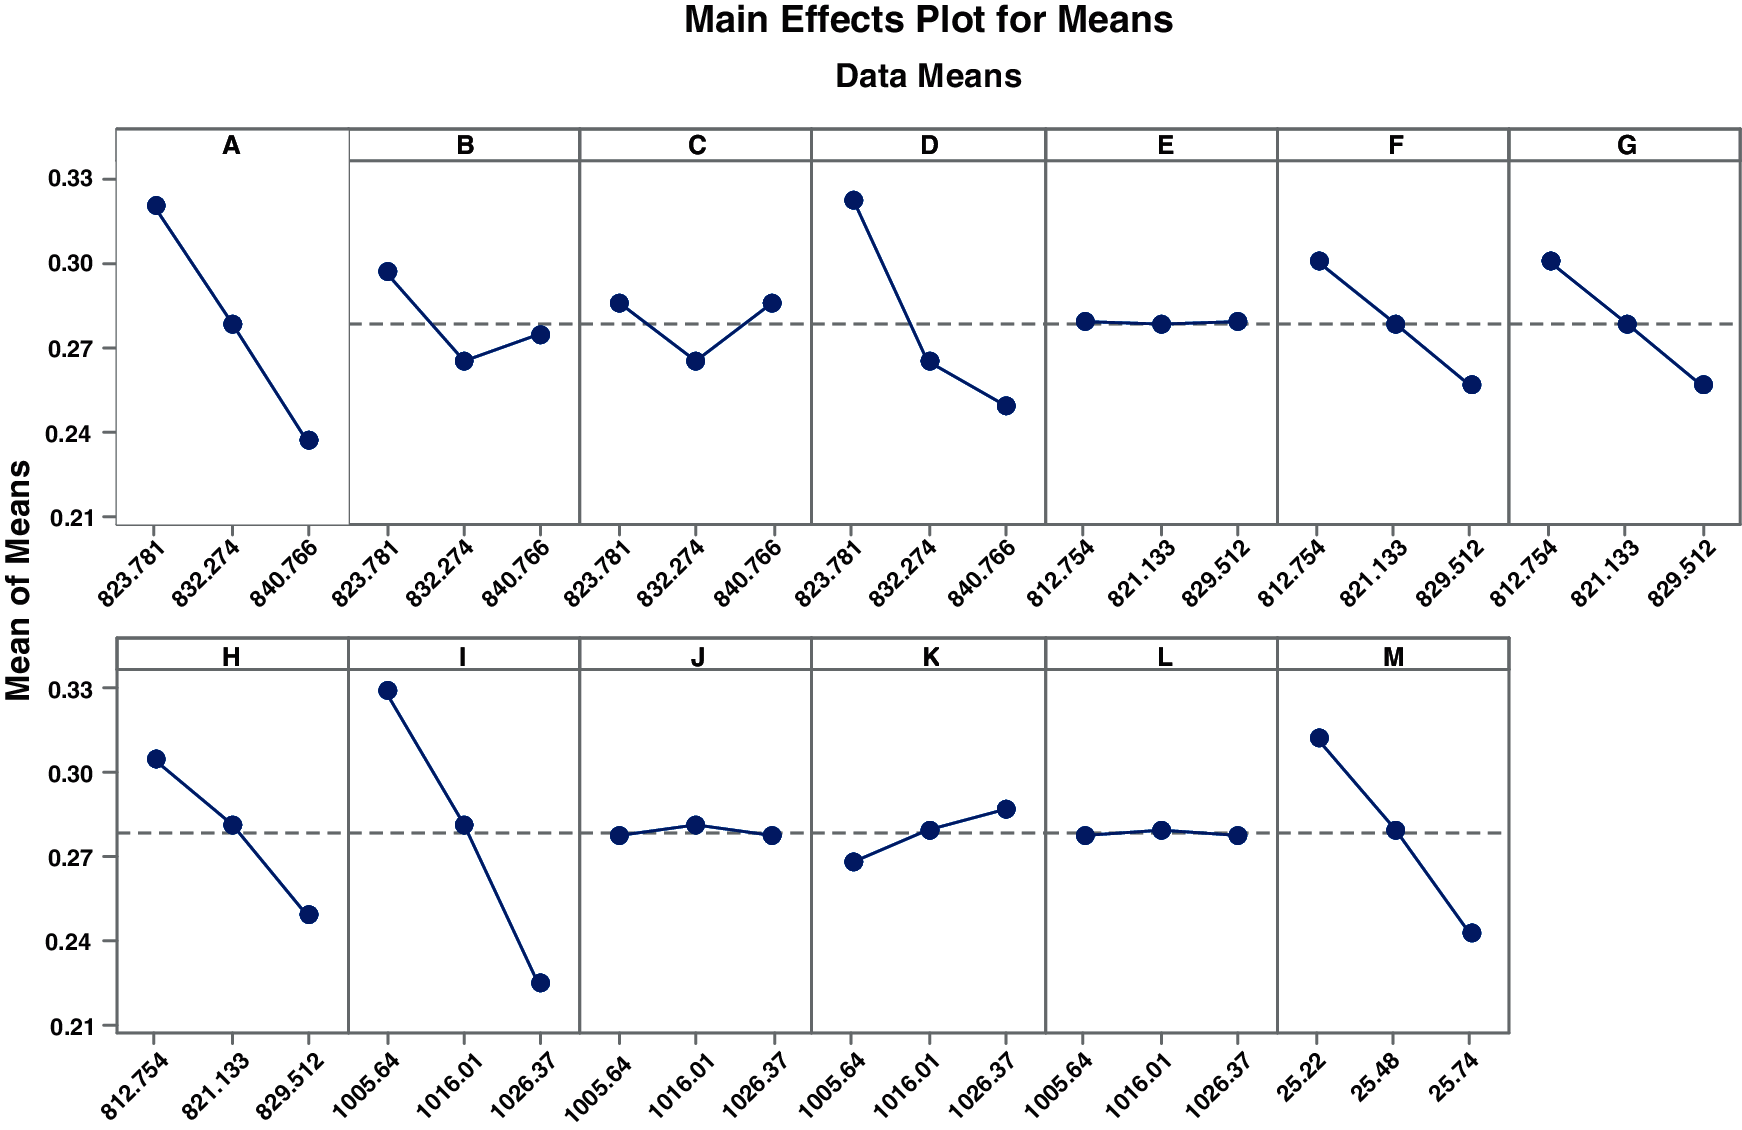
Figure 14: Main effects plots for means
c) Linear regression analysis
To describe the statistical relationship between the control factors and response factor in terms of an equation, a linear regression analysis has been conducted. Tab. 11 shows the regression coefficients obtained from the analysis and Tab. 12 shows the model summary. It is to be noted that the P-value is less than 0.05 in many cases which confirms that the results are good to believe. The R-squared of the model as shown in Tab. 12 is found to be 95% nearly which states that the present model explains the variability of response data around its means. Hence the model fits better to the data.
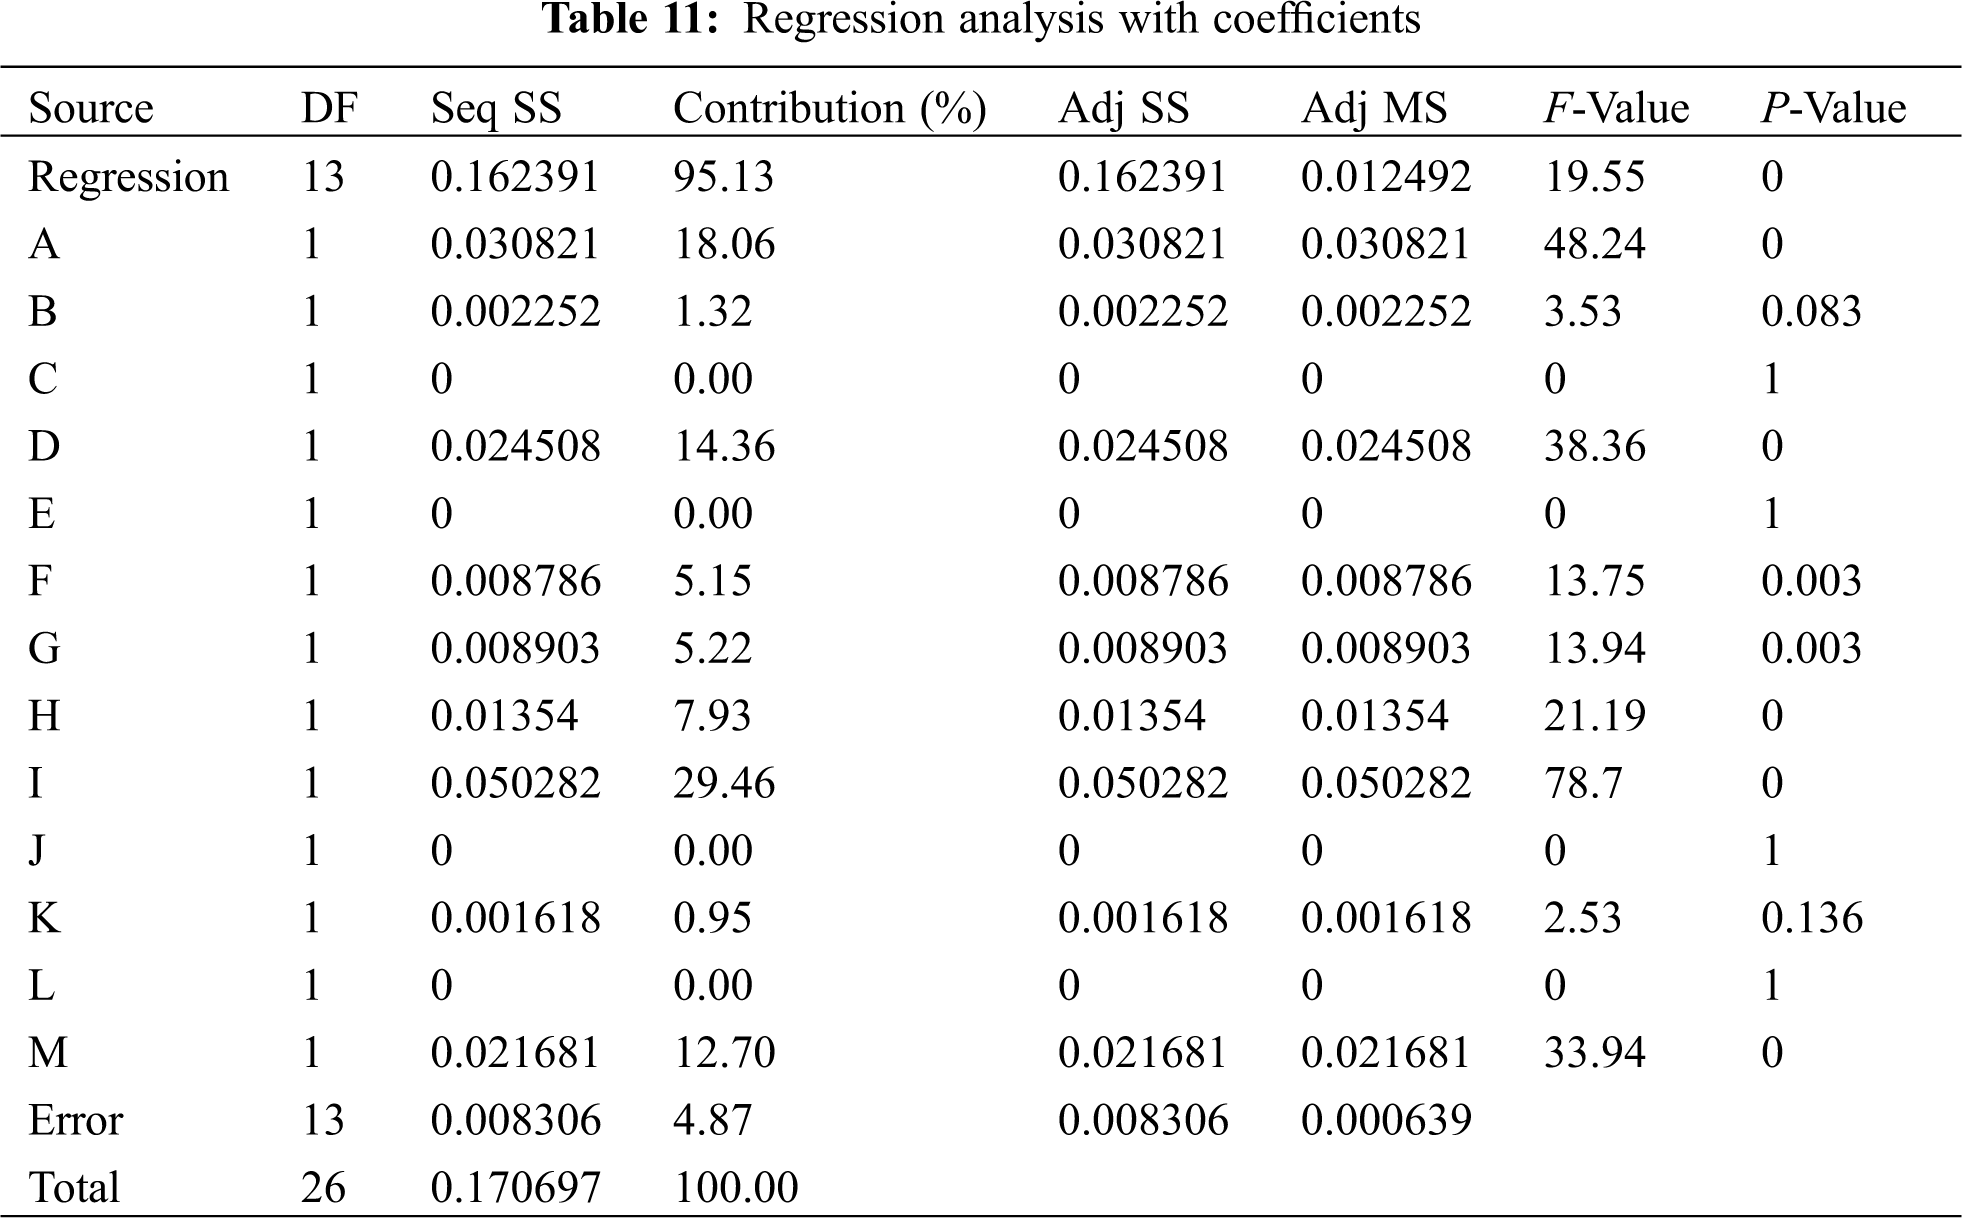
Model Summary:
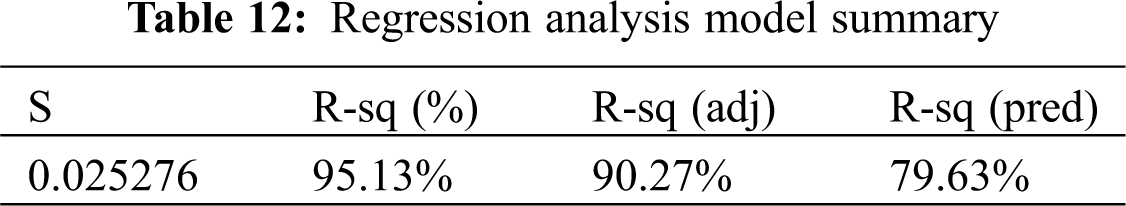
Based on regression analysis, Regression Equation is formulated as below:
The equation clearly indicates that the coefficients of I, A, D and M are higher and showing the major contribution to the hydraulic unbalance (Bold highlighted in equation). These results are in alignment with the output obtained from S/N ratio analysis and ANOM. Hence the vane pitch at inlet and outlet of the vane near shroud is having more impact on the vibrations. To limit vibration displacement to 100 μm, the hydraulic eccentricity should be limited below 400 μm. From the statistical technique it is found that the locations at impeller vane inlet (Control factor I) and outlet (Control factor A) at shroud side are sensitive to the vane pitch deviation. From the Tab. 8, it is clear that for limiting hydraulic eccentricity to 400 μm, I and A control factors have a vane pitch level of 2 which is corresponding to 2% of deviation.
The above statistical study reflects that, the prime location of vane pitch deviation to be noted to limit of deviation. With these inputs, two impellers P2 and P3 are manufactured adhering to the tolerance limits of 2% on impeller shroud. With these tolerances, the hydraulic eccentricity is less than 400 microns. The eccentricities obtained are 60 microns and 72 microns respectively with vane pitch tolerance of 1.2% and 1.3% on shroud surface, respectively. The impellers are placed in P2 and P3 locations at site and retested under similar conditions. The vibration displacements on motor top surface are measured for both the pumps. Tab. 13 shows the hydraulic eccentricity with vibration displacement. In line with Tab. 13, the vibration spectrum of P2 and P3 pumps is shown Figs. 15 and 16, respectively. From the measurements, it is clear that the vibrations are much below the maximum limit of 100 μm. This is possible by limiting hydraulic eccentricity and limiting the vane pitch deviations.
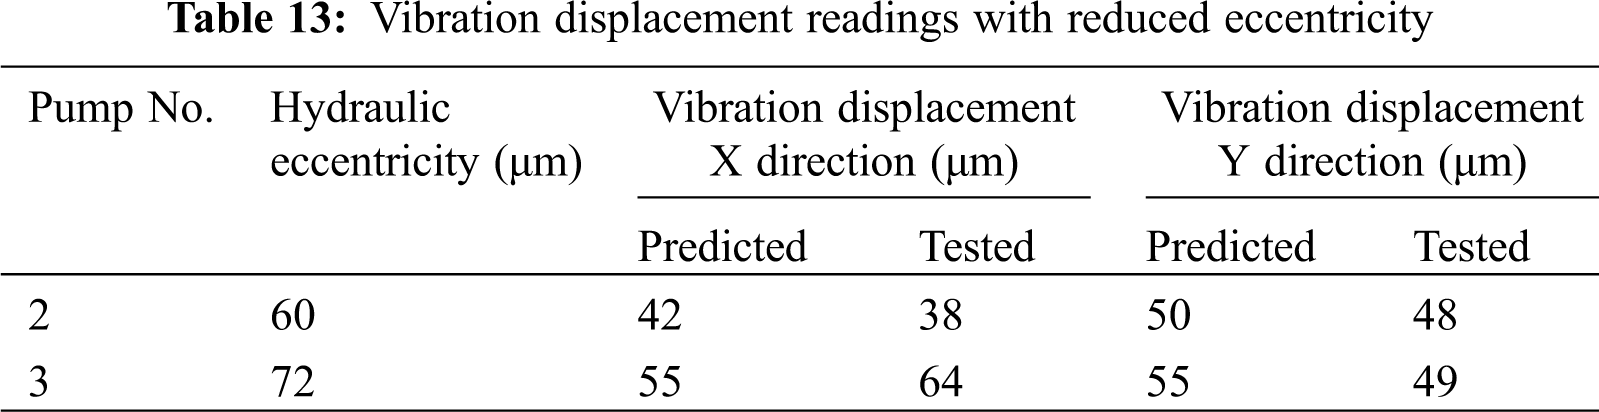
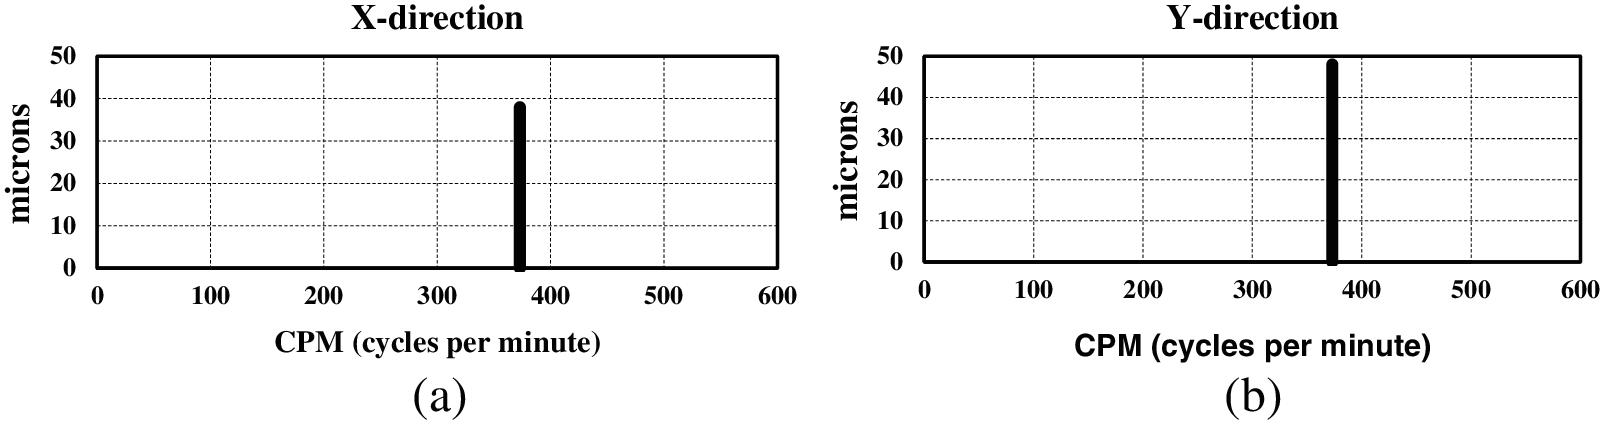
Figure 15: Vibration displacements of MNDE after hydraulic balancing for pump No. 2 (a) X direction (b) Y direction
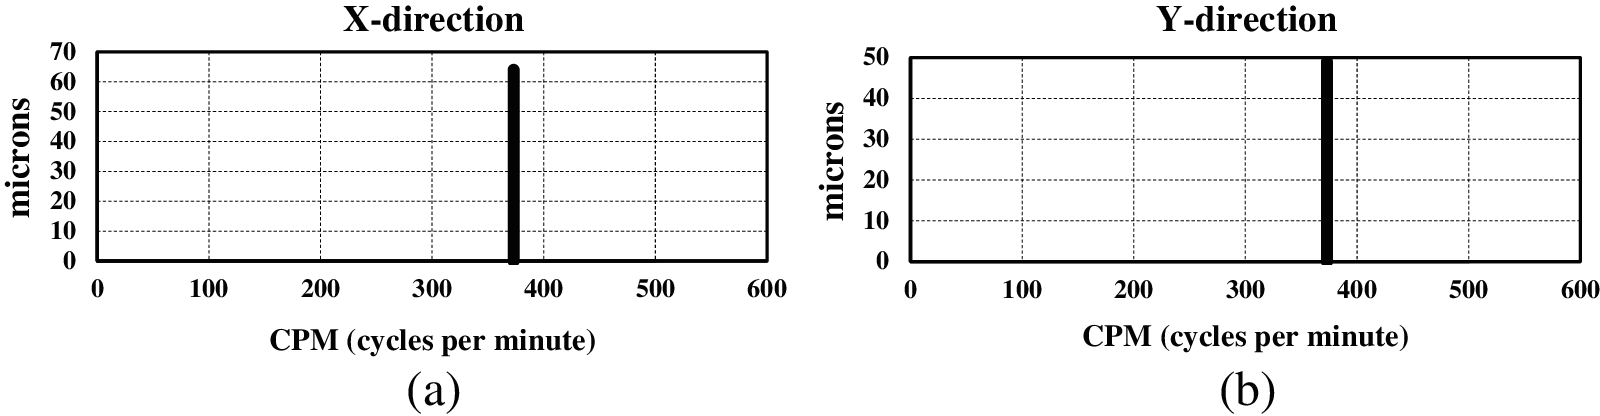
Figure 16: Vibration displacements of MNDE after hydraulic balancing for pump No. 3 (a) X direction (b) Y direction
The results clearly indicate the importance of vane pitch tolerances in a centrifugal pump impeller which further defines the hydraulic eccentricity and hence the vibration magnitudes.
The hydraulic unbalance of an impeller in terms of hydraulic eccentricity defines the quality with respect to pump vibrations. The hydraulic eccentricity of any impeller should be below a specific limit to control the vibrations known as critical hydraulic eccentricity (ech). The critical hydraulic eccentricity of an impeller and the vane pitch tolerances are found using numerical simulations. A validated numerical methodology approach which is “One-way FSI” has been used to find the critical hydraulic unbalance of a vertical turbine impeller. The critical hydraulic eccentricity ech achieved is 400 microns for a selected VT pump impeller rotating at 370 rpm.
The vane pitch tolerance of an impeller is function of ech. Hence, Design of Experiments (DOE) approach is used to find the vane pitch tolerance to limit the hydraulic eccentricity and vibrations. Taguchi’s method of design of experiments method is followed to identify the control factors affecting hydraulic eccentricity. The control factor ‘I’ (shroud outlet) has highest contribution (29.46%) followed by ‘A’ (shroud inlet) (18.06%) and D (14.36%). The effect of these control factors is significant in increase of hydraulic eccentricity, which needs to be controlled to minimize the vibration. Hence, the shroud portion of an impeller is the primary control factor to limit the tolerance. From the orthogonal matrices of the 27 models with hydraulic eccentricity, 3 models are found to be crossing the ech. In all these models the limiting tolerance is Level 2 at shroud outlet which is 2%. Hence, the tolerance limit is 2% on shroud outlet for ech of 400 μm. Moreover, based on regression equation given, if tolerance of 2% is considered, then eccentricity is less than critical eccentricity of 400 μm.
By controlling the geometrical vane pitch dimensions, two impellers are casted for P2 and P3 pumps with reduced hydraulic eccentricities of 60 and 72 μm, respectively, which are less than critical eccentricity as estimated. The predicted and tested vibration displacements are within 10% deviation.
It is found that, if the dimensional variation of the vane pitch is restricted within 2%, then it is possible to control the hydraulic eccentricity and vibrations within specified limit.
Acknowledgement: The authors would like to acknowledge Kirloskar Brothers Limited for facilitating the research work.
Funding Statement: The authors have received no specific funding for this study.
Conflicts of Interest: The authors declare that they have no conflicts of interest to report regarding the present study.
1. Douglas, C. M. (2005). Design and analysis of experiments. New York: John Wiley & Sons. [Google Scholar]
2. Taguchi, G., Subir, C., Yuin, W. (2003). Taguchi’s quality engineering handbook. New York: John Wiley & Sons. [Google Scholar]
3. International Standard ISO 9906 (1999). Rotodynamic Pumps-Hydraulic performance acceptance tests-Grades 1 and 2. Geneva, Switzerland: International Standardization Organization. [Google Scholar]
4. International Standard (2009). ISO 10816-7 Mechanical vibration—Evaluation of machine vibration by measurements on non-rotating parts–Part 7: rotodynamic pumps for industrial applications, including measurements on rotating shafts. Geneva, Switzerland: International Standardization Organization. [Google Scholar]
5. Byrne, D., Taguchi, S. (1987). The Taguchi approach to parameter design. Quality Progress, 20, 19–26. [Google Scholar]
6. Guelich, J., Jud, W., Hughes, S. F. (1987). Review of parameters influencing hydraulic forces on centrifugal impellers. Proceedings of Institution of Mechanical Engineers, 201, 164–174. [Google Scholar]
7. Tsujimoto, Y., Acosta, A. J., Brennen, C. E. (1988). Theoretical study of fluid forces on a centrifugal impeller rotating and whirling in a volute. Journal of Vibration and Acoustics, 110(3), 263–269. [Google Scholar]
8. Yoshida, Y., Tsujimoto, Y., Kawakami, T., Sakatani, T. (1998). Unbalance hydraulic forces caused by geometrical manufacturing deviations of centrifugal impellers. Journal of Fluids Engineering, 120(531), 531–537. [Google Scholar]
9. Gopalakrishnanan, S. (1999). Pump research and development: Past, present, and future-an American perspective. Journal of Fluids Engineering, 121(2), 237–247. [Google Scholar]
10. Baxter, N. L. (2002). Case studies from 25 years of trouble shooting vibration problems. Practical Failure Analysis, 2(1), 51–68. DOI 10.1007/BF02715392. [Google Scholar] [CrossRef]
11. de Souza, B., Niven, A., Daly, J. (2008). Single-blade impeller development using the design of experiments method in combination with numerical simulation. Journal of Process Mechanical Engineering, 222(3), 135–142. DOI 10.1243/09544089JPME218. [Google Scholar] [CrossRef]
12. Wang, W., Henry, W. S., Conley, J. G. (2009). Sand casting dimensional control. In: Rapid tooling guidelines for sand casting, pp. 69–98. Berlin: Springer. [Google Scholar]
13. Sung, K., Young-Seok, C., Kyoung, L., Joon-Yong, Y. (2009). Design optimization of centrifugal pump impellers in a fixed meridional geometry using DOE. International Journal of Fluid Machinery and Systems, 2(2), 172–178. DOI 10.5293/IJFMS.2009.2.2.172. [Google Scholar] [CrossRef]
14. Zhou, L., Shi, W., Wu, S. (2015). Performance optimization in a centrifugal pump impeller by orthogonal experiment and numerical simulation. Advances in Mechanical Engineering, 5. DOI 10.1155/2013/385809. [Google Scholar] [CrossRef]
15. Abhijeet, B., Vante, N. (2016). Quality improvement for dimensional variations in automotive casting using quality control tools. IOSR Journal of Mechanical and Civil Engineering, 12(2), 87–04. [Google Scholar]
16. Han, X. D., Kang, Y., Li, D., Zhao, W. G. (2018). Impeller optimized design of the centrifugal pump: A numerical and experimental investigation. Energies, 11(6), 1444. DOI 10.3390/en11061444. [Google Scholar] [CrossRef]
17. Si, Q., Bois, G., Liao, M., Zhang, H., Cui, Q. et al. (2020). Comparative study on centrifugal pump designs and two-phase flow characteristics under inlet gas entrainment conditions. Energies, 13, 65. DOI 10.3390/en13010065. [Google Scholar] [CrossRef]
18. Kirloskar Brothers Limited. Engineering standard. Casting inspection guidelines. Rev. 1, pp. 1–16. [Google Scholar]
19. Hydraulic Institute Standard (2009). Rotodynamic pumps for vibration measurements and allowable values (HIS Standard No. 9.6.4). ANSI HI 9.6.4 Standard. [Google Scholar]
20. International Standard ISO 1940-1 (2003). Mechanical vibration balancing quality requirements for rotors. Geneva, Switzerland: International Standardization Organization. [Google Scholar]
21. Birajdar, R., Keste, A. (2019). Prediction of flow-induced vibrations due to impeller hydraulic unbalance in vertical turbine pumps using one-way fluid−structure interaction. Journal of Vibration Engineering & Technologies, 8, 417–430. [Google Scholar]
 | This work is licensed under a Creative Commons Attribution 4.0 International License, which permits unrestricted use, distribution, and reproduction in any medium, provided the original work is properly cited. |