| Sound & Vibration |
DOI: 10.32604/sv.2022.014334
ARTICLE
Appraisal of Urban Road Traffic Noise in tier-II City (Surat City), India
1M. S. Patel Department of Civil Engineering, C. S. Patel Institute of Technology, CHARUSAT, Anand, India
2Civil Engineering Department, Sardar Vallabhbhai National Institute of Technology, Surat, India
*Corresponding Author: Dipeshkumar R. Sonaviya. Email: dipeshsonaviya2589@gmail.com
Received: 18 September 2020; Accepted: 19 October 2020
Abstract: Urban road traffic noise pollution has always been identified as a severe problem that affects urban populants. In developing nation, road traffic noise pollution depends on the composition of heterogeneous traffic composition. These traffic compositions contain vehicles, which have different sizes, speeds variations, a different dimension of vehicles. Environmental noise measurements have been carried out during day-time and night-time in different locations of tier-II city of India. The noise levels have been continuously measured over 24 h periods using kimo DB 300 class-2 noise level meter. The data contained in this research paper represent 768 measurement hours. All the information has been used to investigate the time patterns of the noise levels under a wide range of different conditions and to study the relationships between noise levels and traffic in urban areas. Maximum LAeq was observed 73.3 dB(A) at B14 location and the minimum was recorded 65.7 dB(A) at C3 location, which was greater than the central pollution control board (CPCB) prescribed limits during night time. A major reason for the generation of road traffic noise is due to the equal composition of 2-wheeler and 4-wheeler on the arterial road and heavy vehicles were recorded during morning peak and evening peak even though they are prohibited during peak hours.
Keywords: Noise monitoring; road traffic noise; traffic compositions; urban context
Various factors contribute to increase the noise levels in urban areas. One of the factors is the increase in the urban population, which contributes to high traffic volume combined with increased intensity [1]. In most urban areas, the corridors are developed in close proximity where people live and work, which leads to limited space and thus increases the number of high-rise buildings [2]. This type of settlement creates a dense environment in urban areas, thus increasing the traffic volume. Numerous countries have implemented new technologies to control noise pollution in urban areas [3]. For example, low noise generating vehicular engines, changes in quality of tires, changes in road material. These technologies have proven to reduce the noise on an individual scale. However, the overall noise pollution in urban areas is still increasing because of increasing traffic volume.
Road traffic noise is the most significant source of environmental noise pollution in cities. Noise is almost one of the harmful agents for citizenships; therefore, many countries have introduced noise emission limits for vehicles and issued other legislation to reduce road traffic noise [4]. In recent years, in certain countries, new restricting laws to control civic road traffic noise have been performed [5].
According to the literature available, it has been concluded that a large number of people are exposed to high traffic noise levels in the urban areas. KIMO DB300/2 sound level meter was used for noise data collection. The sound level meter is an acoustic measurement instrument from France with the main features of a conventional and integrating-averaging sound level meter and analyzer with storage.
The study area selected for noise mapping is Surat City (Fig. 1). The city covers an area about 326.515 sq. km and divided in seven zones. This research is based on the results of noise level measurements and traffic monitoring carried out 31 different locations of tier-II city (Surat City) of Gujarat state, India. Surat is a city located in the western part of India in the state of Gujarat. It is one of the most dynamic city of India with one of the fastest growth rates due to immigration from various parts of Gujarat and other states of India. The modern city of Surat is one of the fastest-growing places in the state of Gujarat. Famous all over the world for its diamond and textile business, Surat is the second-largest city in the state after Ahmedabad. Surat is regarded as 4th fastest developing cities of India with a bustling metropolitan area home to over 6 million people. According to a recent Census of India (2011), Surat has recorded a growth of 63.3% in its population from 2001 to 2011 [6].

Figure 1: Location map of Surat city
Fig. 2 depics study area selected for noise monitoring. In South-West zone, Selected study area for the survey was 5 km stretch of the Athwa-Dumas corridor and 4 km stretch of udhna-magdalla because these corridors contain all type of activities which can be affected by vehicular noise pollution. Activity refers to schools, colleges, hospitals, commercial areas, and residential areas. Noise monitoring was done at 31 locations in and around these two arterial roads with traffic volume study and traffic speed study. Survey locations along the left side of the athwa-dummas corridor are named as A1, A2…A8 and along the right side of the Athwa-Dummas corridor are named as B1, B2…B8. In the same way survey location along the left side of the Magdalla-Udhna corridor are named as A9, A10…A14 and along the right side named as B9, B10,…B14. Also the sub-arterial roads connecting this two arterial roads are names as C1, C2, C3 [7].
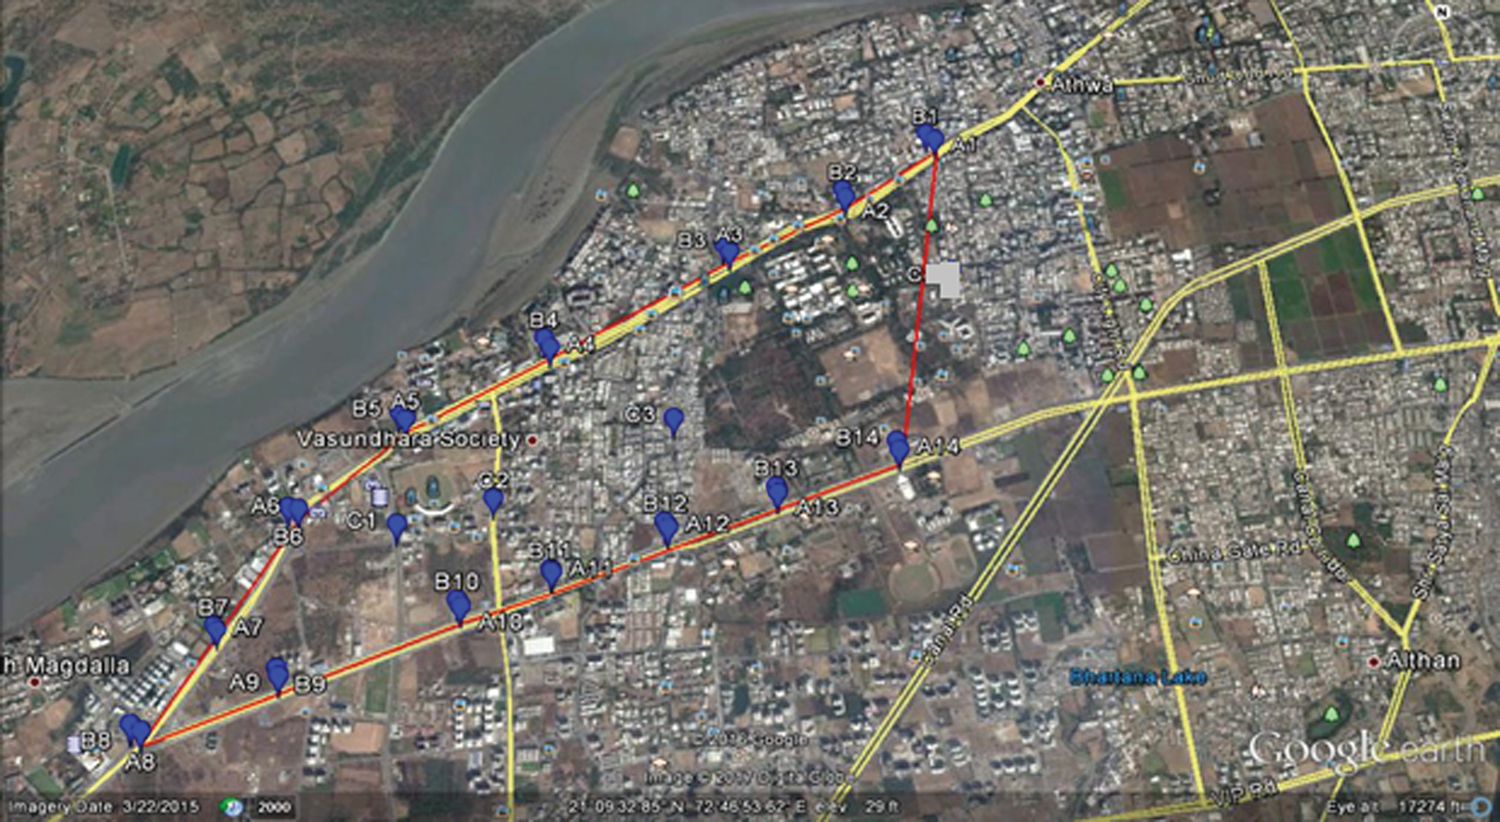
Figure 2: Map of South-West zone of Surat City showing study area
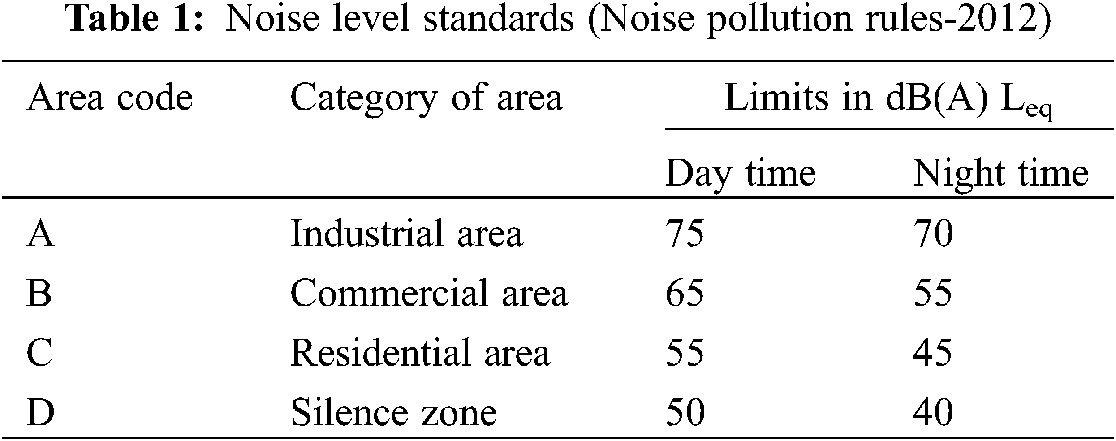
The study was conducted in month of May 2016 and done at 31 locations of South-West zone of Surat City’s arterial roads, with traffic volume and traffic speed. Measurements were carried out during Monday to Friday, the working days. Field measurements have been taken by using the KIMO DB 300/2, automatic sound level meter for 24-h duration. Monitoring was divided in two parts as per CPCB guidelines, day time 6.00 am to 10.00 pm and night time 10.00 pm to 6.00 am [8]. The sound level meter is calibrated prior to each measurement using a calibrator. Sound level meter is mounted on a tripod at 1.2 m above the floor level. The counts of number of vehicles that crossed the point of measurement from either direction on the road were recorded by videography. Vehicles were divided into five categories like 2-wheelers (motorcycle, mopeds), 3-wheelers (auto rickshaw), 4-wheelers (cars), bus, and truck. The speeds were also monitored with a hand-held radar gun along with the noise level. Table 1 depicts central pollution control board (CPCB) standards.
Noise monitoring was done on each location using KIMO DB 300/2 sound level meter. This instrument was set for A-weighting continuous 24 h and all the readings were taken as per CPCB protocol. LAeq with a 1-s sampling frequency was set in the sound level meter. Hence, for one individual location, 57,600 readings of day time and 28,800 readings of night time were recorded and stored. Hence, for all three zones, 35 lac readings were recorded and stored. Noise descriptors like Lmax, Lmin, L10, L50, L90, and LAeq, were assessed and are given in Table 2 for all locations.
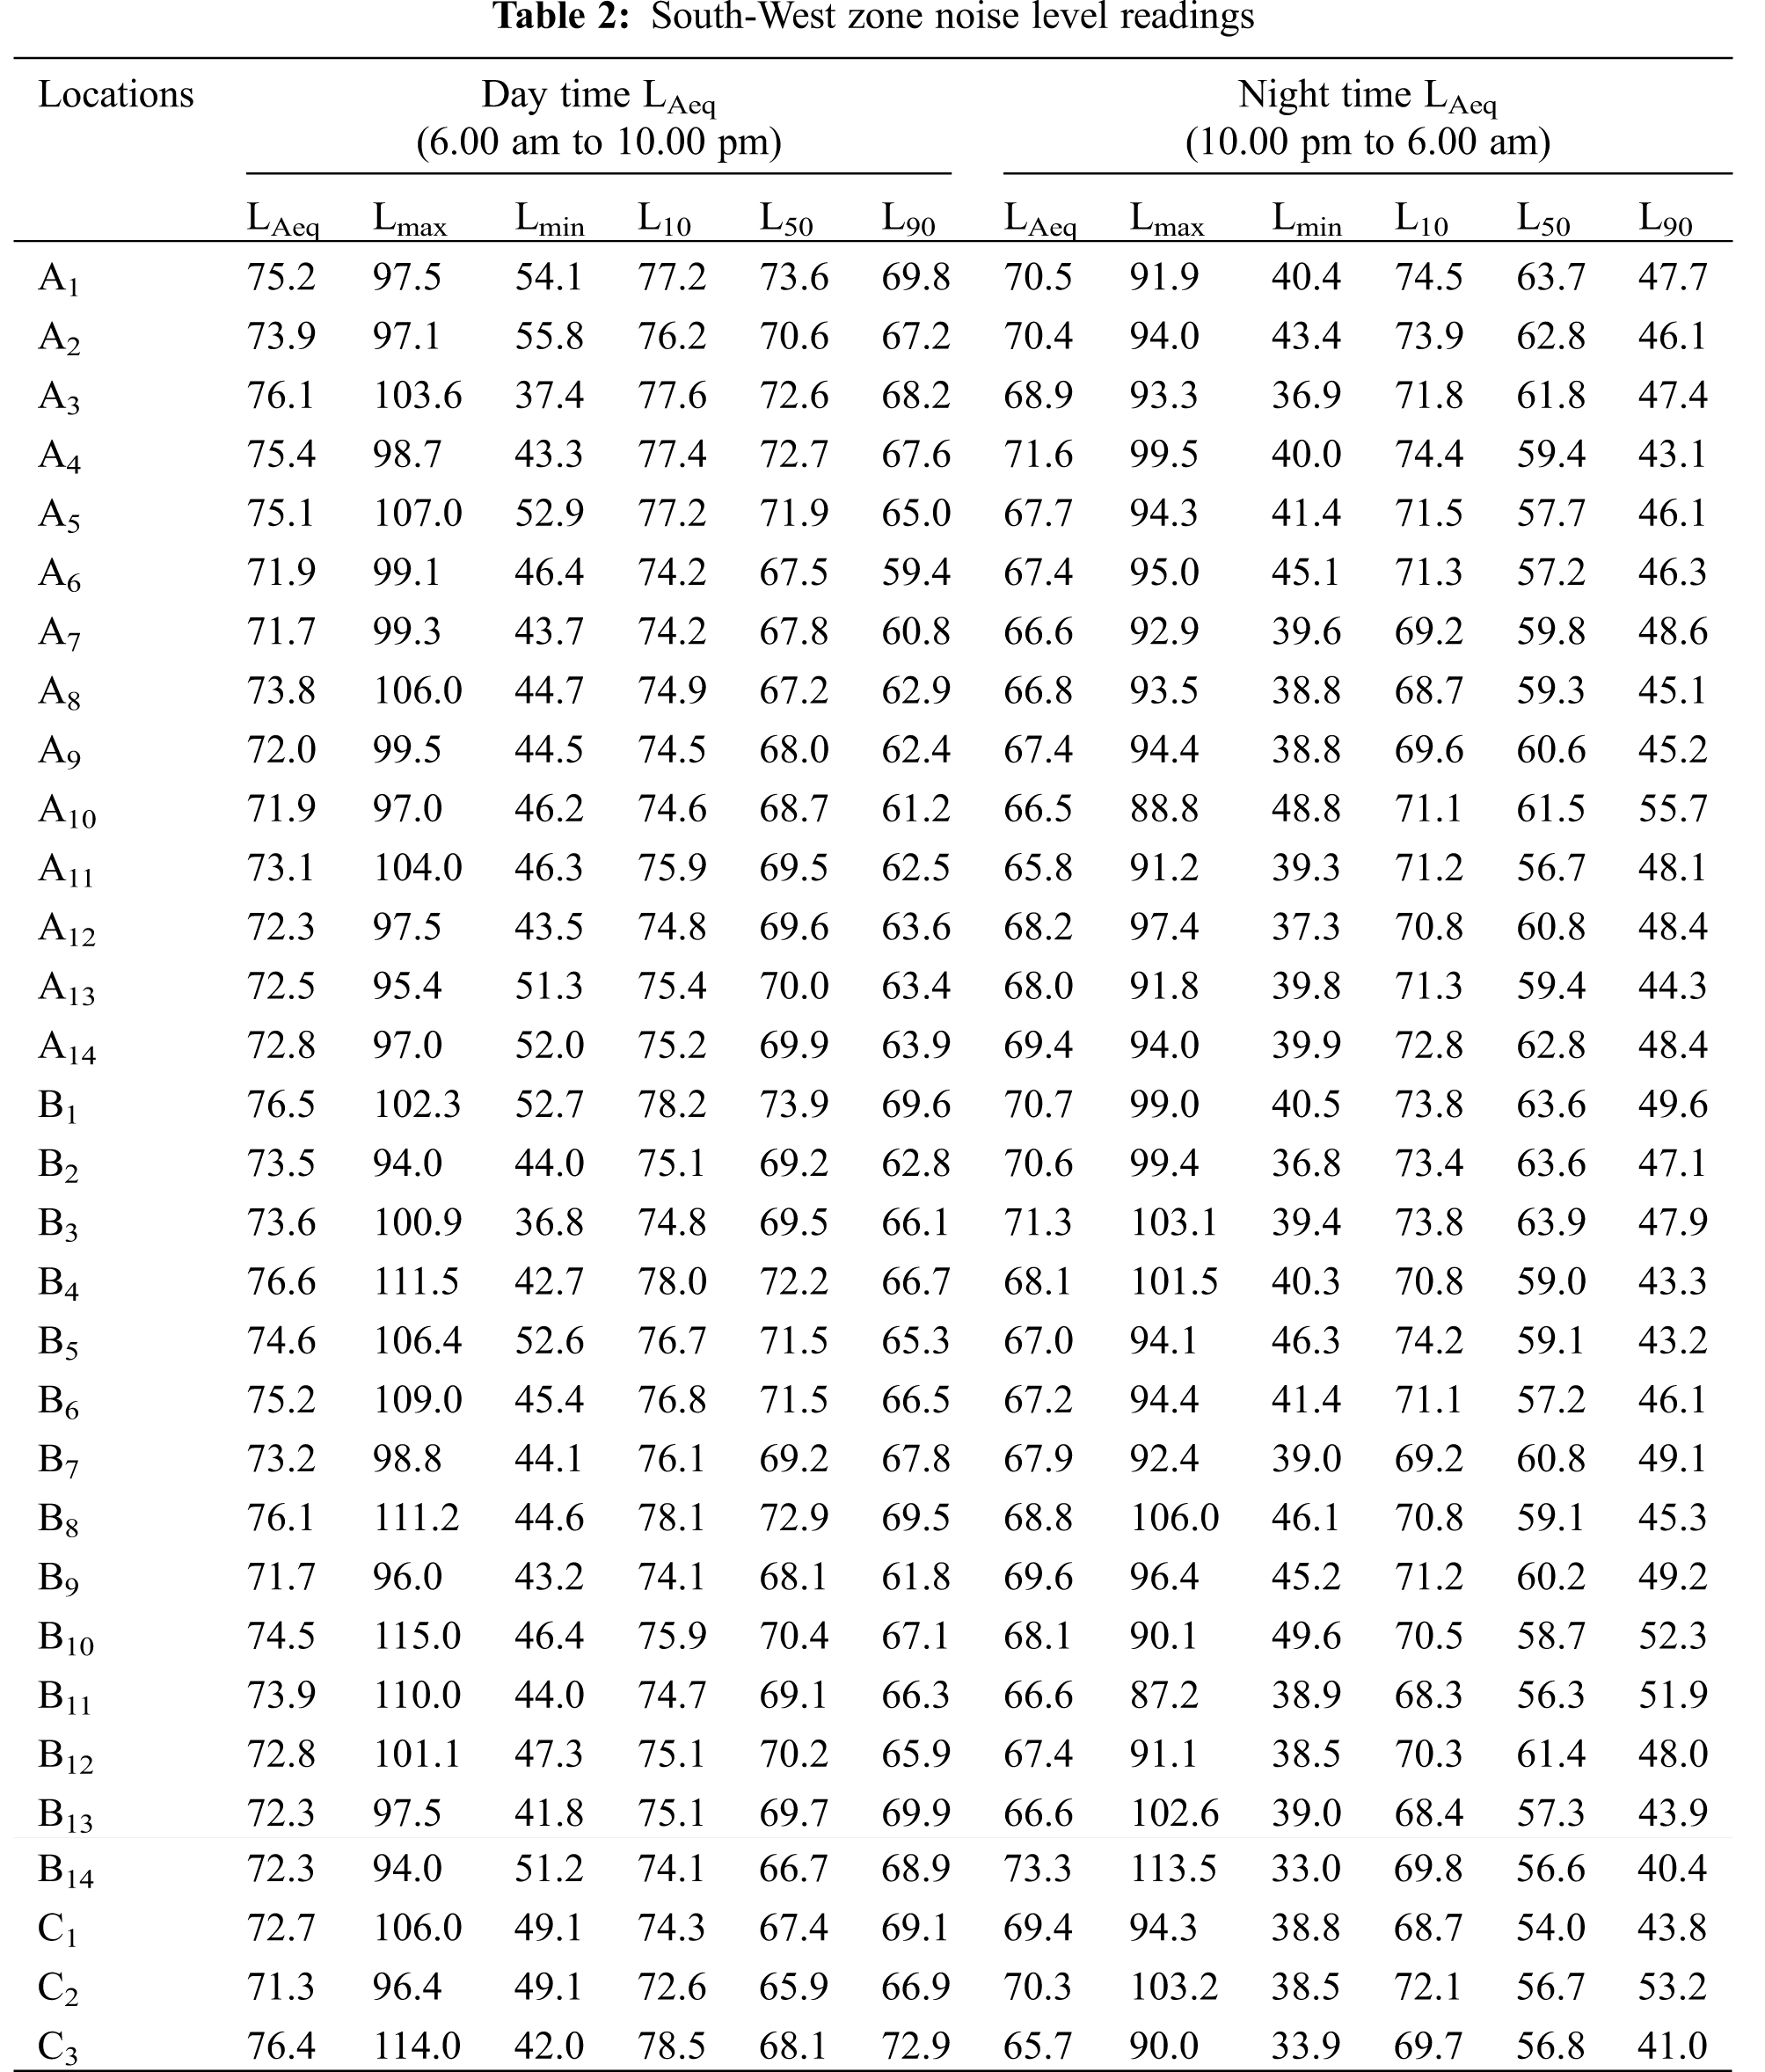
Fig. 3 depicts the day time noise indices viz. LAeq, of different locations of South-West zone during the working days (Monday to Friday). It clearly shows that the highest LAeq observed was 76.6 dB(A) at B4 location. The day time LAeq observed on all locations of South-West zone was greater than the prescribed CPCB limits during day time, which is 50 dB(A) for silence zone, 55 dB(A) for residential area and 65 dB(A) for commercial area.
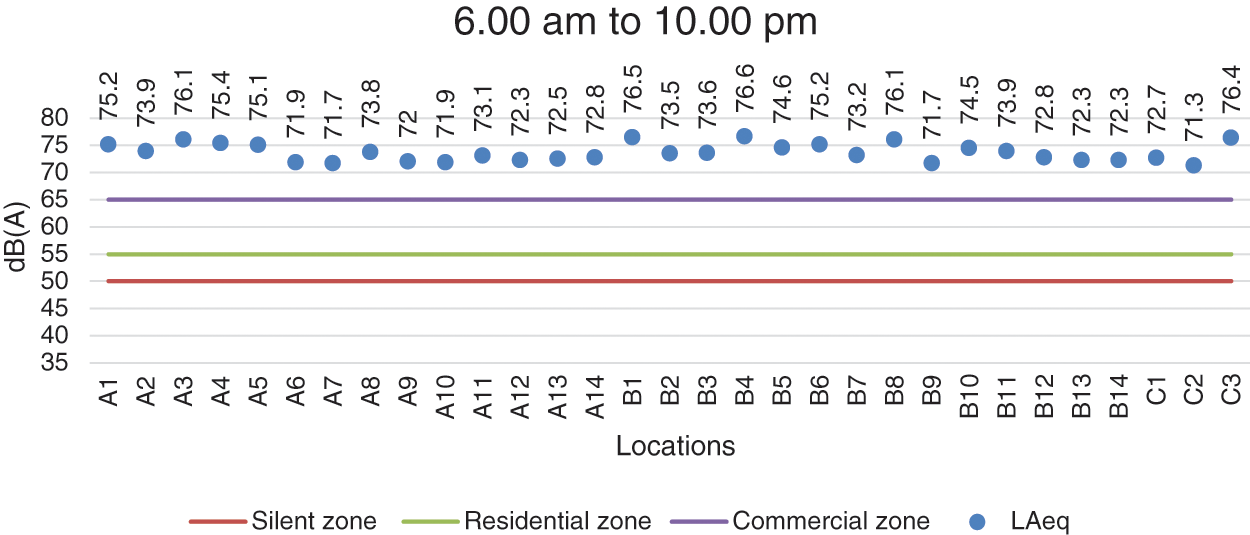
Figure 3: South-West zone-day time LAeq values at all monitoring locations
Fig. 4 depicts the night time noise indices viz. LAeq, of different locations of South-West zone. Maximum LAeq was observed 73.3 dB(A) at B14 location and minimum was recorded 65.7 dB(A) at C3 location at night time, which was greater than the prescribed CPCB limits during night time. All recoded LAeq values were above the prescribe CPCB limits.
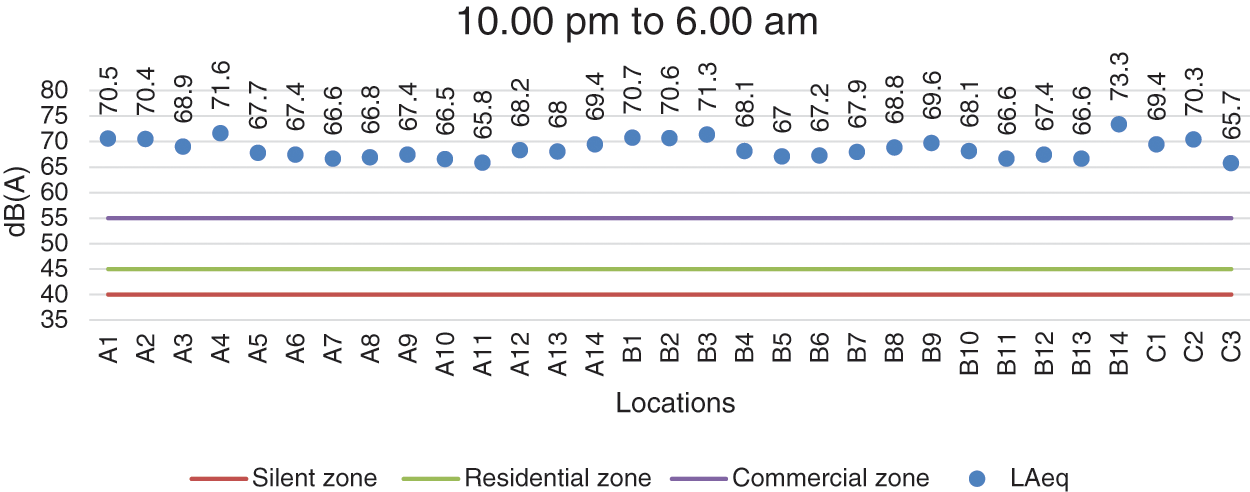
Figure 4: South-West zone-night time LAeq values at all monitoring locations
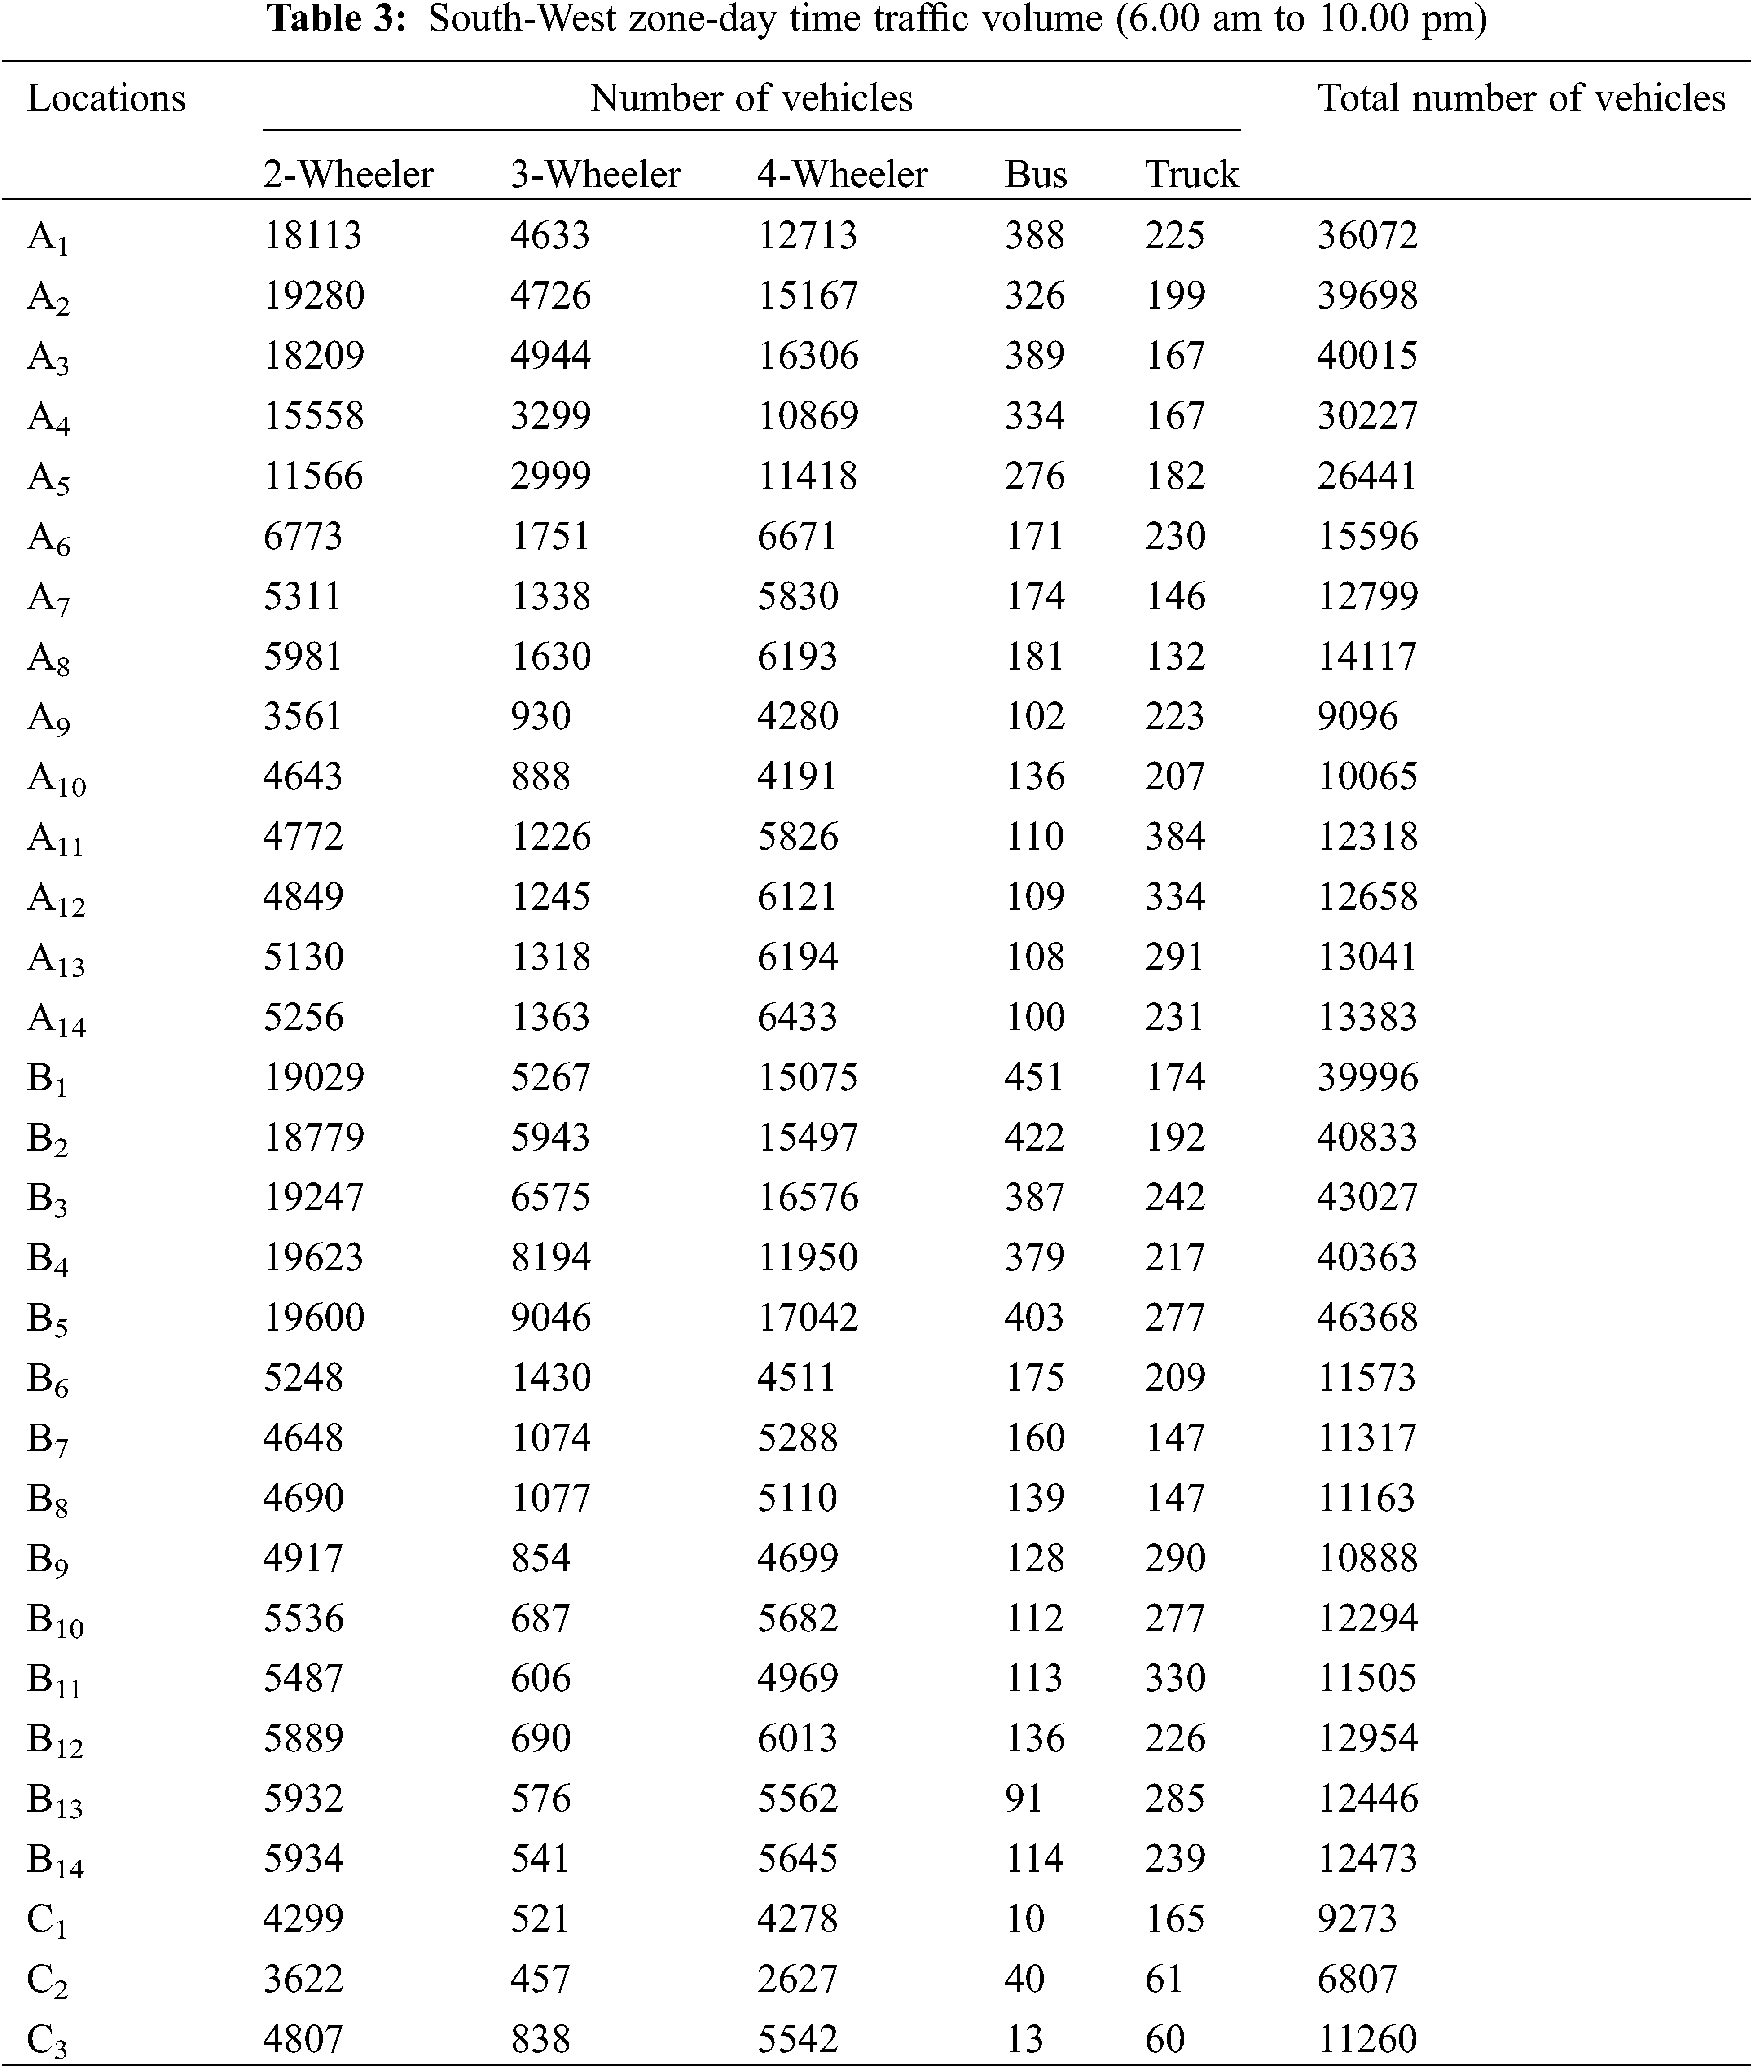
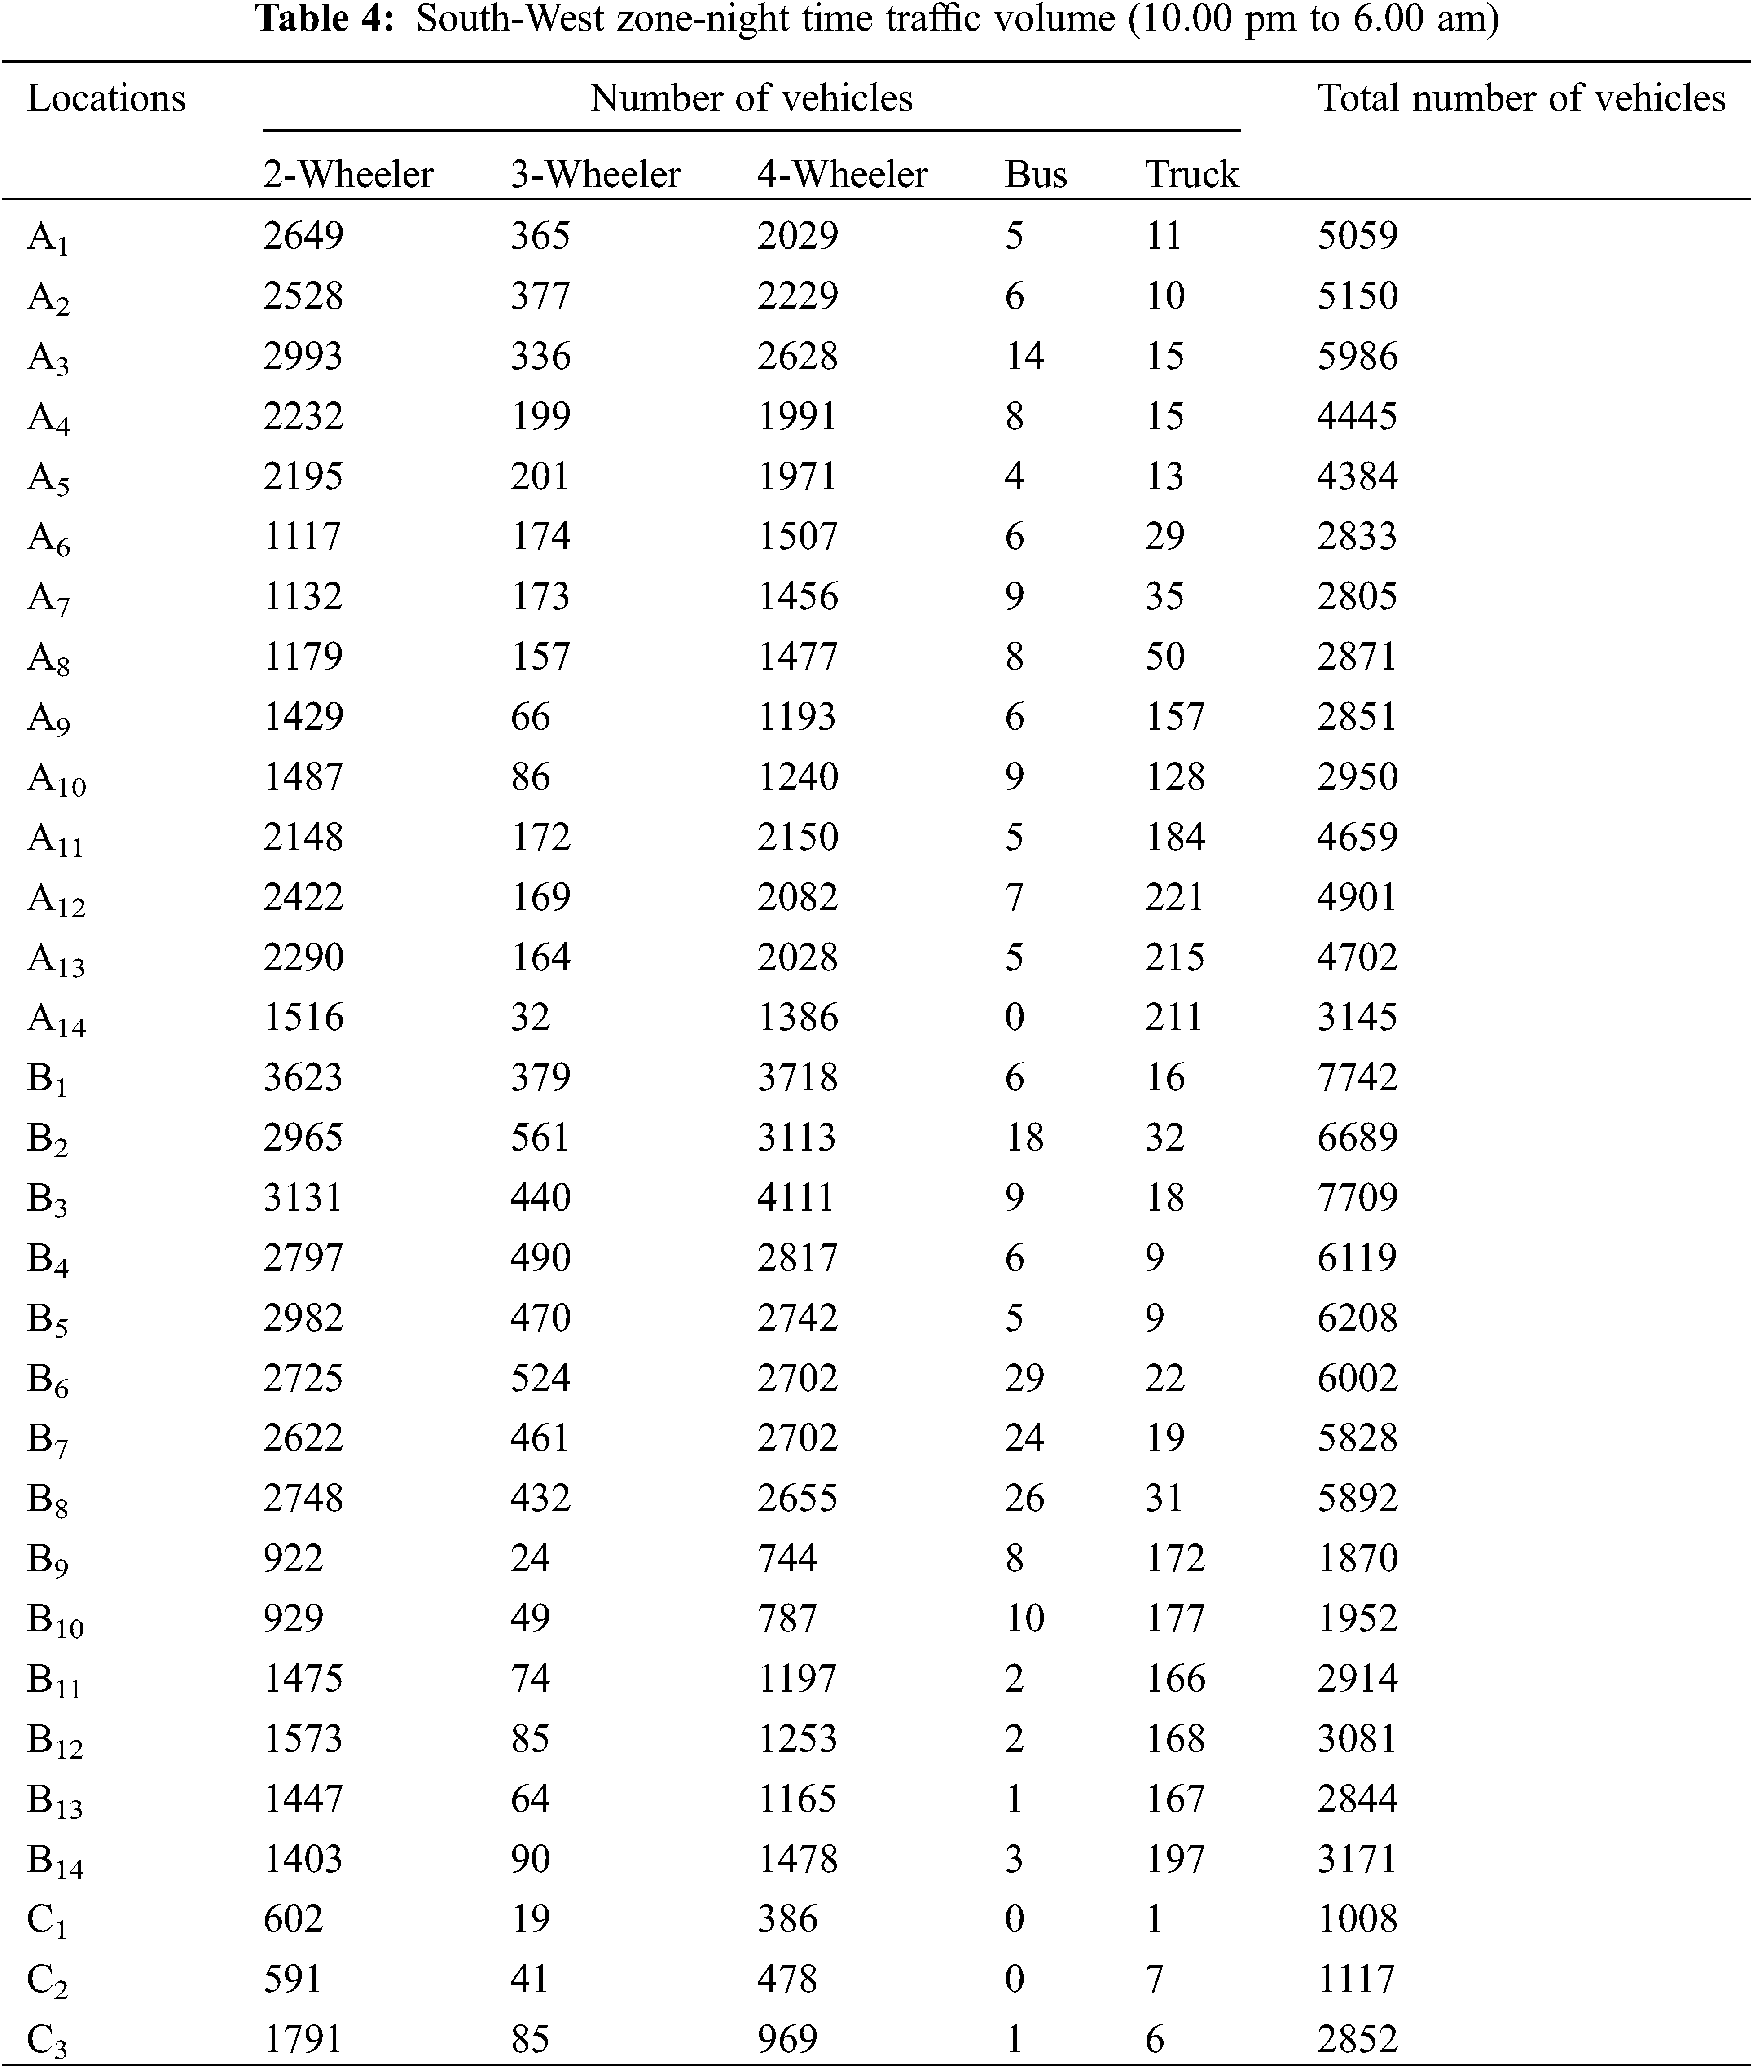
Tables 3 and 4 give the classified as well as total traffic volume count at all 31 locations of South-West zone for day time and night time, respectively.
The traffic volume composition for day and night time at different locations of South-West zone in the study stretch was evaluated from the classified vehicular count data. Figs. 5 to 8 depict the composition of all category of vehicles for Athwa-Dumas and Magdalla-Udhna road, both for day time and night time.
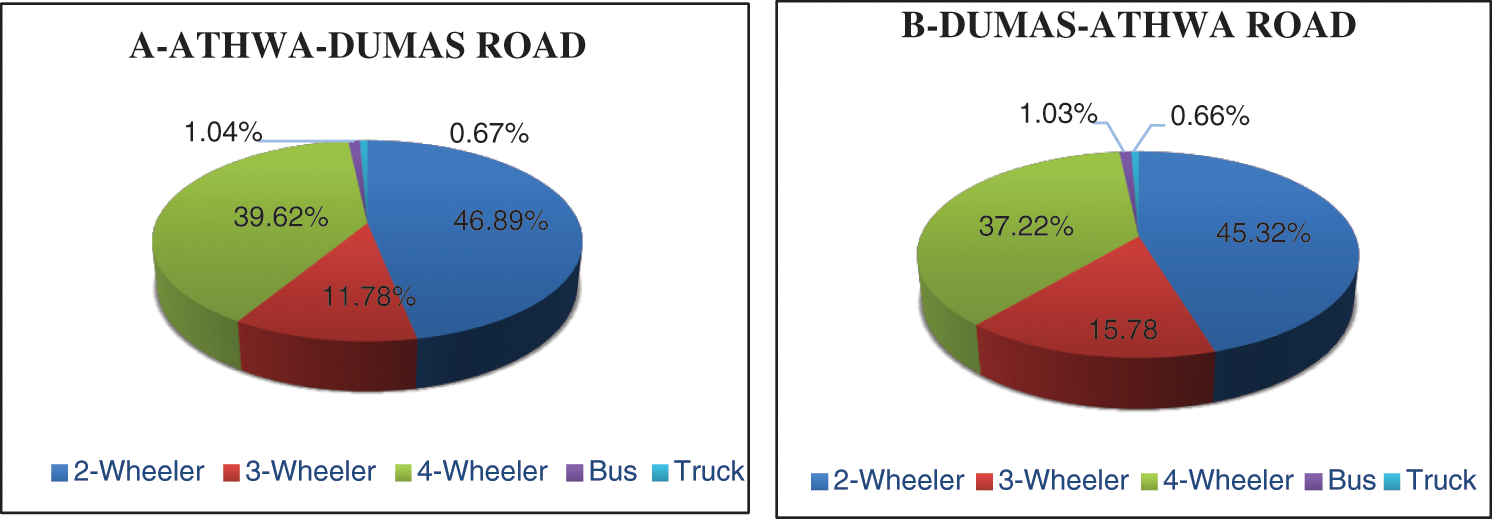
Figure 5: Day time traffic composition data on Athwa-Dumas road
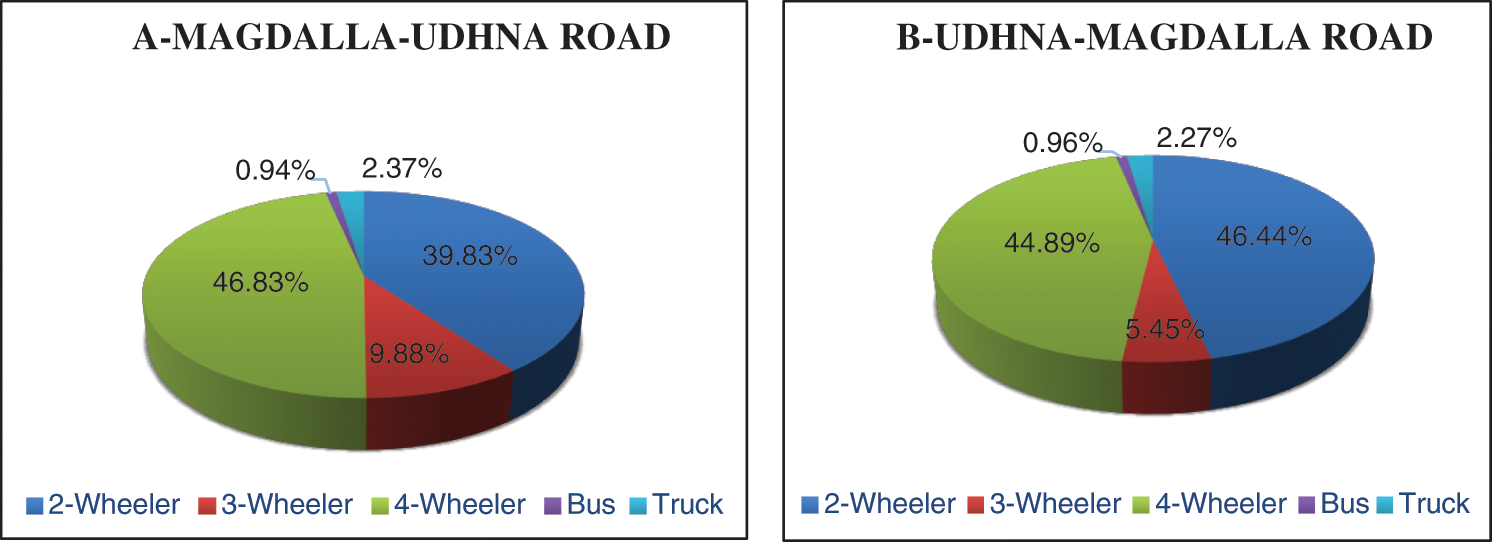
Figure 6: Day time traffic composition data on Udhna-Magdalla road
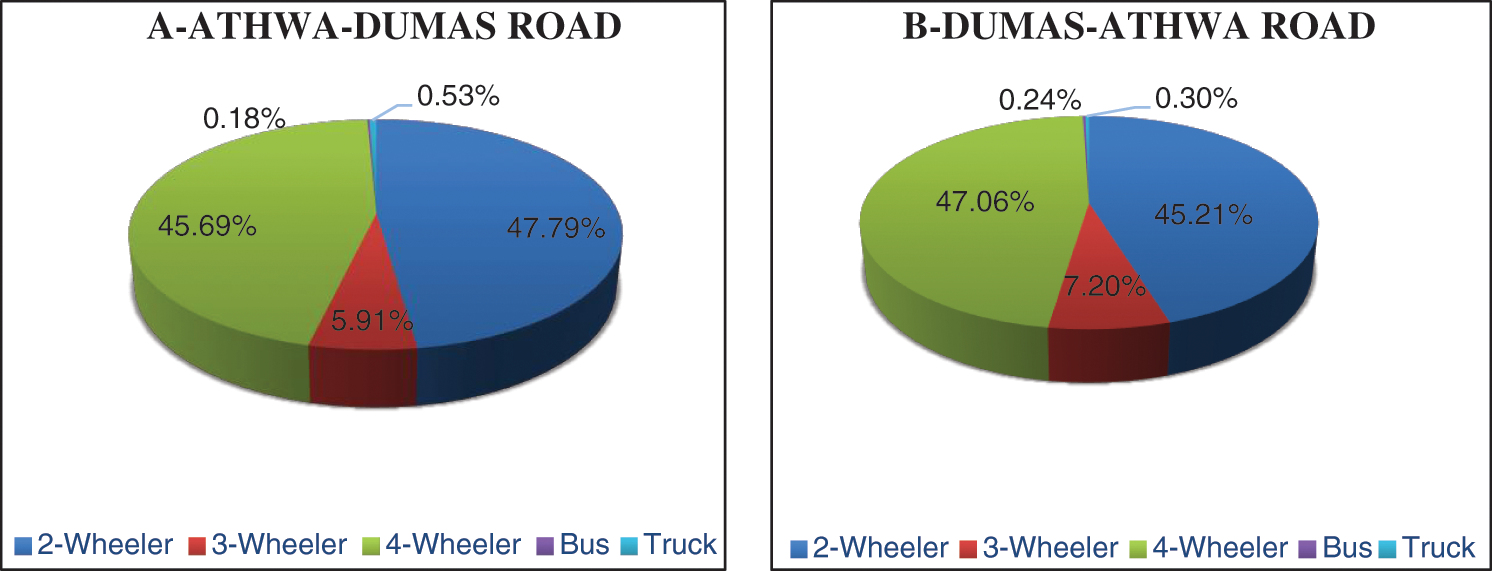
Figure 7: Night time traffic composition data on Athwa-Dumas road
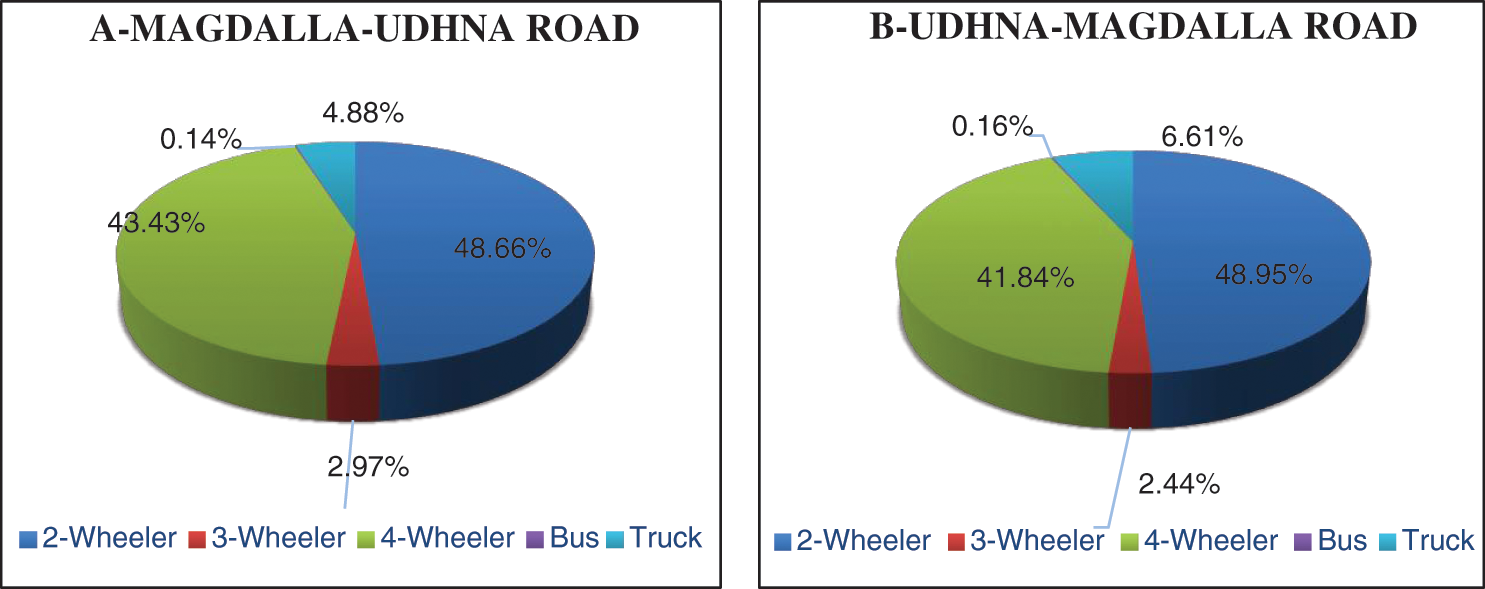
Figure 8: Night time traffic composition data on Udhna-Magdalla road
All the traffic volume count, collected on arterial roads of South-West zone are shown in Figs. 5 and 6, which depicts that the composition of 2-wheelers and 4-wheelers was more on arterial road during day time (almost equal). 3-Wheeler had the least share 10% to 20% amongst the selected categories of vehicles. Since, the selected streets are arterial roads, heavy vehicles, i.e., buses and trucks are banned in municipal corporation limits during morning 9.00 am to 1.00 pm and again during evening 5.00 to 9.00 pm. This is the major reason for buses and trucks count being low as 1% to 2%. The 2-wheeler and 4-wheeler frequency were more during day time. Figs. 7 and 8 depict that on Udhna-Magdalla corridor during night time the truck frequency is slightly more, when compared to morning time, which is major reason for high levels of night time noise.
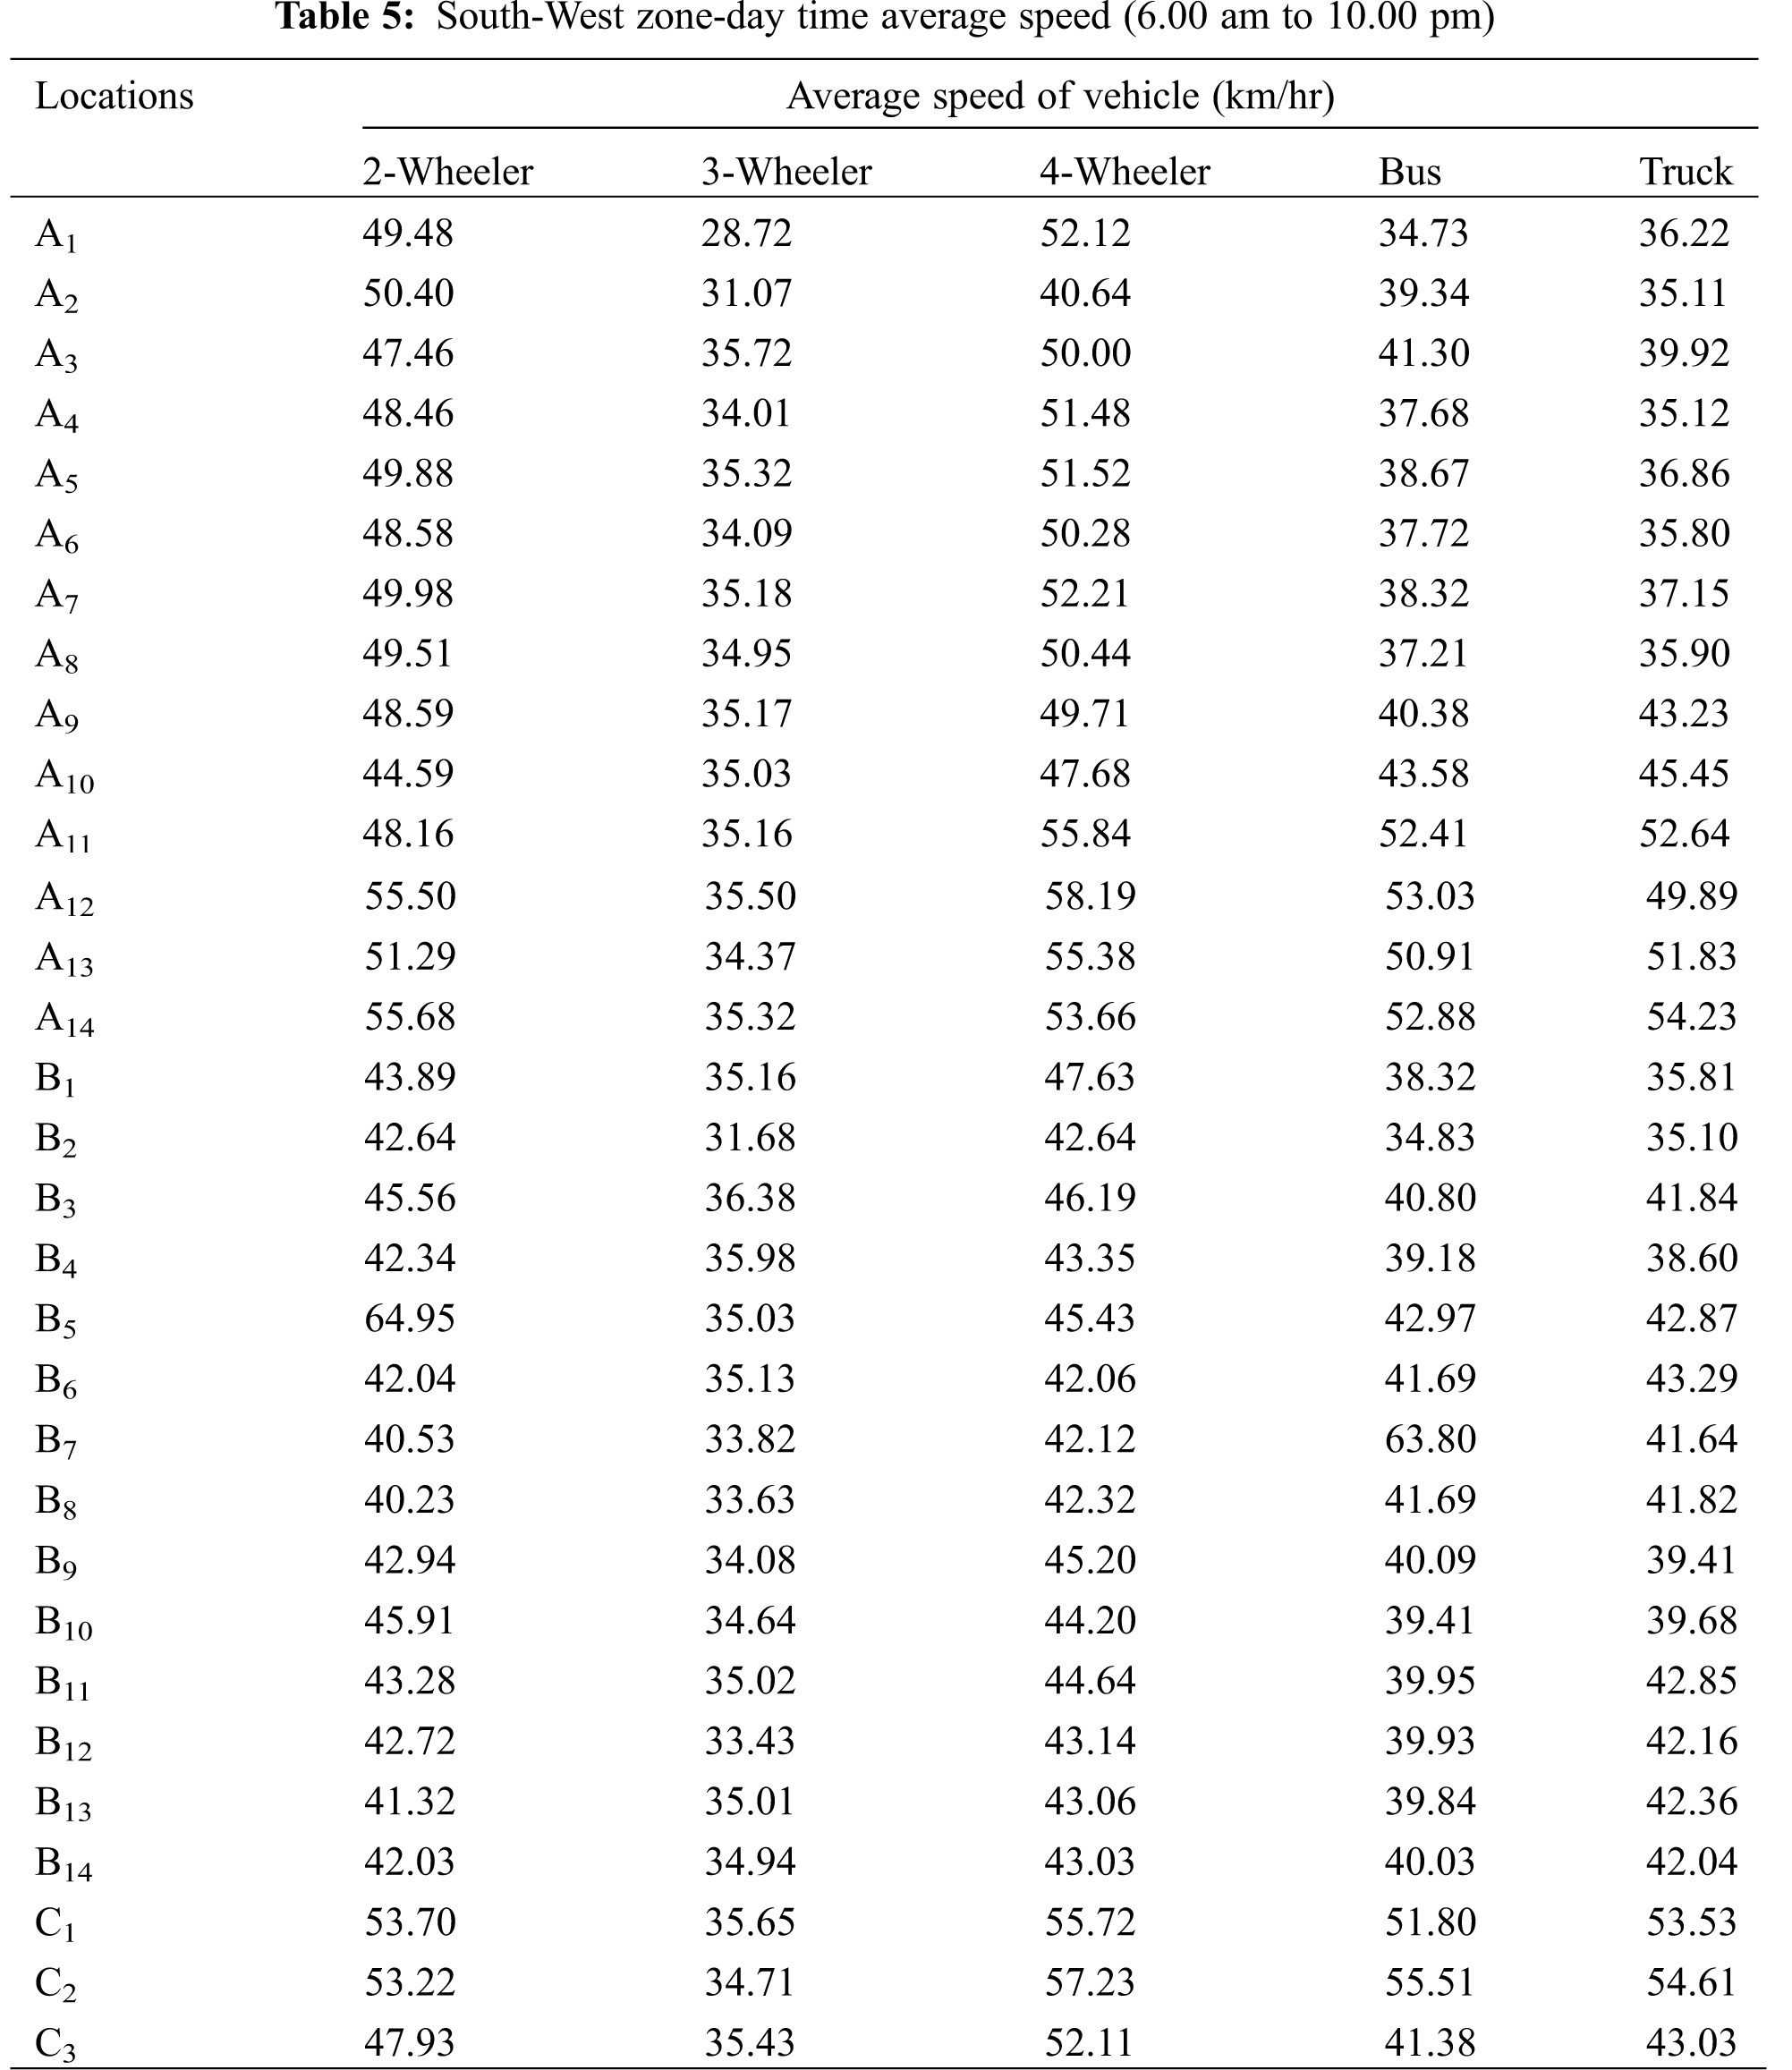
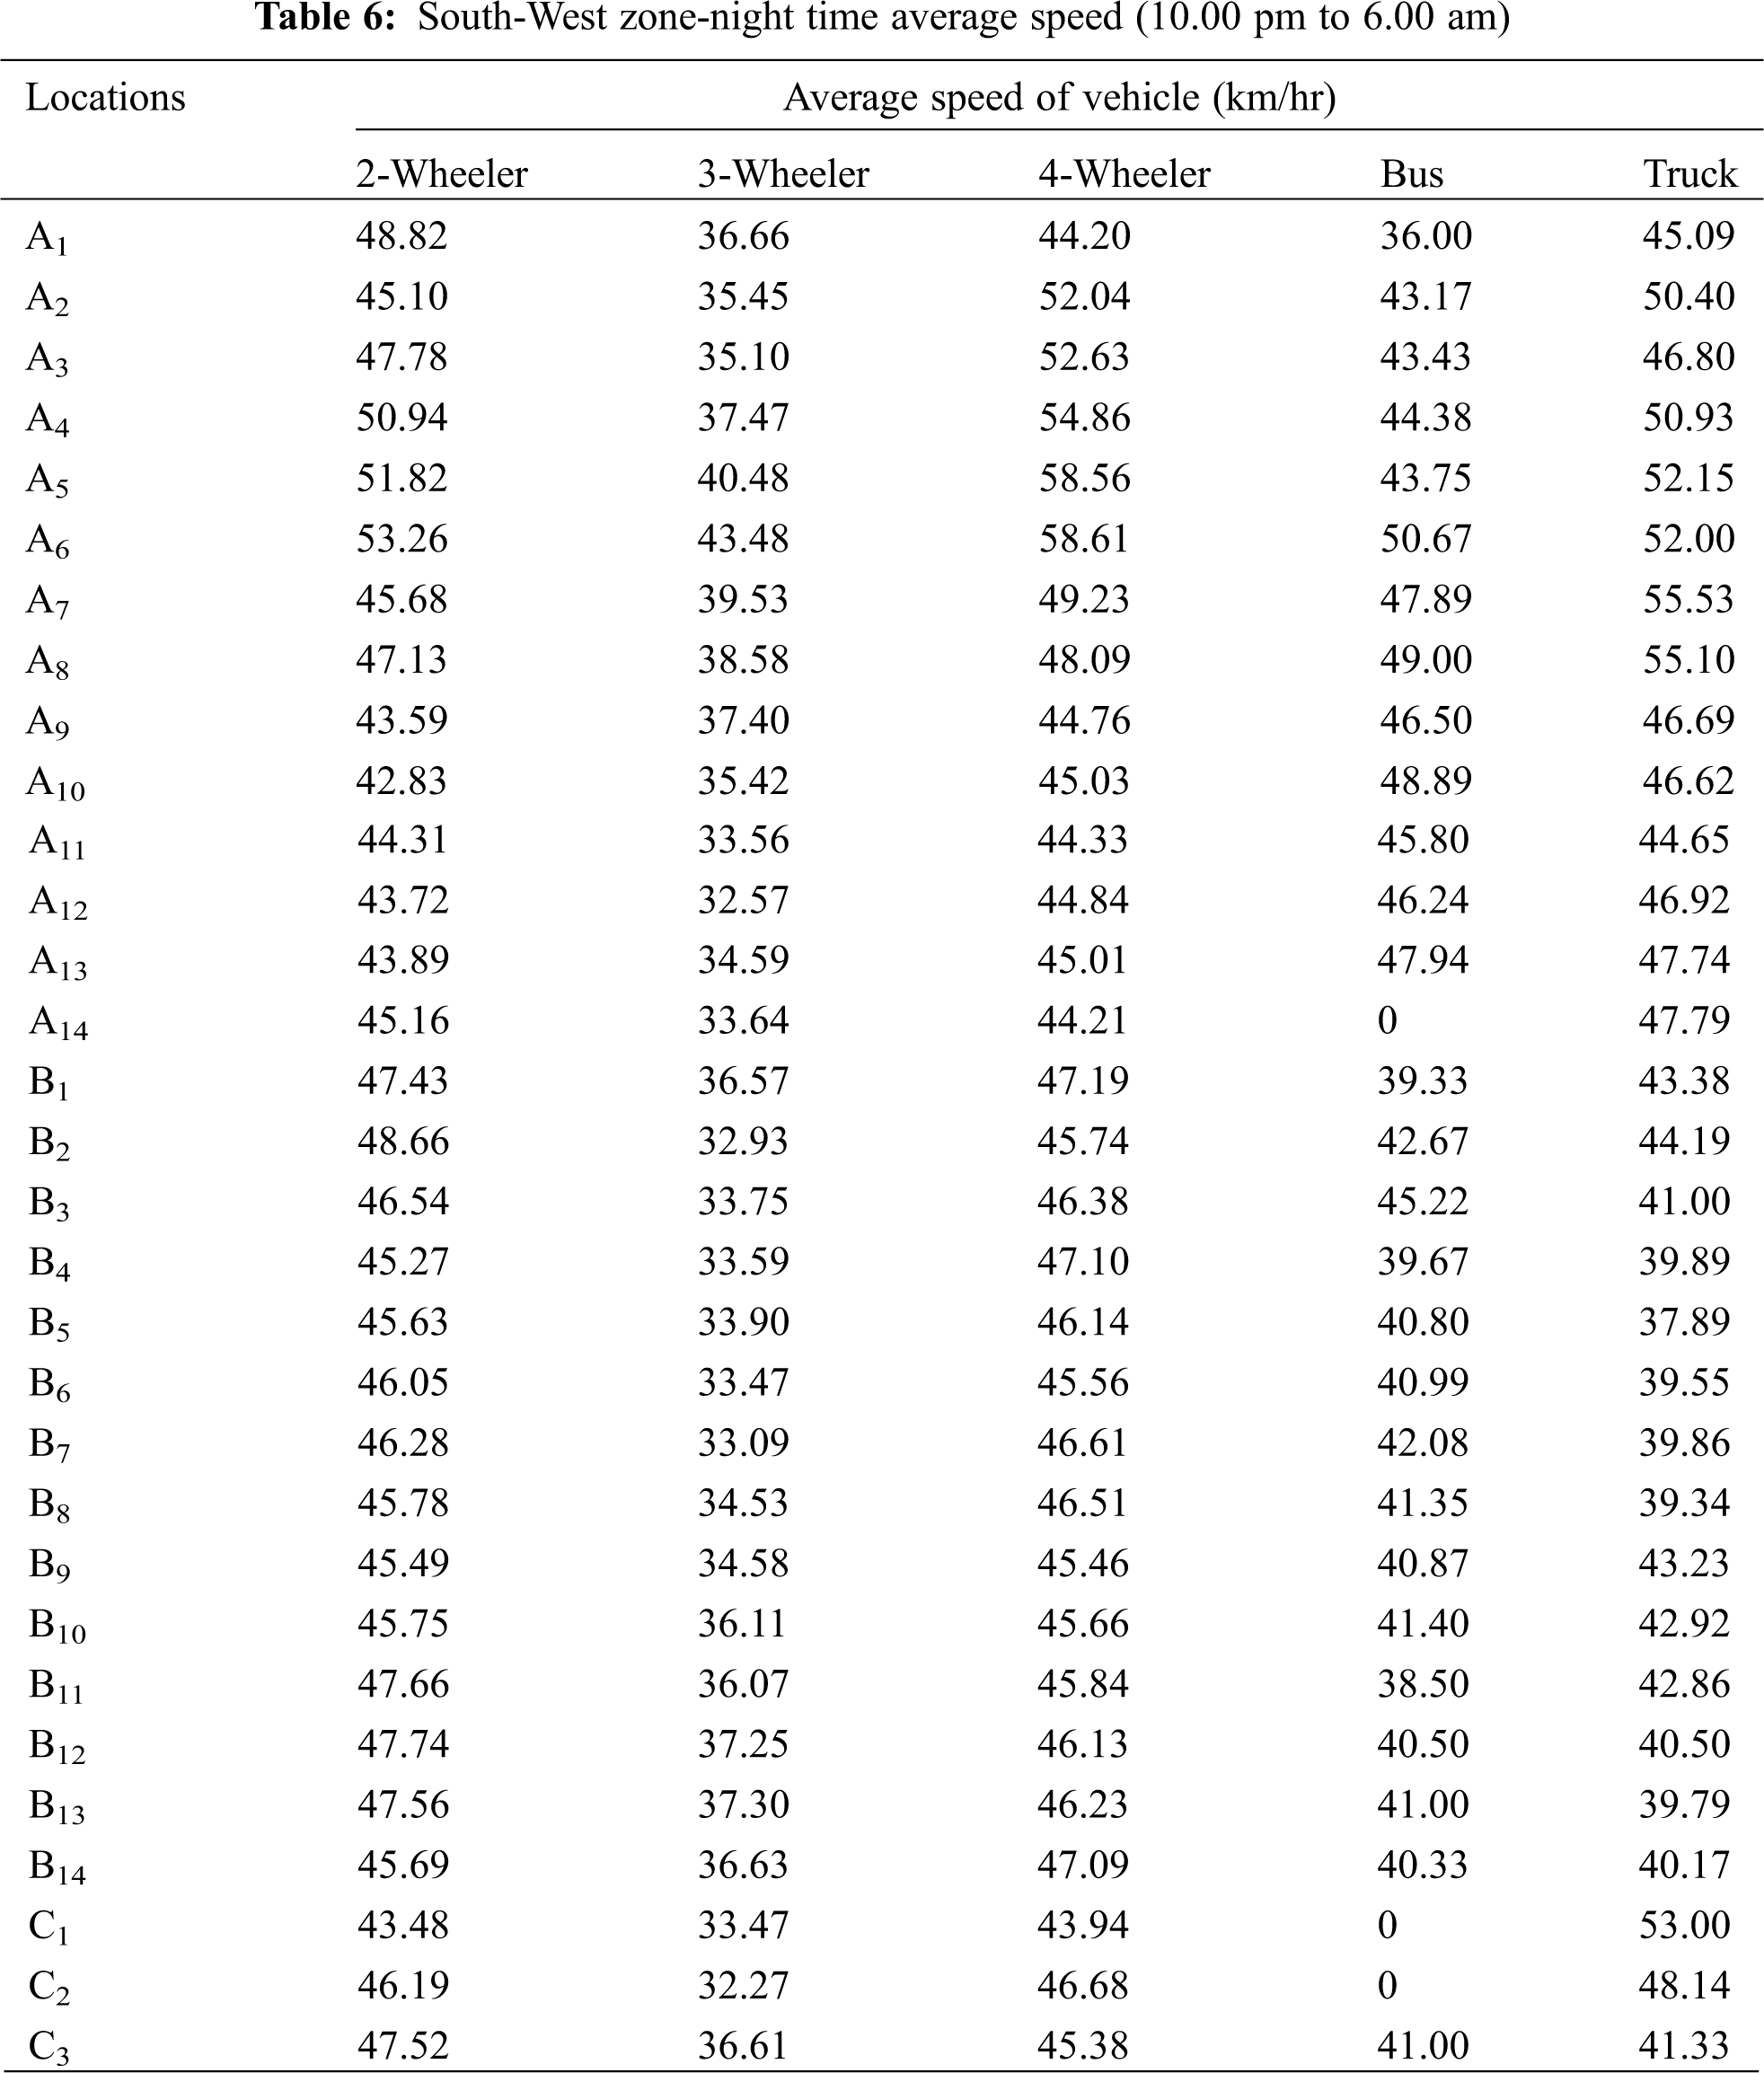
Spot speed survey was carried out using Falcon Radar guns. Two radar guns were employed to collect the spot speed data of the vehicles. This survey helps in determining the approach speed of vehicles. This survey was carried out on a working day. The spot speed of different vehicular categories was collected for every 15-min, 5 sample of each category vehicles. Readings of average spot speeds of individual vehicles for all zones sampling locations are given in Tables 5 to 6.
The sample size was random and was adopted depending on the traffic count. The speed survey was carried out for the day time 6.00 am to 10.00 pm and night time 10.00 pm to 6.00 am. This spot speed data can be used in adopting the speed distribution for different vehicular categories to be considered in noise model.
Tables 5 and 6 give vehicles speed at all 5 locations of West zone during day time and night time respectively. These Tables depict the average speed of categorize vehicles. 2-Wheelers average speed ranged between 33–40 kmph during day time and 35–45 kmph during night time. Similarly, 3-wheeler average speed ranged between 30–35 kmph during day time and 30–40 kmph during night time. The average speed of 4-wheeler ranged between 30–40 kmph during day time and 35–45 kmph during night time. The average speed of bus and truck ranged between 35–45 during day and night time.
In South-West zone, 31 locations were monitored. Among them 16 locations were on Athwa-Dumas arterial road, 12 locations were on Udhna-Magdalla arterial road and 3 locations were on sub-arterial road connecting above two arterial roads. These triangular closed loops, which is formed by 31 locations, has an approximate area of 9 sq. km.
In this study, noise level data and road traffic data were recorded. There were total 31 locations for monitoring among that 16 locations were on Athwa-Dumas arterial road, 12 locations were on Udhna-Magdalla arterial road and 4 locations were on the sub-arterial road connecting above two arterial roads. This triangular closed loop, which is formed by 31 locations, has an approximate area of 9 sq. km. The numbers of vehicles categorized as 2-wheelers, 4-wheelers, 3-wheelers, bus and truck were counted manually.
Data in Figs. 3 and 4 depicts the average LAeq for 31 locations at various time intervals (i.e., day time-6.00 am to 10.00 pm and night time-10.00 pm to 6.00 am). It clearly shows that the highest LAeq observed during the peak hours was 75.8 dB(A) during the time period 9.00–10.00 am. Similarly, the average LAeq observed was 76.00 dB(A) during the evening period 7.00–8.00 pm, indicating the high levels of traffic noise. Minimum 62.6 dB(A) was observed during night time from 3.00–4.00 am, which is more than the permissible night time residential area norms of 55.00 dB(A).
On Athwa-Dumas road, the composition of vehicles namely: 2-wheeler is about 45–50%, 3-wheeler is about 10–15%, 4-wheeler about 35–40%, and bus & truck both are about 1% during day time. During night time, the composition of vehicles namely: 2-wheeler is about 45–50%, 3-wheeler is about 5–10%, 4-wheeler about 45–50%, and bus & truck both are about 1%. On Udhna-Magdalla road, the composition of vehicles namely: 2-wheeler is about 45–50%, 3-wheeler is about 5–10%, 4-wheeler about 45–50%, and bus & truck both are about 1% to 3% during day time. During night time, the composition of vehicles namely: 2-wheeler is about 45–50%, 3-wheeler is about 1–5%, 4-wheeler about 40–45%, bus is about 1%, and truck is about 5–10%. So, it is concluded that, compared to traditional Indian traffic scenario of high (70–80%) 2-wheeler counts, on these two study arterial roads, count of 4-wheeler is almost equal to count of 2-wheeler. This can be the major reason for generation of road traffic noise. Another reason for high day time noise levels can be that even though heavy vehicles (bus and truck) are not permitted between morning 9.00 to 1.00 and evening 5.00–9.00, have been recorded in traffic count.
Spot Speed Study concentrates on measuring the speed characteristics at predetermined area under the natural conditions.The present spot speed studies are coordinated to assess the movement of rates of vehicles in a surge of activity at a particular region on a roadway. In this present study, the average speed of various category of vehicles are determined and analyzed.
Acknowledgement: I am thankful to S.V. National Institute of Technology, Surat for cooperation and assistance.
Funding Statement: The authors received no specific funding for this study.
Conflicts of Interest: The authors declare that they have no conflicts of interest to report regarding the present study.
1. Sonaviya, D., Tandel, B. (2019). A review on GIS-based approach for road traffic noise mapping. Indian Journal of Science and Technology, 12(14), 1–6. DOI 10.17485/ijst/2019/v12i14/132481. [Google Scholar] [CrossRef]
2. Seong, J., Park, H., Seo, J., Chang, I., Kim, M. et al. (2011). Modeling of road traffic noise and estimated human exposure in Fulton County. Journal of Environment International, 37(8), 1336–1341. DOI 10.1016/j.envint.2011.05.019. [Google Scholar] [CrossRef]
3. Silvia, R., Ricardo, H., Luis, C. (2003). Evaluation and prediction of noise pollution levels in urban areas of Cdiz (Spain). Acoustical Society of America Journal, 114(4), 2439. DOI 10.1121/1.4779173. [Google Scholar] [CrossRef]
4. Abbaspour, M., Golmohammadi, R., Nassiri, P., Mahjub, H. (2006). An investigation on time-interval optimization of traffic noise measurement. Journal of Low Frequency Noise Vibration & Active Control, 25(4), 267–273. DOI 10.1260/026309206779884883. [Google Scholar] [CrossRef]
5. Nikolova, M., Mirakovski, D., Despodov, Z., Doneva, N. (2016). Traffic noise in small urban areas. The International Journal of Transport & Logistics, 1, 1–8. [Google Scholar]
6. Tandel, B. N., Macwan, J., Ruparel, P. N. (2011). Urban corridor noise pollution: A case study of Surat City. India International Conference on Environment and Industrial Innovation 12, pp. 1–9. [Google Scholar]
7. Sonaviya, D., Tandel, B. (2019). 2-D noise maps for tier-II city urban Indian roads. Noise Mapping, 6(1), 1–7. DOI 10.1515/noise-2019-0001. [Google Scholar] [CrossRef]
8. CPCB Noise Rules–2000. https://www.google.co.in/search?q=cpcb+noise+standards+amendmn+2012&oq=cpcb+noise+standards+amendmn+2012&aqs=chrome.69i57.28920j0j8&sourceid=chrome&ie=UTF-8#q=cpcb+noise+standards+. [Google Scholar]
 | This work is licensed under a Creative Commons Attribution 4.0 International License, which permits unrestricted use, distribution, and reproduction in any medium, provided the original work is properly cited. |