| Sound & Vibration |
DOI: 10.32604/sv.2022.018634
ARTICLE
Towards Realistic Vibration Testing of Large Floor Batteries for Battery Electric Vehicles (BEV)
Faculty of Engineering and Computer Science, Department Automotive and Aeronautical Engineering, Hamburg University of Applied Sciences (HAW Hamburg), Hamburg, 20099, Germany
*Corresponding Author: Benedikt Plaumann. Email: benedikt.plaumann@haw-hamburg.de
Received: 07 August 2021; Accepted: 09 November 2021
Abstract: This contribution shows an analysis of vibration measurement on large floor-mounted traction batteries of Battery Electric Vehicles (BEV). The focus lies on the requirements for a realistic replication of the mechanical environments in a testing laboratory. Especially the analysis on global bending transfer functions and local corner bending coherence indicate that neither a fully stiff fixation of the battery nor a completely independent movement on the four corners yields a realistic and conservative test scenario. The contribution will further show what implication these findings have on future vibration & shock testing equipment for large traction batteries. Additionally, it will cover an outlook on how vibration behavior of highly integrated approaches (cell2car) changes the mechanical loads on the cells.
Keywords: Battery electric vehicle; BEV; shock and vibration; vehicle floor bending; rechargeable energy storage system; RESS
Shock and Vibration Testing is a crucial task for evaluating performance characteristics and ensuring safety functions and mechanical environments in nearly any mobile application. This is particularly true for Lithium-Ion based Rechargeable Energy Storage Systems (RESS), which are treated under the UN Dangerous Goods Convention and need to undergo at least a risk mitigation scheme for transportation environments described in UN38.3 [1]. Most mobile applications add further mechanical environments that need to be taken into account for the requirements engineering as well as the verification and validation [2]. For Battery Electric Vehicles (BEV) this includes mechanical environments of the interaction between vehicle and ground as well as self-induced vibrations and shocks from internal sources, as for example the electric motor or gear boxes. Further loadings include door slams and crash scenarios. Lithium-Ion RESS pose a potential fire risk when, i.e., an internal or external electrical short-circuit occurs, which may be induced by a mechanical deformation or mechanical contact of power conducting subcomponents of a battery, the cables or the corresponding power electronics [3].
Hence, the safety critical battery components are typically tested on various levels from cell, over module to battery pack/traction battery. Tests on vehicle level are then finally undertaken for high-level verification and validation.
As current BEV do not show a higher risk of catching fire than current Internal Combustions Cars (ICE) [4,5], especially from mechanical induced failures, the current battery designs seem to be mostly conservative with enough safety margins to cover the uncertainties always arising with new technological approaches. One of the uncertainties involved is, that vibration testing standards so far are mainly derived from the ICE environments. In general practice, many test campaigns have been based on the ISO 16750-3 [6] mechanical environmental test specifications so far. Over the past years many more testing specifications for BEV components in general or even specific to RESS in BEV have come into practice. A comprehensive older overview can be found in [7], a more recent one in [8]. Several contributions like [9,10] propose different testing profiles, mostly remaining under the ISO 16750-3 test levels for components attached to the vehicle body. The most recent testing standard for BEV RESS battery packs is the ISO 19453-6 [11]. When giving recommendations regarding test details it further distinguishes between different sizes of the battery pack, its location in the car and the interaction between the vehicle body, chassis and the battery pack.
This leads to the important aspects of the location of a component in a vehicle and the interaction between vehicle and battery pack. Typically, performance and safety testing are not only done on the full product level (in this case a complete real life production car) but taken down to lower component level in the V-model [2] happening at an earlier stage in the product development process. With this decomposition approach, the single components can be properly developed with derived local mechanical environment requirements and tested against these requirements (verification) long before a full car is produced for the first time. If all earlier verification steps worked out well, the final full car validation is less likely to produce significant iterations of reworking the design [2]. Therefore, component testing gives many benefits, such as faster design processes, less design iterations, less likely failures in final validation.
The common approach of industry standards like ISO 16750-3 reflects this by presenting some generalized local environments for components attached in the respective region. Different tests are described for components attached to the vehicle body or to unsprung masses like the wheel suspension, for example. For large RESS battery packs or traction batteries weighting several 100 kg, this approach does not work out well anymore [8]. As the battery weights roughly as much as the pure vehicle chassis & body, the added mass of the battery significantly changes the structural dynamics of the combined vehicle and battery. Depending on the design of the RESS different amounts of stiffness will be added to the new multi-body-system. Some approaches like the BMW i3 and other earlier BEV designs use a very stiff integral battery pack being mounted into the floor section of the vehicle frame. Such block approach enables a rather simple exchange of the complete battery in case of failure or progressed aging as well as a very rugged protection against impacts from the outside. Other, more recent approaches tagged under “cell2car” use a differential approach where small modules or even single cells are directly integrated into the car chassis, adding their mass locally and also interacting with their stiffness, see Fig. 1. Generally, the cells need to be mounted securely to the next structural level like an encasing, a module pack structure or even structural floor elements in the cell2car approach. Often this is done by using heat conducting material used for battery cooling. The stress caused on the cells itself from global deformation of the vehicle chassis may be significantly different depending on the choice between an integral stiff box or a differential placement and local interaction.
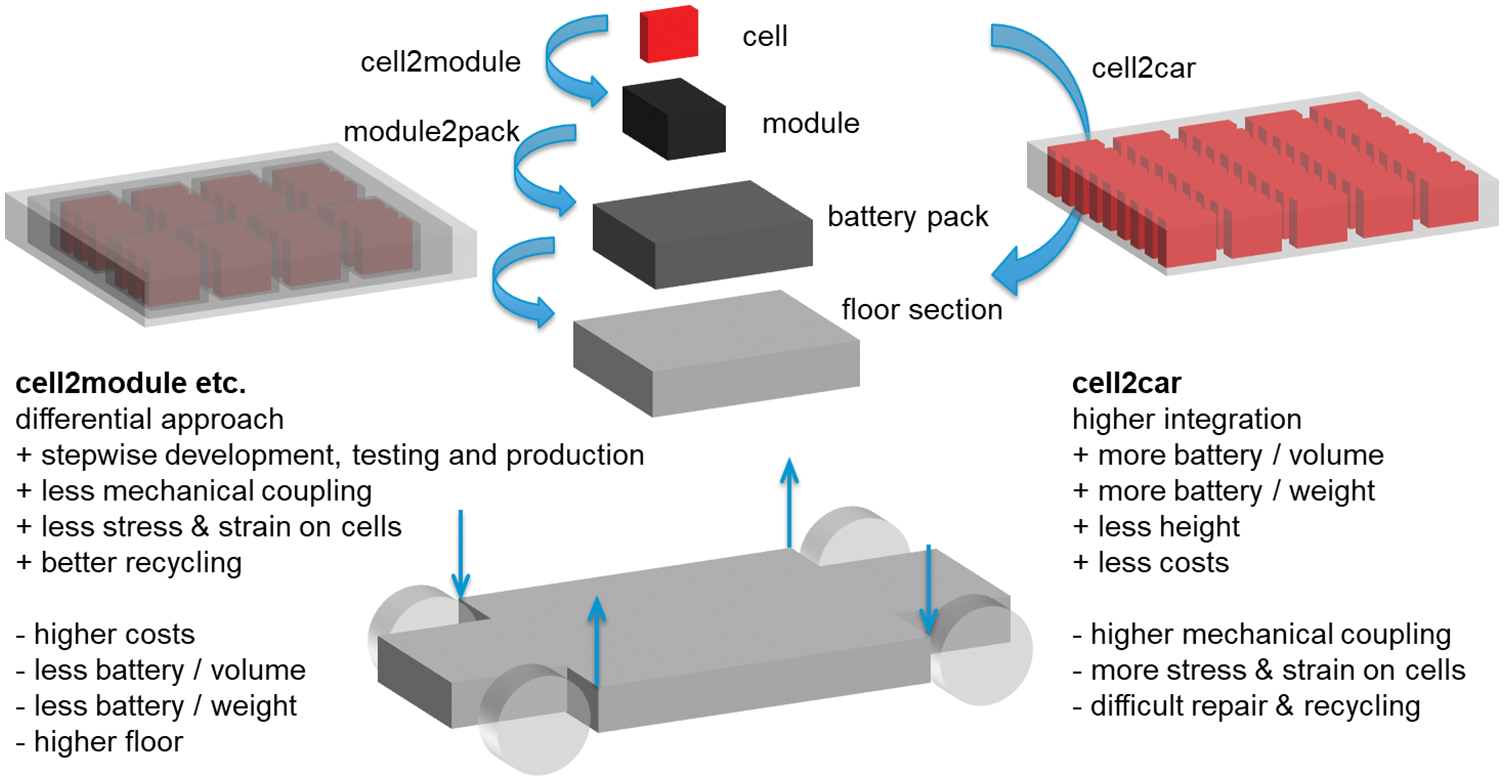
Figure 1: Different approaches, integral vs. differential in cell placement
Large, heavy floor batteries with significant interaction between battery and vehicle are treated in Category 3 of ISO 19453-6 regarding the shock and vibration testing requirements. Different from the other categories of less interaction, no generalized test level for the mechanical environment is given for Category 3. Instead, the standard indicates the need for “vehicle specific profiles and testing time” or “vehicle specific time signals” for testing. This contradicts the goals of a rapid V-model design process because no trustworthy design requirements and test levels are given on the general normative level.
Here further research is needed to derive partially generalized test levels and requirements depending on the stiffness/mass interaction between battery and vehicle frame.
Further need for research arises with of a four-point-excitation of a generalized large floor battery as in [8,11,12]. This is depicted by the blue arrows in Fig. 1, indicating independent movement of the battery pack corners in different directions at a given time step. It will be explained in more detail in Chapter 4.2. Regarding four-point-excitation, application lacks from available test infrastructure for broad frequency ranges between 10–2000 Hz of large masses up to 1000 kg battery weight. Also, it lacks test specification on how to control the input at the four excitation points to give a realistic testing scenario for mechanical environments. The current contribution will focus on the requirements of a realistic test environment regarding infrastructure and testing approach.
Another interesting aspect for vibration behavior assessment is the change of mechanical properties of electrical and thermal aging. Not only the volume of a Lithium-Ion battery changes over temperature, state of charge and cycles but also key figures in the elastic and plastic behavior change, as described in [13]. Although this aspect is not covered in the very general holistic view on battery loads in this contribution, it is thought to be a very interesting field for further research also for vibration & shock environments.
With the given state of the art, several questions arise to fill existing gaps and make further progress in efficiency and quality in the development of lithium-ion battery packs under mechanical vibration & shock environments, such as:
Does relevant global bending occur?
This question concerns the relevant excitation frequency range of up to 500 Hz and in special cases up to 2000 Hz. Resonances with an amplification of more than Factor 2 are typically considered relevant, as the amplifications in acceleration cause an equivalent amplification in forces and stresses based on the modal mass fraction of the bending mode.
Does relevant local corner bending occur?
In a common road vehicle, the interaction between vehicle and ground causes a power input through tire and suspensions at the four corner points of the floor section between the wheels. If this floor section housing large batteries in modern BEVs shows considerable large deflections between the four corners and the mass center, local corner bending occurs and causes bending stresses.
What changes will a more integrated cell placement like cell2car bring in comparison with a more differential decoupled pack approach?
A higher integration level will bring more coupling and eventually higher loads on the subcomponents like cells or their direct housings. Measurements on the bending behavior with various added loads for an integral structure as well as for decoupled battery packs in a differential approach should give insight into answering that question.
The following chapter shortly describes the background and methods in vehicle dynamics as well as signal analysis used in this paper.
4.1 Frequency Range Considerations
Vehicle models with component movement or deformation typically range up to 200 Hz [14]. Movements of the suspension normally occur in the frequency region of 0.5–5 Hz. Typically structural dynamics testing schemes like [6] use a frequency range of up to 2000 Hz in order to cover local modes of small electrical components on circuit boards also. This is particularly true for ICE excitations. For BEV the excitation mainly originates from the vehicle-ground interaction, often referred to as “road induced” [15]. Any component in the transfer path after the suspension will see a mechanically low-pass filtered far-field spectrum, which is typically analyzed up to 200 Hz, see [9,11,15].
A larger stiff Nickel Manganese Cobalt Oxide Pouch Cell showed resonance frequencies of around 200 and 300 Hz, which is higher than typical road-induced vibrations of sprung masses in a passenger car. Internal vibration excitation may still originate from the electric motor but on a much smaller level than on an ICE.
Therefore, the analysis focus of this investigation is set to 0.5–2000 Hz with a particular focus of up to 200 Hz as long higher frequencies power spectrums remain at least one decade lower.
4.2 Flexible and Rigid Body Movements of the Vehicle Floor Section and Battery Compartment
Fig. 2 shows a general coordinate system for a vehicle. For simplicity in this paper with regard only to the internal movements and deflections, the fixed origin OF and vehicle origin OV are both set to one of the points of interest on the vehicle chassis (Point 1). Only the vehicle coordinates XV, YV and ZV are used, usually denominated by the distance vector D or its Cartesian components. The measured motion (i.e., acceleration values) are denominated by the cartesian direction and the point of measurement, i.e., z4.meas. A global reference frame may be of interest if information of earth gravity is used in detecting vehicle inclinations to a flat surface (for example with the MEMS sensors described later), which is not a focus of this contribution.
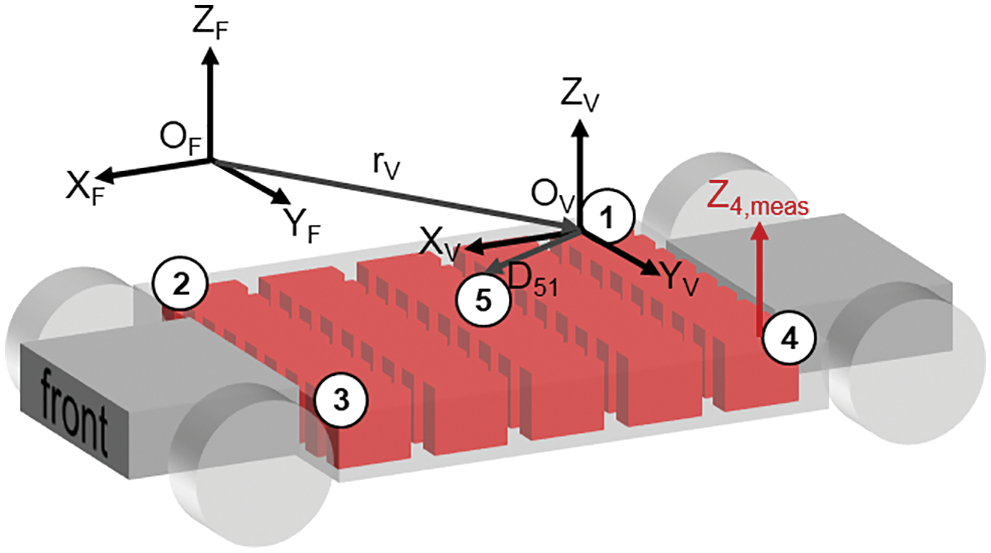
Figure 2: Reference keyframe for a rigid vehicle model, adapted from [14]
Rigid body movements of ground vehicles are widely described in literature, as, i.e., [14]. In the case of a large traction battery mounted in the floor segment of a vehicle between the wheels, the excitation input is coming from the wheel suspensions where the interaction with the inertial forces of the complete vehicle happens, see Fig. 3.
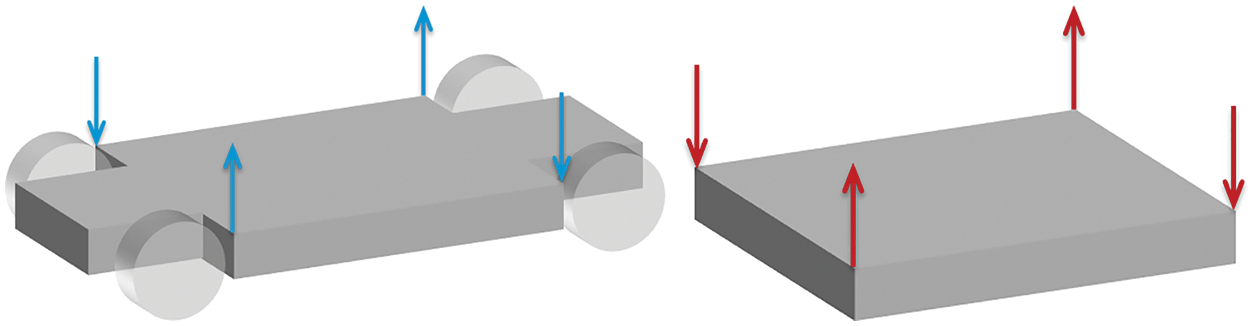
Figure 3: Incoherent movements (left) and incoherent excitation forces (right) on the corners (indicated by different directions) on a vehicle chassis
In [16] a two segment model is introduced in order to model the local vibrations of a smaller battery remaining inside of one segment. Descriptions of flexible vehicle floor sections or flexible vehicle bodies with flexible chassis are less common, but necessary to model global and local bending of vehicle of large floor batteries.
A description of general elastic deformation types of a simplified large traction battery in the floor segment of a vehicle body is described in Fig. 4.
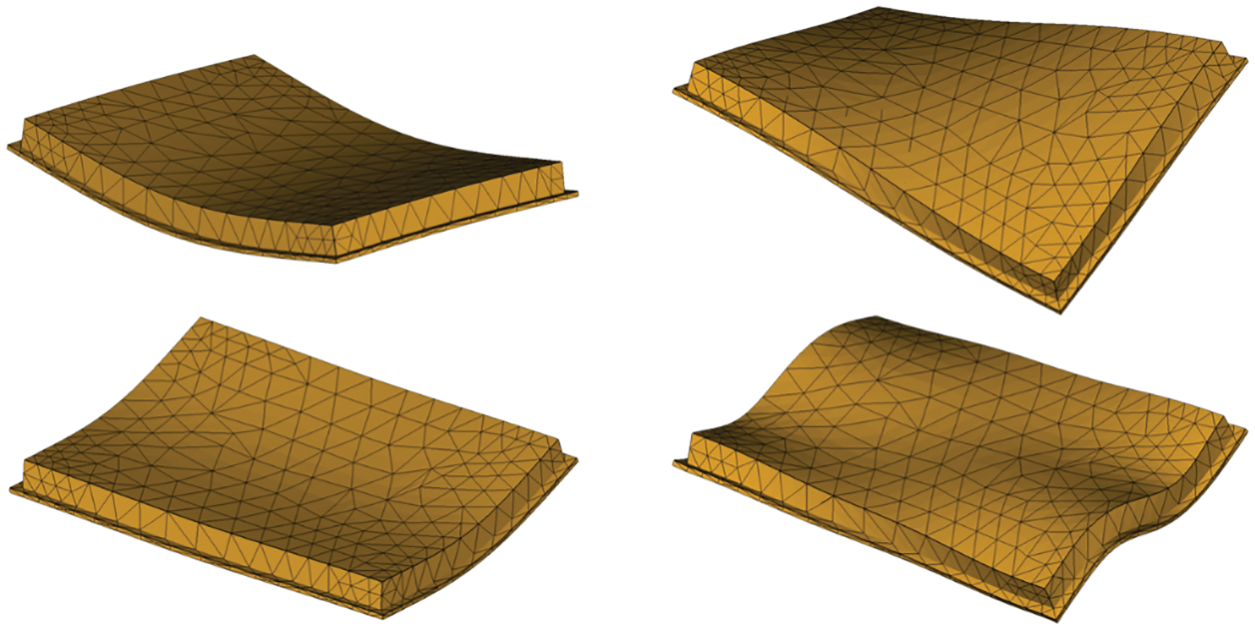
Figure 4: First two modes of global bending (left), simple mode of global torsion and local corner bending (right) for a vehicle floor battery pack, similar to [11]
It is easily understandable that these deformations and movements cause local stresses and deformations in the battery structure and cells. The deformations are caused by inertial forces as well as incoherent forces acting on the corners.
Local and global resonances will amplify the deformation and induced stresses depending on the damping of the corresponding mode shape. In order to describe the first relevant global and local corner bending mode shapes, the structure is described with translational movement vectors at five points, consisting of four corner and one point in the middle, see Fig. 5. For a first estimate the floor battery is considered as a continuous homogeneous structure in the vehicle chassis.
The model can be further reduced to vertical movements at the given points, especially for the small bending deflections and local deflections to be expected. All points have a given distance in the horizontal plane (X,Y) from each other. The distance in X, Y components make up the distance values of DX… and DY… All points can make a vertical movement over time. So, at a given time step t each point will have always the same X and Y distance from each other (this simplification is only acceptable for small movements). But each point may have a different Z value. These Z values may be measured (
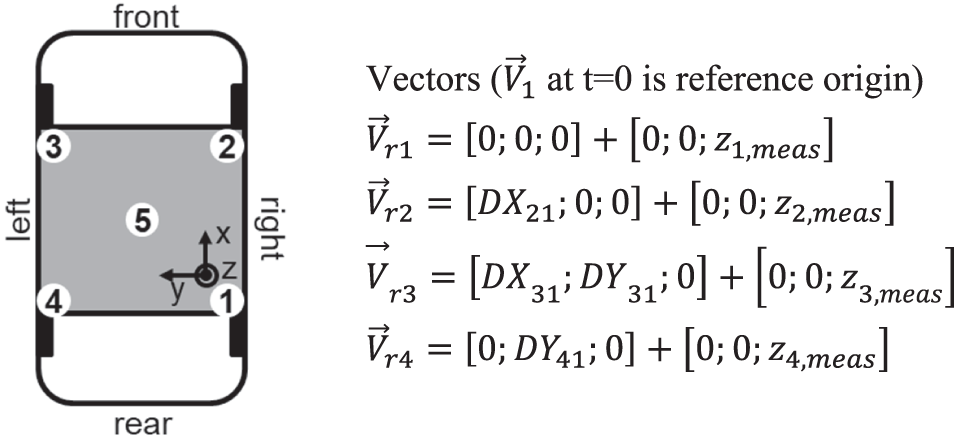
Figure 5: Reference and coordinate system of battery floor segment
Rotational movements at the points would be of further interest but are more difficult to measure compared to the small piezo-electric accelerometers for uniaxial measurements. Measurements with 6dof (3 translational, 3 rotational) would be possible to perform with MEMS. As this seems to be difficult to achieve together with translational movements at high frequencies and was not the main scope presently, it is left for future research.
By introducing a given distance between the points, a bending effect is indirectly described by the comparison of a completely stiff rigid body movement of all points and the actual movement at the points measured.
This leads us to the task of analysis methods in order to quantify local bending influence at the four corner points as well as global bending mode around X and Y with the midpoint near the assumed maximum of the mode shape. The further analysis will use methods in time and frequency domain, both based on the modal domain models of local corner and global bending. Further information on the different domains of dynamic analysis can be found in [17].
4.3 Differential Movements in Time Domain
A quick method to describe the bending influence inducing stress in the traction battery for an early analysis is to look at the deflection difference at a given corner between its rigid body movement and the actual measured deflection from the vertical position (see Fig. 6) at any given point in time t. The wireframe block in Fig. 6 as well as later Fig. 7 shows the rigid body in its neutral position, the semi-transparent black block with the red wireframe the rigid body position based on the other corner moventments.
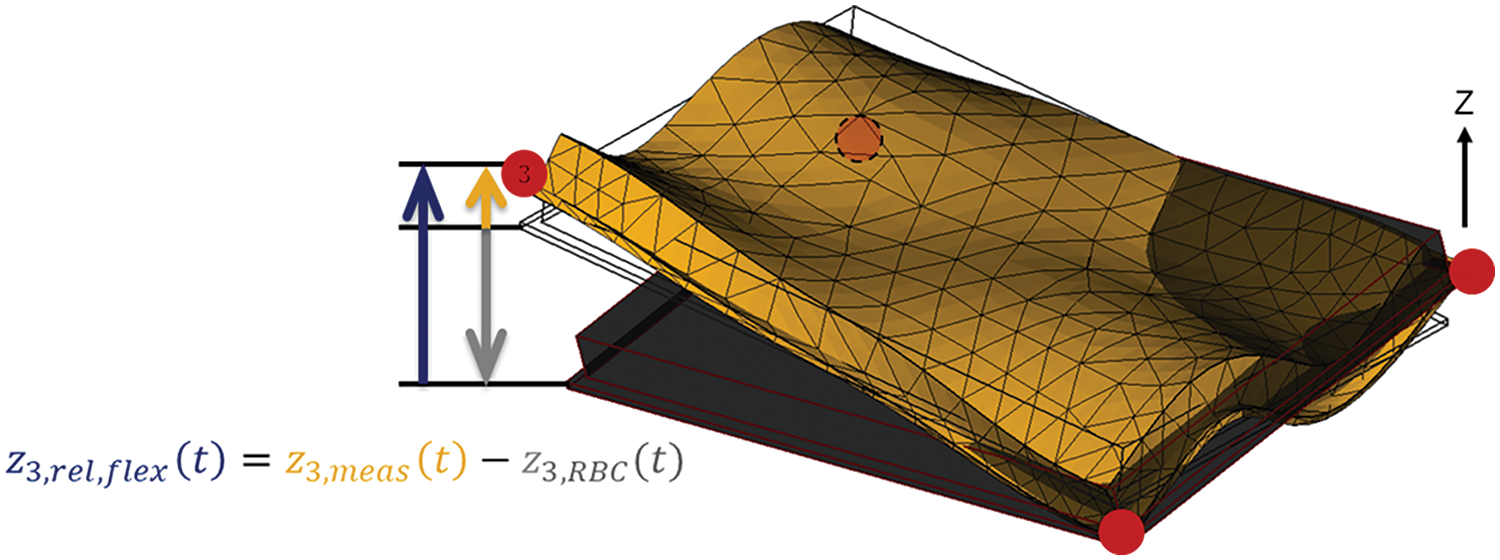
Figure 6: Detecting flex movement of first torsion modes and local corner bending as a difference function between local calculated rigid body movement and local measured movement
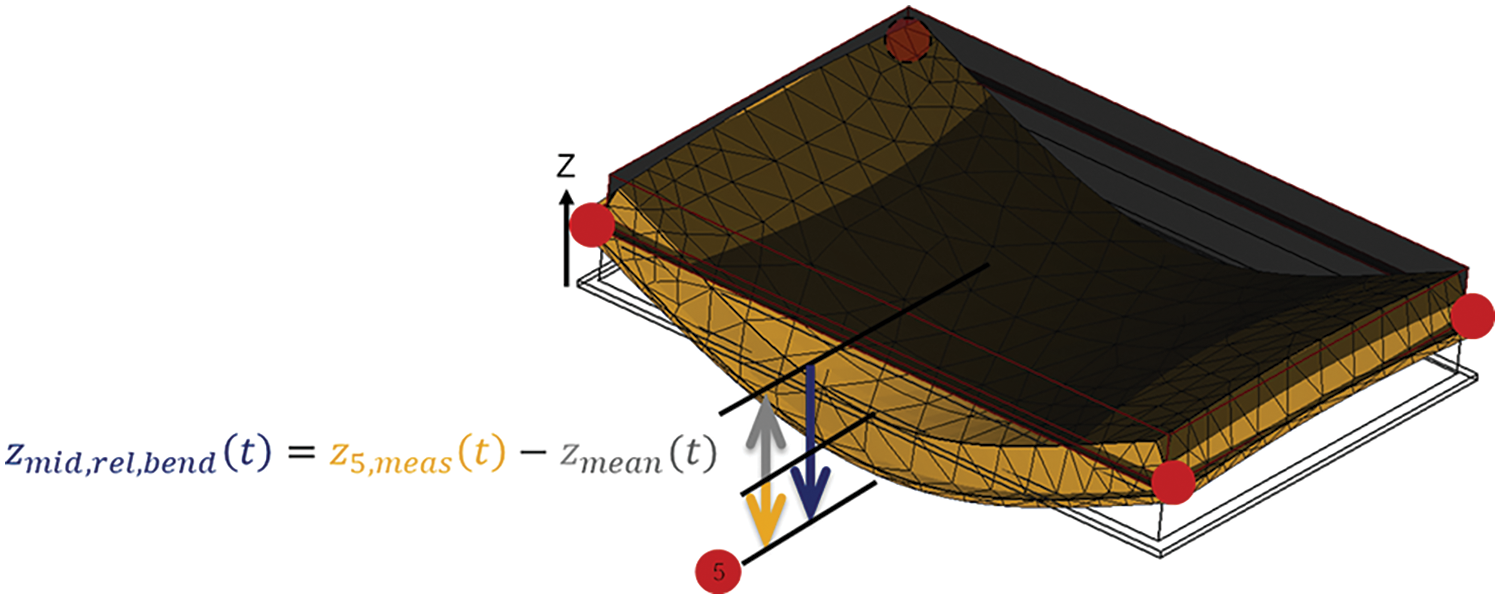
Figure 7: Detecting bending movement of first global bending modes between mean of measured movements of all four corner points and local measured movement
In a simple battery model with vertical movements at the four corners and at one point in the middle (see Fig. 5).
• Global bending can be detected for first simple modes but not distinguished clearly by looking at the averaged movements of the four corner points and the point in the middle;
• Global torsion in its first simple modes and local corner bending can be detected but not distinguished from each other by looking at the difference in movement of one of the four corner points and the rigid body movements based on the other corner points.
As this contribution targets a first holistic view on mechanical battery loads, the simplification with five respectively four points is deemed acceptable, as it gives enough information for the intended purpose. For a more detailed view on local stresses in the structure of a fully detailed design more points of movements have to be considered.
Detecting first and simple torsion modes as well as local corner bending
With the model simplified as described above, one can calculate a rigid body movement as shown in the following example of Point 3 from the measured vertical movements. From three out of the four corner points the assumed rigid body movement of the one left out is calculated:
For
where
The flex movement of first torsion modes and local corner bending in time domain difference is of particular interest for later statistical analysis:
The same needs to be done for all other corner points with their opposite corner coming in negative as in the above equation. Basically, this approach detects modes with local or global torsion parts. The simple global bending modes are not detected by this approach but will be by the approach in the following sub-chapter. Higher Torsion modes with local minima and maxima between the four corner points cannot be distinguished from each other.
Remark: This procedure may overestimate local corner bending by putting all non-rigid flexure of the body into the difference at one point. Opposite points will yield the same values of
Detecting first and simple bending modes
When looking for a simple indication of global bending in time domain, especially the difference function between the mean of the vertical movements of all four corner points
Remark: This procedure highly depends on putting the Point 5 in the global bending maxima of the mode, which may be unlikely for higher modes and more complex mode shapes. The approach was used as a simple and quick qualitative check if there is any significant global bending in relation to the actual measured values to be detected in the measurement files. For this it was rendered sufficient.
Different statistical key figures can be used for comparison on the differential movements in time domain. The statistical key figures deemed most relevant for the task given are:
• Root Mean Square (RMS)-to describe the equivalent DC-mean and (if squared) a general “power” content of the signal.
• Kurtosis-method to describe the statistical distribution of a signal in one number instead of looking on the “pointiness” of a probability or distribution chart over classes of the analyzed signal. In our case, a high kurtosis would describe a signal with more and higher extreme signal peaks as well as more measurement data around zero compared to a gaussian signal of the same RMS level. A Gaussian distribution has Kurtosis 3.
• Skewness-describes the difference between the positive and the negative side of a signal similar to Kurtosis in one number. A high skewness indicates one-sided contacts in a vibration movement. In our case that could be a passenger door contacting to the frame in one direction of the vertical movement.
Further descriptions on the use of these statistical measures in vibration analysis can be found in [18].
4.5 Transfer Functions in Frequency Domain
Apart from the simple and quick time domain analysis methods described above, transfer functions in frequency domain between different points (real measurement and calculated) were also used.
When looking for information on frequency domain information like resonance frequencies of the assumed bending modes or amplitude and phase, the frequency domain transfer function is calculated for any circular frequency
The transfer function to describe the flexible global bending behaviour of the Midpoint 5 is denominated by capital letters and calculated in the frequency domain by the Fast Fourier Transforms (FFT) of the calculated time domain rigid
The transfer function then needs some averaging or smoothing, especially for a high number of data inputs at a high sampling rate resulting in good frequency resolution over a broad frequency range. The following uses an arithmetic average over 10 time-segments of each measurement file if not mentioned otherwise. A suitable windowing and amplitude compensation also need to be considered. For the later often used measurements on rough cobble stone a typical measurement includes data of ca. 60 s at 15.000 Hz sampling rate giving something around 900.000 data points for each sensor. For 10 equal, non-overlapping time segments, this would render 90.000 data points of which not all may be analyzed due to FFT restrictions. Further information on transfer function generation can be found in the chapter “experimental modal analysis” in [18].
The transfer functions between the mean of all corner movements and the measured midpoint were analyzed for various mass loading configurations of the vehicles. As modal stiffness is assumed not to change, the added mass should lower the resonance frequency of a mode, as long as the structure the mass is added to is coupled to the resonating structure. The results indicate to what degree vehicle structure and battery pack are mechanically coupled in the later result section. This idea is later used in the analysis by repeating the same road segment measurements on the same vehicle with different amounts of added mass in form of mass loading into the passenger compartment of the vehicle. Obviously, the mass loading needs to be high enough with regard to the mass fraction already resonating.
As most mechanical influence is related to the mechanical power input, the Power Spectral Density analysis method is a very helpful tool. It is not only based on the measured acceleration levels but it enables a comparison of the power input over frequency. Basically, the acceleration input over a small frequency range (i.e., like 1 Hz wide) is squared and divided by the width of frequency range. As this contribution covers a first look at requirements for shaker testing of large floor batteries and the data is still relatively small with a few dozen measurements on two different BEVs, no PSD curves are presented here. For a proper test specification much more information on typical usage load blocks and possible fatigue damage mechanisms have to be analyzed and considered. This will be covered in future publications as research progresses.
With a larger set of measurements for more different vehicles, events and loading configurations, future research will also include an analysis based on the Fatigue Damage Spectrum (FDS). It benchmarks the occurred vibration peaks against a fictive S-N-curve to compare the damage potentially induced. This analysis is related to a Shock Response Spectrum (SRS), which is used to benchmark the measured signal regarding the maximum excitation of a fictive vibration system, see also [19]. With the current first set of data, this contribution focusses on the qualitative analysis for general testing requirements.
In order to answer the question of how independent the four corners or the center of the batteries move, a frequency-dependent measure of coherence between two signals is needed. Here, the ordinary coherence function is used. It is calculated by the squared cross-spectrum over the product of the two auto-spectra of the two signals for each frequency point. The coherence tells the linear relationship over frequency for the two signals. Further information can be found in the chapter frequency response estimation of experimental modal analysis in [18]. The coherence calculation in the following uses an arithmetic average over 100 time-segments of each measurement file for higher smoothing.
The current contribution focusses on an analysis of the needs on how to enable a realistic environment for large floor tractions batteries in a lab regarding its real-world excitations. This analysis is based on the first results of a smaller pre-test measurement campaign, with more planned in the future. These preliminary results indicate significant changes on the approach of component vibration testing in comparison to the state of the art.
5.1 Real World Excitation on Different Surfaces and Events
The data for analysis was measured on serial production cars in real world environments on different road surfaces under varied loading configurations. Each measurement is defined by vehicle, road surface, loading configuration and repetition. The road surfaces include but are not limited to: pot hole–30 kph, cobble stone–30 kph, gully–30 kph, city drive HH-various speeds, country road–100 kph, motorway–130 kph, country roads-various speeds, rough cobble stone–30 kph. Furthermore, the noise floor was measured without engine running (for ICE) and without movement (both BEVs and ICE).
The vehicles used for this analysis are shown in Table 1 with their most relevant technical data.
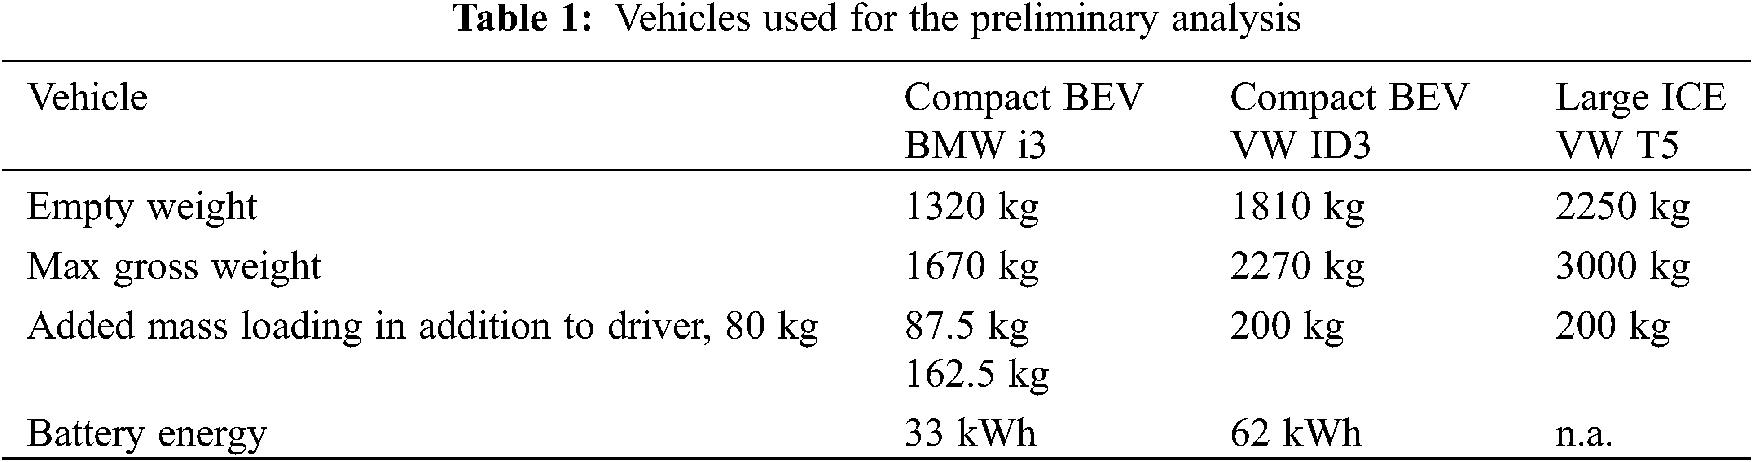
The table shows empty and max gross weight of the vehicles as well as information on the additional loading in the measurement campaign. Beside the mass loading of the driver and minor other masses, the additional masses loaded are given in the table. For VW ID3 and VW T5, the loaded configuration included 200 kg of extra mass, the BMW i3 was measured in the test campaign in two different extra loading configurations. All vehicles were also measured in empty configuration (including driver, etc., with around 80 kg).
The large ICE was used as a general example to analyze how a larger mass rather stiffly coupled to the vehicle floor will change vibration behavior of the overall structure. This will give a first insight in vibrational behavior of highly coupled battery and vehicle interaction as in a cell2car approach.
5.3 Measurement Equipment and Signal Quality
The measurement and data acquisition equipment used is described in Table 2.

Both MEMS and IEPE/ICP sensors were used to measure the acceleration at the same location with the sensors being placed as closely together as possible. This comparison allows a verification of the measurement procedure and equipment used at this early pre-measurement campaign. The results of the comparison are not part of the scope of this contribution. Generally, apart from the minor deviations or particular disadvantages in some aspects mentioned in the following, both yielded the same results for the scope of this analysis. Of course, the general aspect of giving good data quality with both sensor types was checked on a shaker setup prior to the measurement campaign. As a pre-test verification, the parallel measurement was also carried out in the actual vehicle measurements. Mixing, combining or comparing results from both measurement types were avoided for the scope of this contribution.
The MEMS accelerometers were mainly used to get high data quality especially for low frequency range below 10 Hz. The sensors on the given evaluation boards used here in particular show a decay of voltage output for higher frequencies at constant acceleration. Therefore, a linear compensation function between 20 Hz (Amplification 1) and 600 Hz (Amplification 6) was used, which compensated the non-linear frequency behavior of up to roughly 500 Hz quite well with max 6% error. The frequency range below 20 Hz did not need any compensation on the MEMS and yields more precise values than the piezo accelerometers. As most analysis was done either on low-frequency time domain signals or on frequency domain transfer functions between two signals, the uncompensated MEMS results can be used equivalently to the piezo accelerometer data between 10–500 Hz.
For the piezo accelerometers a frequency linearity of up to 5% is specified from 1 Hz on. But in most cases the measured accelerations on ICP are several decades below the maximum measurement range, so that the ICP output voltages are a little noise-prone and need a lot of signal conditioning. Therefore, the higher output voltage per acceleration of the MEMS used here is assumed to yield slightly better results.
The MEMS and IEPE accelerometers were measured with two separate but identical USB data acquisition boxes. As no combination of signals from both measurement setups was used, the general problem of real-time synchronization between two sampling systems is not relevant here.
When looking at signals with particular high kurtosis it was striking that several ICP sensors showed a kurtosis of around 100, while the MEMS sensors in the same places showed values between 3 and 15, i.e., in a pot hole event with the same loaded vehicle. From a closer view on the signals, it is assumed that the screwed connectors of the ICP sensors could have caused short contact losses. On the MEMS sensors the cables are soldered on the printed circuit board directly. However, as any rattling on the vehicle generates significant high frequency input, the MEMS sensors with a decaying frequency sensitivity above 500 Hz will also measure less non-linear contact input prone to cause high kurtosis values on the ICP sensors that can measure much higher frequencies.
Further signal checks were performed based on the comparison of RMS vs. standard deviation (mean offset), high kurtosis or high skewness values (impacting or contact losses) as well as general possible data errors. Questionable data was not used for analysis.
Most of the analysis is done with National Instruments DIADEM 2020. This includes digital filtering, frequency domain compensation, Fast Fourier Transformation (FFT), Power Spectral Densities (PSD), transfer functions with amplitude and unwrapped phase, coherence functions, Cross Spectral Densities (CSD), channel arithmetic for time domain difference functions, statistical distributions (random probe) and statistical key figures like Root Mean Square (RMS), min, max, kurtosis and skewness.
Obviously, many findings can be derived of measurements from the first 66 measurements on at least eight channels with the three different cars in 2–3 loading conditions, over 4–6 different events/road conditions with one or two independent measurement systems (MEMS and ICP) amounting to. The main focus of the analysis in this contribution lies on the three questions in Chapter 3, which need to be answered for a realistic approach of mechanical component testing for large floor batteries:
• Does relevant global bending occur?
• Does relevant local corner bending occur?
• What changes will a more integrated cell placement like cell2car bring in comparison with a more differential decoupled pack approach?
From these questions an adequate testing solution in concept, control and hardware can be developed.
Remarks on the general signal quality and measured vehicle vibration behavior:
• Both measurement procedures with MEMS and ICP sensors lead to very useful, comparable, consistent data even though the MEMS data needed a frequency band compensation to achieve frequency linearity up to 500 Hz. This can be circumvented by using other or modified versions of the MEMS measurement equipment used.
• Most driving conditions-including cobble stone and rough cobble stone-show a kurtosis around 3 (gaussian) on all vertical floor segment corners and axle sensor, both loaded and empty.
• The transient gully and pot hole events show a very high kurtosis >>20 for vertical axle and an elevated kurtosis for vertical floor segment corners, mostly between 5–20.
• In cases of high and elevated kurtosis on the signals: If the acceleration data of time domain difference functions between the different point on the floor segment or battery or difference functions between calculated mean, calculated rigid body moment equivalents and the measured counterparts is used for analysis (i.e., for calculating bending deflection) it needs to be taken account that large differences in the kurtosis of the signals subtracted may lead to a significantly higher kurtosis of the difference function, due to a mean offset. Sometimes the value may reach twice the kurtosis of one of original signals. It is not used for analysis.
Some data on the statistical key figures of two different measurements can be found in Tables 3 and 4. The upper one shows minimum, maximum, root mean square, skewness and kurtosis of a transient pot hole event of an VW ID3 measurement with the MEMS setup and an added mass loading. The lower one shows the same testing configuration on a rough cobble stone track.
The following syntax is used for the generalized points on the chassis and pack:
Be: Bearing between suspension and chassis (input into vehicle body); Ax: Axle of suspension (unsprung masses); RR: right rear; RF: right front; LF: Left front; LR: Left rear; X, Y, Z: directions in vehicle coordinate system; AC: Alternating values without stationary mean.
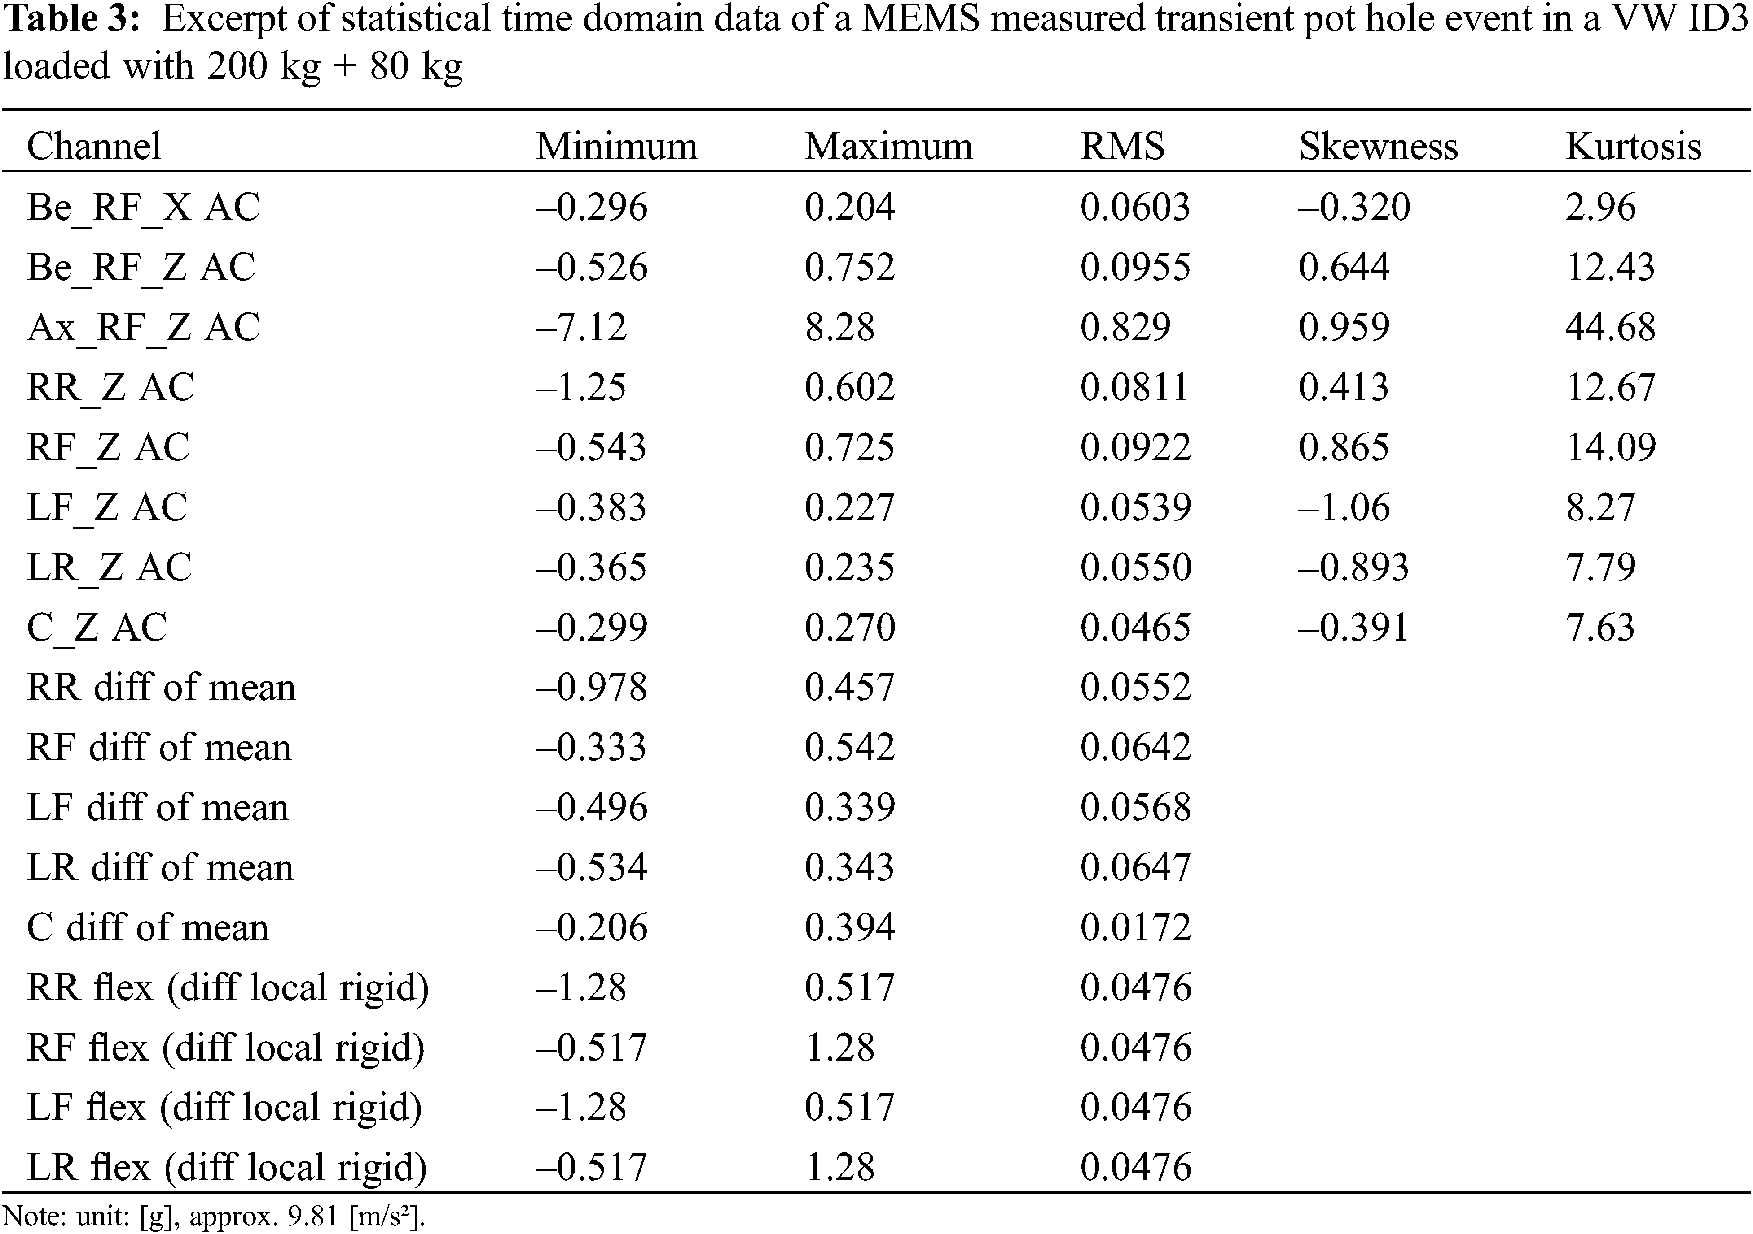
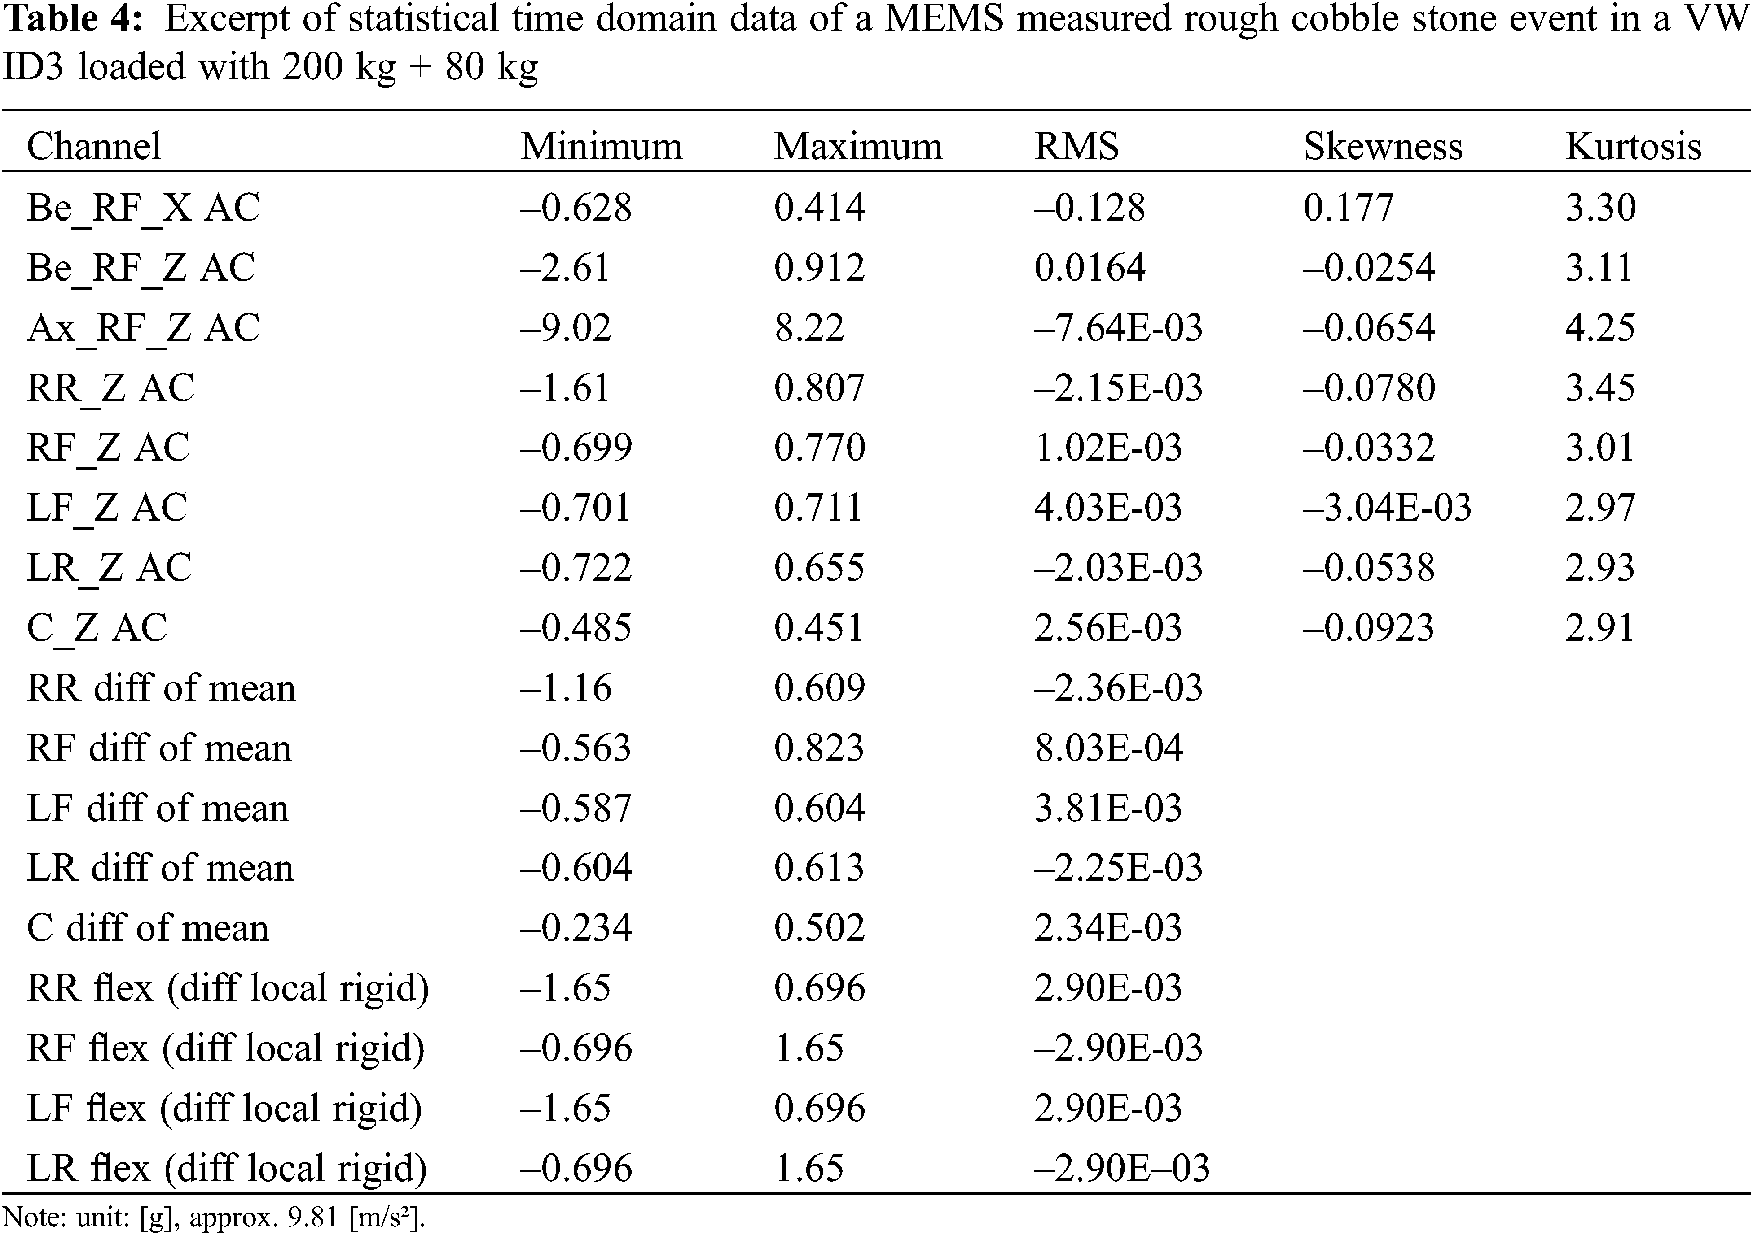
Time-domain check
The quick pre-analysis data check based on the time-domain difference functions clearly shows that relevant bending or torsion effects occur:
In both measurement examples a significant bending can be assumed from comparing the min, max and RMS of the center difference between the movement mean of all four corner points and the measurement point in the middle denominated as “C diff of mean”, amounting to more than 50% of the corresponding values of the simple measurement values of “C_Z AC”, the midpoint of the battery.
Also, both measurement examples indicate a local corner bending or first torsional modes from looking at the local difference functions between calculated rigid body movements and actual measured movements, denominated as “XX flex (diff local rigid)”, also more than 50% of the original measurement files.
6.1 Results Regarding Global Bending
For a more detailed analysis than the simple time-domain difference functions for a quick data check, the frequency domain approach is used. The global bending with the highest deflection to be expected in the middle of the floor segment is characterized by the stiff/mass ratio, which defines the resonance frequency for a single degree-of-freedom vibration (SDOF) system. Obviously, a battery model may need higher mode numbers for an adequate description, but the following general relation remains the same, also for more SDOF systems: As the stiffness of the vehicle body and chassis does not change during use, an added mass loading will change the relevant resonance frequency of the structure. This approach was used to analyze the stiffness behavior of the floor segment of an ICE as well as the battery pack in the floor region of BEVs, see Fig. 8 for a cobble stone road surface. The depicted transfer functions are described in Chapter 4.5. Coherences of the signals of Fig. 8 are generally good enough to allow the use of the transfer functions as described. In the case of the BEVs, the global bending was measured not on the vehicle body or chassis but on the battery pack itself, being the point of interest. In this case the question arises whether the battery pack is so stiff and decoupled from the vehicle structure that added mass loading the vehicle structure does not change the resonance frequency of the battery pack.
Both the VW ID3 and BMW i3 show significant global bending modes. The VW ID3 has significant global bending resonances at around 60 and 180 Hz with amplifications of 10 and 3. The BMW i3 has significant global bending at around 40 and 110 Hz with amplifications of 10 and 3.
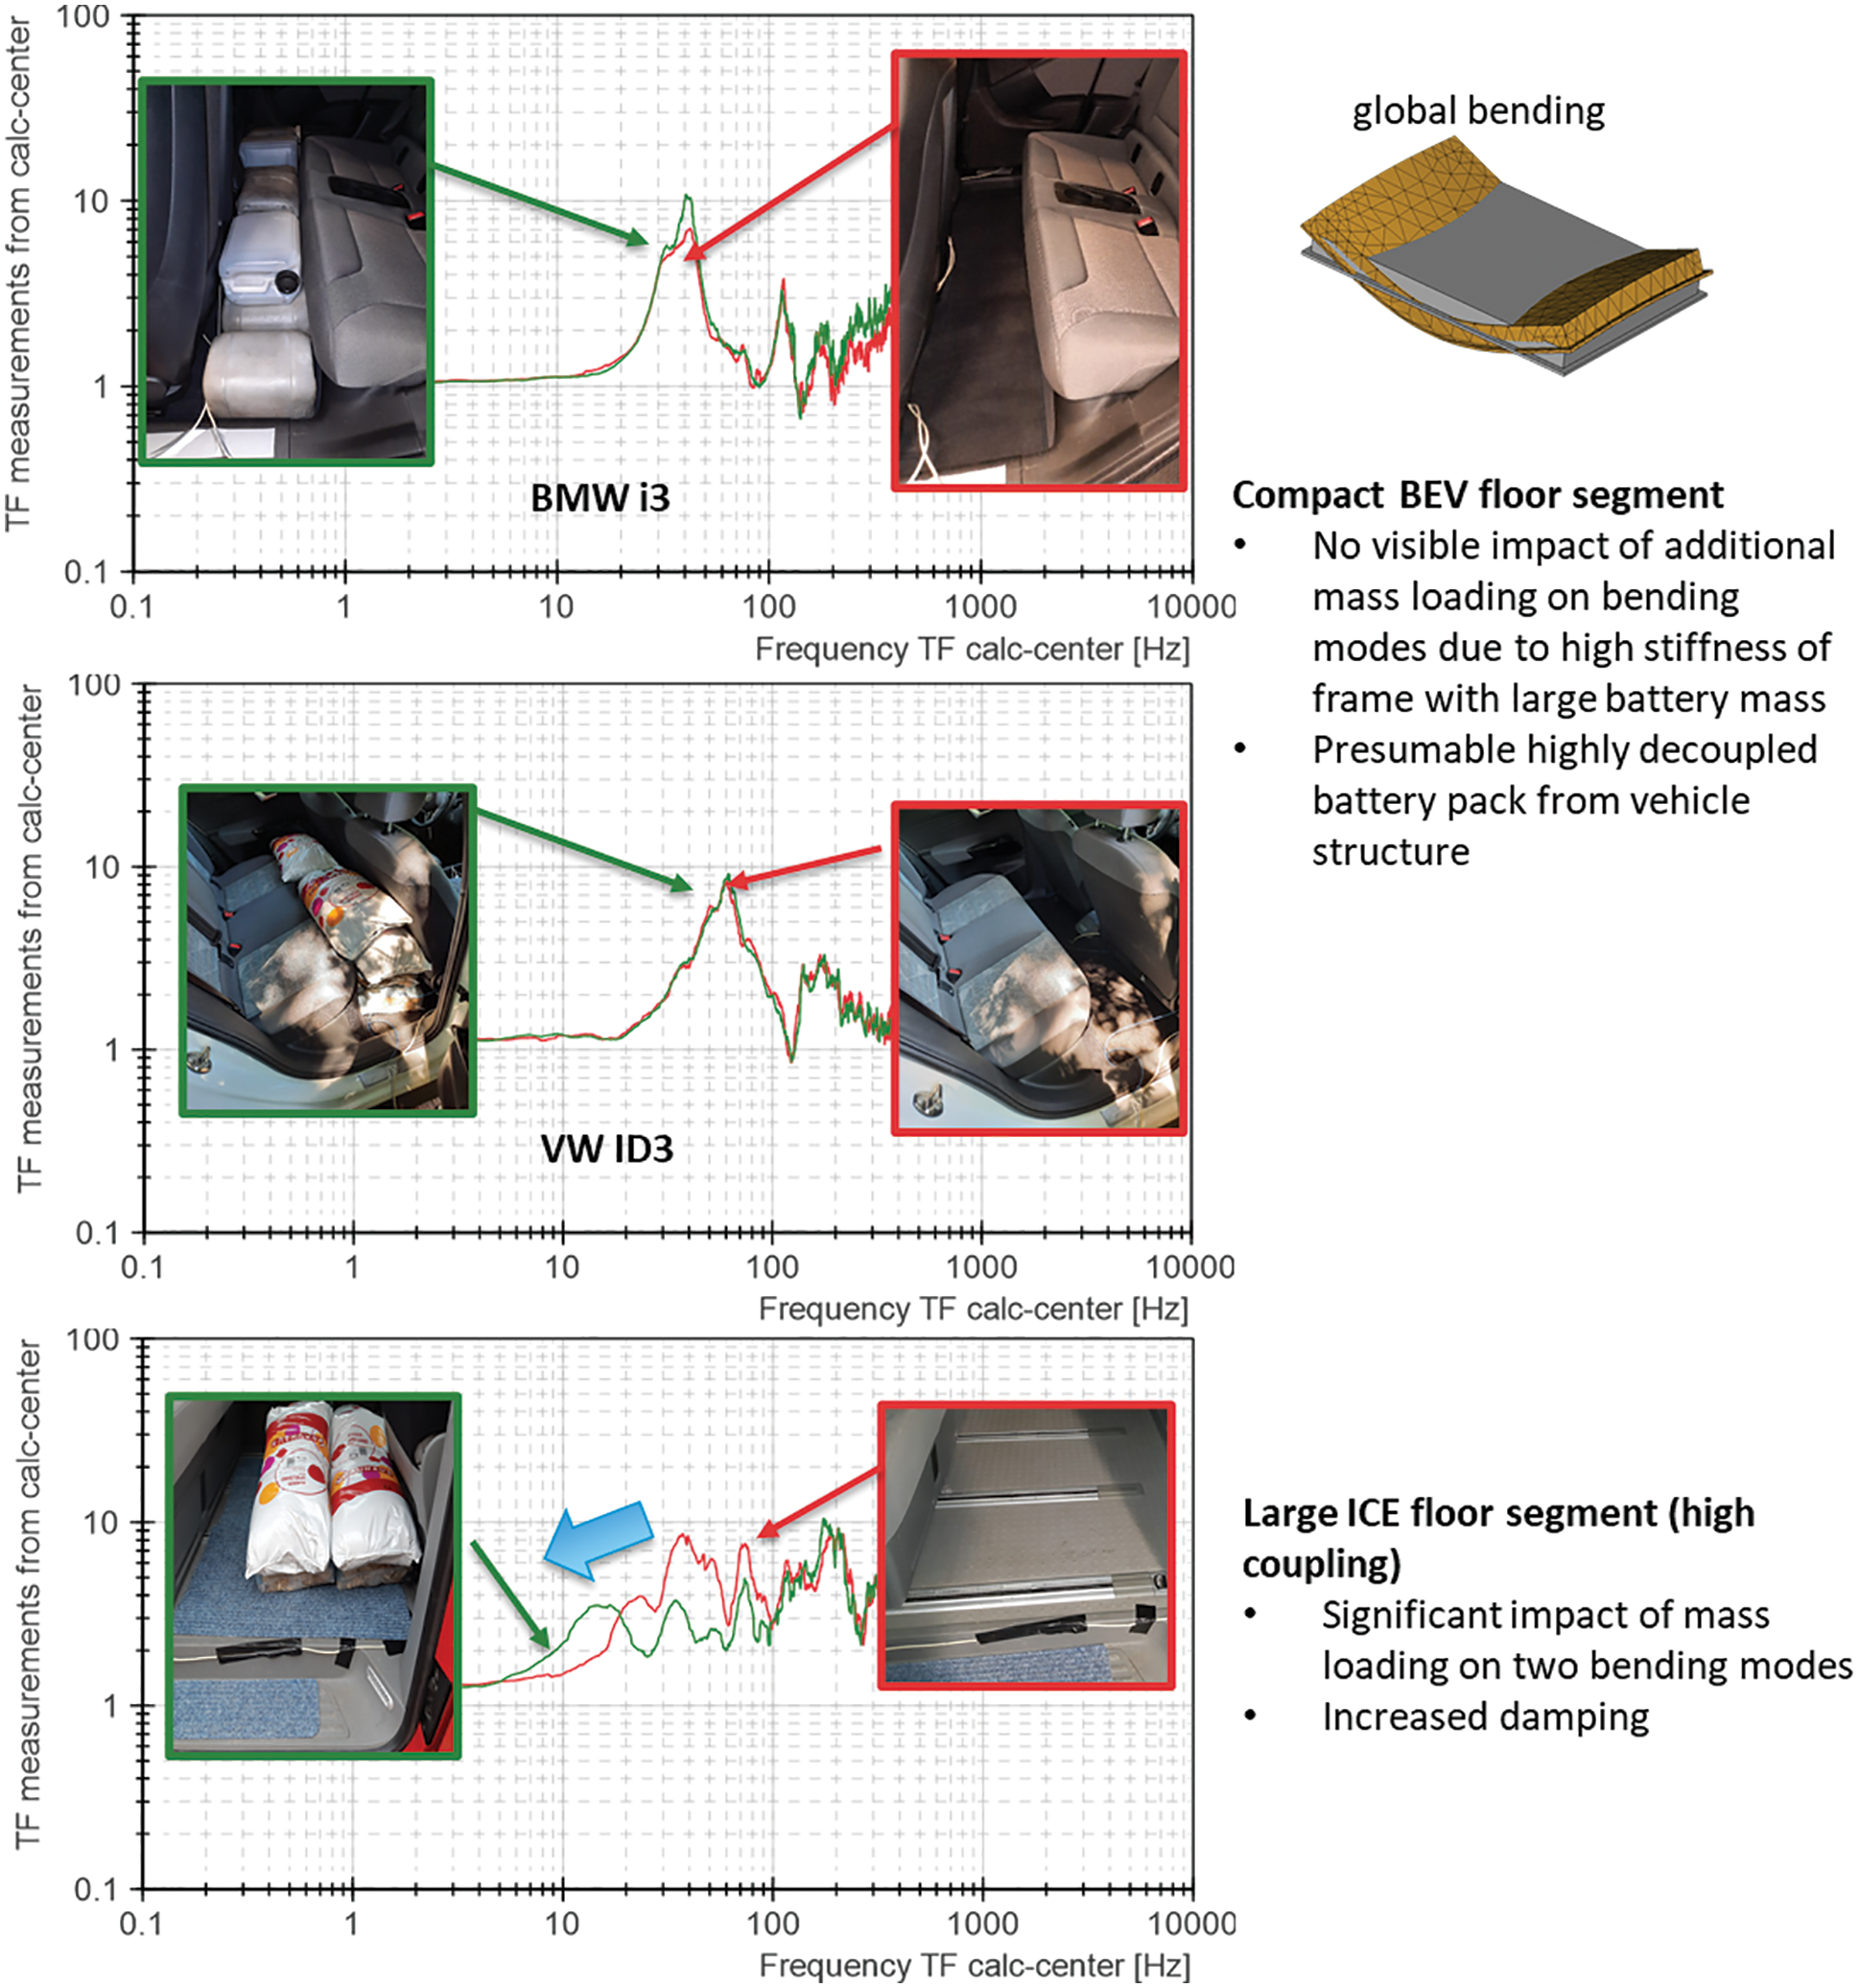
Figure 8: Frequency shift by added mass loading in ICE floor segment in comparison of center transfer functions with compact BEV with stiff battery pack decoupled from load carrying vehicle frame
Both BEV show a totally decoupled behavior, because the added mass does not lower the resonance frequency of the battery’s center. The battery pack in both the BMW i3 and VW ID3 is a very stiff block that is mounted into a mostly stiff battery compartment with the load carrying vehicle frame around. The battery pack seems to be well decoupled from the vehicle frame (body & chassis) carrying the added loading, both parts being rather stiff. The mechanical interaction of the battery with the load carrying vehicle structure is quite low.
Global damping properties cannot be derived really accurately due to only one center measurement point in the middle with no verification that it was mounted in the global mode shape maximum. But an amplification of around Factor 10 seen in the measurement plots indicates a damping ratio of at least 5%.
Regarding artificially generated vibration environments in a lab it is noted that highly coherent excitations in amplitude and phase at the four corners (i.e., all move up and down synchronously) yield higher amplification ratios in bending resonances. Therefore, it is of importance that the coherence of the four excitation points over frequency on a lab test stand reflects the real-world excitation coherence. Completely interlocked excitation of the four corner excitation points (coherence near 1) would potentially overtest the battery pack, but still be conservative.
6.2 Results Regarding Local Corner Bending
The influence of corner excitation coherence changes when looking at the local corner bending.
In this case a highly incoherent excitation in amplitude and phase at corners (coherence near 0) yield higher bending stresses and deformations in structure. Therefore, a completely uncorrelated corner excitation (i.e., each corner point has an own random signal generator, not synchronized) would potentially overtest the battery pack, but still be conservative.
Together with the opposite effect in global bending this leads to the necessity of a close resemblance of the corner excitation coherence in the lab to the measured signals. An example comparison between the large ICE and the compact BMW i3 with stiff decoupled battery pack is shown in Fig. 9 for empty rough cobble stone driving conditions.
The mid-level coherence of the plots reflects the strong interaction of the corners with load carrying vehicle frame (in contrast to the global center bending).
6.3 Results Regarding Higher Structural Coupling as in a Cell2car Approach
As an indicator for the trend towards higher integration levels (cell2car) a large ICE (VW T5) was measured with and without added mass in the middle of the floor segment, too. For the large ICE, the added mass in the middle of the floor segment significantly lowers two resonance frequencies in the transfer function from calculated rigid center to measured center, see Fig. 8. It is assumed, that one global bending resonance mode describes a bending around X and the other around Y direction of the vehicle coordinate system. Both would be affected to some degree by the added mass while stiffness remains the same.
These two extremes are shown, because current developments of battery packs seem to move towards more integrated, load-carrying battery structure and away from a stiff, decoupled battery “block” pack as in the BMW i3 and VW ID3.
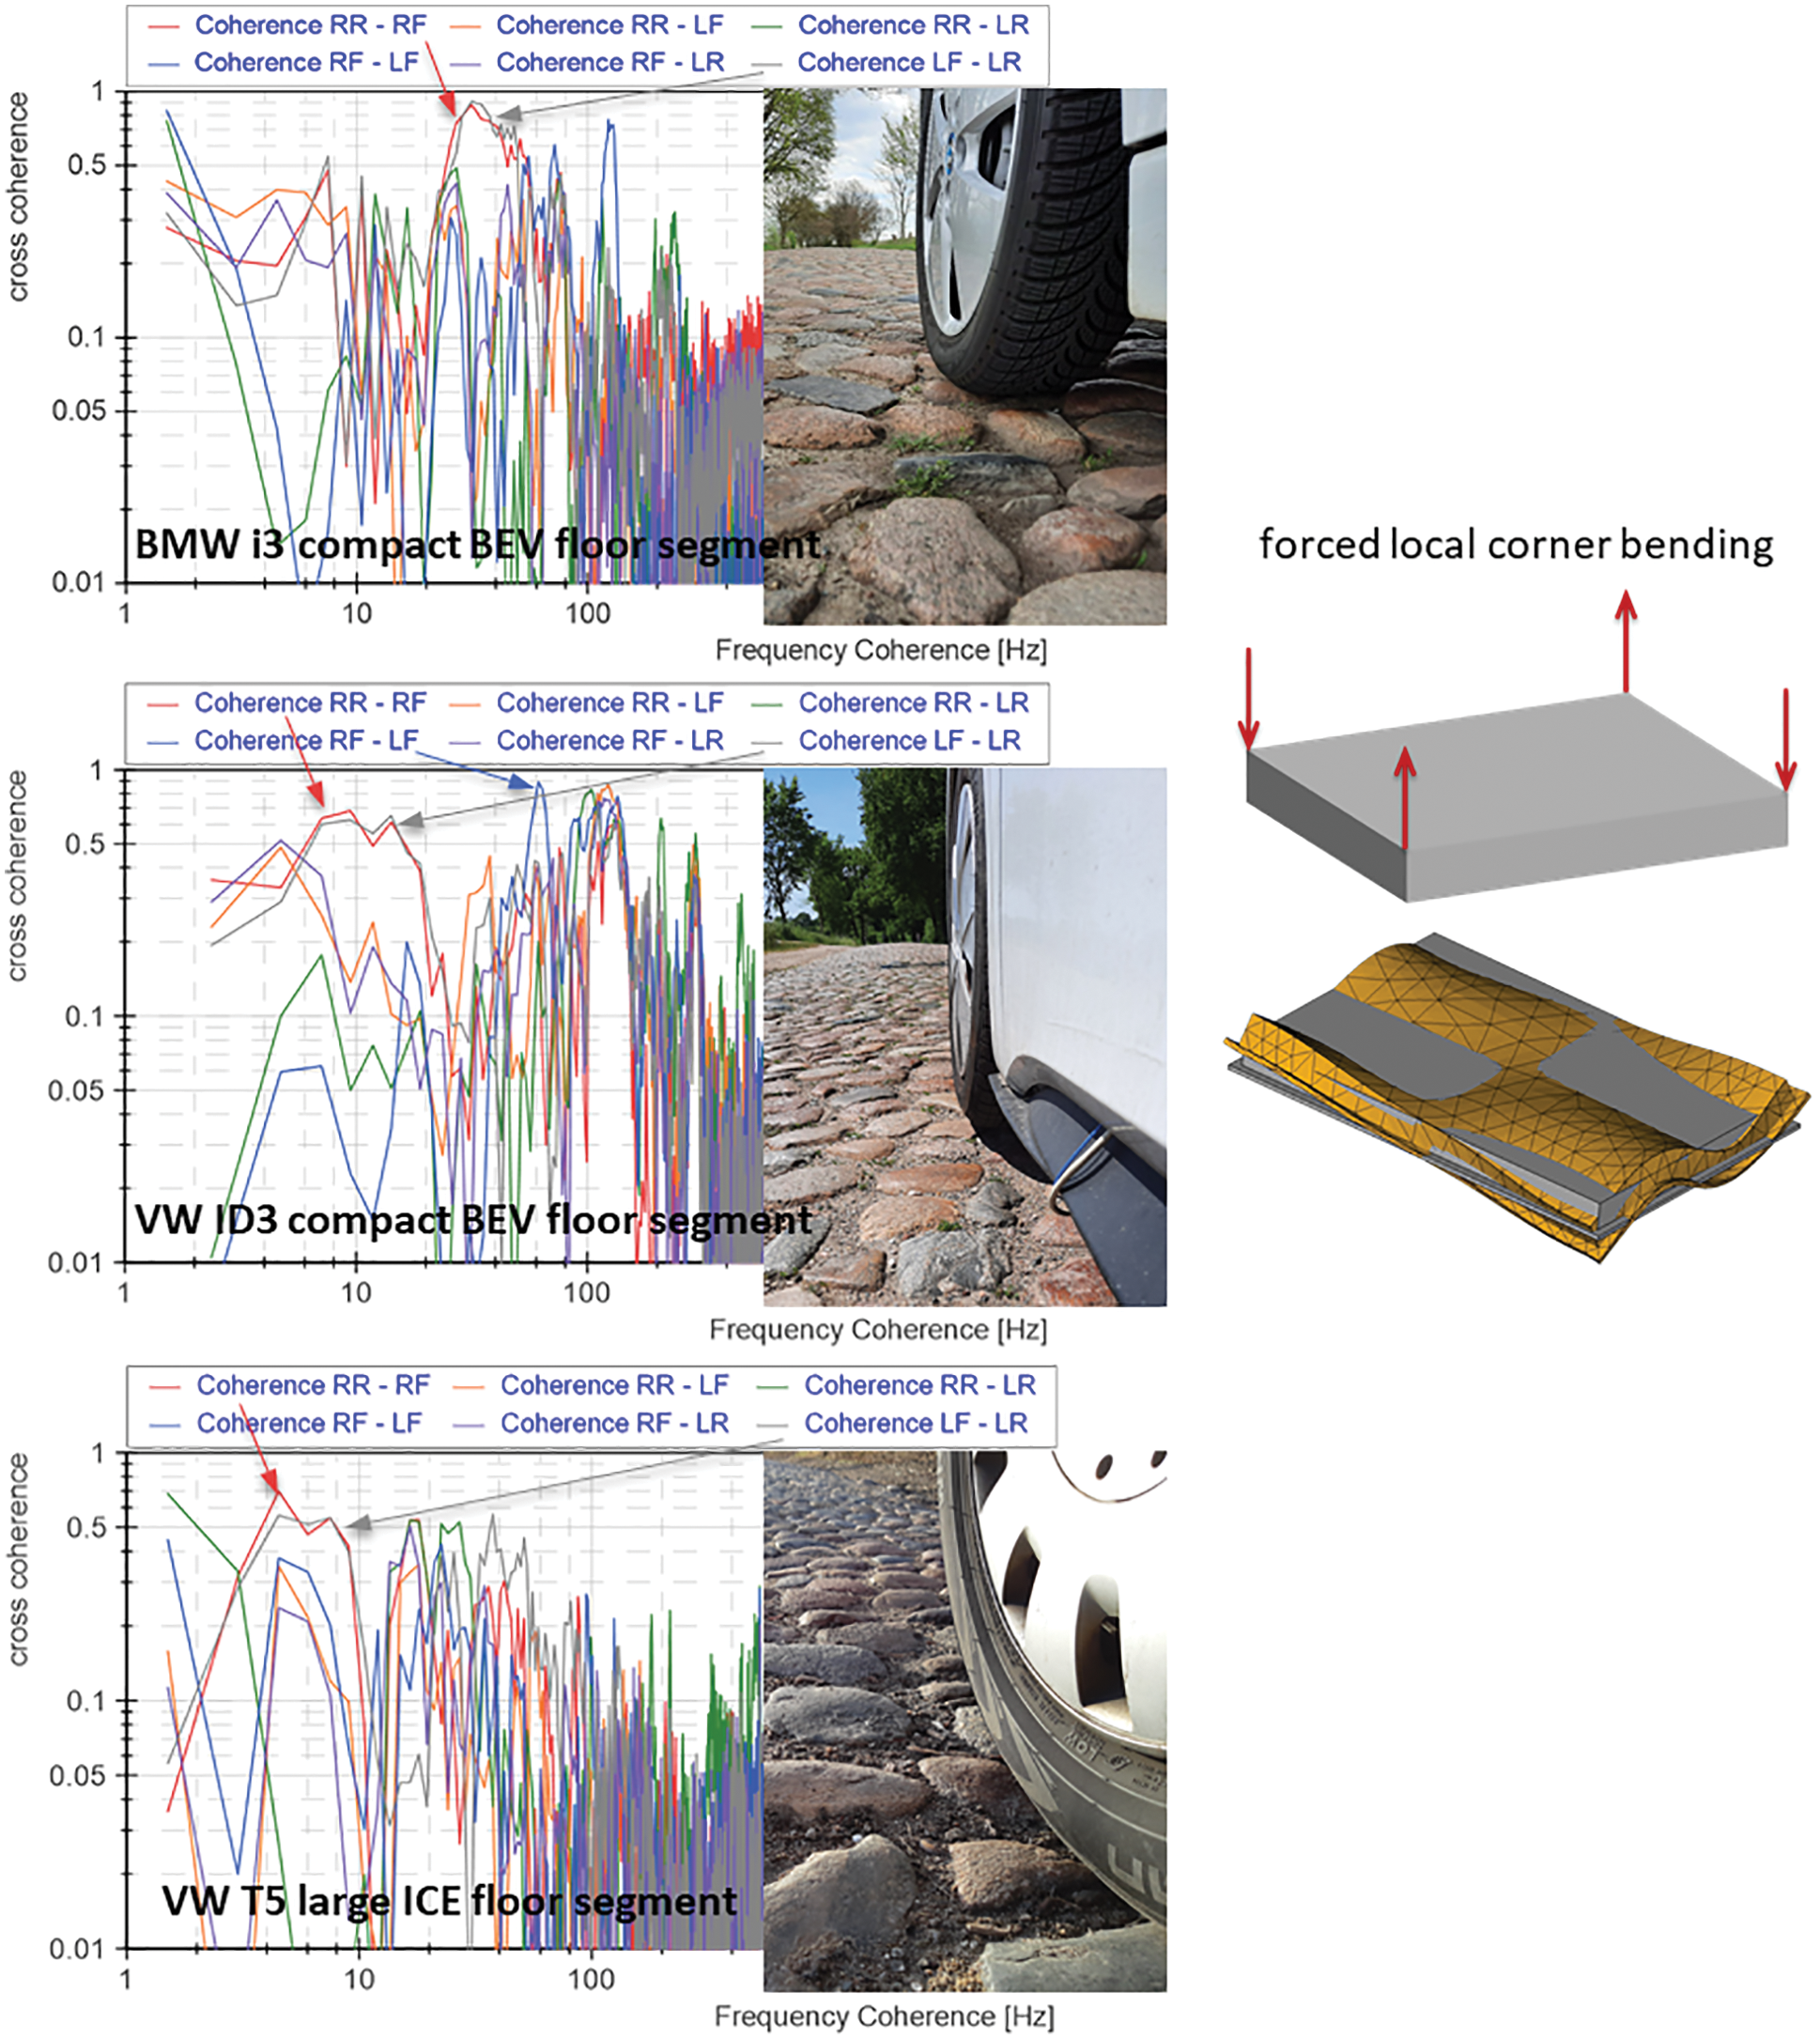
Figure 9: Coherence functions over frequency between corner movements and center on stiff decoupled battery packs of BMW i3 and VW ID3 BEVs vs. a strongly coupled mass on large ICE floor segment
This early analysis of a pre-test measurement campaign is based only on measurements of two BEV and one ICE. Therefore, the results cannot be generalized regarding the given quantitative information. So far, the effects found relevant for future testing requirements can be only generalized on a qualitative scale. Additionally, a quantifiable analysis of a broader data base will use more detailed methods like FDS and Shock Response Spectrum (SRS). Therefore, no PSD plots for potential random vibration testing environments are given in this contribution as more test results are needed to derive a proper test specification regarding vehicle life and fatigue damage effects.
Generally global resonance bending is important because of multiplying stresses in the structures, especially for flexible heavy structures like large battery packs. The measurements show that all vehicles have significant global bending of amplification Factors 10 or more in the frequency range of up to 200 Hz. Even though the measurement setup with only a few points does not allow a high precision, the damping ratio of global bending modes can be assumed to be ca. 5% from amplification up to Factor 10. High modal mass fractions are likely for main global bending modes, indicating a general potential of high stresses.
The comparison of a very stiff battery pack more or less decoupled from a rather stiff frame as in VW ID3 and especially in BMW i3 with the example of highly coupled loading in a common ICE transport vehicle indicates what can be expected in a more integrated structure with a stronger coupling. Generally, the interaction of large battery masses with the vehicle structure is likely to change vibration and shock environments on the battery pack. The more integrated a cell2car approach gets and the less levels of supporting structures between cell and vehicle it has, the more bending and torsion will cause stresses on cell level.
The data shows that the forced local bending at corners is mid-level correlated with 20%–50% coherence in lower frequency band. Slightly higher coherence values can be found for stiffer structure (edge frequency between 50 Hz for lower stiffness, 80 Hz for higher stiffness). Generally, forced corner bending was found up to at least 500 Hz.
From the presented data and the resulting analysis some requirements for a component testing approach of large floor-mounted traction battery packs can be derived:
The vibration testing needs an excitation and setup that allows conservative equivalents or replications of real mechanical environments to cause global bending in resonances. Furthermore, an individual excitation of the four corners of a battery traction pack is important to replicate the real world’s coherence. However, the right mechanical impedance of test setup and interfaces is crucial: A very stiff fixture with identical excitation on all four corners potentially overtests global bending and undertests local corner bending. A completely independent movement of all four corner points potentially overtests local corner bending and undertests global bending. A matched coherence between lab and real-world excitations would solve this problem. This may be done mechanically or by control methods.
The need for further research is especially seen in
• creating a broader data base from more measurement campaigns with more data in higher spatial and frequency resolution,
• deriving simple models to describe the interaction between vehicle and battery pack so that vibration levels design requirements and for test specifications can be derived during the development process of the vehicle and not only when everything is finished,
• developing a suitable test infrastructure with multi-point excitation and interfaces that can replicate realistic interaction with vehicle and excitation.
Funding Statement: The author received no specific funding for this pre-study. There are pending funding proposals for the further progress of the path described. We acknowledge support for the article processing charge by the Open Access Publication Fund of Hamburg University of Applied Sciences.
Conflicts of Interest: The author declares that they have no conflicts of interest to report regarding the present study.
1. UN (2015). Recommendations on the transport of dangerous goods-manual of tests and criteria (Rev. 6). New York, USA: United Nations. [Google Scholar]
2. Verein Deutscher Ingenieure/Verband der Elektrotechnik, Elektronik, Informationstechnik (2020). VDI/VDE, 2206 Development of Cyber-physical Mechatronic Systems (CPMS)/Entwicklung Cyber-Physischer Mechatronischer Systeme (CPMS). Verein Deutscher Ingenieure/Verband der Elektrotechnik, Elektronik, Informationstechnik. German Technical Standard. [Google Scholar]
3. Sun, P., Bisschop, R., Niu, H., Huang, X. (2020). A review of battery fires in electric vehicles. Fire Technology, 56, 1361–1410. DOI 10.1007/s10694-019-00944-3. [Google Scholar] [CrossRef]
4. Linja-aho, V. (2020). SAE J2990:2019-Hybrid and Electric Vehicle Fires in Finland 2015–2019. Fires in Vehicles (FIVE) conference. [Google Scholar]
5. SAE (2019). SAE J2990:2019-Hybrid and EV first and second responder recommended practice, (7th ed.). SAE Standard. [Google Scholar]
6. ISO (2012). ISO 16750-3 Road vehicles-Environmental conditions and testing for electrical and electronic equipment–Part 3: Mechanical Loads. ISO. [Google Scholar]
7. Ruiz, V., Pfrang, A., Kriston, A., Omar, N., van den Bossche, P. et al. (2018). A review of international abuse testing standards and regulations for lithium ion batteries in electric and hybrid electric vehicles. Renewable and Sustainable Energy Reviews, 81, 1427–1452. DOI 10.1016/j.rser.2017.05.195. [Google Scholar] [CrossRef]
8. Kutka, H., Müller, C., Fülöp, T., Dörnhöfer, A. (2018). Multilevel fatigue analysis of RESS in BEV/HEV-Multilevel-Festigkeitsentwicklungen der HV-Speicher von BEV/HEV-Fahrzeugen. Berichtsband zur 45. Tagung des DVM-Arbeitskreises Betriebsfestigkeit, Renningen, Germany. [Google Scholar]
9. Hooper, J. M., Marco, J. (2016). Defining a representative vibration durability test for electric vehicle (EV) rechargeable energy storage systems (RESS). World Electric Vehicle Journal, 8, 327–338. DOI 10.3390/wevj8020327. [Google Scholar] [CrossRef]
10. Hooper, J. M., Marco, J. (2014). Characterising the in-vehicle vibration inputs to the high voltage battery of an electric vehicle. Journal of Power Sources, 245, 510–519. DOI 10.1016/j.jpowsour.2013.06.150. [Google Scholar] [CrossRef]
11. ISO (2020). ISO 19453-6 Road vehicles-environmental conditions and testing for electrical and electronic equipment–Part 6. Traction battery packs and systems. ISO. [Google Scholar]
12. Dörnhöfer, A. (2019). Betriebsfestigkeitsanalyse elektrifizierter Fahrzeuge (Fatigue analysis of electric vehicles). Berlin Heidelberg, Germany: Springer. [Google Scholar]
13. Kovachev, G., Ellersdorfer, C., Gstrein, G., Hanzu, I., Wilkening, H. M. R. et al. (2020). Safety assessment of electrically cycled cells at high temperatures under mechanical crush loads. eTransportation, 6, 100087. [Google Scholar]
14. Schramm, D., Hiller, M., Bardini, R. (2014). Vehicle dynamics: Modeling and simulation. Berlin Heidelberg, Germany: Springer. [Google Scholar]
15. Hooper, J. M., Marco, J. (2015). Experimental modal analysis of lithium-ion pouch cells. Journal of Power Sources, 285, 247–259. DOI 10.1016/j.jpowsour.2015.03.098. [Google Scholar] [CrossRef]
16. Schmitt, A., Seifried, R., Sandmann, K., Zillmann, B. (2018). Efficient vehicle simulation to calculate acceleration loads in electric vehicle batteries. Berichtsband zur 45. Tagung des DVM-Arbeitskreises Betriebsfestigkeit, Renningen, Germany. [Google Scholar]
17. de Klerk, D., Rixen, D. J., Voormeeren, S. N. (2008). General framework for dynamic substructuring: History, review and classification of techniques. AIAA Journal, 46, 1169–1181. DOI 10.2514/1.33274. [Google Scholar] [CrossRef]
18. Piersol, A. G., Paez, T. L., Harris, C. M. (2010). Harris’ shock and vibration handbook. (6th ed.) New York, USA: McGraw-Hill Professional. [Google Scholar]
19. Ahlin, K. (2006). Comparison of test specifications and measured field data. Sound and Vibration, 40(9), 22–24. [Google Scholar]
 | This work is licensed under a Creative Commons Attribution 4.0 International License, which permits unrestricted use, distribution, and reproduction in any medium, provided the original work is properly cited. |