| Sound & Vibration |
DOI: 10.32604/sv.2022.015267
ARTICLE
Dimensional Amplitude Response Analysis of Vibrations Produced by Defects in Rolling Contact Bearings
1Department of Mechanical Engineering, The National Institute of Engineering, Mysuru, Karnataka, 570008, India
2Department of Mechanical Engineering, AIKTC, School of Engineering and Technology, New Panvel, Navi Mumbai, Maharashtra, 410206, India
*Corresponding Author: Imran M. Jamadar. Email: imranjamadar2@gmail.com; imjamadar@nie.ac.in
Received: 05 December 2020; Accepted: 02 March 2021
Abstract: Usage of rolling contact bearings in variety of rotor-dynamic applications has put forth a need to develop a detailed and easy to implement techniques for the assessment of damage related features in these bearings so that before mechanical failure, maintenance actions can be planned well in advance. In accordance to this, a method based on dimensional amplitude response analysis and scaling laws is presented in this paper for the diagnosis of defects in different components of rolling contact bearings in a dimensionally scaled rotor-bearing system. Rotor, bearing, operating and defect parameters involved are detailed for dimensional analysis using frequency domain vibration data. A defect parameter for modeling all the three dimensions of the defect as well as the different shapes like square, circular, rectangular is put forth which takes into account the volume as well as the surface area of the defect. Experimental data set is generated for the ‘model’ bearing (designated as SKF30205J2/Q) using Box-Behnken design of response surface methodology for solution of the theoretical model by factorial regression approach. Obtained metamodel is then used for the prediction of the objective variable, i.e., Vibration acceleration amplitude at the defect frequency component for other types of ‘test’ bearings (designated as SKF 30305C and SKF 22220 EK) using the developed scaling laws. Confirmation experiments showed that the computable relationship amongst objective variable and the dimensionless parameters can be forecast and correlated.
Keywords: Dimensional-amplitude-response; scaling laws; metamodels; rotor-bearing system
Nomenclature
| d | Inner bore diameter, mm, (L) |
| D | Outside diameter, mm, (L) |
| B | Width, mm, (L) |
| d1 | Pitch diameter, mm, (L) |
| dr | Rolling element diameter, mm, (L) |
| Z | No. of rollers, --, (F0 L0 T0) |
| mi | Inner race mass, kg, (F1 L-1 T2) |
| mo | Outer race mass, kg, (F1 L-1 T2) |
| ms | Shaft mass, kg, (F1 L-1 T2) |
| mr | Mass of roller, kg, (F1 L-1 T2) |
| mc | Bearing cage mass, kg, (F1 L-1 T2) |
| md | Rotor disc mass, kg, (F1 L-1 T2) |
| L | Roller length, mm, (L) |
| E | Young’s modulus, N/mm2, (F1 L-2) |
| Ρ | Density of material, kg/mm3, (F1 L-4 T2) |
| Δ | Bearing deflection, mm, (L) |
| FH | Hertzian contact force, N, (F) |
| C | Damping coefficient, N-s/mm, (F1 L-1 T1) |
| Δ | Effective defect size parameter, mm, (L) |
| K | Constant for load-deformation, |
| N/mm1.11 | for roller bearings, (F1 L-1.11) |
| N/mm1.5 | for ball bearings, (F1 L-1.5) |
| wd | Width of the defect, mm, (L) |
| dd | Depth of the defect, mm, (L) |
| ld | Length of the defect, mm, (L) |
| Dd | Diameter of the defect, mm, (L) |
| As | Surface area of the defect, mm2, (L2) |
| Vd | Volume of the defect, mm3, (L3) |
| rc | Radial clearance, μm, (L) |
| N | Speed of shaft, rpm, (T-1) |
| W | Radial load, N, (F) |
| Fa | Axial load, N, (F) |
| Mu | Unbalance mass, gram, (F1 L-1 T2) |
| υ | Lubricant Viscosity, mm2/s, (L2 T-1) |
| fFTF | Fundamental train frequency, Hz, (T-1) |
| fVCF | Varying compliance frequency, Hz, (T-1) |
| fBPFO | Outer race defect frequency, Hz, (T-1) |
| fBPFI | Inner race defect frequency, Hz, (T-1) |
| fBSF | Roller spin frequency, Hz, (T-1) |
| fRDF | Roller defect frequency, Hz, (T-1) |
| | Vibration acceleration, m/s2 or g, (LT-2) |
| Abbreviations | |
| DA | Dimensional Analysis |
| DARA | Dimensional Amplitude Response Analysis |
| COM | Condition Monitoring Program |
| DEB | Drive End Bearing |
| NDEB | Non-Drive End Bearing |
| FD | Forced Draft |
| SA | Secondary Air |
| ID | Induced Draft |
| BBD | Box-Behnken Design |
Rolling contact bearings commonly known to be antifriction bearings are the most widespread and acute components in majority of the rotating machines. Occurrence of defects/damages can put operation and service of these machines on the risk. Hence, timely detection of these defects is an important issue as far as safe and normal operation of these machines is concerned. Accordingly, it calls for a systematic and routinely planned bearing health monitoring program. From long time, vibration signal assisted condition monitoring of rotating machines has gained a substantial importance and is a major area of study. As a result of that numerous refined techniques have been developed to extract defect related features from the vibration signatures obtained from accelerometers attached with the bearing housing or placed in the machine vicinity [1]. On every occasion, the defective bearing components interact with each other, it generates an impulsive force for a short duration of time and acts as source of excitation and sets the components of bearing to vibrate at the resonant frequencies [2]. Hence, the response measured in terms of the vibration signature on the housing of bearing reveals a pattern comprising of series of frequency spikes conquered by major system resonant frequency components. The time for which this impulse is in action is very short in comparison with time interval between two consecutive impulses.
Hence, the impact energy due to this impulsive force is spread over a wide frequency range and usually is concealed by noise and unwanted low/high frequency components. These defect related frequencies are referred as the characteristic bearing vibration frequencies and are dependent on geometrical parameters and the shaft speeds. As the rolling elements are continuously entering and leaving the loading zones, sometimes may experience slippage/skidding also and hence the appearance of the defect related force impacts will never retrace the same exact previous position from cycle to cycle. Also, whenever the defect location is moving in and out of the loading zone, the series of force impacts are curbed in amplitude. All these points makes analysis and detection of bearing defects more complex problem and estimation of the defect related features a difficult one [1,3]. Conventionally there are two main approaches in the vibration based defect diagnosis of rolling contact bearings. They include running the undamaged bearing until its failure and continuously monitoring changes in their vibration responses. The other one includes deliberately creation of defects/scratches on the different components of these rolling contact bearings by a suitable method and comparing vibration response of these artificially defected bearings with the healthy bearings by monitoring vibration signals either in time domain or in frequency domain or both. As a result of that, different theories and techniques have developed over the years a small history of which is discussed here. One of the pioneering work in this area has been done by McFadden et al. [2], who developed a theoretical model to describe vibration behavior of the inner race defected rolling contact bearings running under the radial load. In this work, vibration due to the defect is modeled as a product of serial force impulses appearing at the characteristic inner race defect frequency. For the purpose of analysis of the vibration signal, they used high frequency resonance technique and furthermore utilized this work to detect the multiple defects [4]. Ohta et al. [5] experimentally investigated the vibration behavior of the healthy taper roller bearings running under different speeds and loads and specified the reasons of vibrations into these bearings. A theoretical model developed by Tandon et al. [6] predicted the significant defect frequencies and amplitudes and reported the existence of ‘sidebands’ around these defect frequencies. Wang et al. [7] proposed a vibration model for a bearing running under very low shaft speeds and made simplifications by incorporating the envelop-autocorrelation function into this model.
Peter et al. [8], compared the application of the wavelet analysis (WA) and Fast Fourier Transform (FFT) in the fault diagnosis scheme and reported that both these method perform well in the detection of outer race faults but WA is more prominent in diagnosis of the inner race/roller faults. A single sided auto-power spectrum and cross power spectrum of the original time domain signal is computed that has successfully revealed the existence of the emerging bearing faults and located the damage propagation in any types of ball bearings [9]. Liew et al. [10] developed a nonlinear dynamic model in that the centrifugal load on the rollers and axial dynamics have been incorporated to analyze the chaotic bearing vibrations at higher speeds and reported the considerable effect of bearing preloads on the unbalance responses. Shi et al. [11] integrated wavelets and envelop spectrum in that the wavelet analysis was applied to decompose the original vibration signal into the different scales and then the defect related frequency components were obtained to trace fault related features of defective bearing components. Choy et al. [12] carried out experimental investigations on the defective bearing components and proposed a method that utilizes the vibration signature analyzing schemes such as Poincare maps and reported the usefulness of modified Poincare maps to find out the pinpoint damages in the different bearing components. Choudhury et al. [13] proposed an analytical model that has predicted the characteristic defect frequency and the side bands components around the defects frequencies particularly in case of inner race or roller defects. The amplitude values have also predicted for these frequency components in that the amplitude value of the outer race defect is more than that of inner race/roller defects.
Zeki et al. [14] applied finite element based vibration analysis technique for the detection of single and multiple defects. A nodal excitation function was used to provide external loading due to the presence of defects and the time domain parameters such as rms, crest factor, kurtosis and the frequency domain parameters such as band energy ratio have been used to detect the position and the number of defects. Arslan et al. [15] developed a nonlinear dynamic model to investigate the vibration behavior of the defective angular contact ball bearings and reported the presence of defect frequencies in the vibration spectrum of the faulty bearings as compared to a healthy bearing spectrum. Also they observed that, there is increase in the vibration amplitudes of the defective frequency components due to the increase in preloads. Cao et al. [16] developed a vibration model for the spherical roller bearings using the Lagrange equations and conducted experiments to understand the effect of operating parameters, bearing geometry and defects on the dynamic behavior of the spherical roller bearings. Sawalhi et al. [17] formulated a combined model for gearbox test rig and the localized bearing faults based on Hertzian contact theory to simulate vibration behavior of the whole system of gears consisting of shaft supported in bearings. Also they used signal processing techniques such as spectral kurtosis, envelope analysis and spectrum comparison for the detection of the localized spalling of the inner/outer race or rollers and further applied this work for the detection extended inner and outer race spalls [18]. Khalid et al. [19] applied autocorrelation of the vibration signal which was originally filtered out using the wavelets in that bearing impulse response was used to derive the wavelet base function. Also they used the kurtosis maximization criteria to optimize the wavelet shape parameters. Wang et al. [20] applied autoregressive method that was based on time difference and vibration amplitude. A relationship developed between the autoregressive method and a back-propagation neural network (BPNN) has used to classify the different fault types.
Desavale et al. [21,22] developed non-dimensional model equations using the conventional Buckingham’s pi theorem and applied it to test damaged spherical roller bearing along with multivariable regression analysis and neural networks. Sawalhi et al. [23] proposed spall size estimation procedure based on pre-whitening of the experimental vibration signal and octave band analysis based on theory of wavelets. The impact time between entry and exit of a fault and the corresponding acceleration response have been used as a tool for the determination of the spall size. Tang et al. [24] proposed modeling method for overcoming the shortcomings of the loss of the statistical information in the signal processing of vibration data based on the box theory for the fault diagnosis of the rolling contact bearings. Gao et al. [25] proposed a force model for investigation of the nonlinear dynamic characteristics of a dual rotor system affected by the localized surface defects on the raceways of the rolling contact bearing. It was observed that the fault related resonant vibration frequencies to be determined by the rotation speed ratio whereas the amplitudes of the vibration to be determined by the depth and span of the defect. Yang et al. [26] developed impulse sequence model and nonlinear multibody dynamic bearing model for elucidation of the difference of the fault signatures for different bearings operating in different surrounding. It is noticed in this study that the vibration amplitudes of the characteristics to be dependent on the initial bearing clearance, radial loads, position of the defects and the random speed fluctuations.
Chen et al. [27] performed experiments for studying the vibration signal transfer characteristics from the ball bearing to the casing measuring points using impulse response method. The fault related features were extracted with the help of the envelope and wavelet analysis and explored the effect of the stiffness of the bearing housing and casing on the vibration attenuation. The developed methodology was then implemented for practical aero engine fault diagnosis. Khanam et al. [28] performed impact force evaluation based on the principles of engineering mechanics for the development of model to diagnose the localized bearing faults. The magnitude of the excitation force was found to be the function of the bearing geometric parameters, operating speed, load and the defect size. Attoui et al. [29] proposed a time-frequency procedure which combines wavelet packet decomposition energy distribution and selection of the highly impulsive frequency band for fault detection of the ball bearings. Jadhav et al. [30] put forth an approach based on the dimensional analysis for the diagnosis of the distributed defect in rolling element bearings. Buckingham’s pi theorem was used for obtaining the mathematical model of the vibration velocity amplitude due to presence of distributed defects. The experimental validation of the theoretical model was also presented for the case of outer race defect and inner race defect.
From the literature it is observed that the available dynamic models and signal processing techniques have been used mainly to recognize the features such as rms, peak vibration amplitudes, and defect frequencies in frequency domain and statistical parameters such as rms, skewness, kurtosis etc. in time domain. The correlation of the spall sizes, geometric, operating parameters of the rotor-bearing system with the amplitude of the vibration at the characteristic bearing defect frequencies have not been quantified much. With such a correlation, it is possible to gain insight into the defect severity as well as it is possible to study the effect of operating parameters such load, speed, rotor unbalance, etc. Because these parameters are directly affecting the amplitude levels at the characteristic bearing defect frequencies and an overall vibration levels in the machines supported by them. It is also seen that out of the existing approaches for the detection of defects in rolling contact bearings very few have applied it for actual industrial machines [21,27]. Hence, to address these issues, this paper proposes an in-depth DA based dimensional characterization of the vibration acceleration response model and then scaling of an obtained model and its dimensionless representation. The applicability of the proposed DARA of vibrations produced by defects is explored in this study and is effectively applied it in the condition monitoring of various rotating machineries used in the sugar industries such as sugar cane kicker, leveler, fibrizer, ID fan, FD fan, SA fan, etc. The manuscript is organized as, a brief summary of the works related to defection of faults in rolling contact bearings and gaps in the existing literature are given in Section 1. Theoretical formulation of the mathematical model is presented in Section 2. The details of the experimental setup and numerical, experimental results are reported in Section 3. Formulations of the different scaling laws is presented in Section 4. The comparison of the numerical and experimental results for laboratory case study and an industrial case study are presented in Sections 5 and 6, respectively. Important conclusions of this study are reported in Section 7.
2 Theoretical Formulation of Dimensional Amplitude Response Analysis
DA is essentially a means of utilizing correlation analysis of a complex problems wherein a detailed analytical expressions are difficult to work out and a simple and meaningful expressions of the problems are required [31,32]. A DARA of vibration is proposed to find its predictive performance in detecting the bearing defects. Let us assume that the vibration acceleration amplitude at the characteristic defective bearing frequency depends on the parameters such as,
These factors affecting the vibration amplitude of the defective rolling contact bearing are to be expressed in the system of dimensions [32]. According to generalized theorem of DA, if a physical phenomenon contains total ‘m’ variables including the output variable, each involving ‘n’ fundamental dimensions then this phenomenon can be expressed in-terms of (m-n) independent dimensionless variables. This fundamental theorem needs to be kept in mind while applying a DA to any problem. In Eq. (1), m = 33, n = 3, hence number of dimensionless parameters will be 30 including 29 dimensionless variables for each of the independent parameters and 1 dimensionless variable corresponding to the vibration amplitude. But for the complex system this is a very large number to handle during the experimentation because, all these factors could not be varied individually. For the purpose of this, matrix method of dimensional analysis is used [33,34]. For modelling,
The other significant variables involved in Eq. (1) are the non-repeating variables (nr = 30) which includes the model output variables that is vibration amplitude. The non-repeating variables can be written in the form of a matrix as,
Number of non-dimensional groups are always equal to the number of non-repeating variables (nr = 30) in the problem. Now, according to the matrix method, these variables are obtained as,
After substitution of the variables from Eqs. (2) and (3) in Eq. (4) we get,
Expressing Eq. (5) in the form of a system of linear algebraic equations as,
Writing Eq. (6) in matrix form,
Finally rewriting Eq. (7),
The matrix,
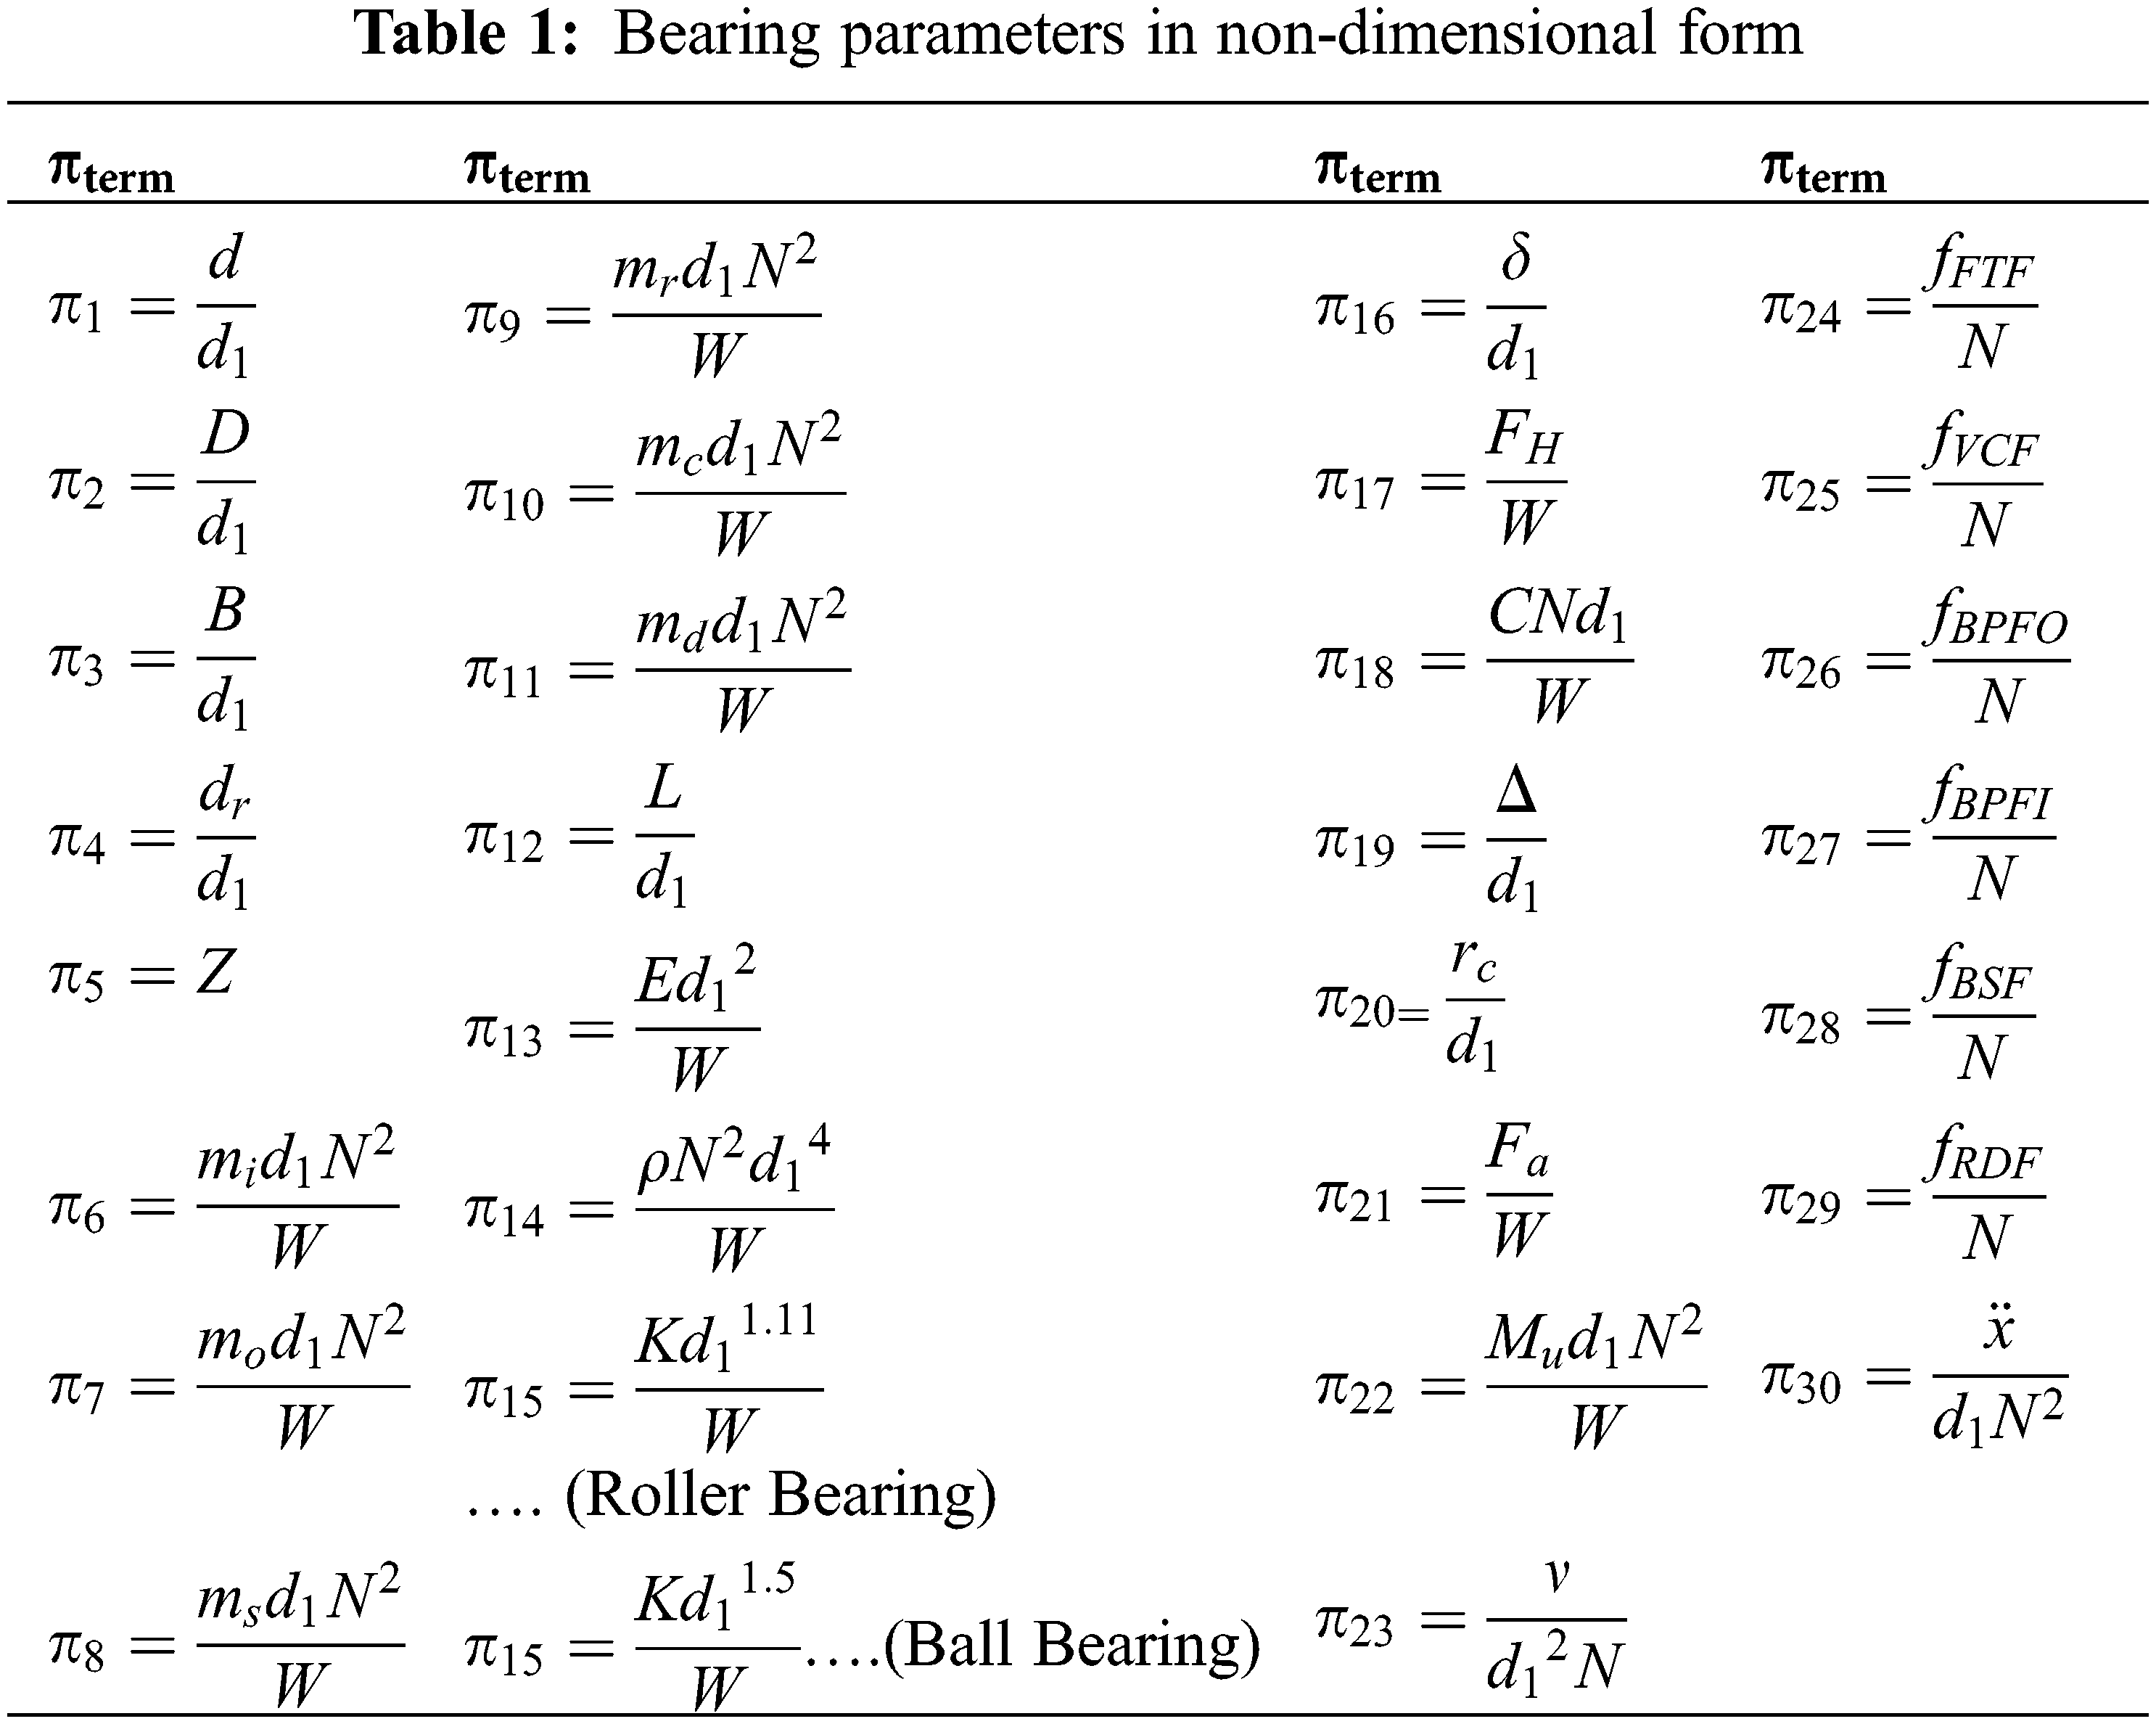
Substituting the non-dimensional parameters from Table 1 in Eq. (1) gives,
Eq. (9) depicts dimensional model for correlating the acceleration amplitude of the faulty bearing vibration. We have transformed Eq. (1) into its equivalent non-dimensional form and correlated directly the physical size of the defect, bearing dimensions and its operating parameters with vibration acceleration amplitudes in frequency domain so as to put forth DARA. Thus insertion of a DA simplifies the assessment of the measureable relationship between the objective variable and developed dimensionless numbers. Now, as the number of non-dimensional parameters involved in Eq. (9) are still more, they are minimized further by performing the mathematical steps given below:
Here, the effective defective parameter
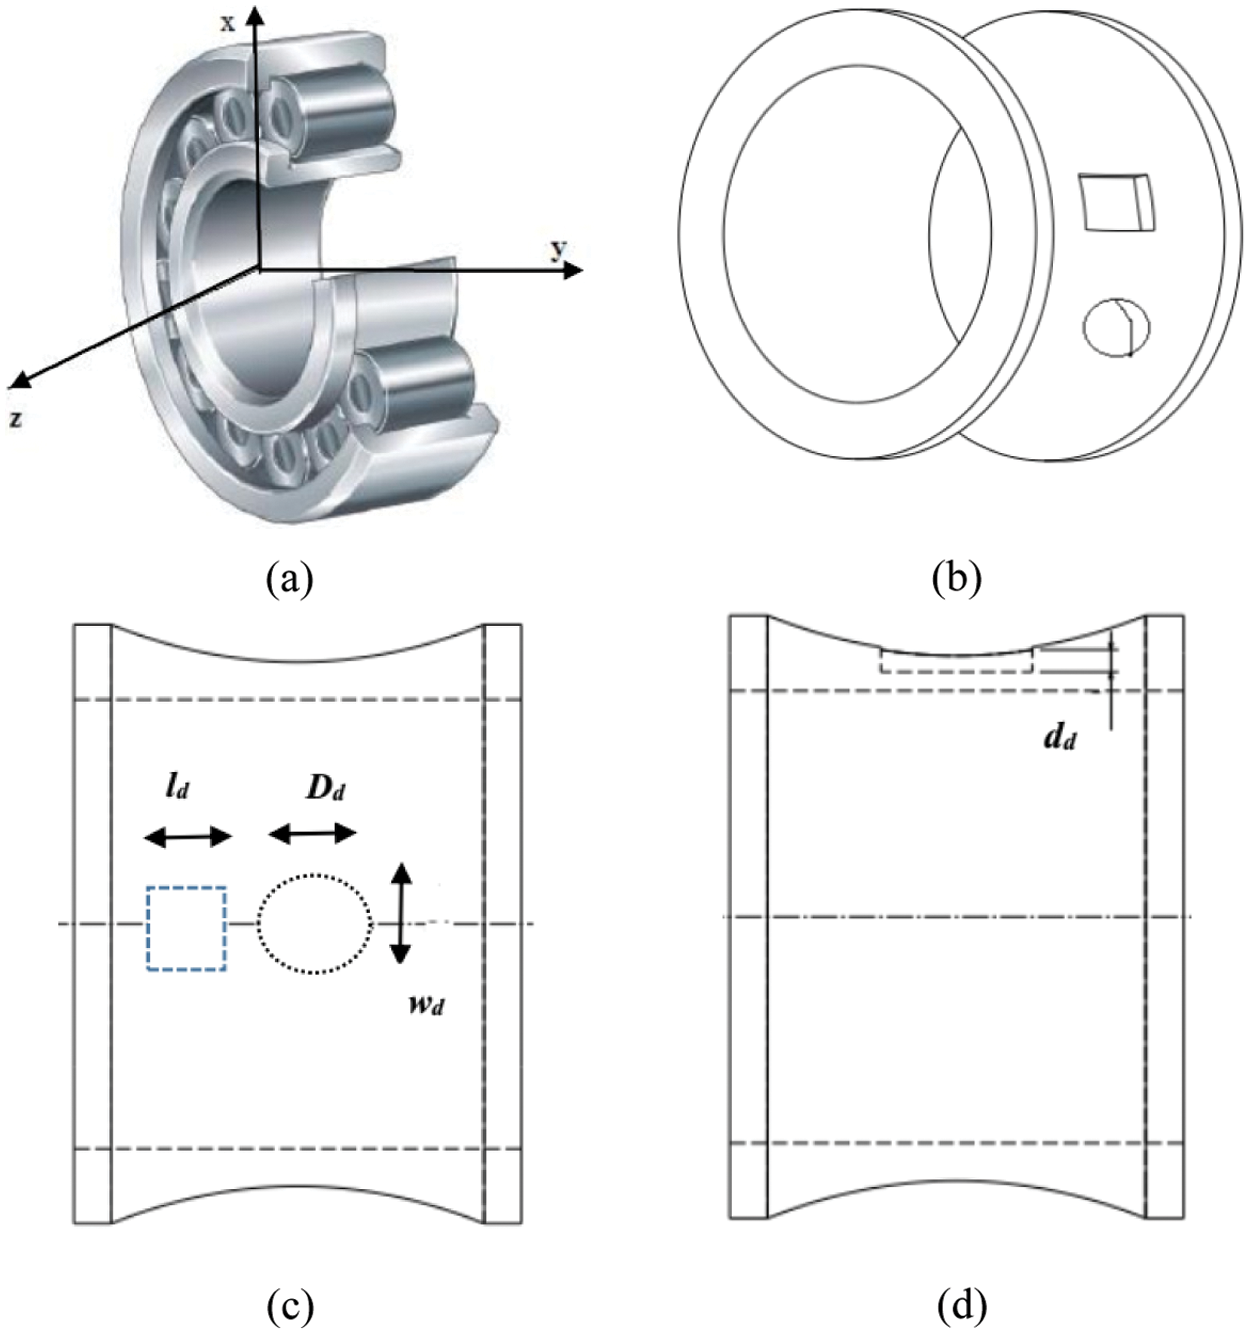
Figure 1: (a) Reference axes (b) 3 D point defects of different shape (c) and (d) Defining defect size parameters
where,
Hence Eq. (9) can be written in reduced order as,
Let,
Upon substitution of Eq. (18) into Eq. (17),
After rearranging the terms this relationship can be written in implicit form as [35],
In above equation,
Taking log on the both the sides of Eq. (21) we can write,
Now suppose that,
Hence, Eq. (22) can be written as,
where
The suffix ‘i’ in above equation represents the response of ith experiment. To compute the five unknowns in Eq. (24), other equations are developed by multiplying
3 Experimentation and Numerical Results
Now, to solve the set of unknowns
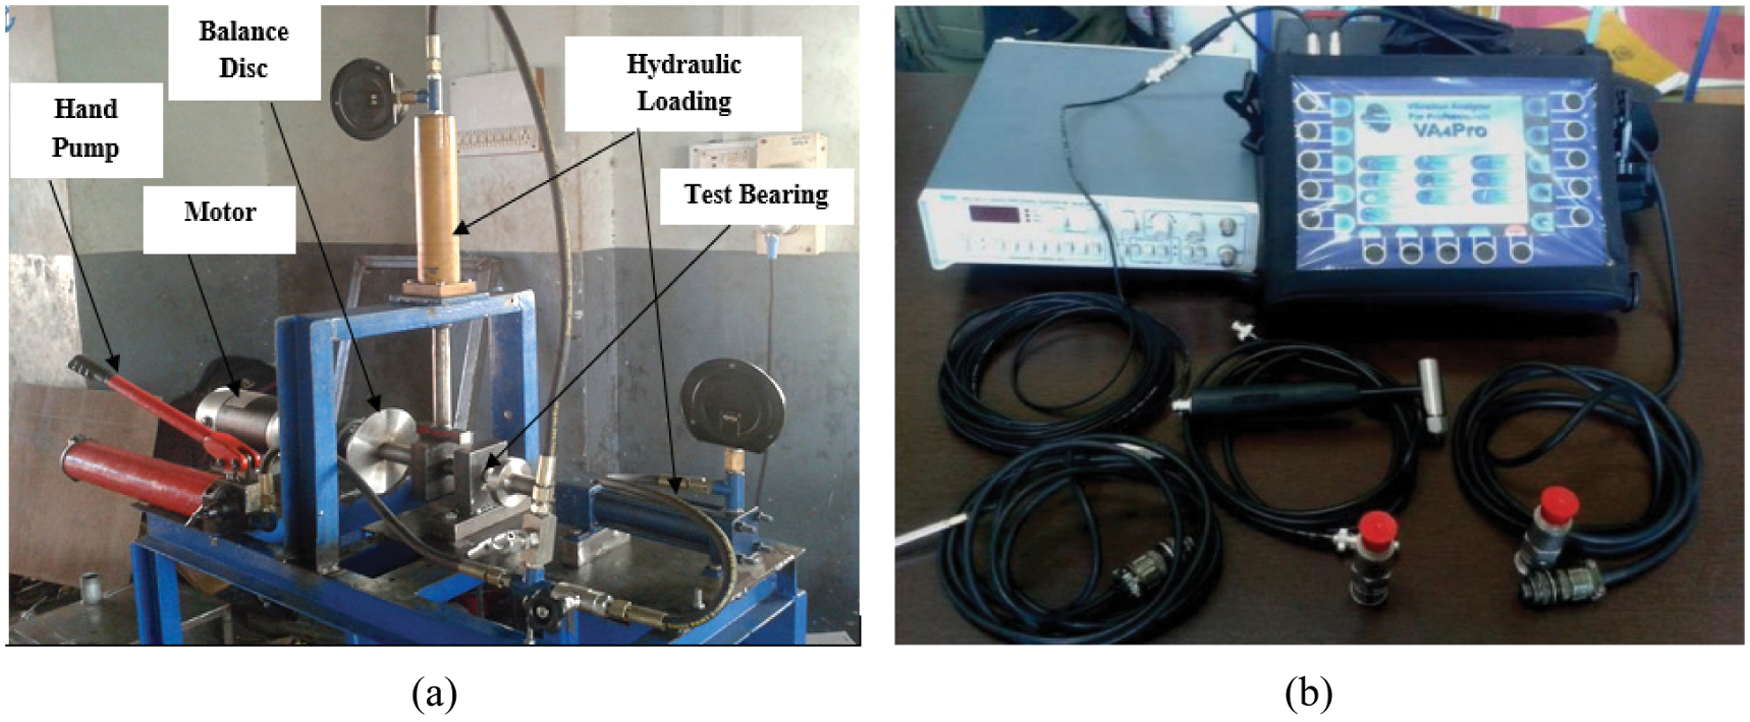
Figure 2: (a) Rotor-bearing-vibration test setup (b) Data acquisition system
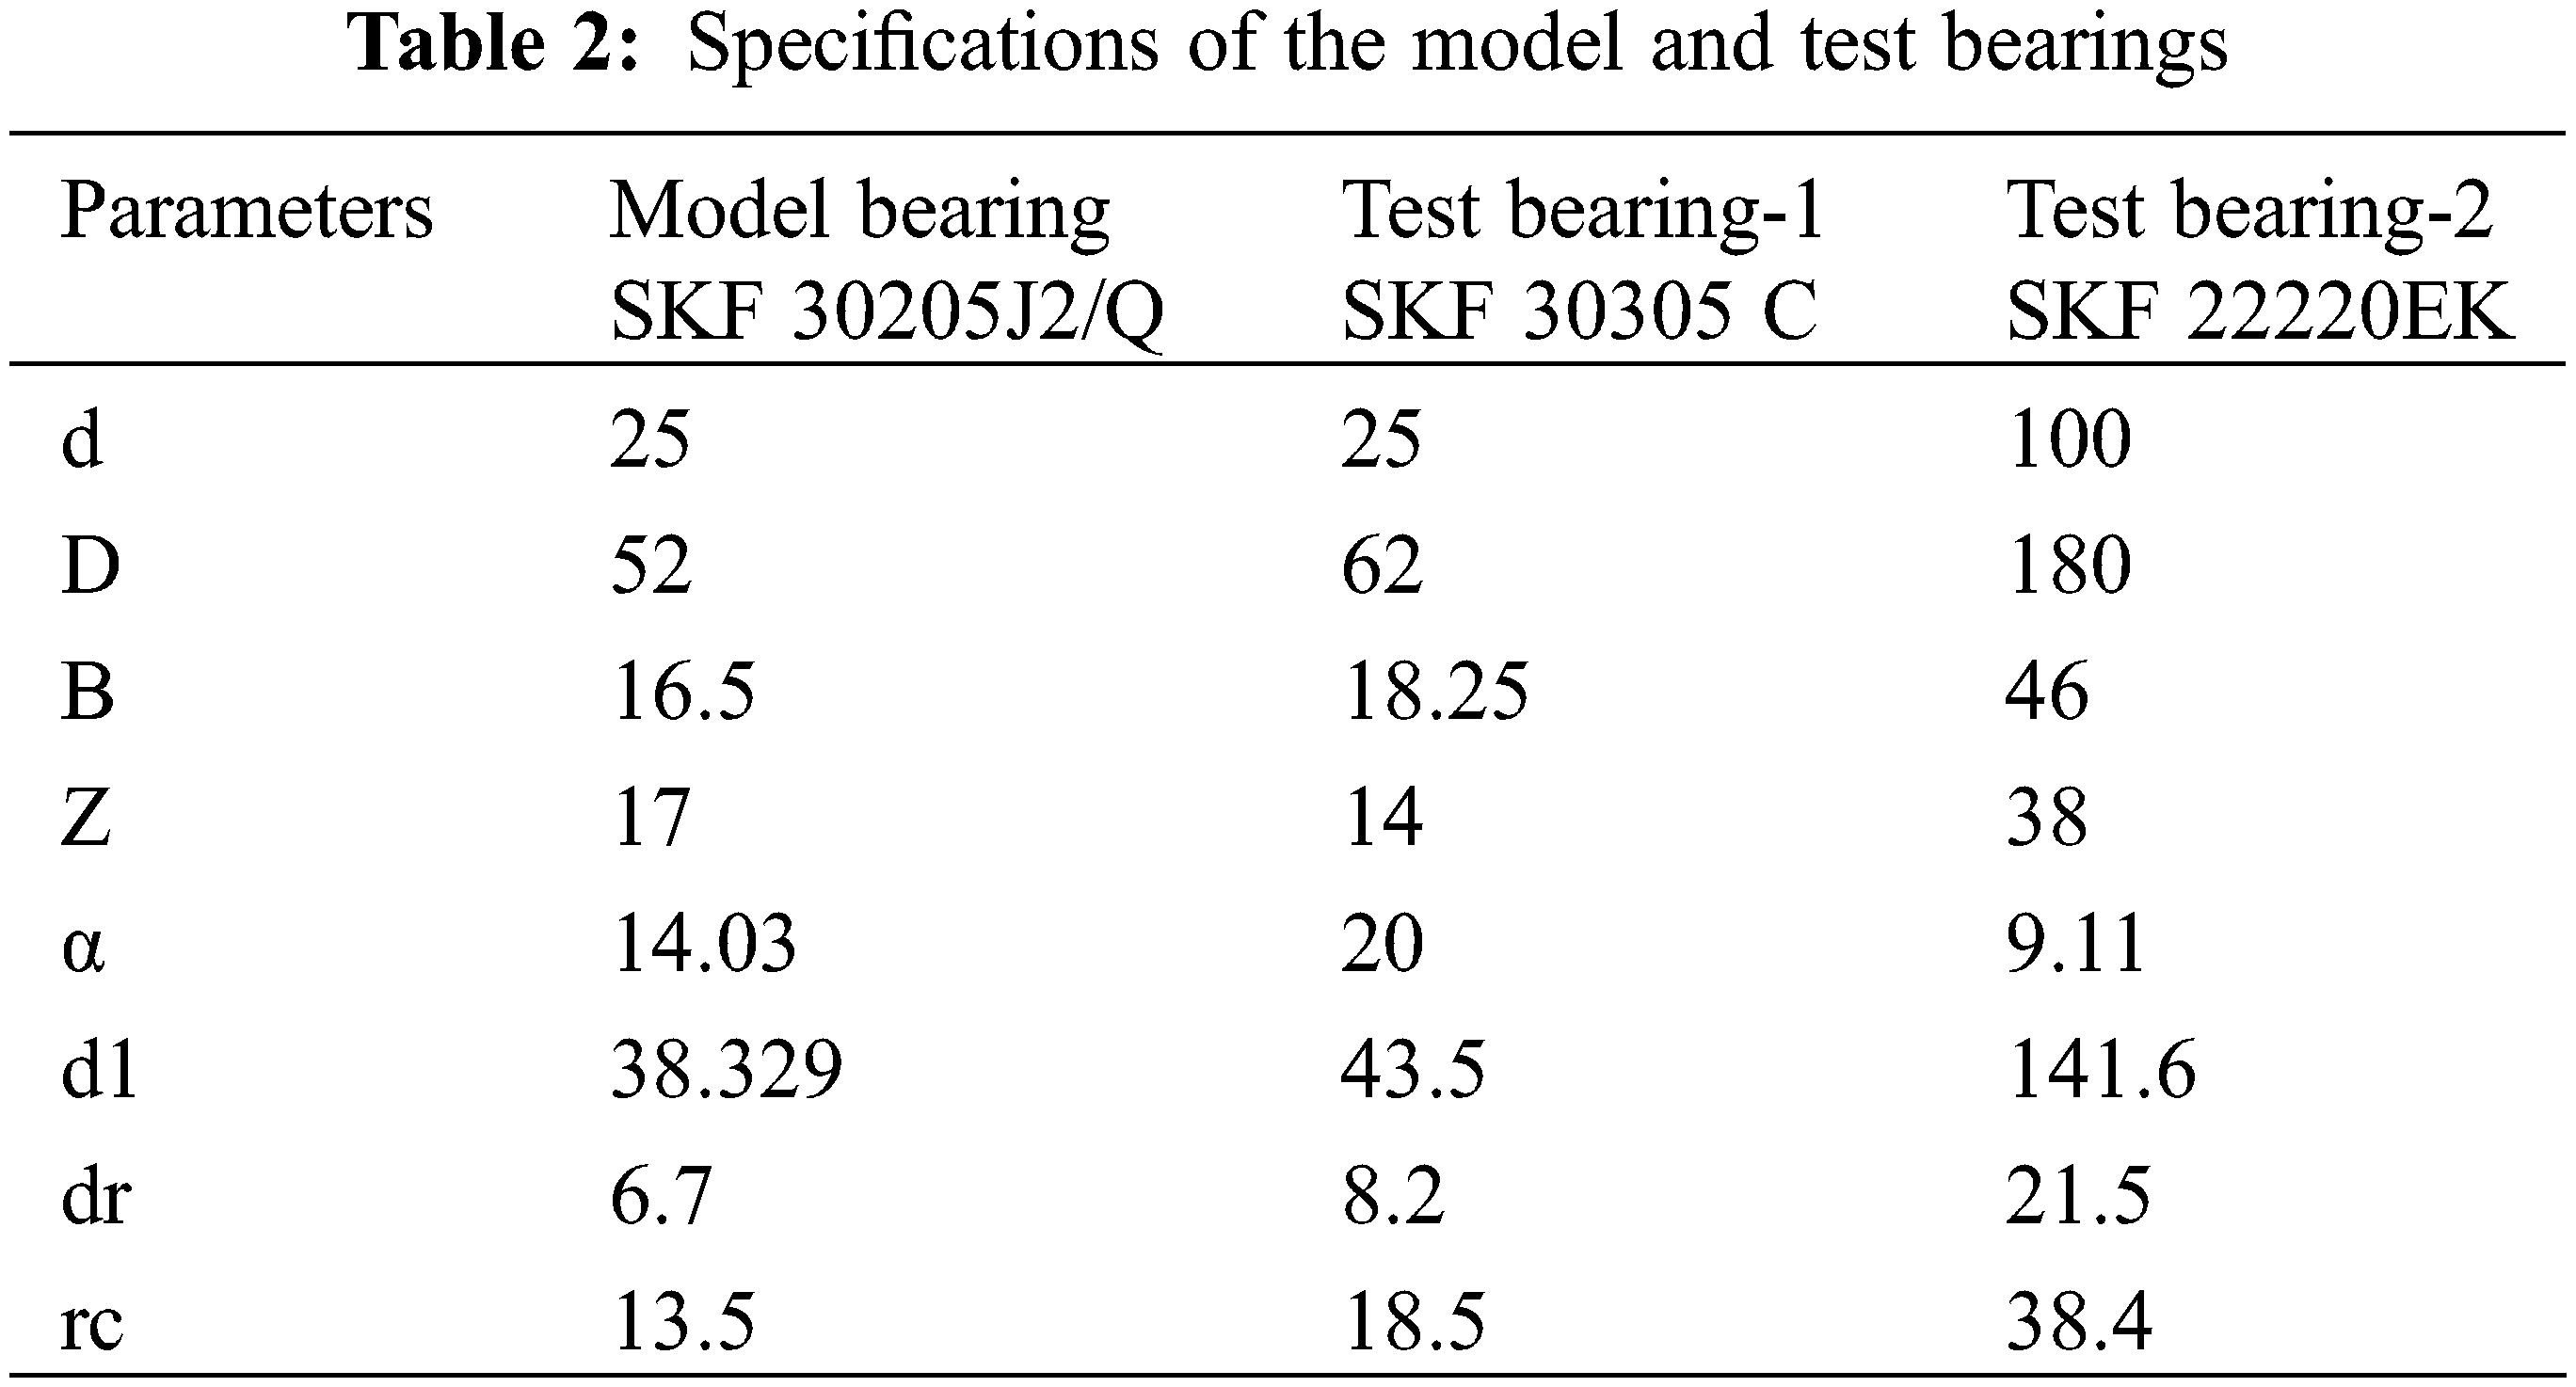
The speed variation is achieved by means of a frequency controller of the motor. The shaft is coupled with the motor by making use of flexible coupling. The shaft is supported at the two ends by bearings one of which is a self-aligning spherical bearing at the drive end (DEB) and test bearings at the non-drive end (NDEB). The shaft is loaded centrally by using a hydraulic loading arrangement. The hand pump is used for creation of the hydraulic pressure and load is applied using the ram. Both pressure gauges and loadings are calibrated to load the bearing to a precise value of loading. The bearings used are the single-row taper roller bearing designated as SKF 30205J2/Q, and hence further referred to be as the ‘model’ bearing in the next coming discussions, the specifications of which are given in Table 2.
This bearing is lubricated with SKF LGMT3 type grease and loaded with a radial load of 2 kN. For the measurement of the vibration characteristics of the defective bearings, use of the data acquisition system is made utilizing the piezoelectric accelerometers and the charge amplifier. Data acquisition system converts the analog signal into digital signal and the data acquisition software makes it possible to set the number of samples, sampling frequency, the number of averages and it converts the time domain signals into the frequency domain, also it stores the digital signals for further study. The vibration signals are captured by mounting an accelerometer model-Adash-(AC-102-1A) having sensitivity 100.0 mV/g on the bearing housing of the test bearing in vertical direction [38]. The digital tachometer gives direct speed measurement. After execution of the experimentation a set of 45 data sets 15 each for the condition of the outer race, inner race and roller damage condition is obtained and unknowns in Eq. (21) are evaluated to be,
Once these unknowns are evaluated, it is necessary to test for their significance using a coefficient of correlation obtained as [39],
where, SSD represents the deviation sum of squares of the experimental values from the mean and SSN represents sum of squares of difference between the predicted numerical values by Eqs. (26)–(28) and the corresponding experimental values. R2 value nearer to 1 is indication of a good match between the predicted and experimental values. For the models (26)–(28) the R2 values are evaluated to be 0.9971, 0.9985 and 0.9939 respectively indicating a fair adequacy of the developed models. Hence by proposing a non-dimensional model the comparative worth of a physical mechanism of vibrations produced due to presence of defects in bearings can be inferred by the magnitude of coefficients of non-dimensional numbers. The obtained expressions for the dimensional amplitude responses, i.e.,
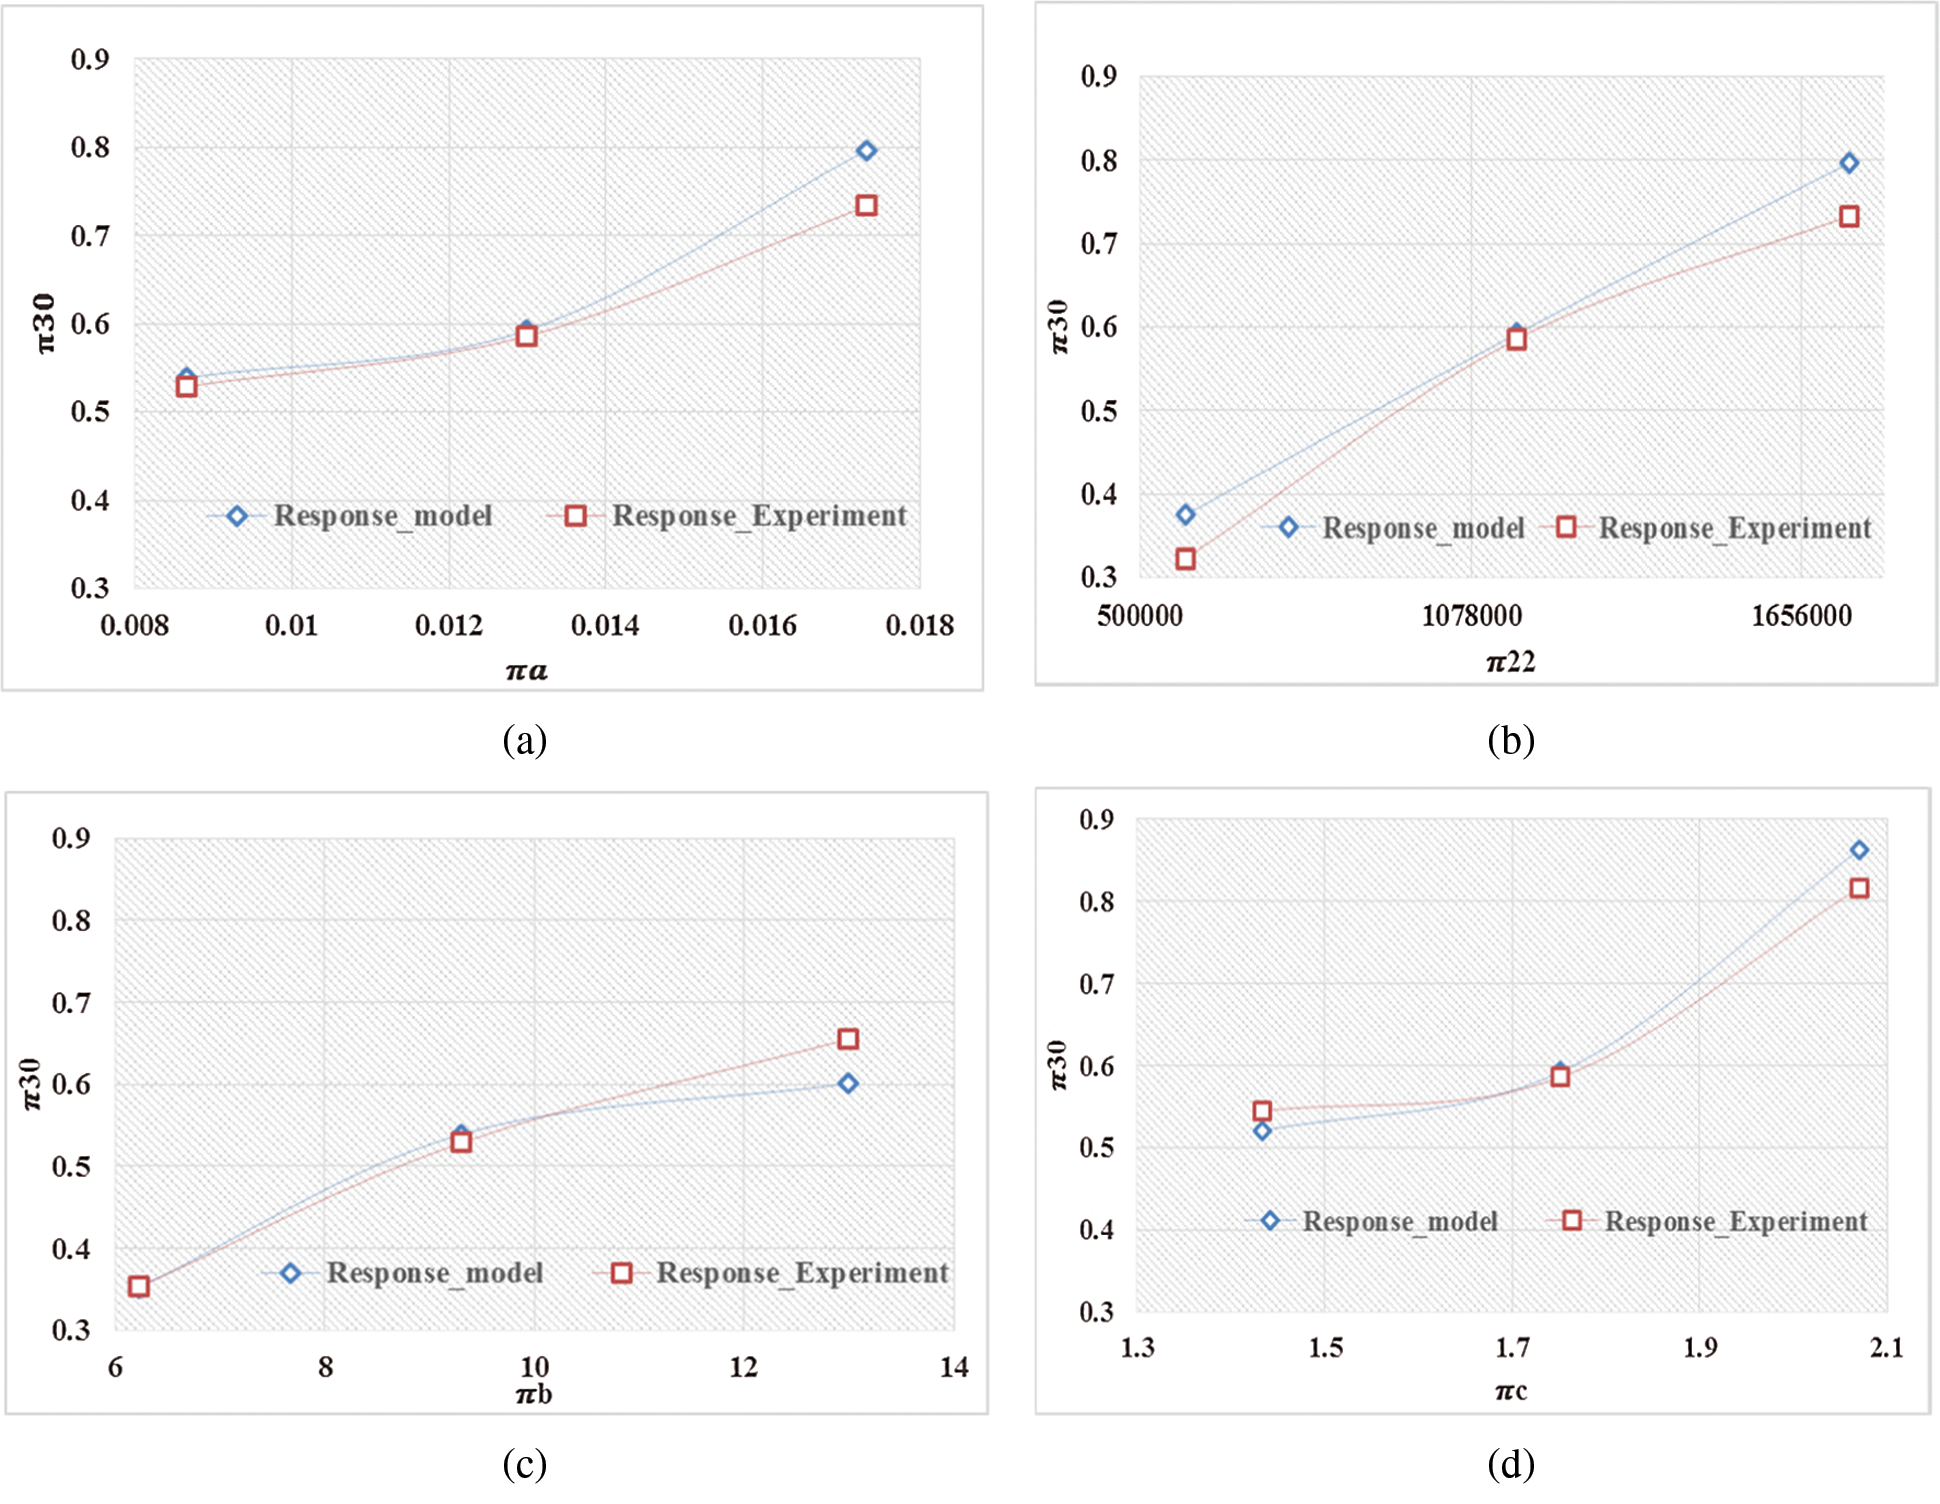
Figure 3: Magnitude of dimensionless amplitude response for outer race defect under varying dimensionless numbers: (a)
It is noticed that that the dimensionless amplitude response of the defective bearing components are significantly affected by the developed non–dimensional terms which justifies in all the three cases that with increase the size of the defect, rotor unbalance, speed and load the dimensional amplitude response increases and similar observation can be made from the Figs. 3–5. Also, the significance of each dimensionless number on the objective variable, i.e., dimensional amplitude response can be assessed based on the order of magnitude of
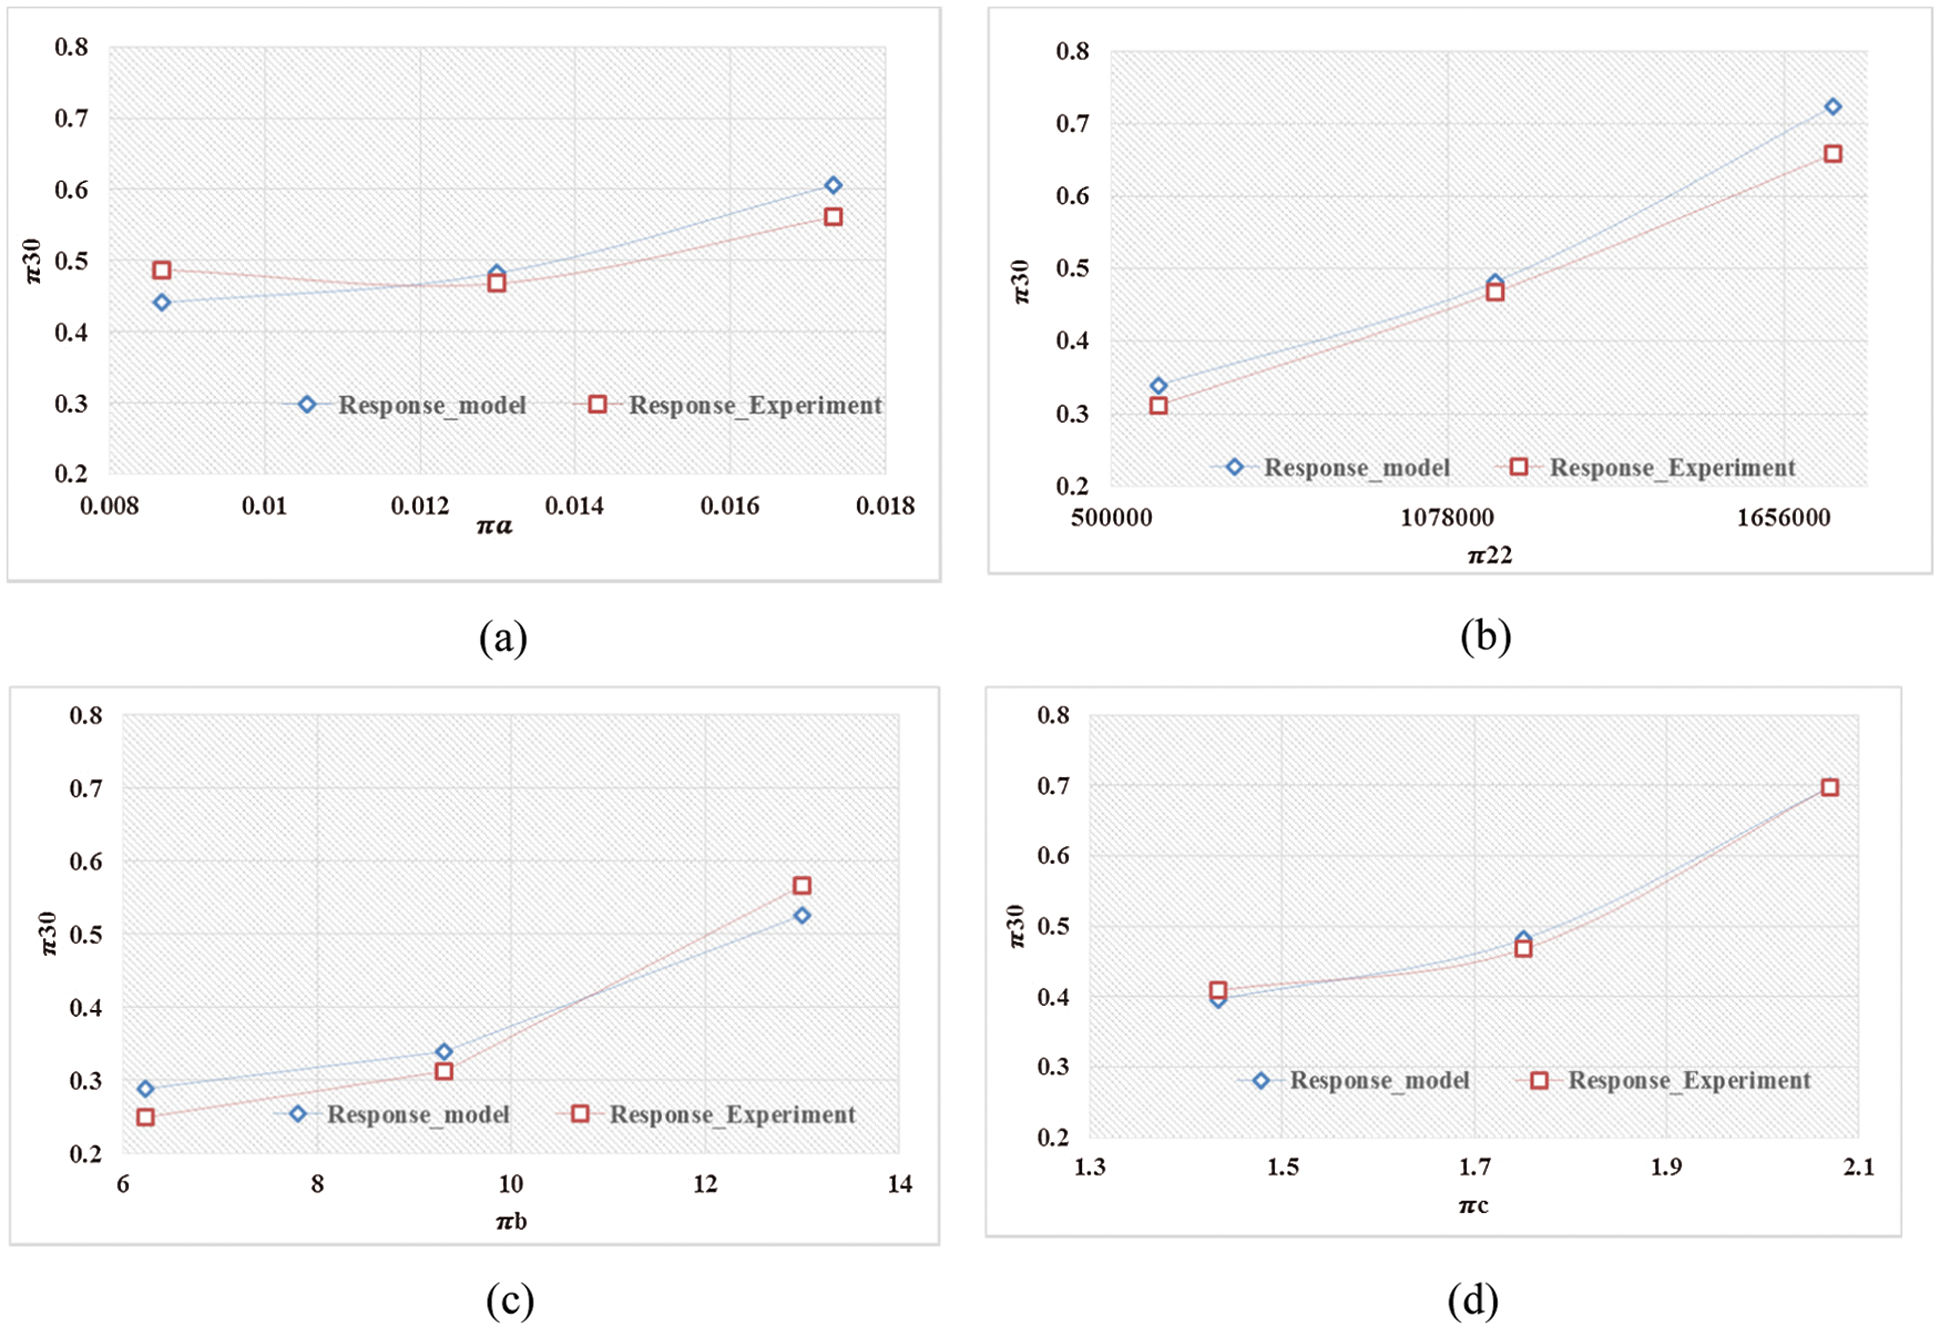
Figure 4: Magnitude of dimensionless amplitude response for inner race defect under varying dimensionless numbers: (a)
Consequently, the connection of the dimensional amplitude response generated from suitable DA with the developed non-dimensional numbers evolves as an effective tool in the analysis of vibrations due to defects in rolling bearings.
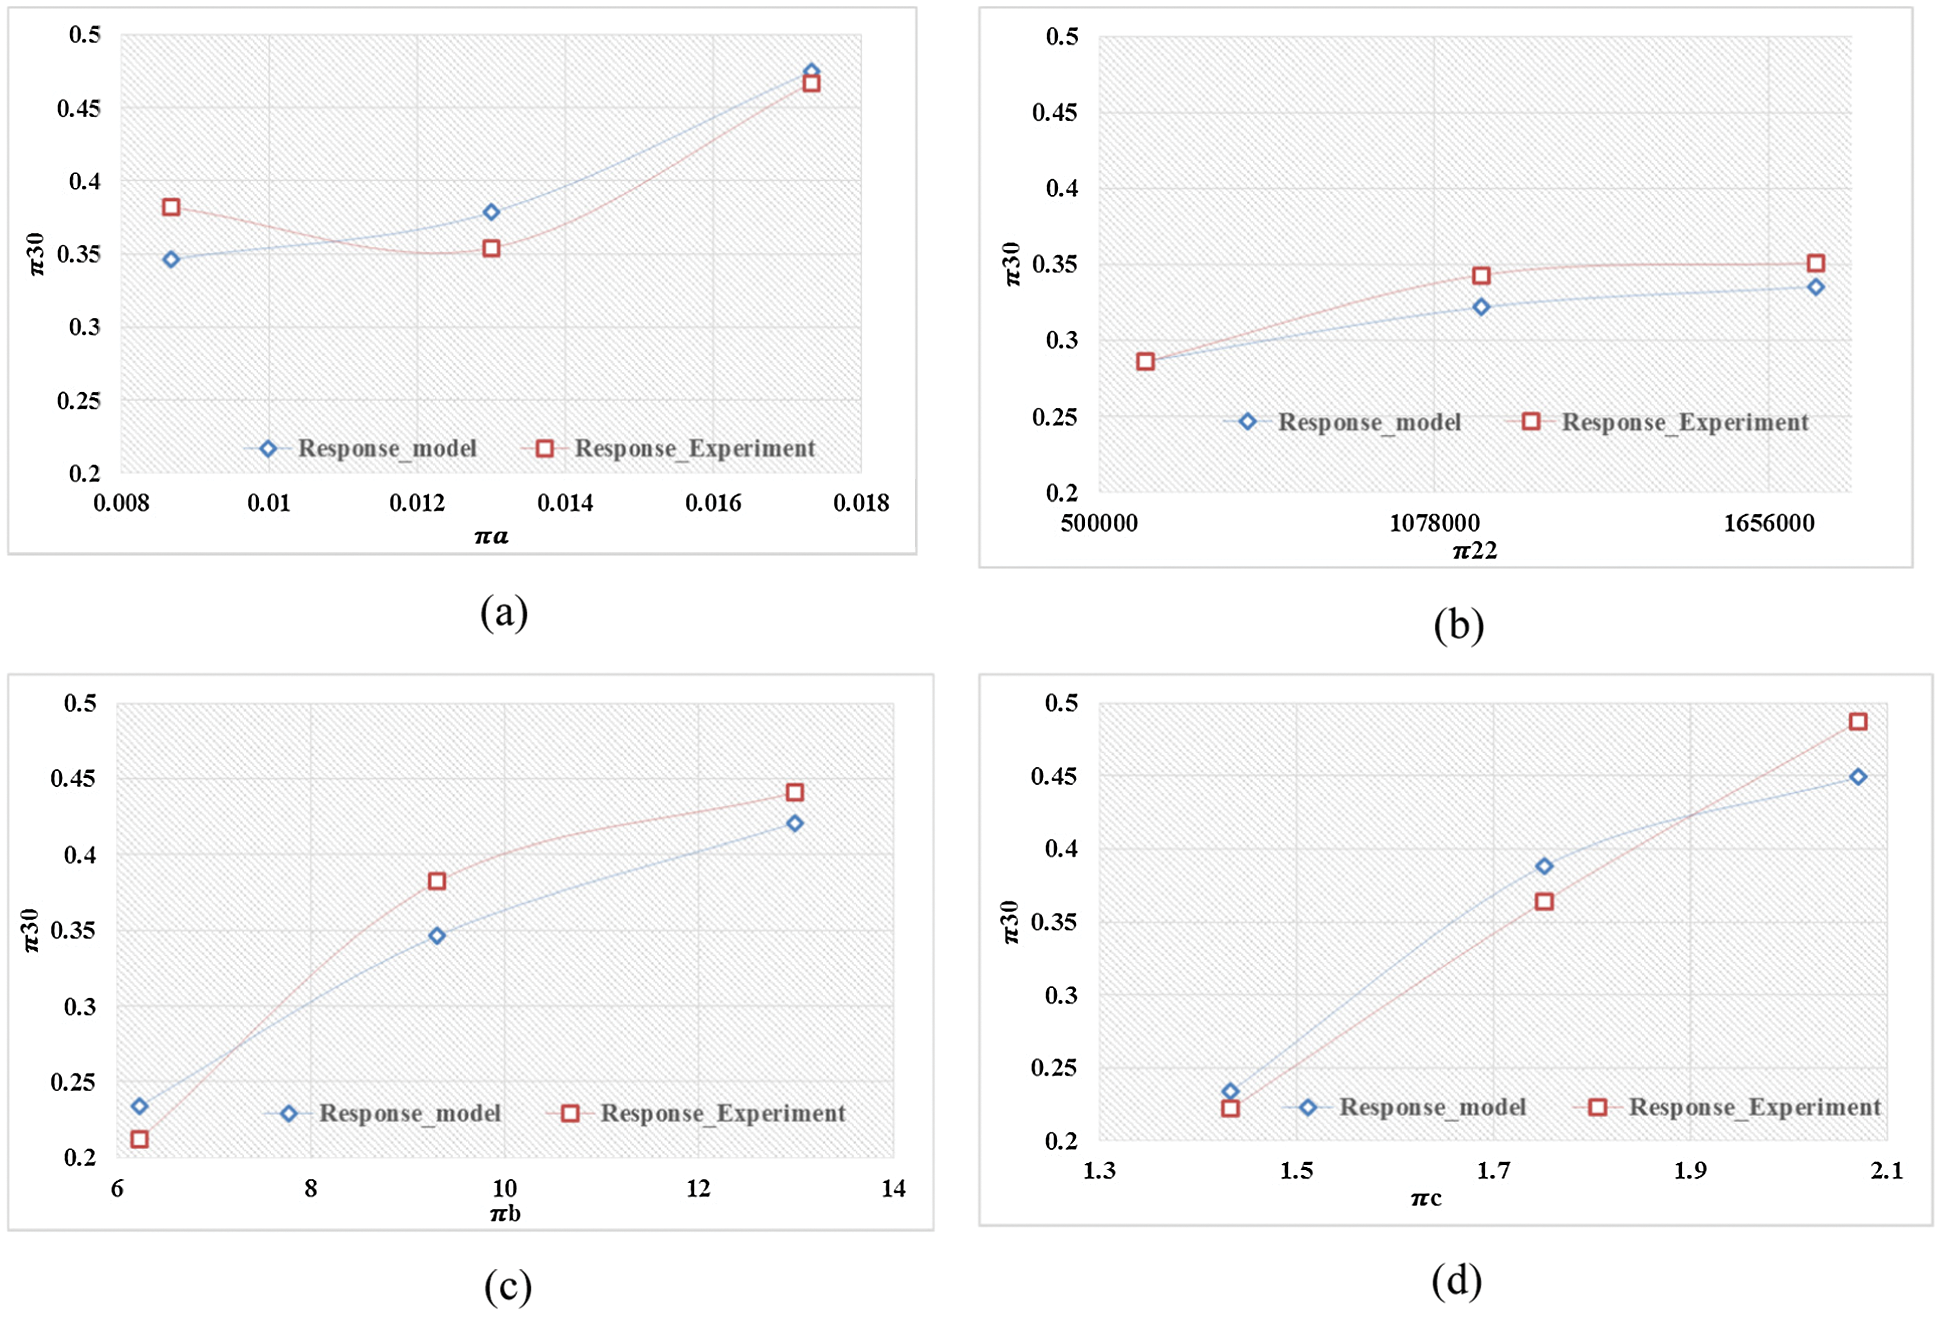
Figure 5: Magnitude of dimensionless amplitude response for roller defect under varying dimensionless numbers: (a)
After the developed dimensional amplitude response model has exhibited its predictive capability, it is decided to undergo an in-depth scaling analysis of it. The scaling analysis starts with non-dimensionalization and bounding of the variables appearing in the mathematical model as given in Eq. (21). As briefed below the suffix ‘tb’ stands for the test bearing whose performance is to be evaluated and suffix ‘mb’ stands for the model bearing. Recalling expression for
In above expression (30),
From Eq. (31), we can obtain the speed to be incorporated in the model, i.e.,
Using above expression, the important operating parameter,
Recalling expression for,
In above expression, the important operating parameters are, W, N and
Recalling expression for,
In above expression,
Eqs. (31), (33), (35), and (37) are different scaling laws for evaluating the different parameters such as, speed (
i) Calculate the speed of the model
ii) Using
iii) Now, with
iv) Next, find out the effective defect size parameter to be incorporated in the model, i.e.,
v) Now, with these evaluated parameters, load the model data and find out the vibration acceleration value of the test bearing, i.e.,
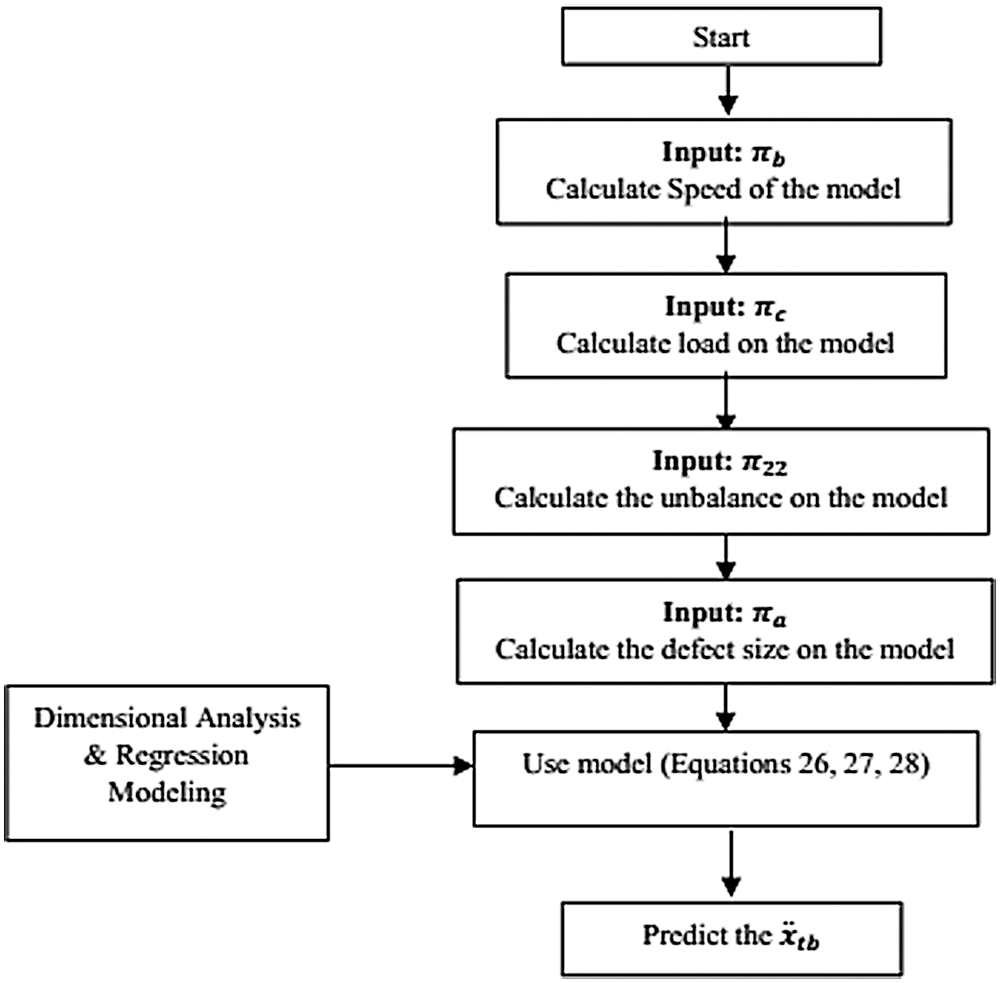
Figure 6: Scheme for the solution of the scaling laws
Compare the value of the vibration acceleration obtained in above Step (v) with the experimental value and detect the presence of a defect so as to take the decision to plan the next routine maintenance activity of bearing replacements and machine condition correction. After execution of the above developed SBM methodology, we can systematically workout these series of equations. One of the prime advantage offered by this proposed methodology is that it does not requires more computing time as compared to the traditional bearing models and machine operating personnel can work out these equations.
For validation of the proposed method, we tested for the artificially defected bearings and called it a prototype, the specifications of which are listed in Table 2. We wanted to predict the vibration amplitude response of the selected prototype/test bearing. For the purpose of analysis only we are calling the bearings as model and prototype. In the proposed method we made effective use of this concept of similarity. By making use of ‘model’ bearing as listed in Table 2, first we developed numerical Eqs. (26)–(28) and used it to predict the performance of the prototype/test bearings. So that with this concept, we can correlate vibration responses of the variety of the test bearings with the vibration response of the model bearing without requiring the high ended calculations and costly computational trials. The test bearing designated as SKF 30305C was analyzed for a radial load of 2.5 kN and a mass unbalance of 75 grams attached to the balance disc. The bearing for all the tests is lubricated with SKF LGMT3 grease and analyzed for a constant shaft speed of 900 rpm. The characteristic vibration frequencies of this bearing are calculated using the equations given in [39] and are listed in Table 3.

For the reference purpose, a baseline data is generated after execution of the experiment on the healthy SKF 30305C bearing. Fig. 7 shows the frequency spectrums obtained from the housing of the test bearing. From Fig. 7, it is observed that the peak amplitude of vibration appears at the super harmonics of the shaft frequency at 15fS which is equal to 225 Hz. In addition to this distinct frequency components corresponding to the harmonics of the varying compliance frequency are visible in the spectrum at fVCF, 2fVCF, 3fVCF and are equal to 86 Hz, 172 Hz and 258 Hz, respectively.
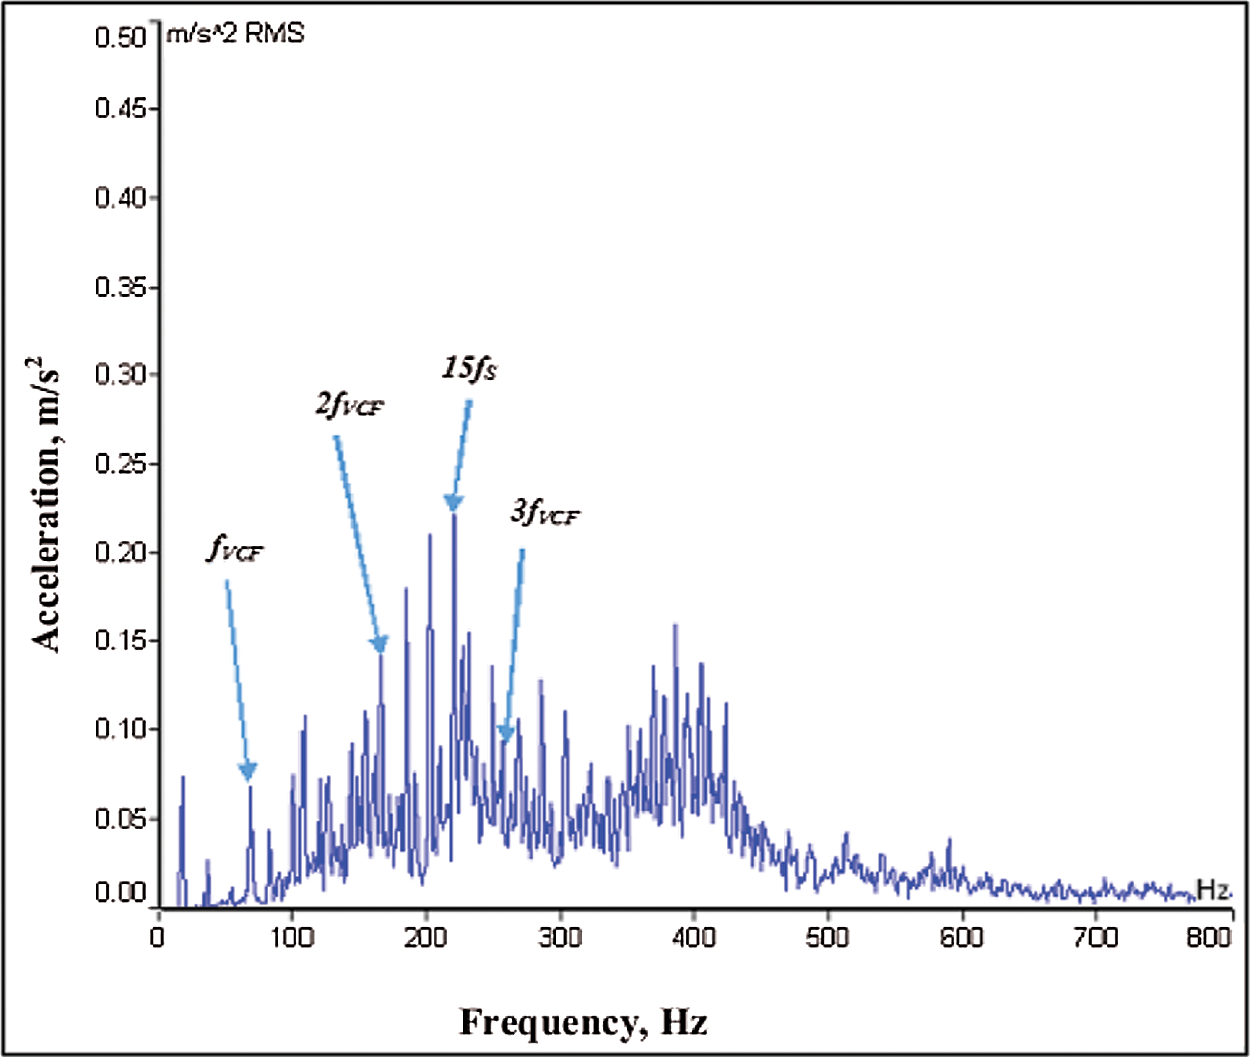
Figure 7: Frequency spectrum for healthy SKF 30305C bearing
After obtaining the baseline data, experiments are performed then on the defective SKF 30305C test bearing shown in Fig. 8 to check the competence of the developed model Eqs. (26)–(28). Making use of the scaling laws and principles of the similarity briefed in beginning of this section, we calculated different parameters of the model bearing as per the scheme shown in Fig. 7 and used it to predict the vibration accelerations of various defective components of the test bearing. Table 4 shows the results of analytical solutions of the scaling laws for the test bearing. A close similarity is observed between the model and the test bearing as for both these cases, the differences in the evaluated dimensionless parameters between model and test bearing are very lesser.
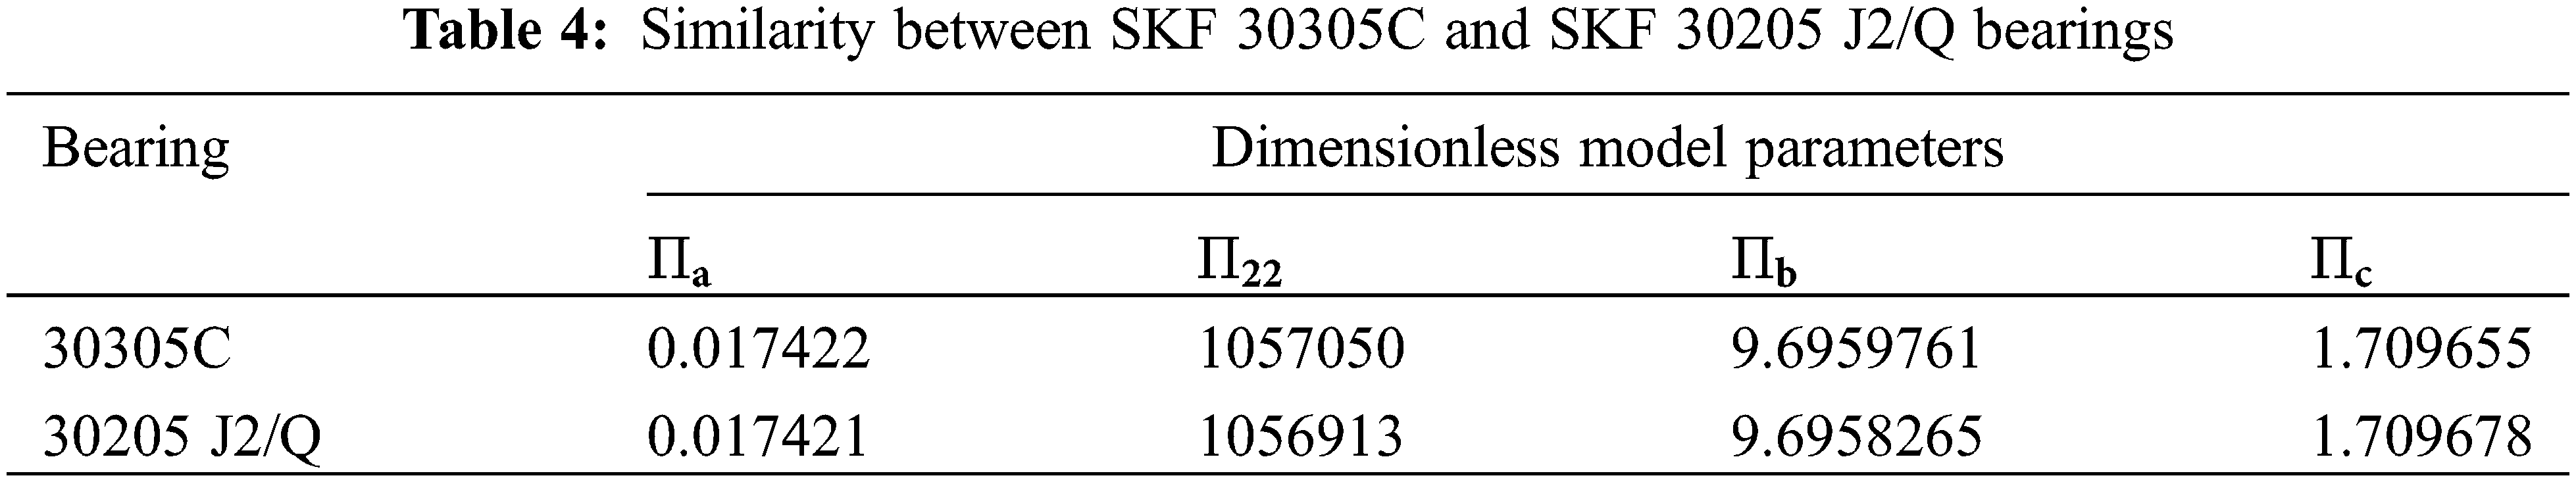
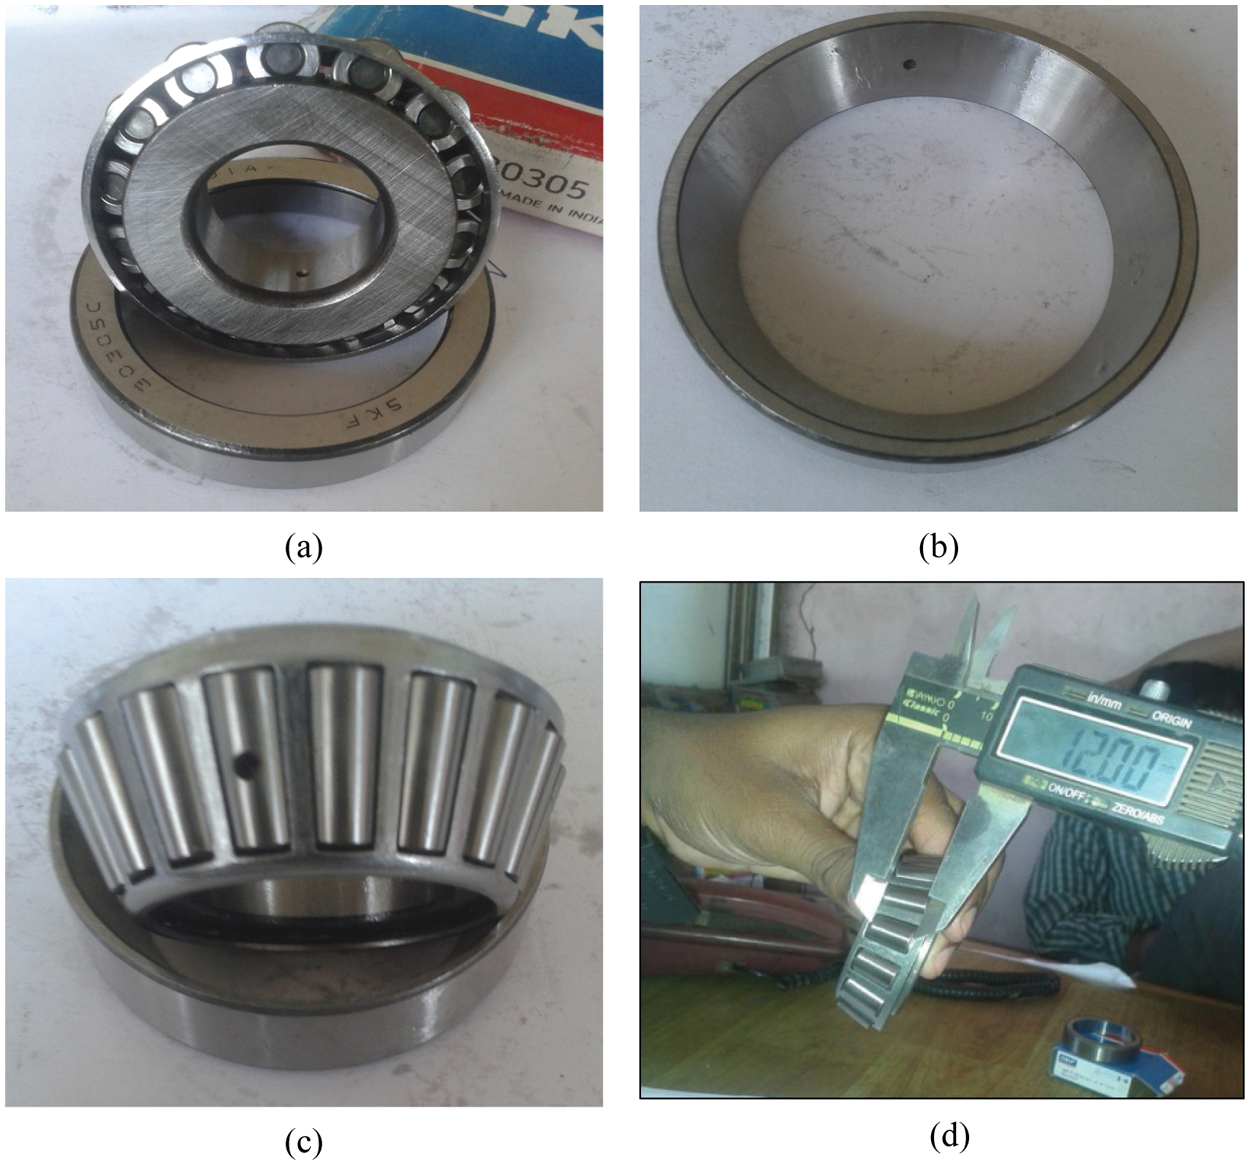
Figure 8: Test bearing, SKF 30305C (a)–(c) Photographs of circular point defect of 2 mm, and (d) Measurement of roller length
Figs. 9a–9c shows the response spectrums for the test bearings running at 900 rpm. For outer race defect, as seen from Fig. 9a, that the significant peak of 0.534 m/s2 is observed at the second harmonics of the outer race defect frequency, i.e., 172 Hz which is nearly equal to the theoretical peak of 0.5392 m/s2 obtained using model Eq. (26). In addition to this the other major peaks in the spectrum are appeared at harmonics of outer race defect frequency and combination frequency between the cage frequency and the outer race defect frequency observed at fBPFO, 2fBPFO + 2fFTF, 3fBPFO-fFTF, 3fBPFO, 3fBPFO + fFTF, which are 86 Hz, 184 Hz, 249 Hz, 257 Hz, 264 Hz, respectively. For inner race defect case, as seen from Fig. 9b, the model Eq. (27) has predicted a peak of 0.4076 m/s2 which is nearly matching with experimentally observed value of 0.405 m/s2 at nearly equal to the third harmonics of the inner race defect frequency of 373 Hz.
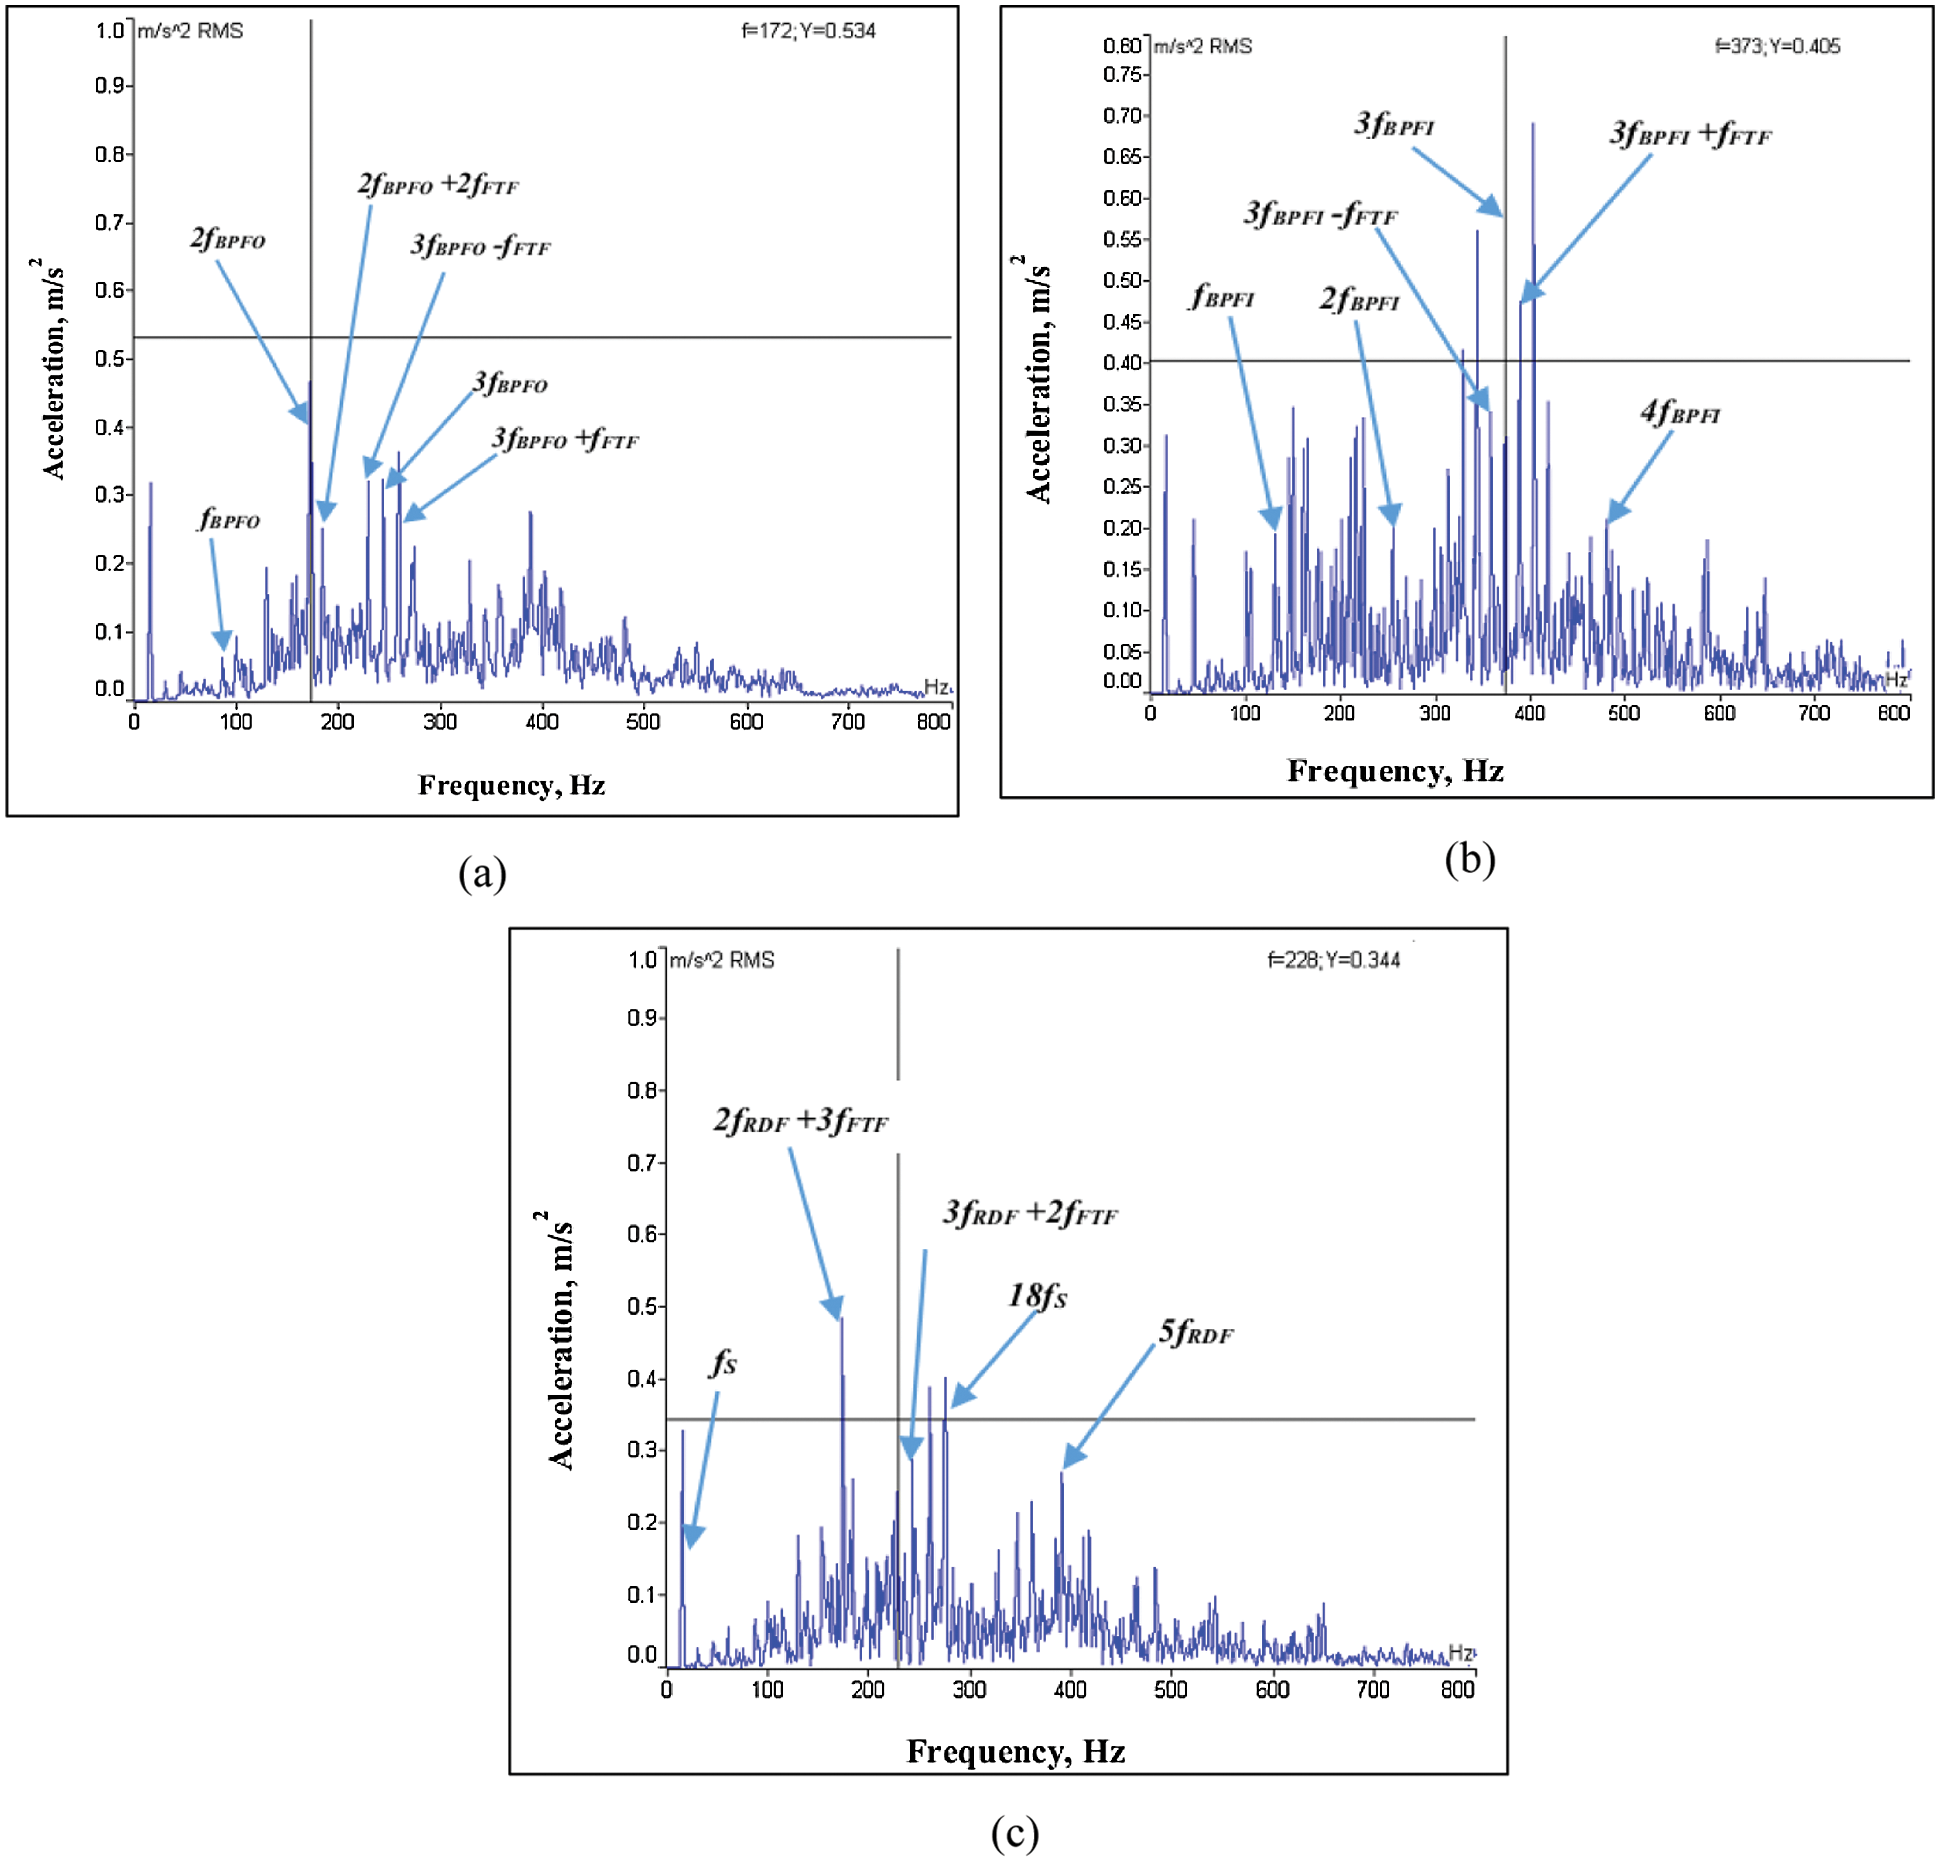
Figure 9: Frequency spectrum of SKF 30305C bearing for (a) Outer race defect, (b) Inner race defect, and (c) Rolling element defect
The other major peaks in the spectrum are at the harmonics of inner race defect frequency and a combination frequency of inner race defect frequency and cage frequency observed at fBPFI, 2fBPFI, 3fBPFI-fFTF, 3fBPFI + fFTF, 4fBPFI, which are 124 Hz, 248 Hz, 365 Hz, 378 Hz, 494 Hz, respectively. For the roller defect case, the significant peak vibration amplitude predicted by model Eq. (28) is 0.3426 m/s2 and the experimentally observed vibration amplitude is 0.344 m/s2, observed nearly at the third harmonics of the roller defect frequency which is 228 Hz as noticed from Fig. 9c. In addition to this, the other major peaks in the spectrum are at the lower and super harmonics of shaft frequency and a combination frequency of roller defect frequency and cage frequency observed at, fS, 2fRDF + 3fFTF, 3fRDF + 2 fFTF, 18fS, 5fRDF, which are 15 Hz, 172 Hz, 243 Hz, 270 Hz, 386 Hz, respectively.
6 Industrial Rotor-Bearing System
To test the competence of the developed numerical models (26)–(28) for the bearings used in the industrial rotating machines, we implemented a condition monitoring program in one of the well-known sugar producing unit situated in the sugar cane producing belt in Sangli District of the Western Maharashtra recognized as, Rajarambapu SSK Pvt., Ltd., Unit-III, Ashta, Sangli, India. Before implementing the COM, it is necessary to perform some homework regarding the types of machineries used in the plant, their importance related to functioning of the plant, impact of failures of these machines on the condition of the plant etc. Based on this homework, first of all we visited the factory before commencement of the sugar production and identified the ‘critical machineries’, the stoppage of which can cause shutting down the entire production process and impede the smooth and safe operation of the unit. After this field study we identified the following machineries for implementation of our developed methodology, they include,
Sugar Cane Kicker
Sugar Cane Leveler
Sugar Cane Fibrizer
Boiler Fans-ID/FD/SA
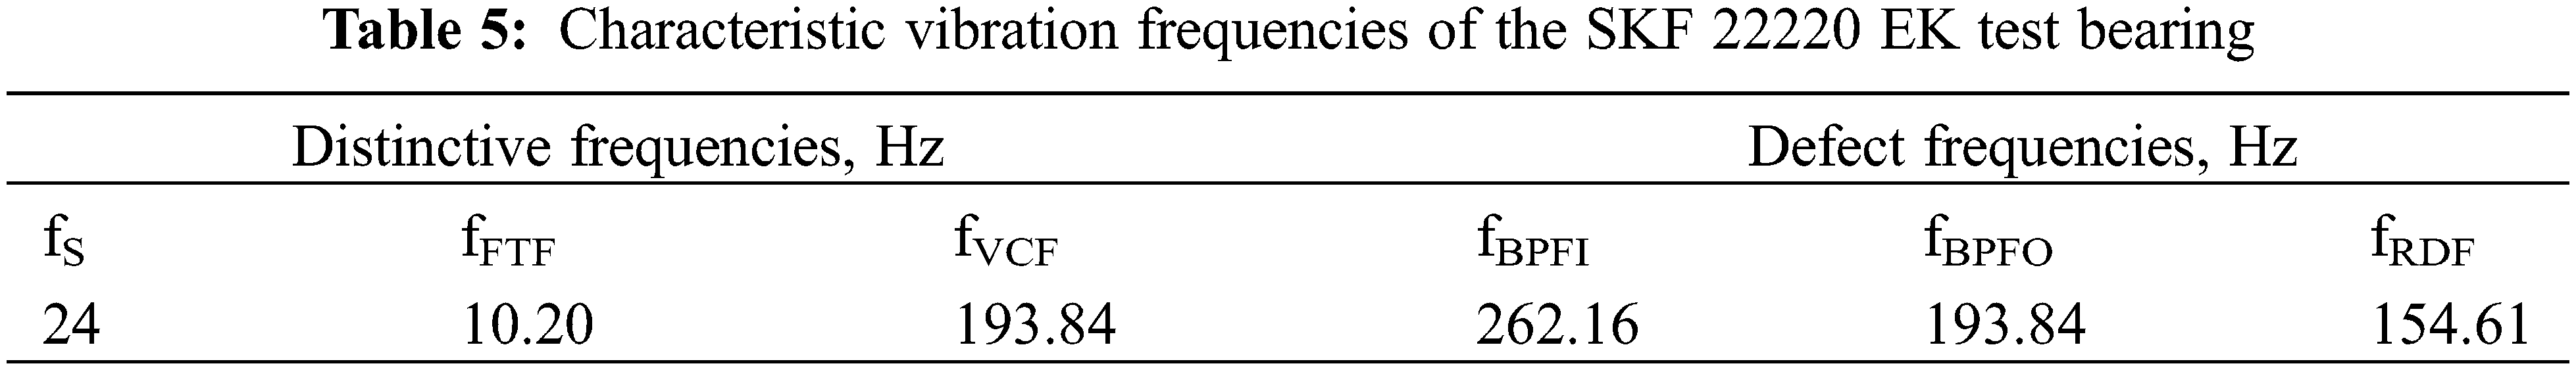
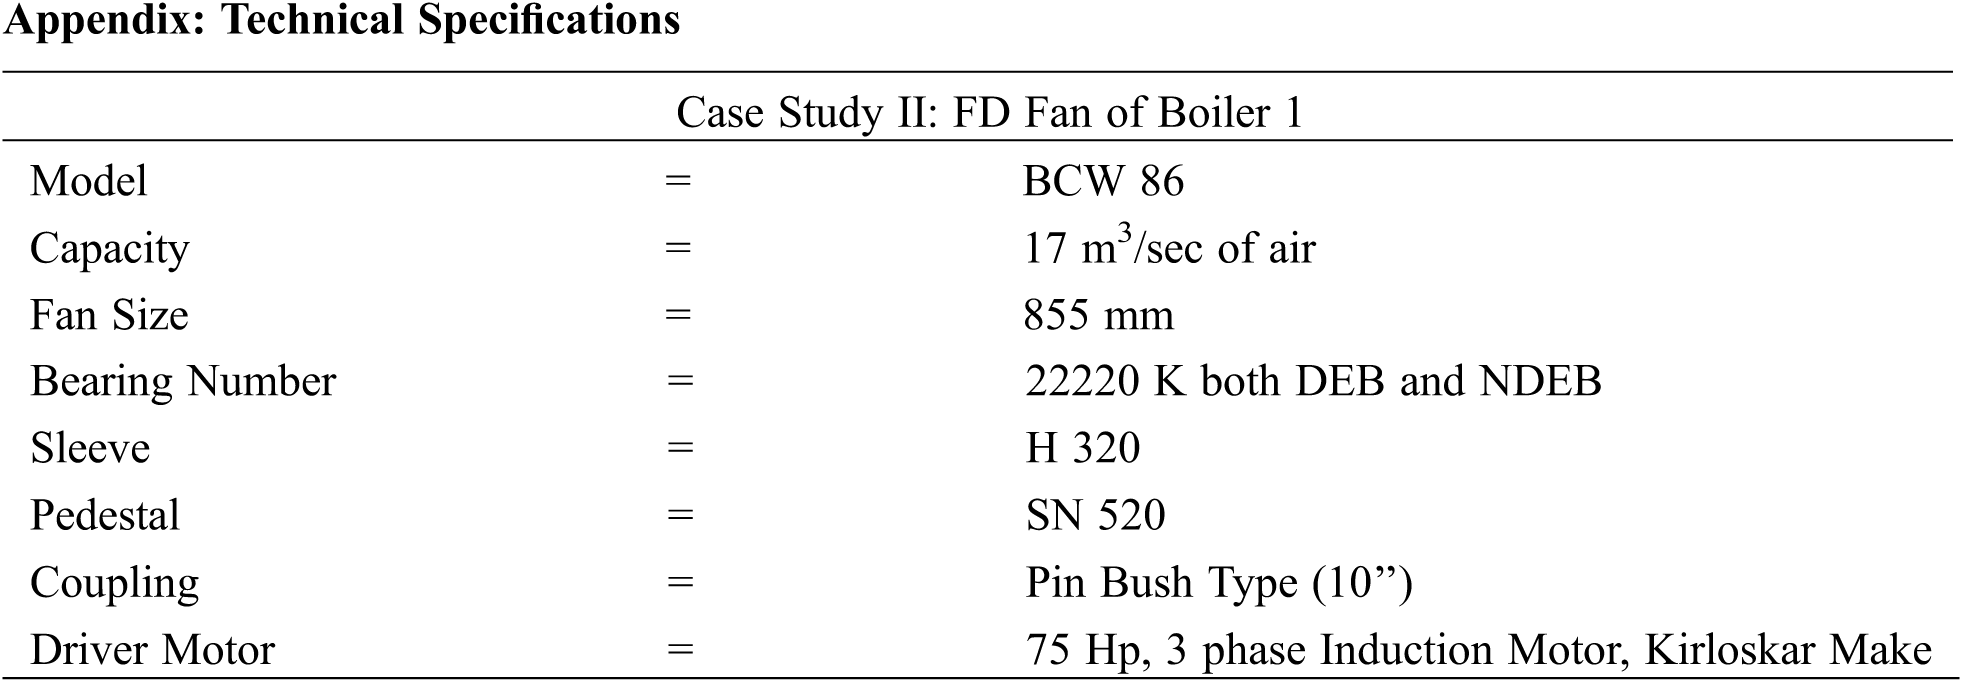
The layout of the entire unit is shown in Fig. 10. It shows the different rotating machineries to which we have implemented the COM. All fans (ID/FD/SA) are driven by separate three phase induction motors. The kicker and leveler are also driven by separate three phase induction motors. The fibrizer unit is driven by the steam turbine using steam from boilers. We did condition monitoring of both DEB and NDEB and assigned numbers from B1 to B18 as shown in Fig. 10. Before, taking the readings, the characteristic bearing defect frequencies of the bearing are calculated using the expressions given below in Table 5 as in [34], to set the frequency limits for the vibration measurement.
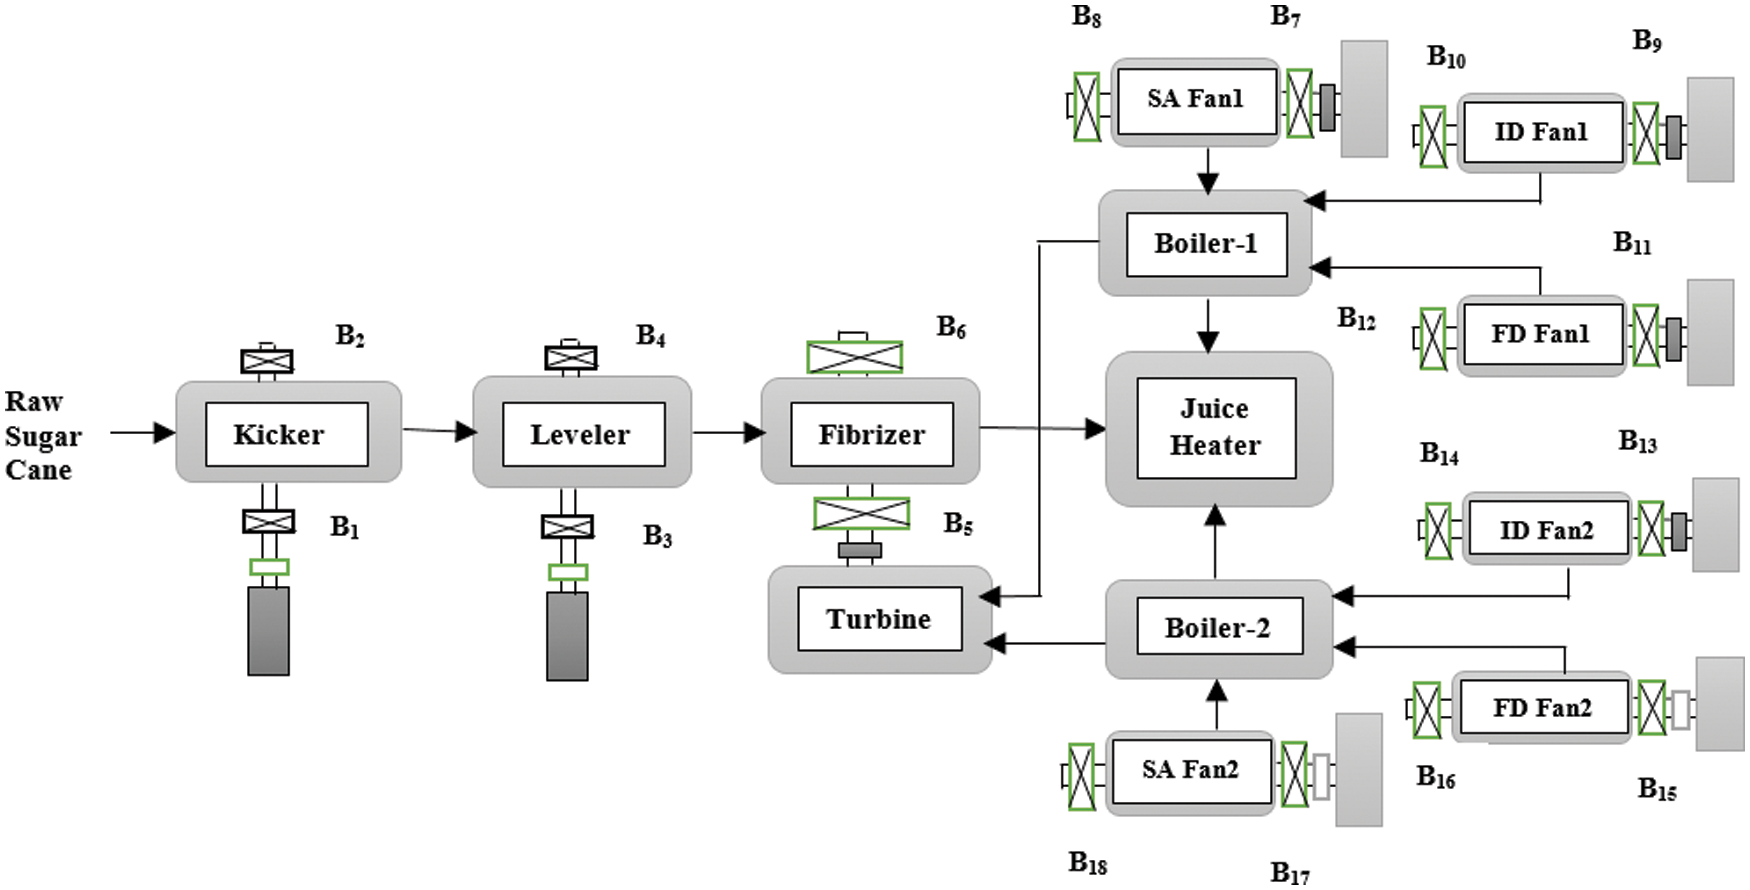
Figure 10: Layout of the production unit
Generally, the accelerometer is attached with the bearing housing to measure vibration responses in vertical direction as shown in Fig. 11. A case study particularly of the FD Fan 1 shown in Fig. 10 is presented here. We particularly wanted to detect the ‘inchoate defects’ because all these selected machineries are falling into the category of heavy critical machineries and requiring considerable time for their maintenance and bearing replacements. The unexpected failure of these machineries directly affects the production capacity of the unit. Also, the raw sugarcane being a perishable item, once it is brought on the factory, has to be further processed further. In short, the stoppage of production due to the unwanted machinery shutdown was not allowed. After calculation, we tried with different end limit frequencies for setting of the low and high frequency pass filters of the vibration analyzer so as to set the ideal frequency range for the measurement purpose. Based on that we chose a frequency range of 10 Hz for low pass filter and 3200 Hz for the high frequency pass filter and the sampling frequency range of the signal recorder was set to 8192 (213) Hz.
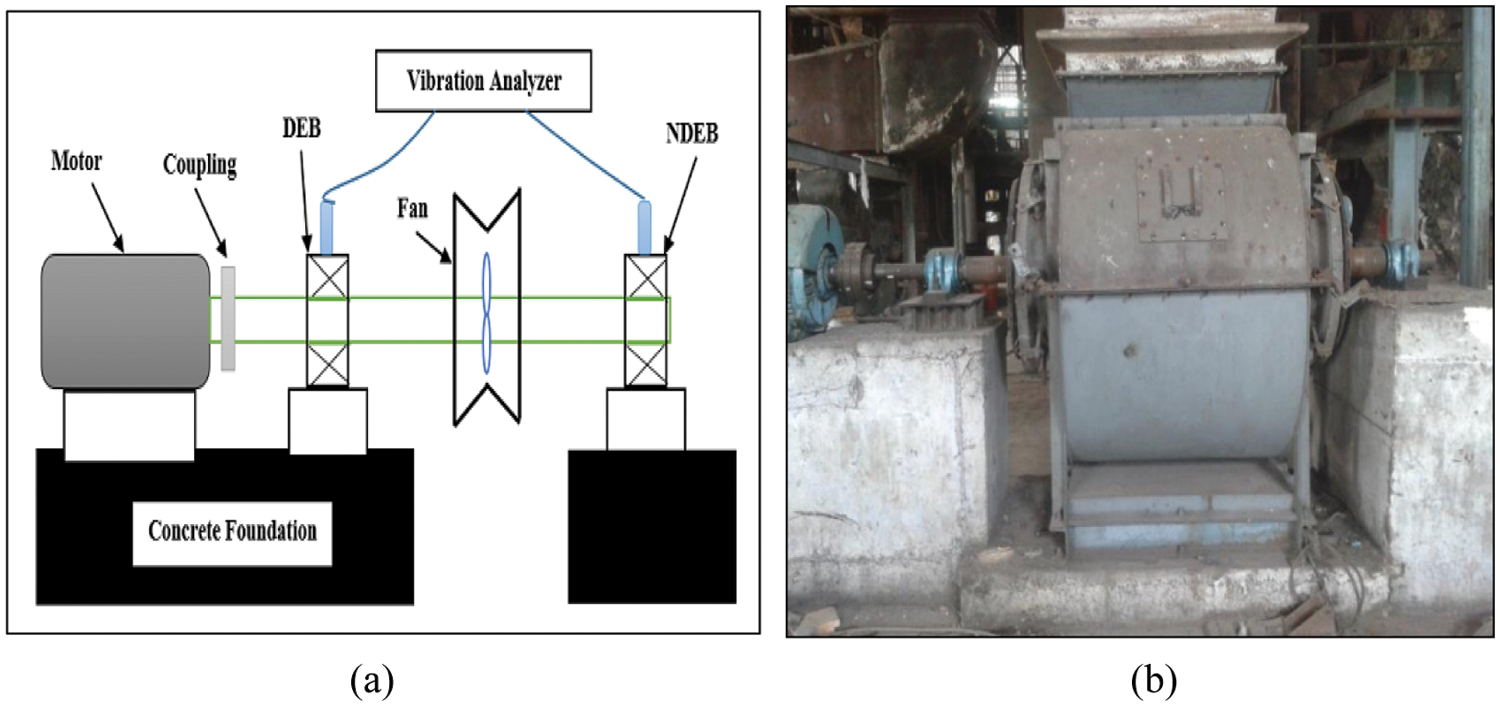
Figure 11: Details of the industrial rotor-fan (a) Schematic layout, position of sensors, and (b) Actual experimental setup
The commencement of COM program was started with the starting up of the production season in factory. Health monitoring activity has been performed as per the requirement of the clients once in a week as the scheduled maintenance period was of four weeks for the entire unit. Generally theses machineries are well inspected, lubricated and balanced before starting up of the production processes but during the operation of the plant there may be chances of unbalance or misalignment problems of rotors which will start deteriorating the performance of the machines and its indication can be seen by inspecting the condition of the bearings. Before commencement of the sugar cane crushing season, the vibration analysis was performed on the healthy bearings of FD fan. A baseline data is generated after execution of the experiment on the healthy SKF 22220 EK bearing.
Figs. 12a and 12b show the frequency spectrums obtained from the housing of the test bearing at the drive end (B11) and the fan end (B12). As evident from the spectrums, there are no any significant amplitude peaks at the defect frequencies hence the bearings at drive end and non-drive end can be considered to be healthy. Some smaller amplitude peaks are present in the spectrums attributed to the inherent bearing characteristics. This served as a reference for the further experimental work. At the drive end (DE) we experimented with bearing having the outer race defects, this bearing is designated to be B11. Fig. 13 shows the obtained experimental spectrum for that bearing. As it is seen from Fig. 13 that the significant peak of 0.153 g is noticed at the 1804 Hz which nearly equal to the 9th harmonics of the outer race defect frequency as evaluated from the Table 5. This shows that it is expected to have defects on the outer race. The bearing is dismantled as shown in Figs. 14a and 14b, which showed crack and few significant pits on the outer race. Fig. 14b shows the photograph of the outer race defective bearing taken after cleaning it with kerosene. For the bearing B11, the different scaling laws are implemented to evaluate the different dimensionless parameters and are listed in Table 6. Then it was decided to check the amplitude response from the model equation for outer race damaged bearing having significant crack of width 1.2 mm, length 37 mm and depth of 5.6 mm.
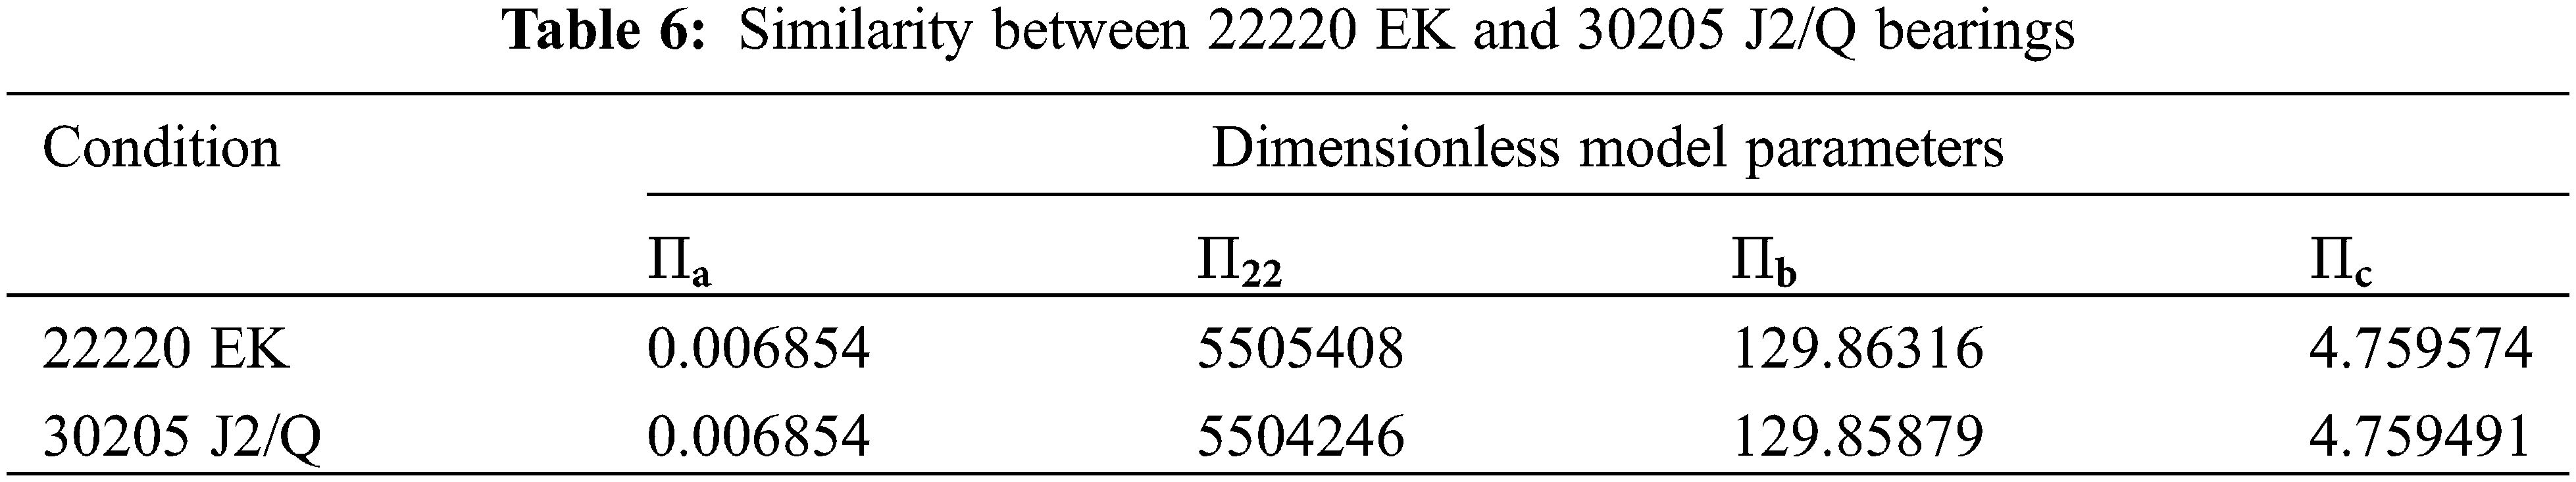
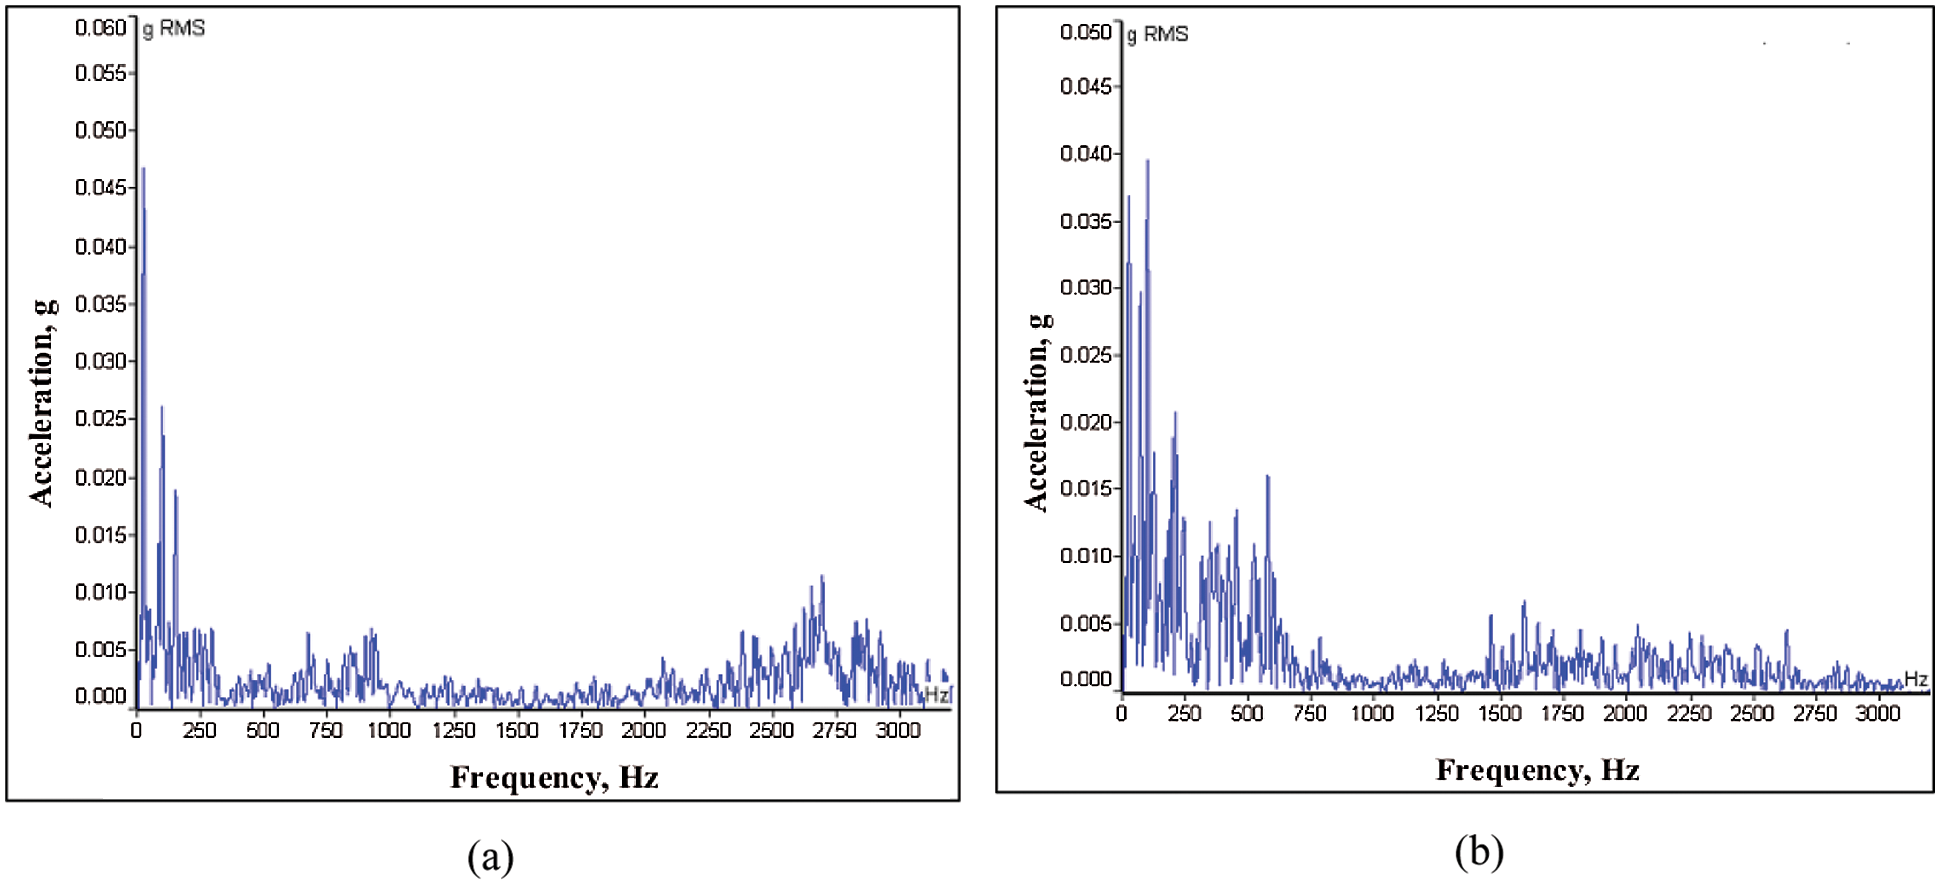
Figure 12: Frequency spectrum for healthy SKF 22220 EK bearing (a) Drive end (b) Non-drive end
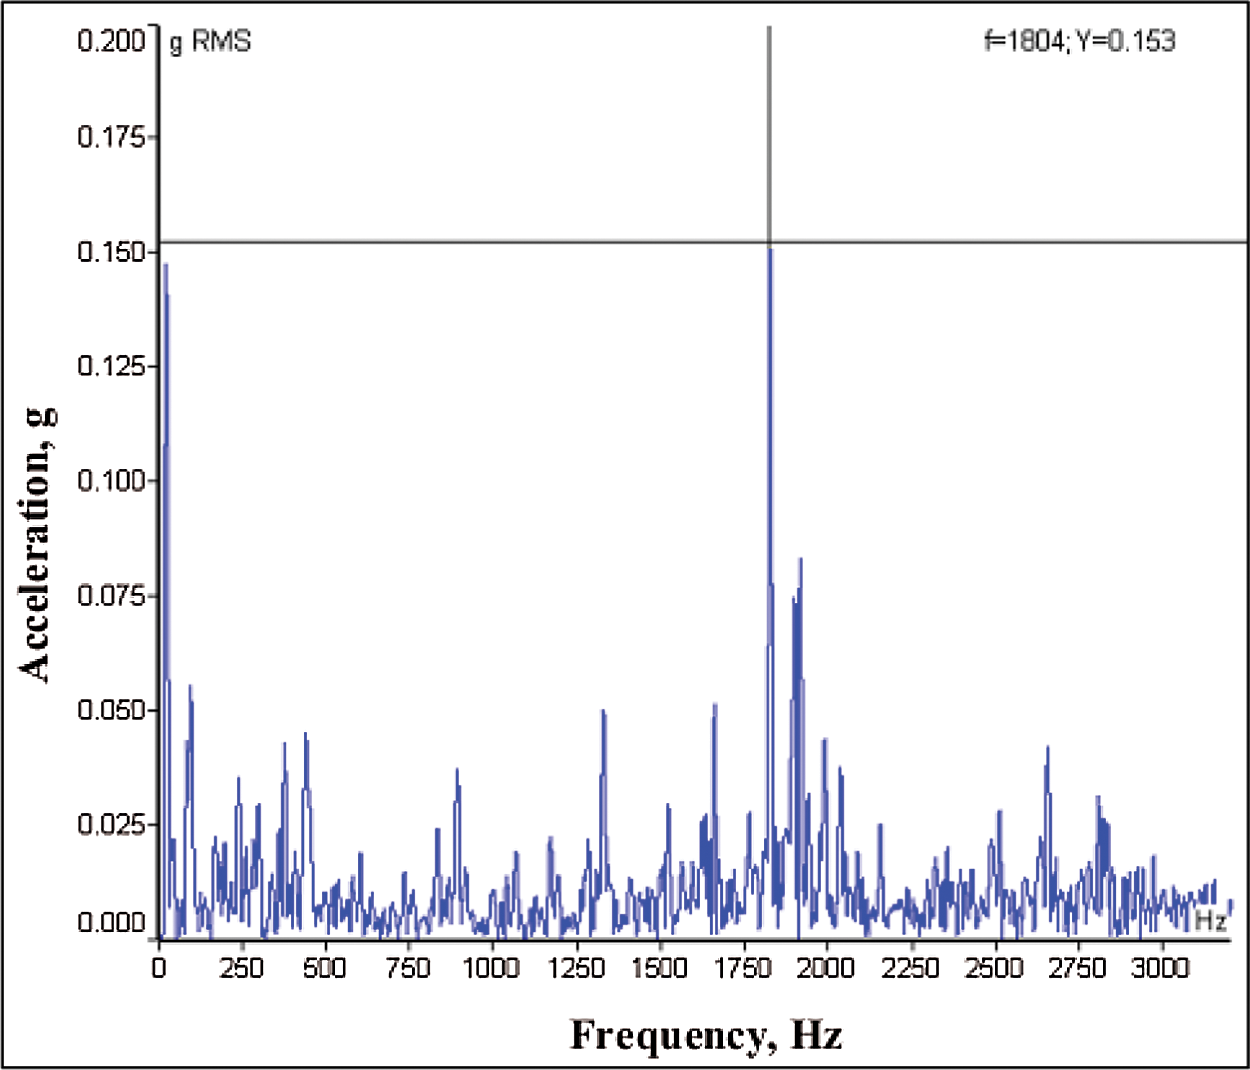
Figure 13: Frequency spectrum for bearing B11
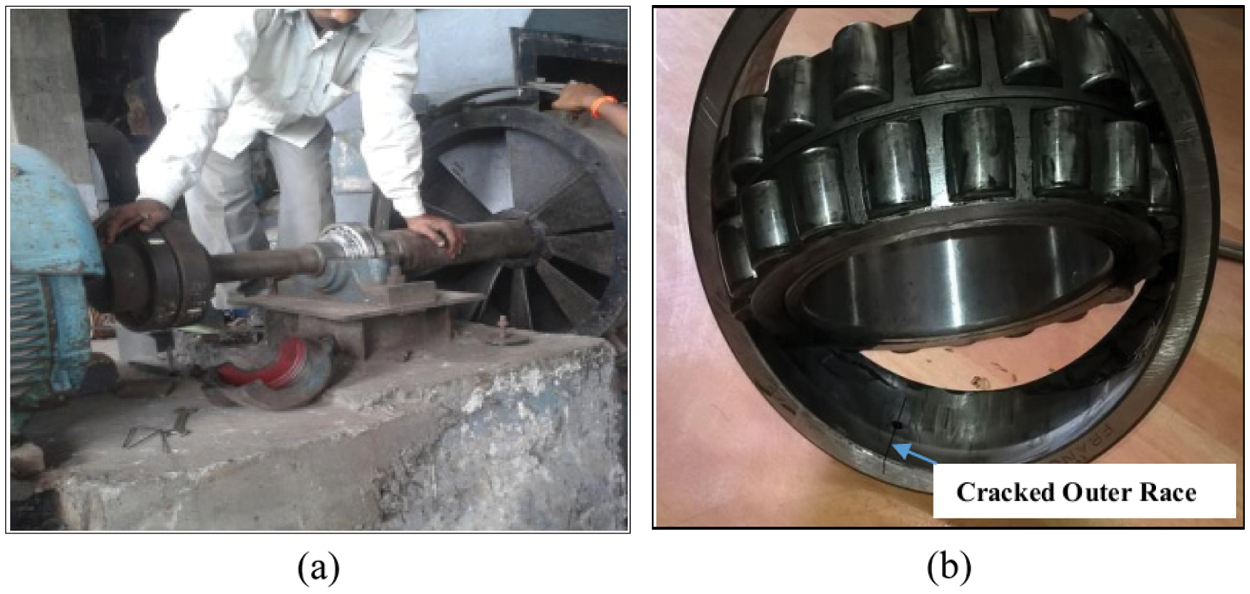
Figure 14: Bearing B11 dismantled for (a) Inspection, and (b) Actual photograph of line defect
The model Eq. (26) has predicted an acceleration amplitude of 0.1493 g. The experimentally observed peak for this case as seen from the spectrum shown in Fig. 13 is 0.153 g. By comparing these two values, a good agreement between the model and the experimental results is noticed.
A unique and easy to implement technique based on DA and scaling laws established here for the dimensional amplitude response analysis of the vibration due to presence of defects in different components of rolling contact bearings. All the responses are obtained by analysis of the vibration data in frequency-amplitude domain. The proposed methodology of integrating DA and scaling facilitates an in-depth fundamental understanding of the vibration mechanism in rolling contact bearings due to defects. The developed correlations originated from this study provides a strong perception on the connection between the identified objective variable i.e., dimensional amplitude response and the corresponding non-dimensional numbers. From the developed methodology following important findings are obtained,
i) In the present correlation based study integrating DA and scaling laws, considering different design, material and operating parameters of the bearings, theoretical physics based model is proposed for relating spall sizes and other geometric, material and operating parameters with the vibration accelerations amplitudes at characteristic defect frequencies due to defective bearing components with these parameters.
ii) The coefficient of the dimensionless number offers important perception into the comparative significance of the physics behind that particular term. Also, the numerical and experimental shows that the proposed method can detect the localized bearing faults of different shapes.
iii) Based on the analysis, a close similarity is observed between the developed dimensionless numbers of model bearing and the test/prototype bearings. As, the observed difference between the dimensionless numbers for the model and the test bearings are found to be very lesser.
iv) The dimensional vibration amplitude at bearing defect frequency found to be increasing with increase in the system operating parameters such as unbalance and the rotor speeds.
v) For both the case studies, outer race defective bearing having higher acceleration amplitude as compared to the inner race or roller defective bearing. The difference between the theoretical and actual defect frequencies as seen from the experimental frequency spectrum in case of outer race defects is very lesser.
vi) In the present investigation an effective use of the frequency domain vibration data has made it possible to successfully detect the presence of defects in the different bearing components and proven to be the simplified method to be applicable for the condition monitoring programs in various industrial applications.
Acknowledgement: Authors are extremely thankful to Mr. Bandu Ghatage of J.B. Engineering, Kupwad, Sangli, Maharashtra for his valuable suggestions during the fabrication of the laboratory test rig at his factory. Authors are also extremely grateful to Mr. Vijay More, Chief Executive Engineer for letting permission in carrying out COM program in the factory and Mr. Pravin Patil Maintenance Engineer (Production and Boiler section), Rajarambapu Sugar Factory Unit-III, Ashta, Maharashtra, India, for providing all the technical help and machinery specifications during this work.
Funding Statement: The authors received no specific funding for this study.
Conflicts of Interest: The authors declare that they have no conflicts of interest to report regarding the present study.
1. Tandon, N., Choudhury, A. (1999). A review of vibration and acoustic measurement methods for the detection of defects in rolling element bearings. Elsevier, Tribology International, 32, 469–480. DOI 10.1016/S0301-679X(99)00077-8. [Google Scholar] [CrossRef]
2. McFadden, P. D., Smith, J. D. (1984). Model for the vibration produced by a single point defect in a rolling element bearing. Journal of Sound and Vibration, 96(l), 69–82. DOI 10.1016/0022-460X(84)90595-9. [Google Scholar] [CrossRef]
3. Patil, M. S. (2008). Bearing signature analysis as a medium for fault detection: A review. Journal of Tribology, 130, 014001. DOI 10.1115/1.2805445. [Google Scholar] [CrossRef]
4. McFadden, P. D., Smith, J. D. (1985). The vibration produced by multiple point defects in a rolling element bearing. Journal of Sound and Vibration, 98(2), 263–273. DOI 10.1016/0022-460X(85)90390-6. [Google Scholar] [CrossRef]
5. Ohta, H., Sugimoto, N. (1996). Vibration characteristics of tapered roller bearings. Journal of Sound and Vibration, 190(2), 137–147. DOI 10.1006/jsvi.1996.0052. [Google Scholar] [CrossRef]
6. Tandon, N., Choudhury, A. (1997). An analytical model for the prediction of the vibration response of rolling element bearings due to a localized defect. Journal of Sound and Vibration, 205(3), 275–292. DOI 10.1006/jsvi.1997.1031. [Google Scholar] [CrossRef]
7. Wang, Y. F., Kootsookos, P. J. (1998). Modeling of low shaft speed bearing faults for condition monitoring. Journal of Mechanical Systems and Signal Processing, 12(3), 415–426. DOI 10.1006/mssp.1997.0149. [Google Scholar] [CrossRef]
8. Peter, W. T., Peng, Y. H., Richard, Y. (2001). Wavelet analysis and envelope detection for rolling element bearing fault diagnosis—their effectiveness and flexibilities. Journal of Vibration and Acoustics, 123, 303–310. DOI 10.1115/1.1379745. [Google Scholar] [CrossRef]
9. Massimo, C., Alberto, I. (2002). Analysis of damage of ball bearings of aeronautical transmissions by auto-power spectrum and cross-power spectrum. Journal of Vibration and Acoustics, 124, 180–185. DOI 10.1115/1.1448320. [Google Scholar] [CrossRef]
10. Liew, A., Feng, N., Hahn, E. J. (2002). Transient rotor dynamic modeling of rolling element bearing systems. Journal of Engineering for Gas Turbines and Power, 124, 984–991. DOI 10.1115/1.1479337. [Google Scholar] [CrossRef]
11. Shi, D. F., Wang, W. J., Qu, L. S. (2004). Defect detection for bearings using envelope spectra of wavelet transform. Journal of Vibration and Acoustics, 126, 567–573. DOI 10.1115/1.1804995. [Google Scholar] [CrossRef]
12. Choy, F. K., Zhou, J., Braun, M. J., Wang, L. (2005). Vibration monitoring and damage quantification of faulty ball bearings. Journal of Tribology, 127, 776–783. DOI 10.1115/1.2033899. [Google Scholar] [CrossRef]
13. Choudhury, A., Tandon, N. (2006). Vibration response of rolling element bearings in a rotor bearing system to a local defect under radial load. Journal of Tribology, 128, 252–261. DOI 10.1115/1.2164467. [Google Scholar] [CrossRef]
14. Zeki, K., Hira, K. (2006). Vibration analysis of rolling element bearings with various defects under the action of an unbalanced force. Journal of Mechanical Systems and Signal Processing, 20, 1967–1991. DOI 10.1016/j.ymssp.2005.05.001. [Google Scholar] [CrossRef]
15. Arslan, H., Aktürk, N. (2008). An investigation of rolling element vibrations caused by local defects. Journal of Tribology, 130(4), 1–12. DOI 10.1115/1.2958070. [Google Scholar] [CrossRef]
16. Cao, M., Xiao, J. (2008). A comprehensive dynamic model of double-row spherical roller bearing—Model development and case studies on surface defects, preloads, and radial clearance. Journal of Mechanical Systems and Signal Processing, 22, 467–489. DOI 10.1016/j.ymssp.2007.07.007. [Google Scholar] [CrossRef]
17. Sawalhi, N., Randall, R. B. (2008). Simulating gear and bearing interactions in the presence of faults: Part I. The combined gear bearing dynamic model and the simulation of localized bearing faults. Journal of Mechanical Systems and Signal Processing, 22, 1924–1951. DOI 10.1016/j.ymssp.2007.12.001. [Google Scholar] [CrossRef]
18. Sawalhi, N., Randall, R. B. (2008). Simulating gear and bearing interactions in the presence of faults: Part II. Simulation of the vibrations produced by extended bearing faults. Journal of Mechanical Systems and Signal Processing, 22, 1952–1966. DOI 10.1016/j.ymssp.2007.12.002. [Google Scholar] [CrossRef]
19. Khalid, F. A., Roy, A., Ramachandran, K. P., Harrison, D. K., Steven, G. (2009). Rolling element bearing faults diagnosis based on autocorrelation of optimized: Wavelet de-noising technique. International Journal of Advanced Manufacturing Technology, 40, 393–340. DOI 10.1007/s00170-007-1330-3. [Google Scholar] [CrossRef]
20. Wang, C. C., Kang, Y., Shen, P. C., Chang, Y. P., Chung, Y. L. (2010). Applications of fault diagnosis in rotating machinery by using time series analysis with neural network. Journal of Expert Systems with Applications, 37, 1696–1702. DOI 10.1016/j.eswa.2009.06.089. [Google Scholar] [CrossRef]
21. Desavale, R. G., Venkatachalam, R., Chavan, S. P. (2013). Antifriction bearings damage analysis using experimental data based models. Journal of Tribology, 135(4), 1–12. DOI 10.1115/1.4024638. [Google Scholar] [CrossRef]
22. Desavale, R. G., Venkatachalam, R., Chavan, S. P. (2014). Experimental and numerical studies on spherical roller bearings using multivariable regression analysis. Journal of Vibration and Acoustics, 136(2), 1–10. DOI 10.1115/1.4026433. [Google Scholar] [CrossRef]
23. Sawalhi, N., Randall, R. B. (2010). Vibration response of spalled rolling element bearings: Observations, simulations and signal processing techniques to track the spall size. Journal of Mechanical Systems and Signal Processing, 25, 846–870. DOI 10.1016/j.ymssp.2010.09.009. [Google Scholar] [CrossRef]
24. Tang, H., Du, Y., Dai, H. L. (2020). Rolling element bearing diagnosis based on probability box theory. Journal of Applied Mathematical Modelling, 80, 944–960. DOI 10.1016/j.apm.2019.10.068. [Google Scholar] [CrossRef]
25. Gao, P., Hou, L., Yang, R. (2020). Local defect modelling and nonlinear dynamic analysis for the inter-shaft bearing in a dual-rotor system. Journal of Applied Mathematical Modelling, 68, 29–47. DOI 10.1016/j.apm.2018.11.014. [Google Scholar] [CrossRef]
26. Yang, Y., Liu, C., Jiang, D. (2020). Nonlinear vibration signatures for localized fault of rolling element bearing in rotor-bearing-casing system. International Journal of Mechanical Sciences, 173, 1–19. DOI 10.1016/j.ijmecsci.2020.105449. [Google Scholar] [CrossRef]
27. Chen, G., Hao, T. F., Wang, H. F., Zhao, B., Wang, J. et al. (2014). Sensitivity analysis and experimental research on ball bearing early fault diagnosis based on testing signal from casing. Journal of Dynamic Systems, Measurement, and Control, 136(6), 1–10. DOI 10.1115/1.4027926. [Google Scholar] [CrossRef]
28. Khanam, S., Dutt, J. K., Tandon, N. (2015). Impact force based model for bearing local fault identification. Journal of Vibration and Acoustics, 137(5), 1–13. DOI 10.1115/1.4029988. [Google Scholar] [CrossRef]
29. Issam, A., Fergani, N., Boutasseta, N., Oudjani, B., Deliou, A. (2017). A new time-frequency method for identification and classification of ball bearing faults. Journal of Sound and Vibration, 397, 241–265. DOI 10.1016/j.jsv.2017.02.041. [Google Scholar] [CrossRef]
30. Jadhav, P. M., Kumbhar, S. G., Desavale, R. G., Patil, S. B. (2020). Distributed fault diagnosis of rotor-bearing system using dimensional analysis and experimental methods. Journal of Measurement, 166, 1–12. DOI 10.1016/j.measurement.2020.108239. [Google Scholar] [CrossRef]
31. Akira, M., Yasutaka, S., Michiaki, S., Katsuhisa, F. (2010). Vibration test of a 1/10 reduced scale model of cylindrical water storage tank. Journal of Pressure Vessel Technology, 132(5), 1–13. DOI 10.1115/1.4001915. [Google Scholar] [CrossRef]
32. Gibbings, J. C. (2011). Dimensional analysis. Switzerland AG: Springer-Verlag London, Ltd. [Google Scholar]
33. Najm, O. S. A. (2012). A new method of dimensional analysis (fluid mechanics applications) Jordan. Journal of Civil Engineering, 6(3), 361–372. [Google Scholar]
34. Jamadar, I. M., Vakharia, D. P. (2017). A new damage diagnostic approach for deep groove ball bearings having localized surface defects in the raceways. Journal of Tribology, 139(6), 1–10. DOI 10.1115/1.4036630. [Google Scholar] [CrossRef]
35. John, O. R., Sastry, G. P., David, A. D. (1998). Applied regression analysis-A research tool. New York: Springer-Verlag Inc. [Google Scholar]
36. Montgomery, D. C. (2009). Design and analysis of experiments (7th edition). Berlin, Heidelberg: Springer-Verlag Willey India. DOI 10.1007/978-3-642-19234-0. [Google Scholar] [CrossRef]
37. Qing-Ming, T. (2011). Dimensional analysis with case studies in mechanics. Berlin, Heidelberg, Ltd.: Springer-Verlag. [Google Scholar]
38. Wowk, V. (1991). Machinery vibrations: Measurement and analysis. New York, USA: McGraw-Hill: Inc. Publication. [Google Scholar]
39. Harris, T. A. (1996). Rolling bearing analysis. New York: Publication: John Wiley. [Google Scholar]
 |
| This work is licensed under a Creative Commons Attribution 4.0 International License, which permits unrestricted use, distribution, and reproduction in any medium, provided the original work is properly cited. |