| Sound & Vibration |
DOI: 10.32604/sv.2022.015322
ARTICLE
Preliminary Archaeoacoustic Study of Kanheri Caves in Mumbai (Maharashtra, India)
1Department of Physics, SMM College of Science, Nagpur, 440009, India
2Department of Physics, RTM Nagpur University Campus, Nagpur, 440033, India
*Corresponding Author: Ajinkya S. Umbarkar. Email: ajinkya22007@gmail.com
Received: 09 December 2020; Accepted: 02 April 2021
Abstract: Here we report first ever study on acoustical evaluation of Kanheri Caves located in Sanjay Gandhi National Park, Mumbai (Maharashtra, India). These caves are dated to a period between 2nd century BCE to 7th century CE. In this study we used an ambisonic recorder to capture Impulse Response, which carries acoustic signature of the place. Out of total 109 caves 41 were surveyed in available time. Out of those reverberant environment was noted in 12 caves. Measurements were made only in 3 caves (Cave Nos. 1, 3, 11) which are important. In the beginning we carried out an FFT analysis. We then studied room acoustic parameters like Reverberation Time, Early Decay Time, Clarity, Definition, etc., based on the measurement of Impulse response. Cave No. 3 have high value of reverberation time, compared to other. Therefore it also have lower clarity compared to others. It is properties needs to be compared with similar structures (chaityas) in Maharashtra (at Ajanta, Ellora, Nashik, Junnar, etc.) and elsewhere in India. It is worthwhile to carry out further research in Cave No. 3 with more sophisticated instruments as well as 3D modeling. Since the experiment was performed with receiver at only one position, we also suggest to carry out experiment with receiver at multiple positions and then comparing them.
Keywords: Archaeoacoustics; reverberation time; room acoustics; kanheri caves
Archaeoacoustic is relatively a new area in scientific studies which combines the principles & technique of Acoustics and the knowledge from archaeology/history about a place under consideration [1]. In Archaeoacoustic studies, we need to generate an Impulse Response (IR) and recording it with the help of a proper instrument. IR represents acoustic signature of that place useful for analysis.
Archaeoacoustical investigation in India started some 30 years ago in 1990s. Many sites like Hulimavu Cave Temple (Bengaluru, Karnataka), Udayagiri Cave (Odisha), Koothabalam of Vadakkunathan Temple (Thrissur, Kerala); Rivona Caves, Tambdi Surla Mahadev Temple (all in Goa) and of many other sites have been studied by some researchers [2]. Last decade has witnessed increasing studies in this field worldwide. Such investigations in India were carried out with normal recording microphones or handheld recorders of Sony, Zoom, etc. Umashankar Manthrawadi developed his own First Order Ambisonic recorder named “Brahma”, with the help of this he carried out his work at many sites like Anupu (Andhra Pradesh), Ranigumpha at Udayagiri (Odisha) and some Koothambalams of Kerala temples [3]. First author personally carried out exploration and measurement at Udaigiri Caves (Vidisha, M. P), Karla Caves (Pune), some late medieval temples in Nagpur. Exploratory survey at Ajanta and Ellora Caves (Aurangabad), Bhaja Caves (Pune), Pataleshwar (Pune) was carried out.
They are Located [Coordinates: 19°12′30″N, 72°54′23″E] in Sanjay Gandhi National Park in Borivali, Mumbai. This complex houses 109 caves which were recorded earlier, Exploration in recent years have uncovered evidence of more caves and now it has nearly 160 caves. Chronologically they can be divided in 3 phases – First (2nd–4th cent CE), Second (5th–6th cent CE), Third (7th cent CE) [4]. Name of the hill comes from Sanskrit “Krishnagiri” = Black Mountain. This cave are carved in Basalt.
During the site visit we interacted with local people and security persons. We discussed about the site. Based on the inputs from them Caves 1, 3, 11 and 76 were selected for further experimental work. Due to time issues we could not visit Cave 76 for measurements.
Cave 1 is an incomplete Vihara (Dwelling Place) [4]. Although this is a traditionally accepted opinion, to some researchers it is an incomplete chaitya.
Cave 3 It is the main chaitya (Prayer Hall). It was initiated by two merchant brothers Gajasena & Gajamitra. Subsequently it was completed by merchant Aparenu. Thera Saumala was overseer of all the work, indicates an inscription in this cave. While entering in verandah, on the jamb there is inscription of Satavahana ruler Yajna Sri Satakarni (2nd century CE). This cave measures 86.5 ft. × 39 ft. 10 in (from wall to wall). Dagoba, where sacred relic of a venerable person were kept at the time of construction, is 16 ft. in diameter [4] (see Figs. 1a & 1b).
Cave 11 This cave is known as “Darbar Cave”. It served as Vihara (Resting or Dwelling Place) as well as an assembly hall. According to an estimate it was able to house around 500 persons. It measures 73 ft. × 32 ft. [4] (see Fig. 1c).
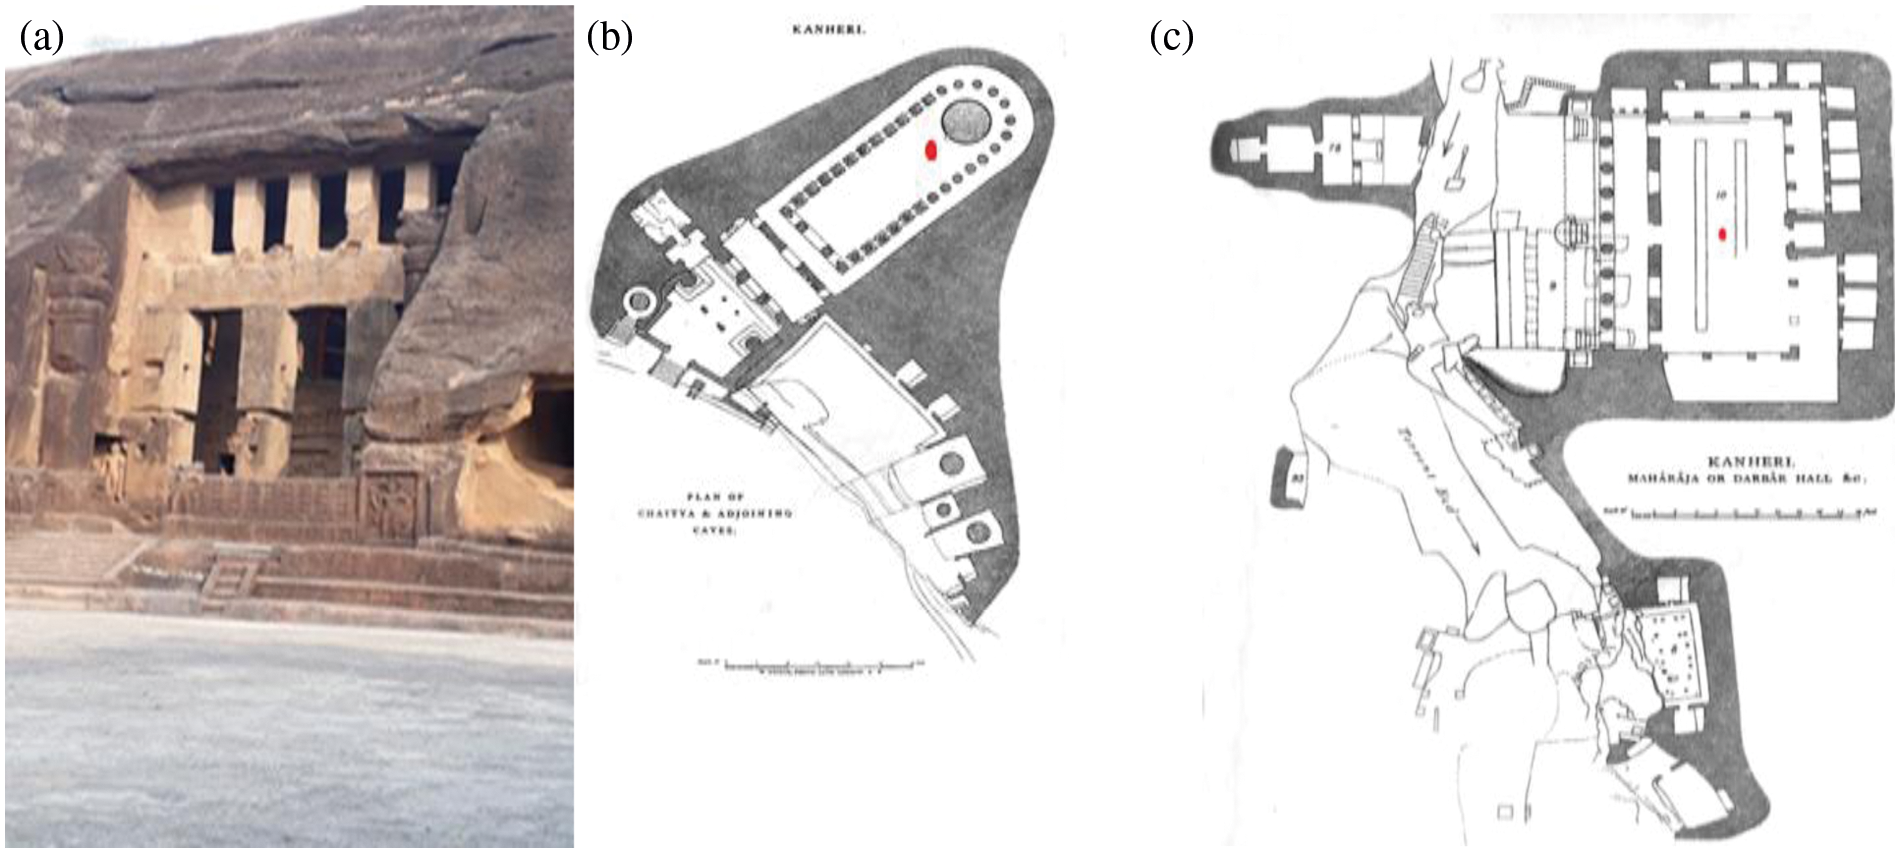
Figure 1: a- Front view of chaitya (Cave 3) [Photo by Author], b- Plan of Caves 1, 2, 3 and nearby cells, c- Plan of Cave 11 and nearby caves (for b, c [5])
In a survey of 41 caves reverberant environment were noted in Caves 1, 3, 4, 7, 8, 11, 12, 17, 18, 33, 34, 75 (see Fig. 2).
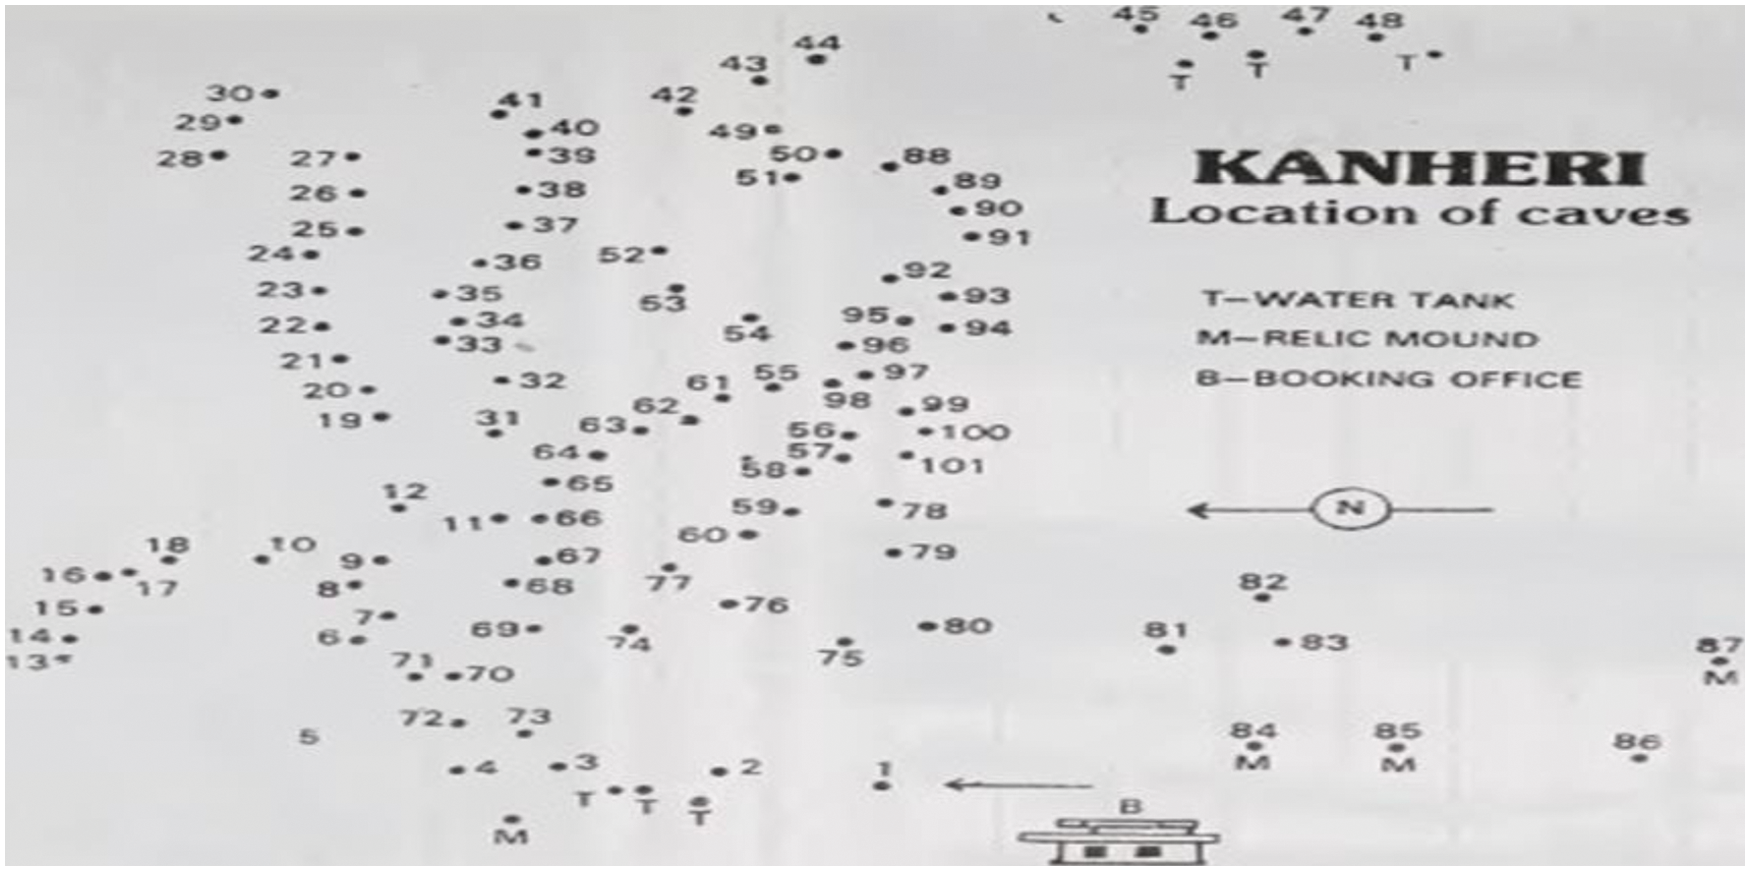
Figure 2: Site plan and locations of kanheri caves [6]
3 Equations and Mathematical Expression
Our methodology involves following steps
Interaction with local peoples, Archaeological Survey of India’s officials (as the site is protected by them) about how this places sounds, are there any earlier mentions of such phenomena and its records etc.
Recording of IR using balloon pop (as per ISO 3382 requirement) and Zoom H3-VR (a First Order Ambisonic recorder). Position of sound source is indicated in Fig. 1 with red dot.
After recording they will be processed using Aurora Plugin in Audacity for Fast Fourier Transform (FFT) and Room Acoustics Parameters like Clarity, Reverberation Time, Early Decay Time, Speech Transmission Index. Adobe Audition 3 will be used for Speech Transmission Index (STI). Aurora Plugin, developed by Prof. Angelo Farina is based on ISO-3382 parameters.
It can handle sound pressure input up to 120 dB SPL. It is able to record 360° audio. Highest resolution supported is up to 24 bit/96 kHz. Supported recording formats are Ambisonic A (Raw format), Ambisonic B (FuMa and AmbiX). Microphone position is detected automatically when recording starts. This recorder has built-in motion sensor to generate the playback sound for the desired direction from the data recorded in every direction. It also supports two 3D methods: Ambisonics and Binaural. In order to minimize reflections, it is recommended that recorder must be placed as far from walls and the floor as possible during recording. Binaural recording is supported only up to “48 k/8 bit” or “48 k/16 bit” [7]. H3-VR is noisier, but it is lot better than H2n. “H3-VR is a little bright, even with foam + fur, which with a touch of eq manages its tone and noise too.” After decoding with the Zoom Software much self-noise is generated and “spatiality” decreases a bit. A full-sphere capture (360°) in this instrument allows rotations on three axes in post-production of a sound field while in the case of 2D capture, only one axis is allowed. The ambix signal out of the H2n is a totally “legit” ambisonic signal, except that it lacks vertical information. The H3-VR is natively A-format with cardioid capsules. So each capsule is both pressure and velocity. Once converted to B-format (FuMa or ambiX), channel 1 is pressure, channels 2, 3, and 4 are velocity. Analog audio output of H3-VR is unbalanced stereo. So there is a risk of RFI/EMI noise. Harpex software and Array2SH (one of the plug-ins in SPARTA) are more spatially accurate than the Zoom converters. They are also less noisy; Harpex has least noise while converting to other 3D formats [8].
“We can imagine the result: some more or less significant roll-off below 100 Hz, some mild boost in the 2000 to 5000 Hz region and a somewhat irregular response above 10 kHz” [8].
In FOA four signals which are recorded, referred as A-format (raw format without any editing, post processing, conversion to other formats). They are labeled as based on their location as shown in Fig. 3a. A-format do not represent full 3D environment [9]. A to B-format conversion can be done with help of mathematical equations. They represent four monophonic recordings. With this equation four independent signals can be converted into a single four-channel audio file. B-format represent full 3D space using four audio streams: W containing the Sound Pressure Level (SPL) and functions as an omnidirectional recording X (front-to-back), Y (left-to-right), and Z (top-to-bottom) [9]. The equation to reach these values follows:
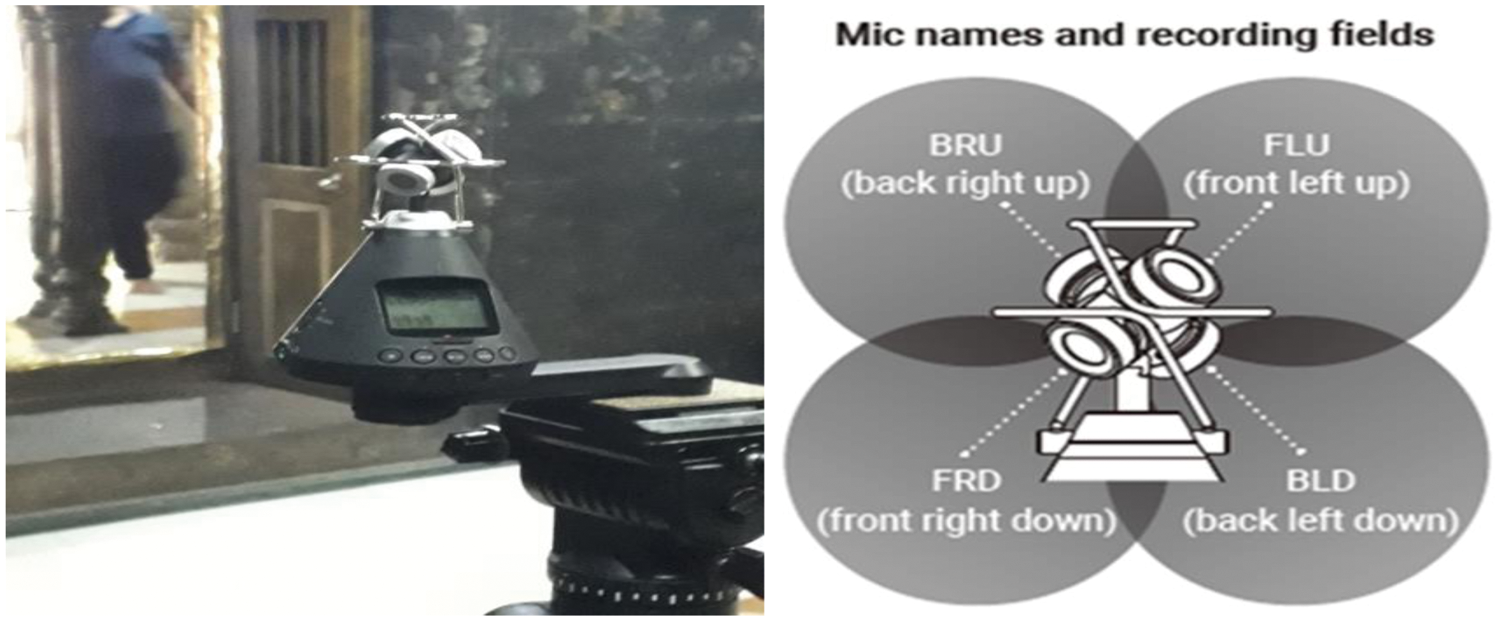
Figure 3: a- Zoom H3-VR during experiment at Kalyaneshwar (Telangkhedi. Nagpur), b- Mic position and names of Zoom H3-VR
3.3 Room Acoustic Parameters Discussed
EDT: It is based on 0 to 10 dB of initial decay. Influenced by early reflections, it depends upon measuring position of source-receiver and room geometry [10]. This parameter is measured from a linear regression line fit to the initial portion of the impulse response and computed separately for different frequency of octave band [11].
D50: It is evaluated at 500 Hz, 1 KHz, 2 KHz, 4 KHz and should have values >50% for good speech intelligibility [10]. D will be 100% if the impulse response does not contain any components with delays in excess of 50 ms [12].
where h2(t)0-50 ms = RIR measured at some distance preferably 1 m, h2(t)0-∞ is a RIR measured with omnidirectional source.
C80: It is a measure of transparency of musical structures [13]. In practice an unweight average of 125 Hz–4 KHz is used [14]. Optimal value for C80 are –4 dB to 0 dB (orchestral music), 0 dB to 4 dB (singers), –4 dB to 4 dB (general purpose) [15]. By substituting 0 to 50 limit in Eq. (7) as 0 to 80 this parameter can be obtained.
C50: It is based on the Haas Effect for speech, i.e., when an acoustical reflection reaches within 50 ms of the direct sound. It improves when strong early reflections are present in a room. Optimal values for C50 are ≥3 dB [11]. A weighted average for 500 Hz to 4 KHz is often used for assessment of a room [14].
where h(t) = power in first 50 ms and thereafter.
Reverberation Time (RT): According to ISO 3382 measured RT is obtained by extrapolation of a 60 dB line fitted to a decay curve. In reality, it is difficult to achieve Signal to Noise Ratio (SNR) which allows 60 dB decay range, therefore –5 dB to –35 dB decay is used, i.e., T30 [16]. T10 is calculated for range –5 dB to –15 db of decay. T20 is an estimation of the 60 dB decay time by extrapolation. SNR of minimum 35 dB is preferred for measuring T20 [11]. For greater speech intelligibility RT should be in range of 0.8 s – 1.0 s [14]. It is determined by Sabine equation as follows
where V = Volume of room in m3, S = Total surface area in m2, α = Absorption coefficient.
We first carried out FFT analysis using Audacity. Results are as shown in Fig. 4. Here Frequency is on x-axis and Sound Pressure Level (SPL) on y-axis.
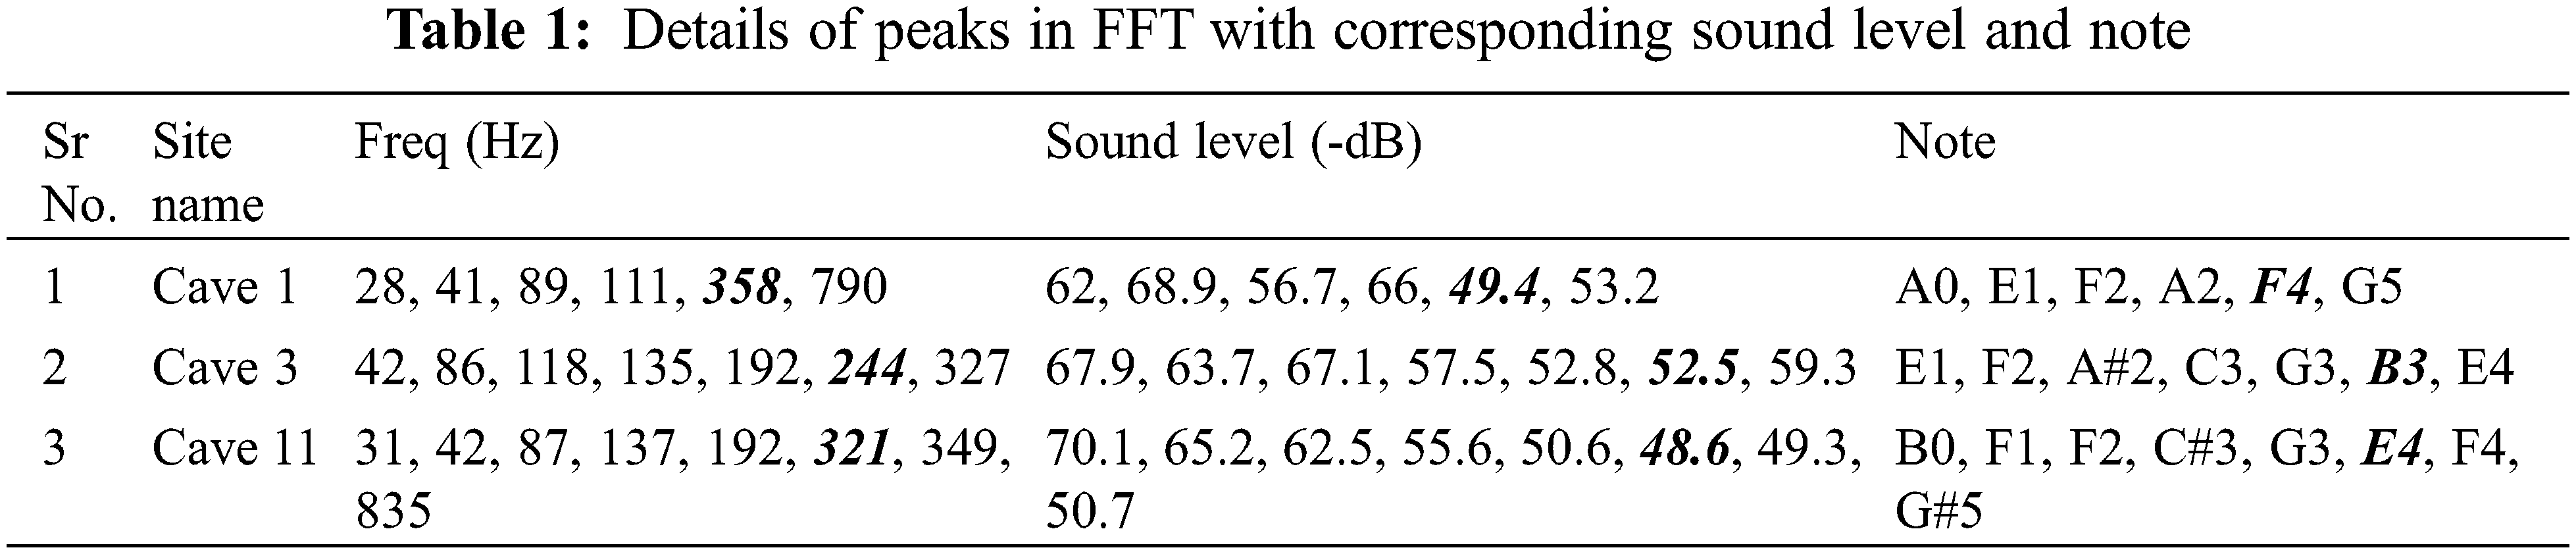
Fig. 4 shows many resonance peaks on low frequency side. Table 1 lists peaks at low frequency (less than 1 kHz), with corresponding SPL and musical note. Frequency corresponding to lowest dB level is in Italics.
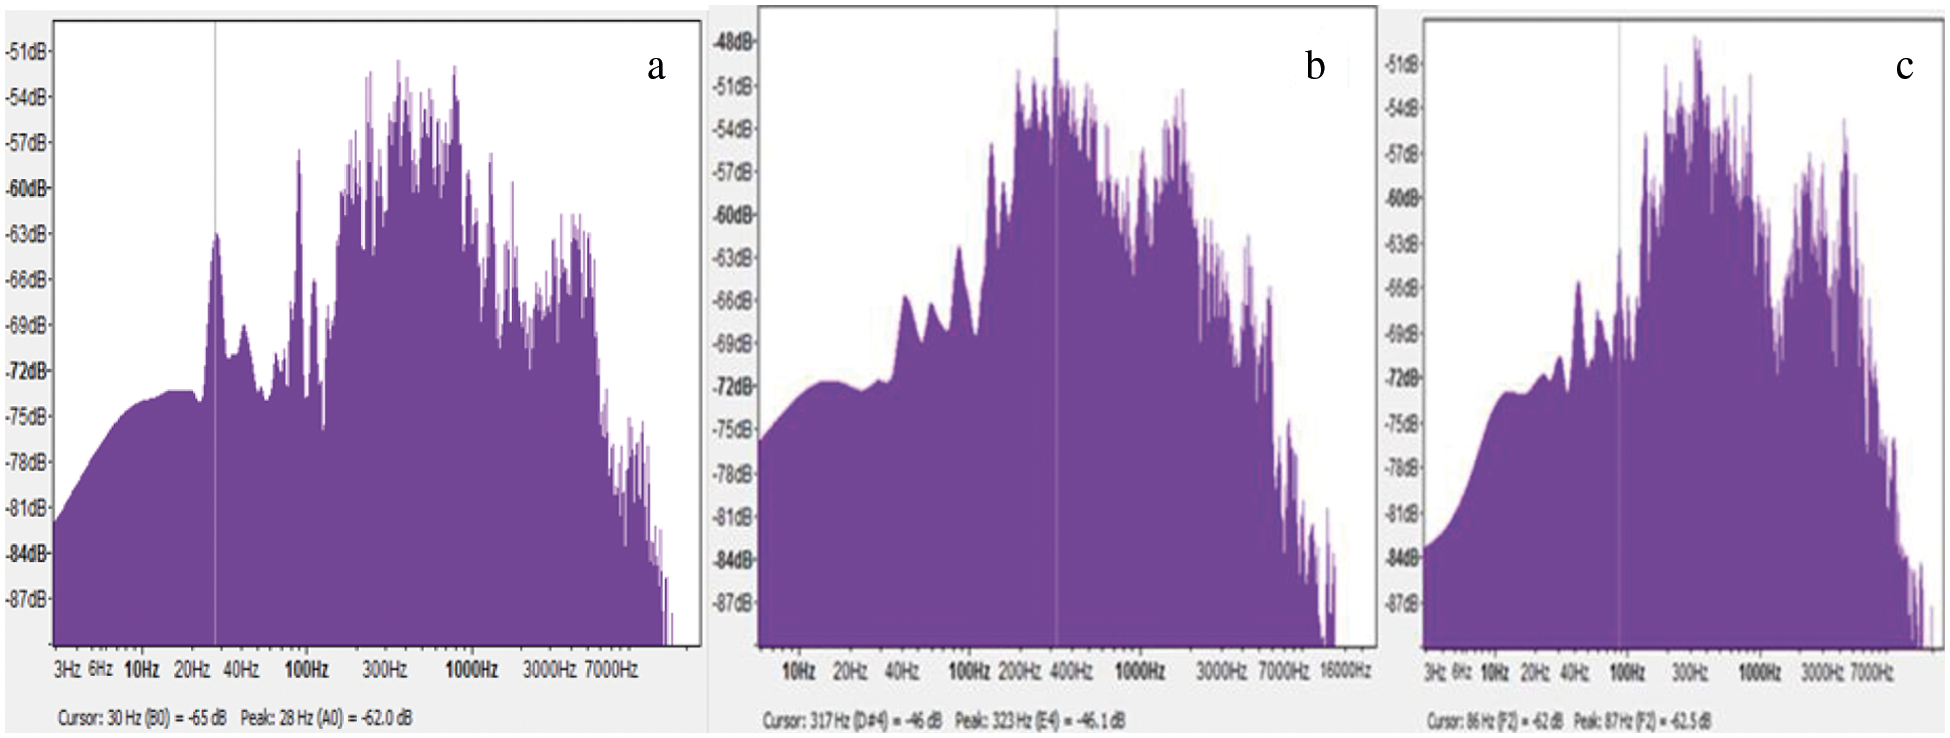
Figure 4: FFT Analysis of a- Cave 1, b- Cave 3, c- Cave 11 at kanheri caves
Tables 2–4 show room acoustic parameters like EDT (sec), T10 (sec), C50 (dB), D50 (%). Here CH = Channel number.
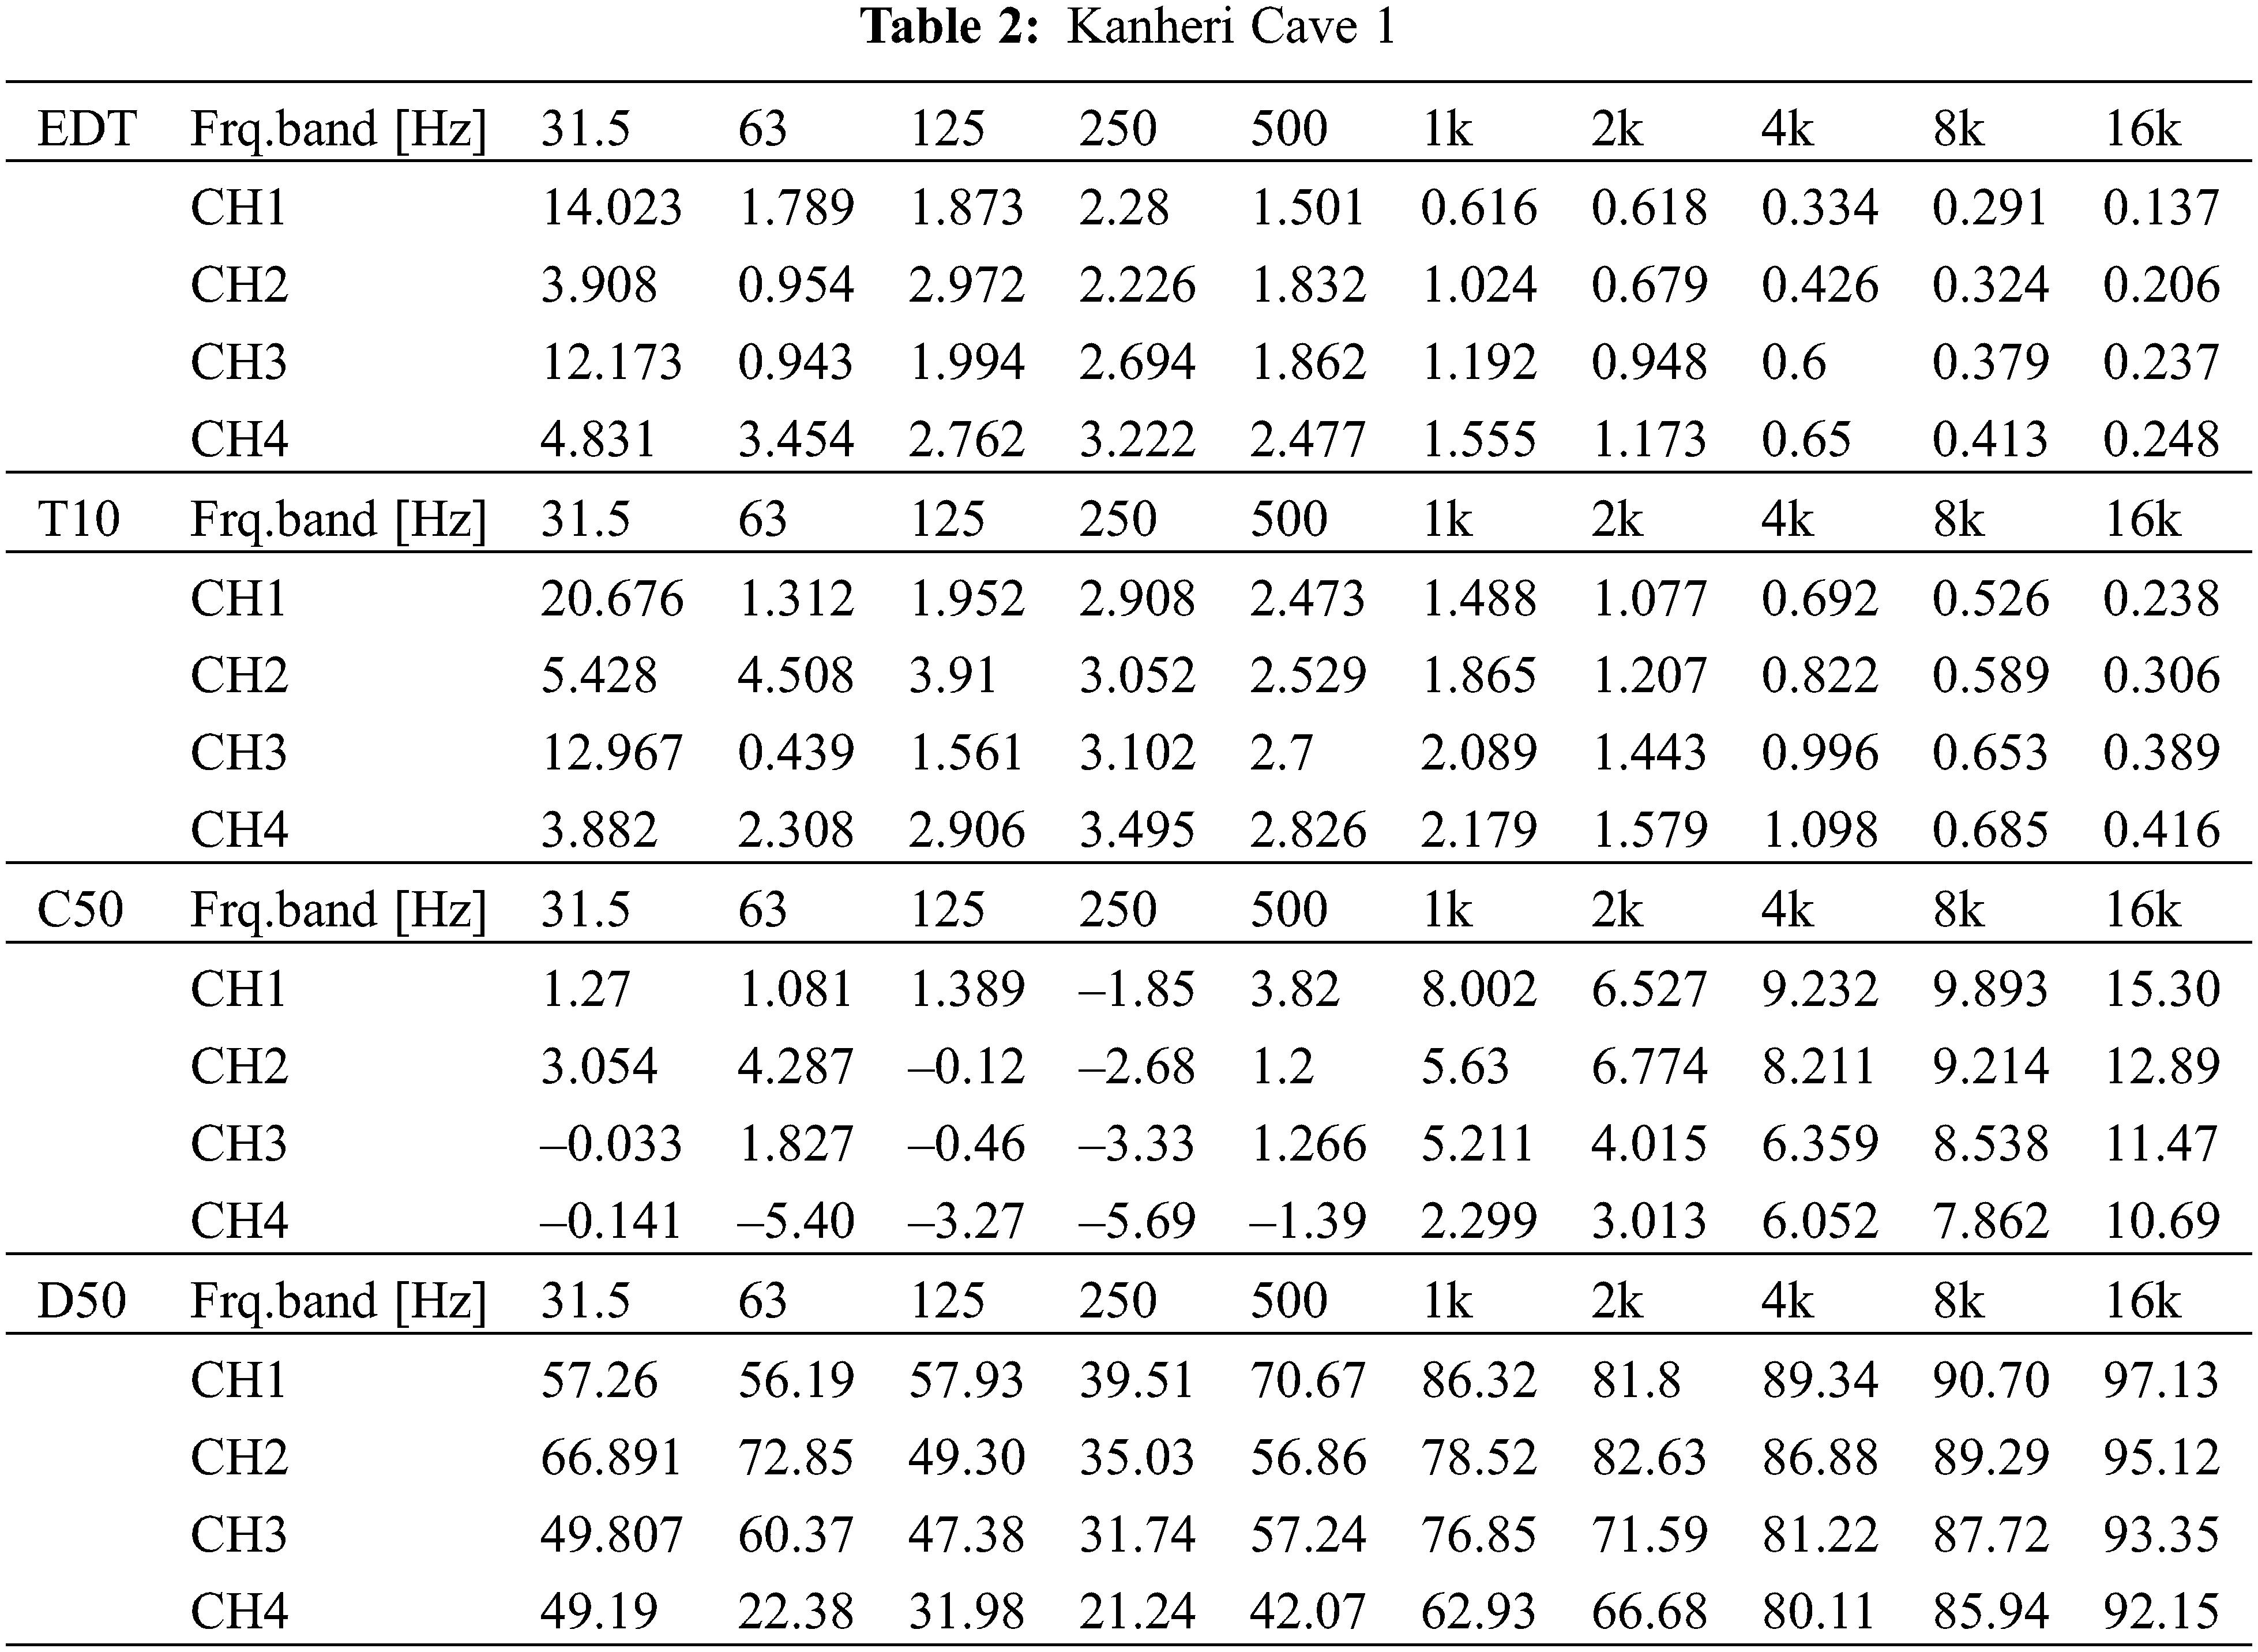
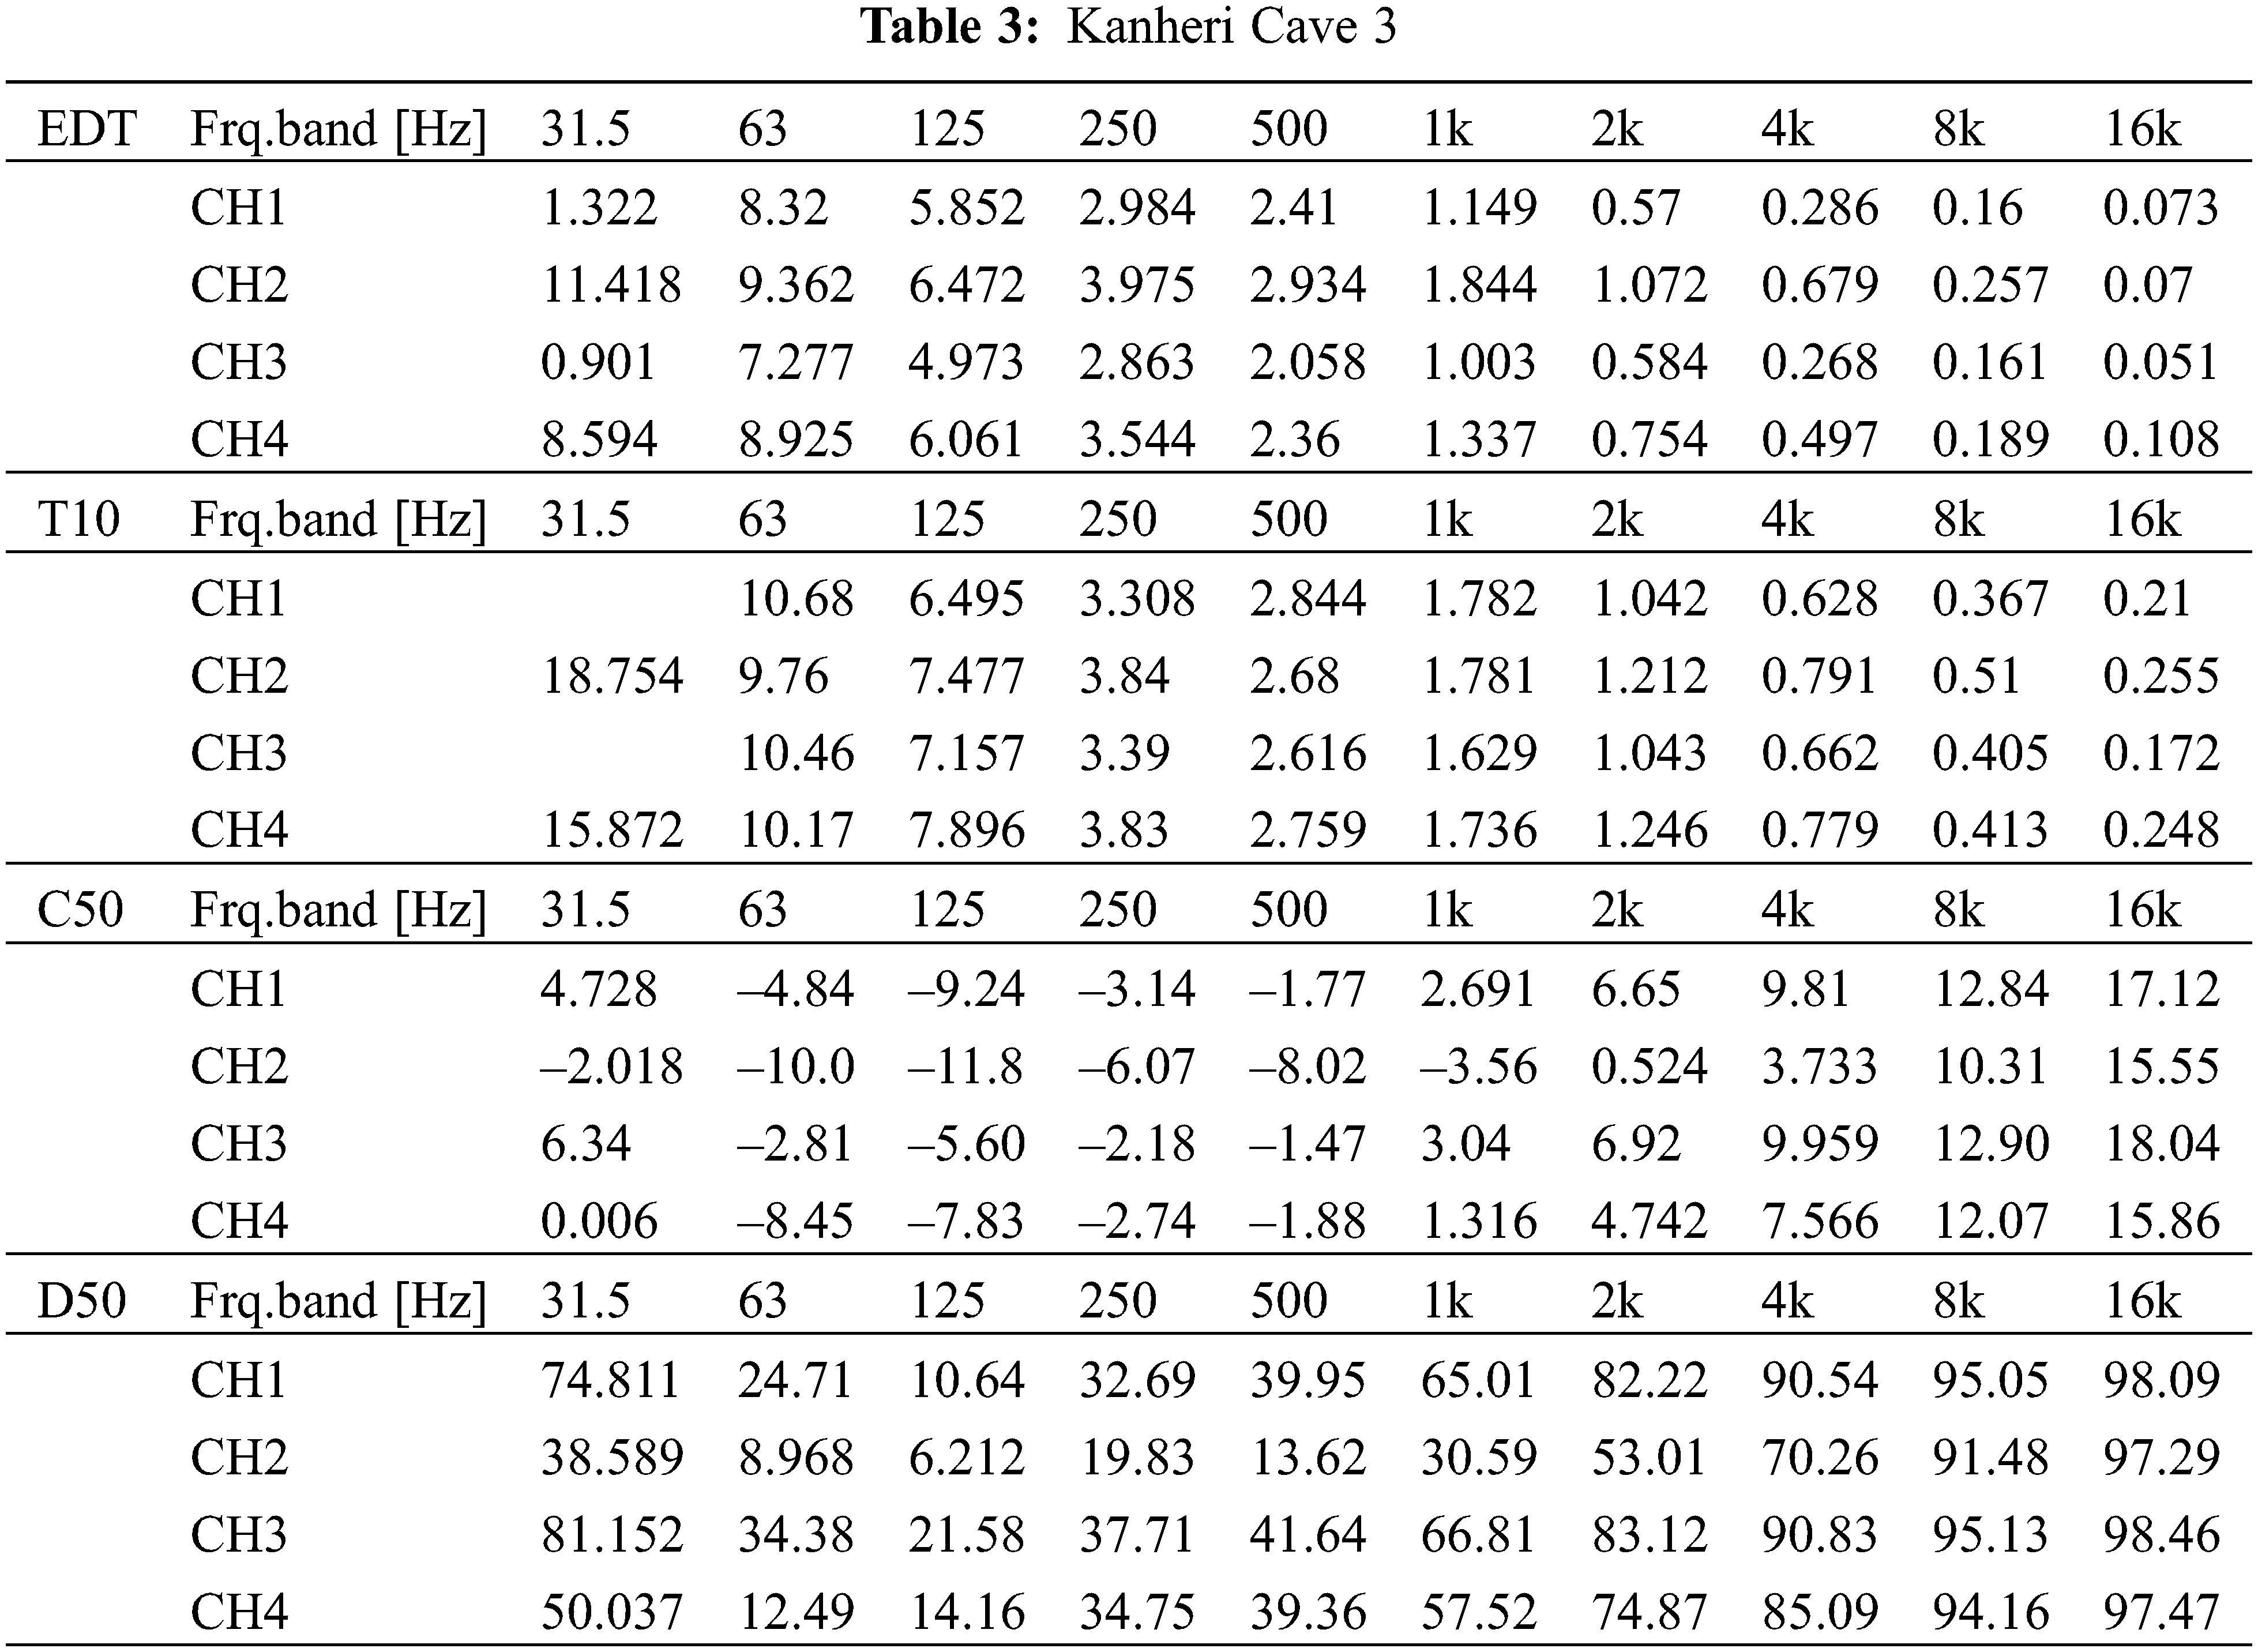
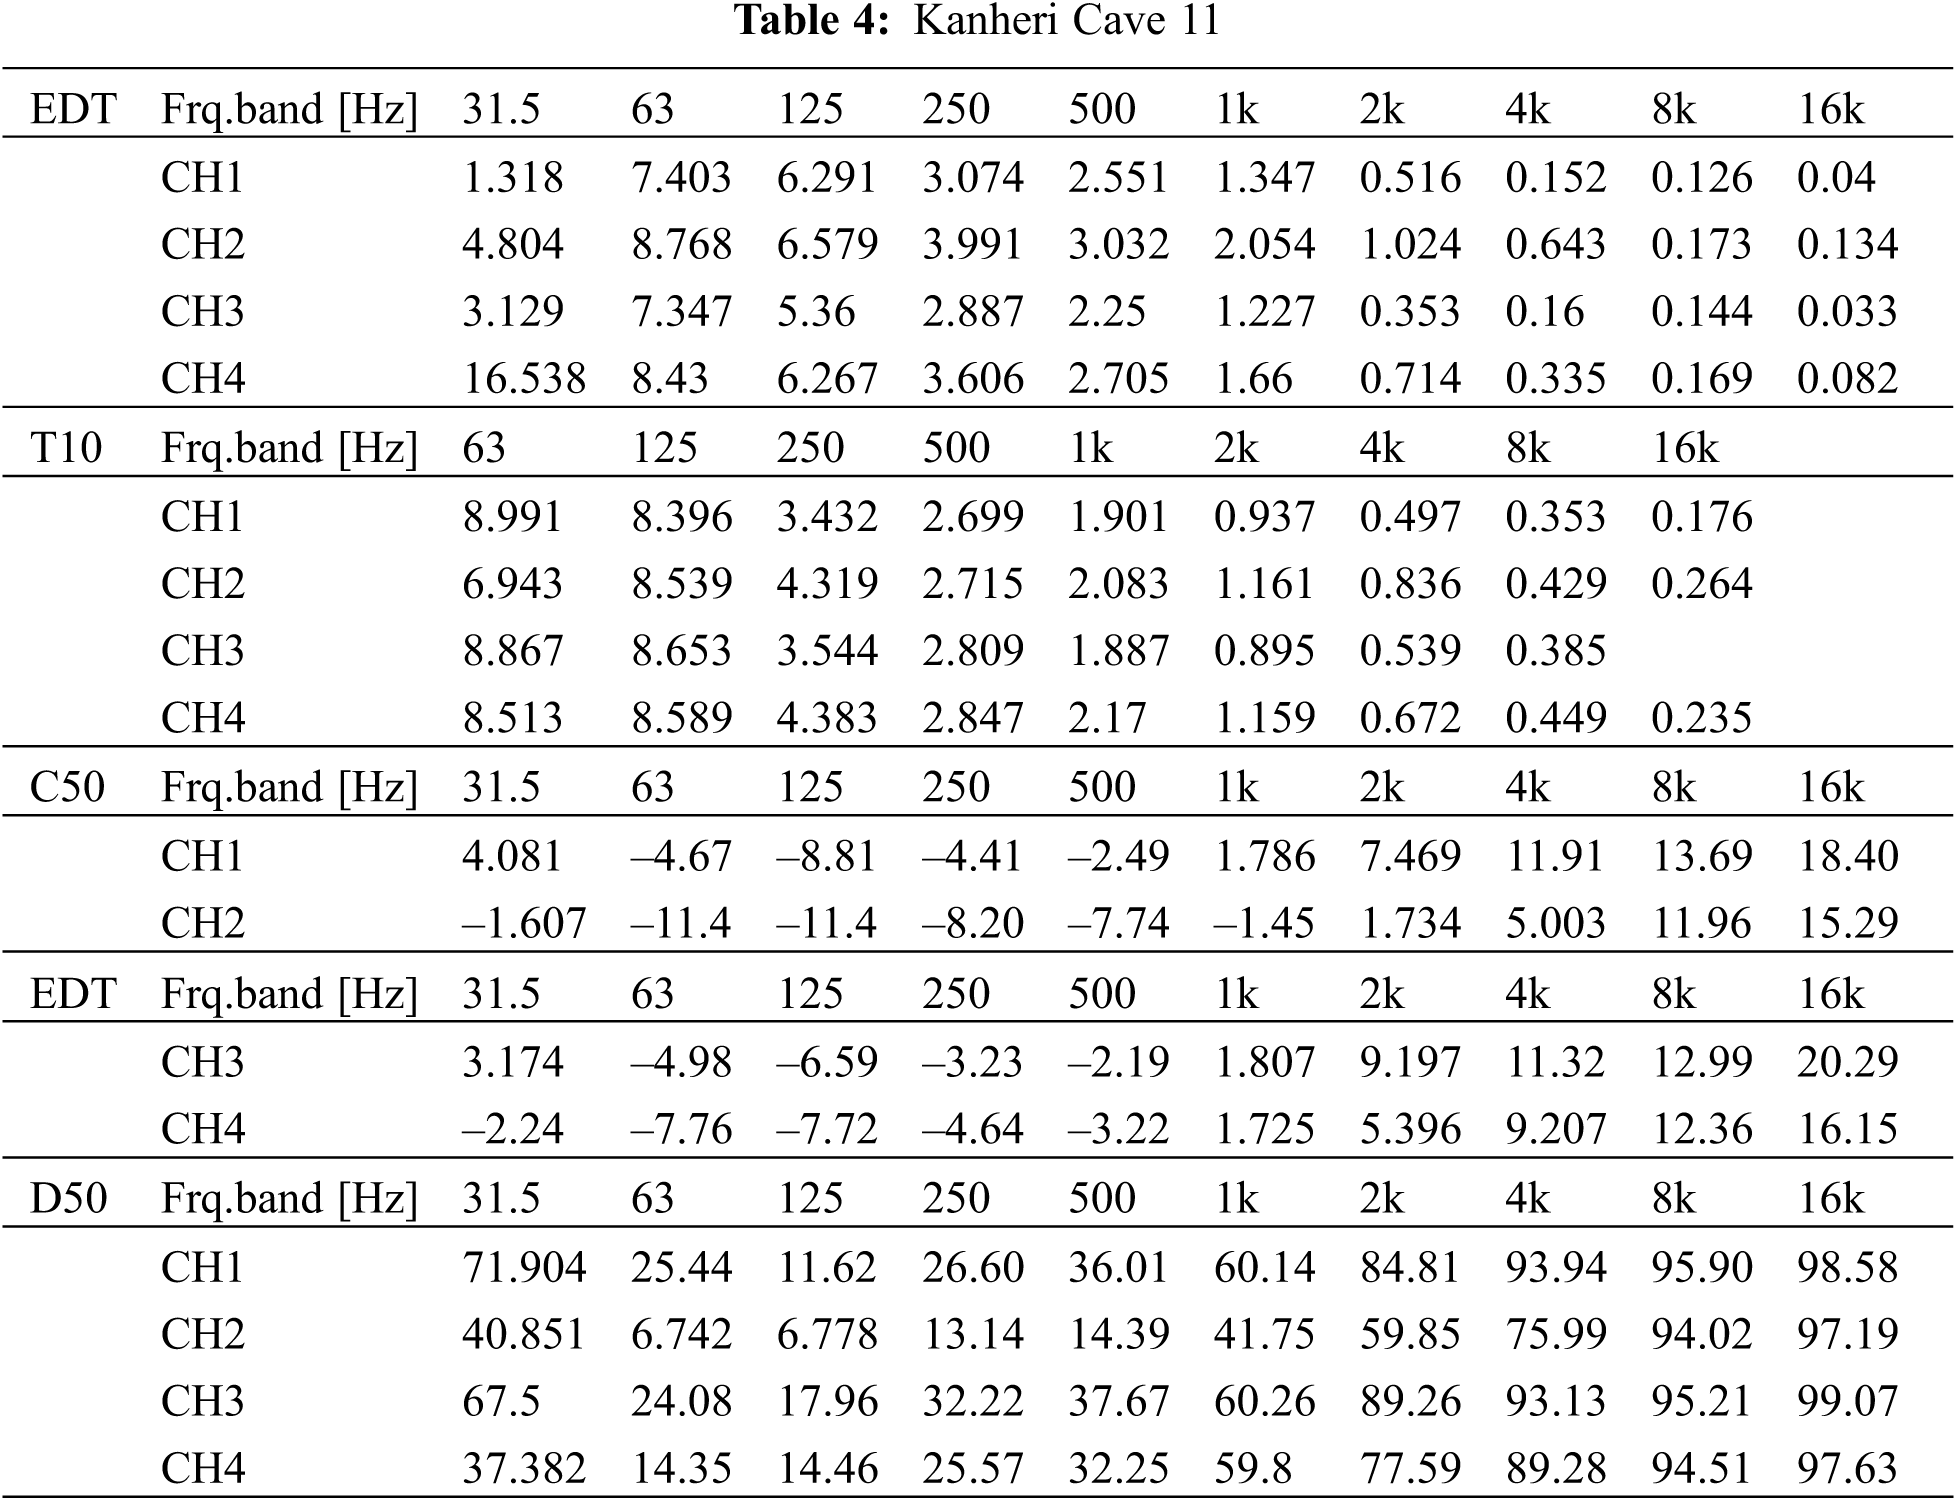
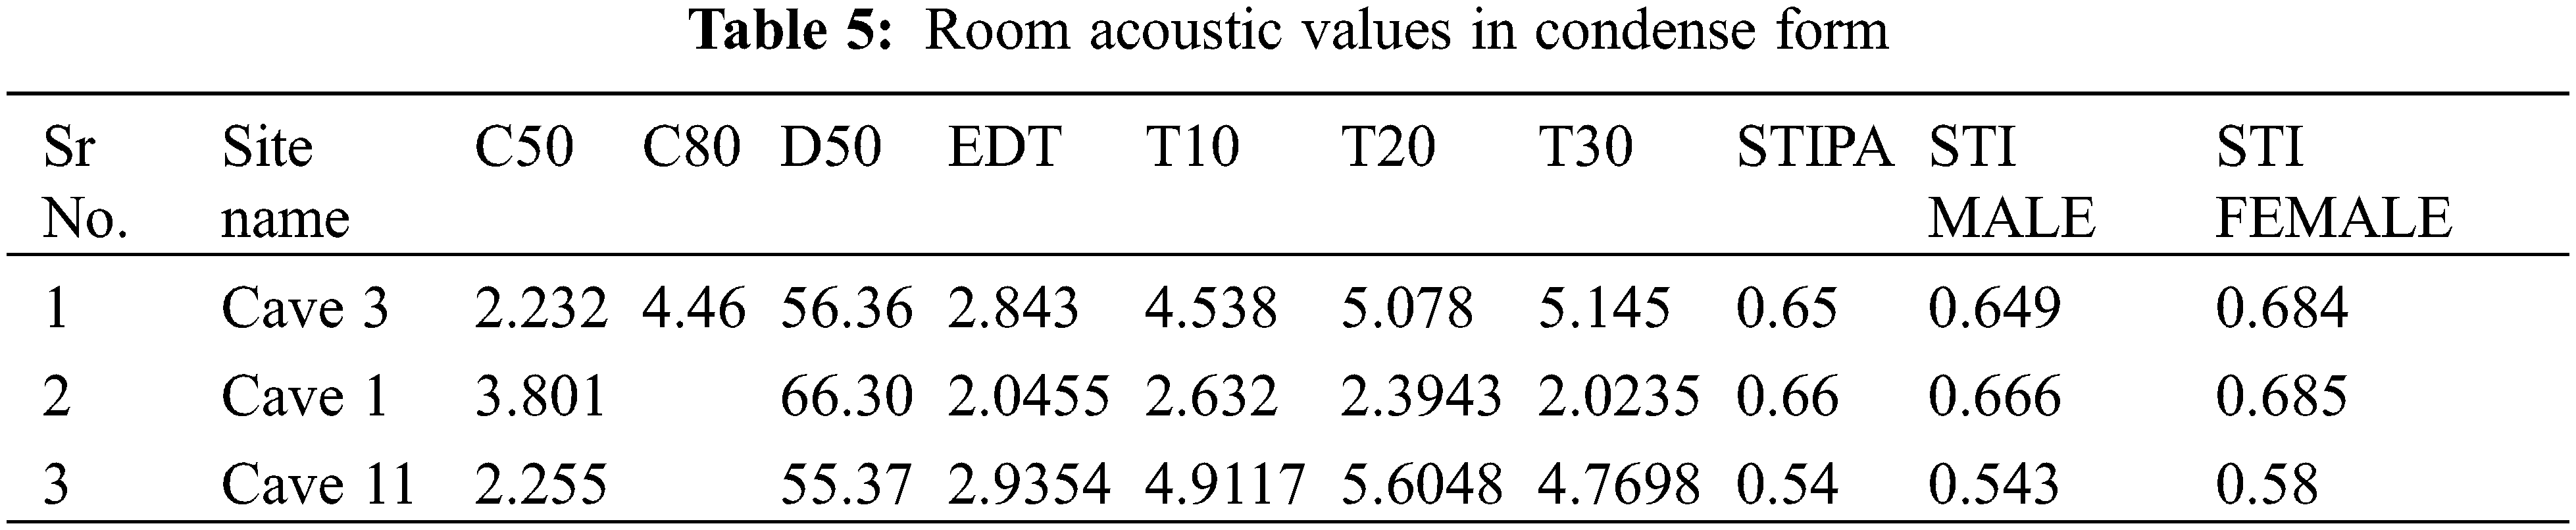
Table 5 gives the values in condensed form. For this we first took average of all channel values for each frequency. These values were then added and averaged for octave band. Here we have values of Clarity (C50, C80), Definition (D50), Early Decay Time (EDT), Reverberation Time (T10, T20, T30), Speech Transmission Index (Male, Female). C80 (for Music) value was evaluated only for chaitya.
We then calculated IACC (Inter-aural Cross Correlation) as shown in Table 6 below.
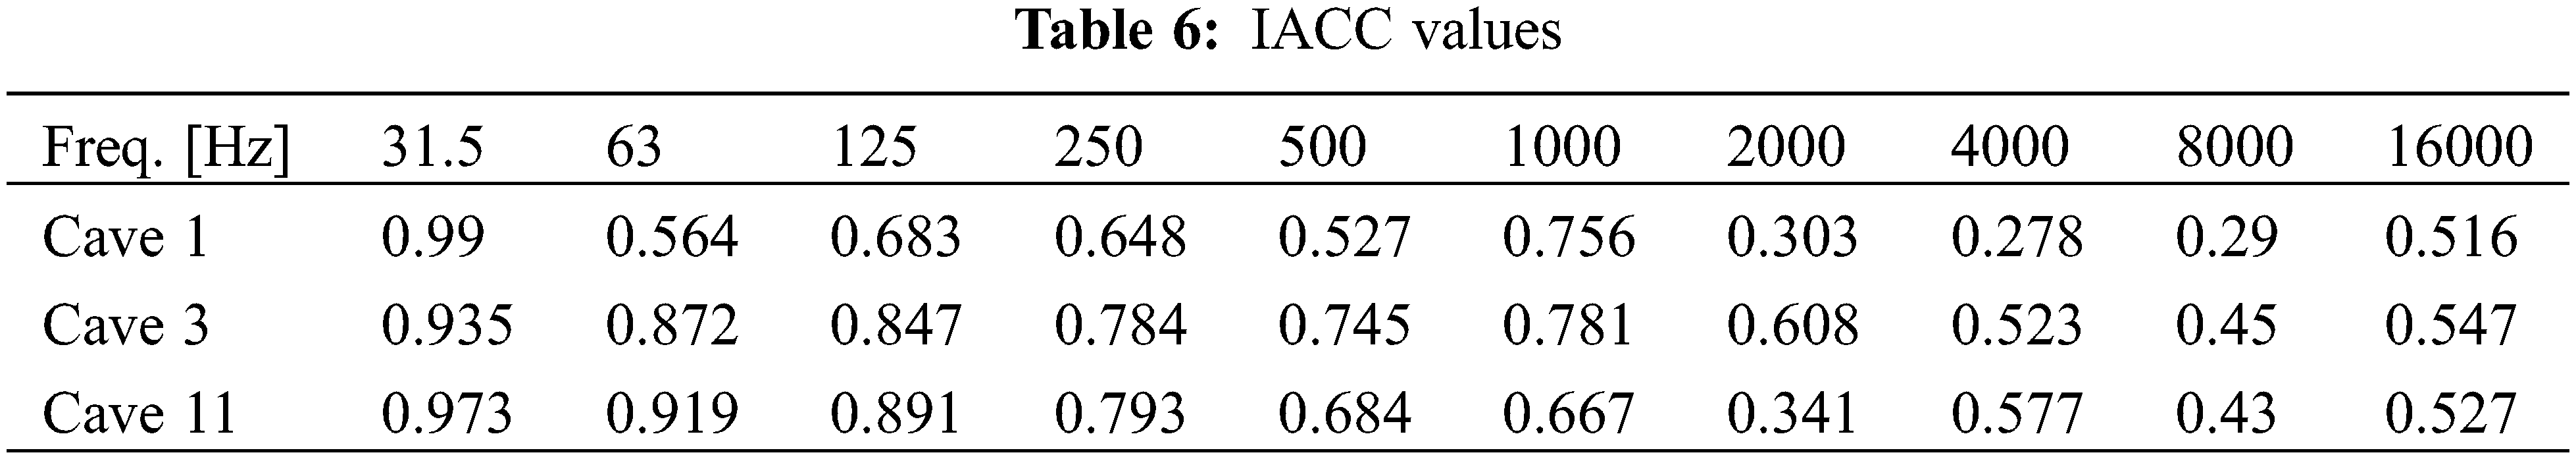
Inter-aural Cross Correlation (IACC) value denotes the correlation between the two signals arriving at two ears. +1 denotes two identical signals with perfect correlation, 0 for no correlation, −1 perfect correlation with out of phase signals (see Figs. 5 & 6).
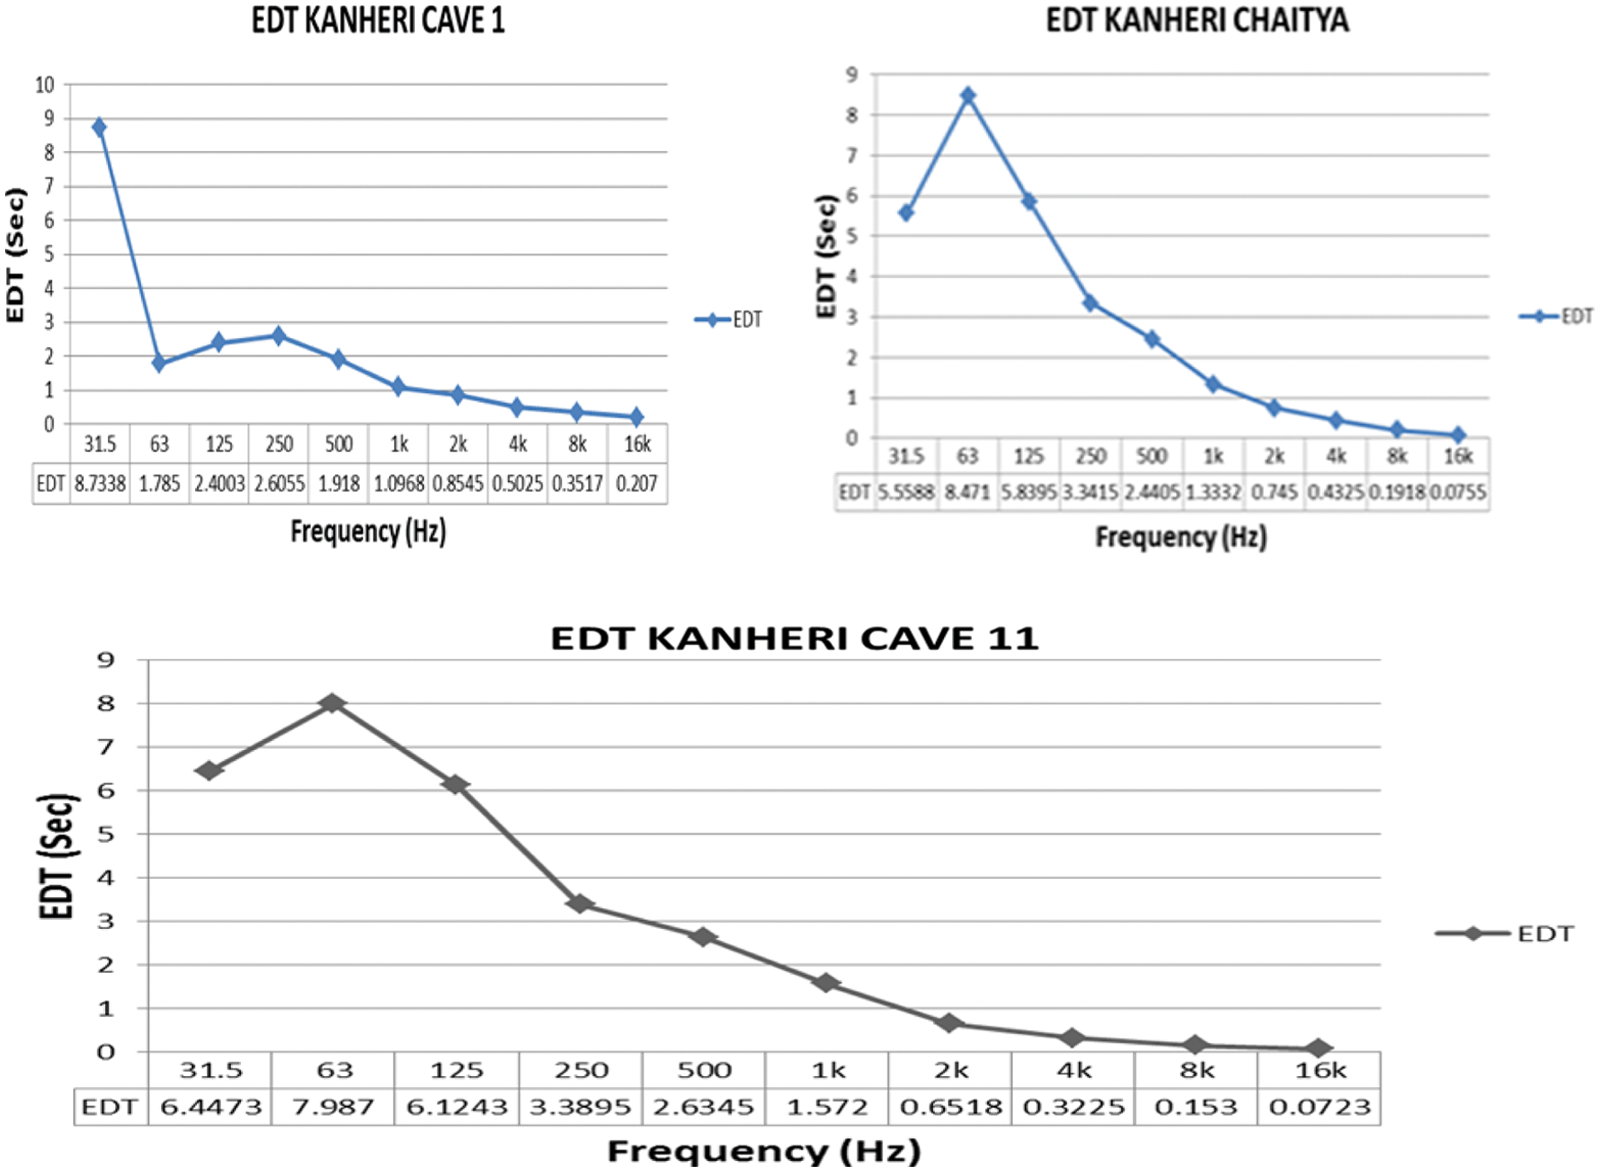
Figure 5: EDT values of Caves 1, 3 (Chaitya), 11 at kanheri
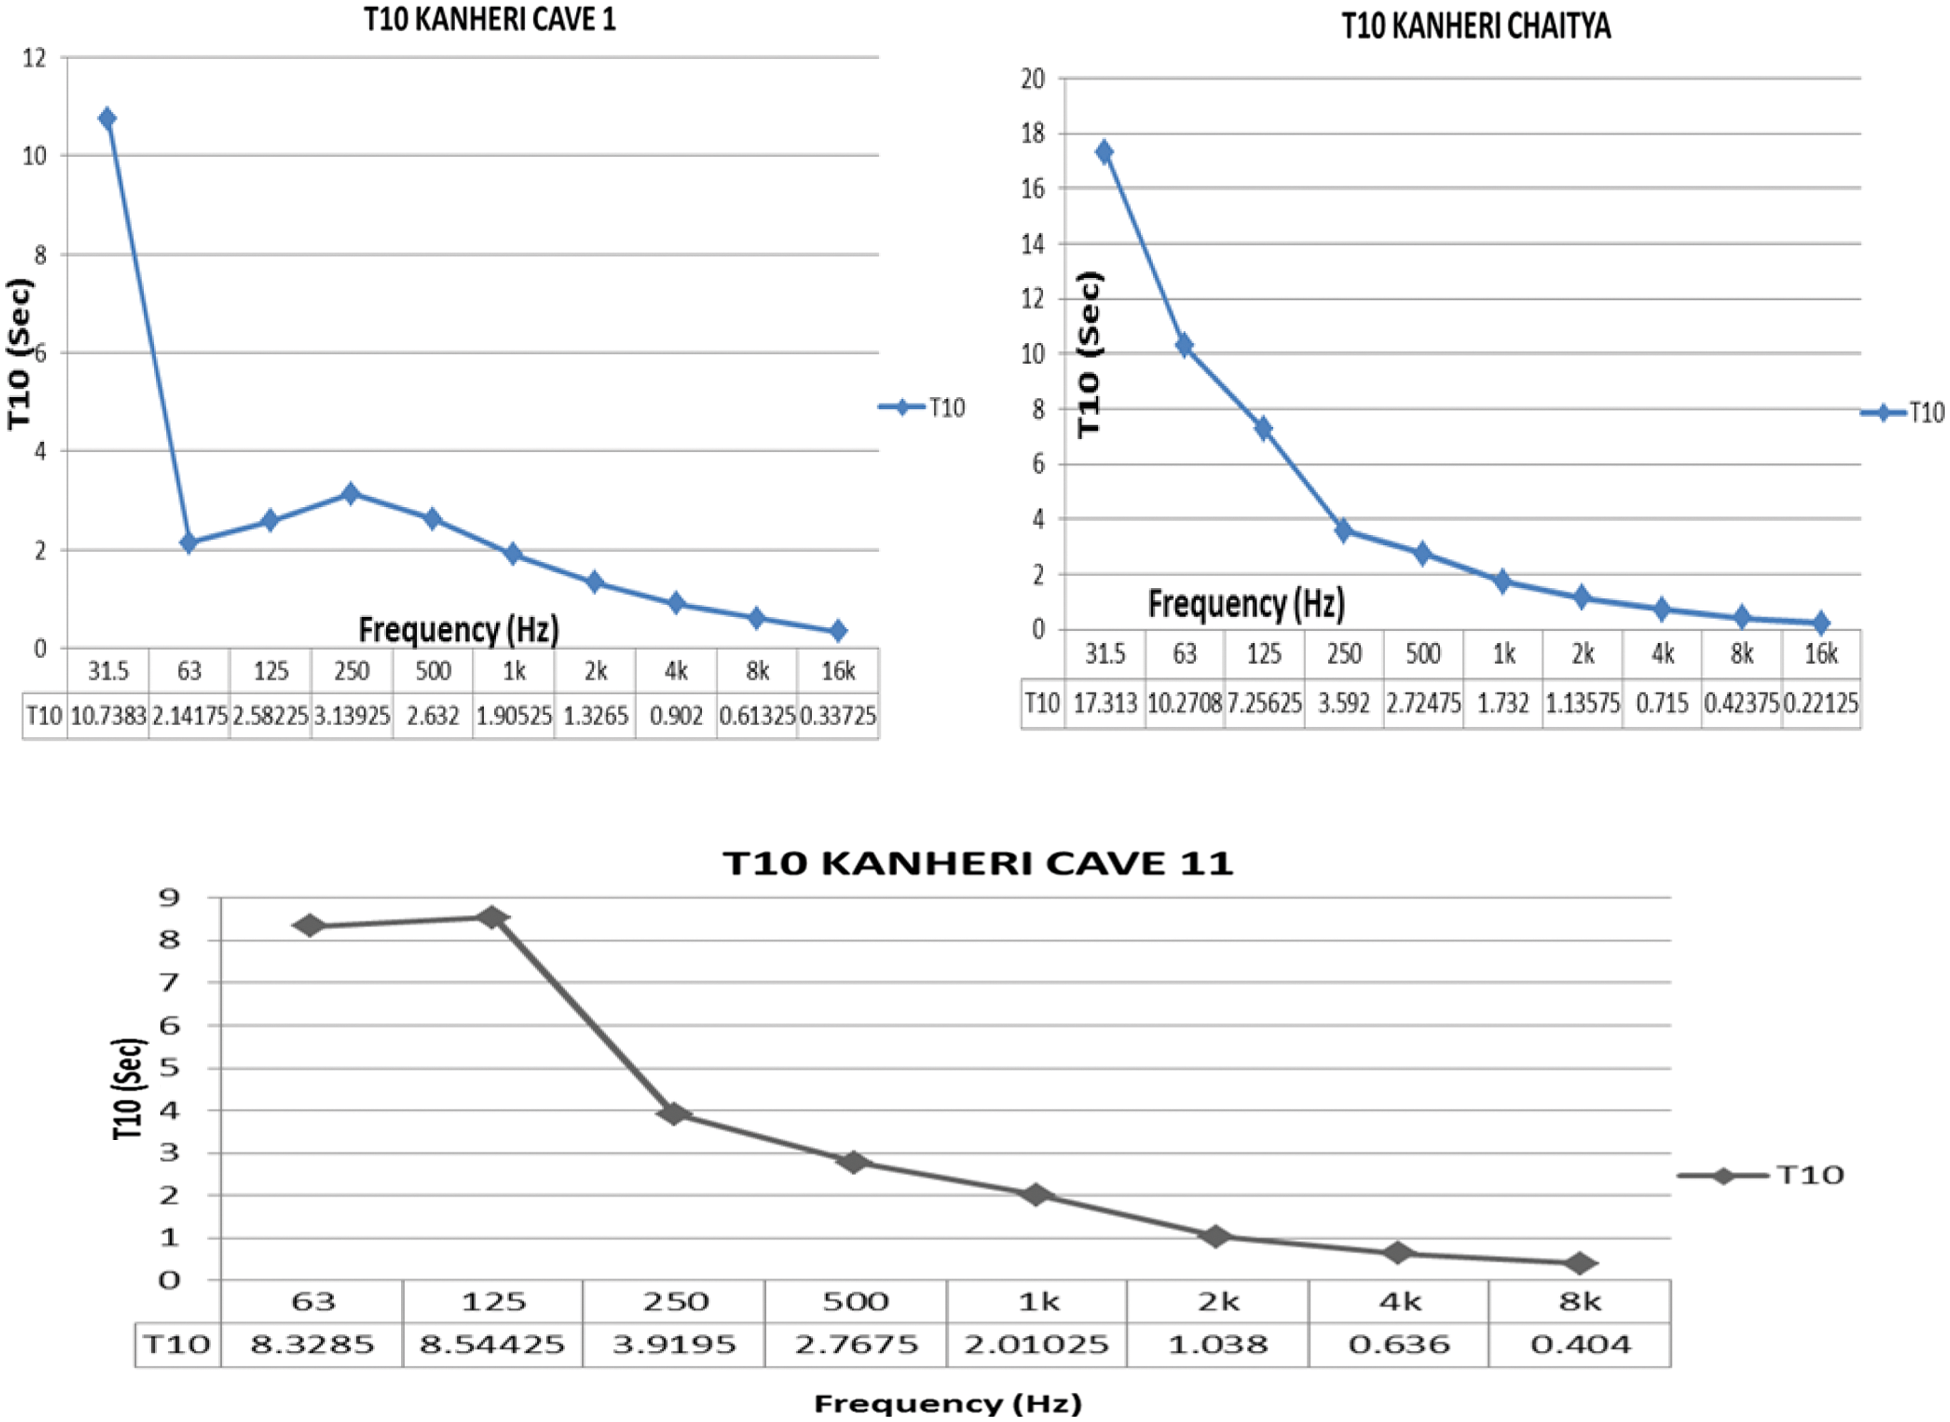
Figure 6: T10 values of Caves 1, 3 (Chaitya), 11 at kanheri
Cave 3 being a chaitya have low values of Room acoustic parameters at frequencies above 4k. Room acoustic values in condense form (Table 5) shows that Cave 3 have high value of reverberation time, compared to other. Since it has high RT values, clarity values are low compared to other cave. This cave holds prime importance at Kanheri since it is a prayer hall. It is properties needs to be compared with other chaityas in Maharashtra (at Ajanta, Ellora, Nashik, Junnar etc.) and elsewhere in India. Cave 11 shows good IACC values except at 2 kHz and 8 kHz. Similar cave to this one is present at Ajanta. Musical notes (indicated in Table 1) and their effects on the brain needs to be investigated properly. We also suggest that in Chaitya there is a need to carry out further work by using Acoustic Camera, TRV Camera. Also there is a need to map the soundscape inside this cave using source at different positions. Study was carried out with recording of IR in A-format (uncut, unedited). By converting it into B-format with proper converting tool we can study spatial characteristics of the space like source of energy, it is convergence point and what is the sound pressure in that area, etc.
Acknowledgement: We are thankful to Mumbai Circle ASI and its officials for helping us at the site. We are also thankful to First author’s friends Dr. Sagar Padhye (MBBS) and Jayesh Chachad for their help at site and in conducting measurements.
Funding Statement: The authors received no specific funding for this study.
Conflicts of Interest: The authors declare that they have no conflicts of interest to report regarding the present study.
1. https://en.wikipedia.org/wiki/Archaeoacoustics#:~:text=Archaeoacoustics%20is%20the%20use%20of%20acoustical%20study%20as,the%20study%20of%20the%20acoustics%20of%20archaeological%20artifacts. [Google Scholar]
2. Umbarkar, A. S., Nandanwar, D. V., Chimankar, O. P. (2018). Archaeoacoustic al investigation of sacred & worship places: how to do it? 13th WESPAC 2018, pp. 1–6. New Delhi, India. [Google Scholar]
3. https://brahmamic.com/. [Google Scholar]
4. https://en.wikipedia.org/wiki/Kanheri_Caves. [Google Scholar]
5. Fergusson, J., Burgess, J. (1880). Cave temples of India. London: W. H. Allen & Co., Waterloo Place; TRUBNER & Co., Ludgate Hill, E. Stanford, Charing Cross; and W. Griggs, Hanover Street, Peckham. https://archive.org/details/dli.csl.7221/mode/2up. [Google Scholar]
6. Wani, V. M., Guide to kanheri caves. https://archive.org/details/guidetokanherica00wani/mode/2up. [Google Scholar]
7. https://www.zoom.co.jp/sites/default/files/products/downloads/pdfs/E_H3-VR_0.pdf. [Google Scholar]
8. https://www.facebook.com/groups/ZoomH3VR/permalink/1151120025247596/. [Google Scholar]
9. Rahman, A. (2016). PAIRS-Portable ambisonic impulse response system: An introduction to ambisonic impulse response recording. https://cnmat.berkeley.edu/projects/pairs. [Google Scholar]
10. Topa, M. D., Toma, N., Kirei, B. S., Sărăcuţ, I., Farina, A. (2012). Experimental acoustic evaluation of an auditorium. Advances in Acoustics and Vibration, 2012. DOI 10.1155/2012/868247. [Google Scholar] [CrossRef]
11. Rakerd, B., Hunter, E. J., Berardi, M., Bottalico, P. (2018). Assessing the acoustic characteristics of rooms: A tutorial with examples. Perspectives of the ASHA Special Interest Groups, 3(19), 8–24. DOI 10.1044/persp3.SIG19.8. [Google Scholar] [CrossRef]
12. Kuttruff, H. (2009). Room acoustics, 5th Ed. London: Spon Press. [Google Scholar]
13. Till, R. (2017). An archaeoacoustic study of the Ħal saflieni hypogeum on Malta. Antiquity, 91(355), 74–89. DOI 10.15184/aqy.2016.258. [Google Scholar] [CrossRef]
14. Kleiner, M., Klepper, D. L., Torres, R. R. (2014). Worship space acoustics. Second Indian Reprint. J Ross Publishing: USA/Cengage Learning, India. [Google Scholar]
15. Gonzalez, V. G. (2009). Acoustic study and conditioning for kirche Am hohenzollernplatz in Berlin (Doctoral dissertation (Ph.D. Thesis). Institut Fur Technische Akustik, Aachen, Germany. https://upcommons.upc.edu/bitstream/handle/2099.1/7582/Final%20Thesis.pdf;sequence=1. [Google Scholar]
16. https://www.acousticbulletin.com/room-acoustic-descriptors-rt-c50-and-gain. [Google Scholar]
 | This work is licensed under a Creative Commons Attribution 4.0 International License, which permits unrestricted use, distribution, and reproduction in any medium, provided the original work is properly cited. |