
 Submit a Paper
 Propose a Special lssue
 Open Access
ARTICLE

Modeling of Hydrogen Blending on the Leakage and Diffusion of Urban Buried Hydrogen-Enriched Natural Gas Pipeline
1 Beijing Key Laboratory of Process Fluid Filtration and Separation, College of Mechanical and Transportation Engineering, China University of Petroleum (Beijing), Beijing, 102249, China
2 School of Mechanical Engineering & Hydrogen Energy Research Centre, Beijing Institute of Petrochemical Technology, Beijing, 102617, China
* Corresponding Author: Jingfa Li. Email:
Computer Modeling in Engineering & Sciences 2023, 136(2), 1315-1337. https://doi.org/10.32604/cmes.2023.026035
Received 11 August 2022; Accepted 30 September 2022; Issue published 06 February 2023
 View Full Text
 Download PDF
Abstract
With the introduction of various carbon reduction policies around the world, hydrogen energy, as a kind of clean energy with zero carbon emission, has attracted much attention. The safe and economical transportation of hydrogen is of great significance to the development of hydrogen energy industries. Utilizing natural gas pipelines to transport hydrogen is considered to be an efficient and economical way. However, hydrogen has a higher risk of leakage due to its strong diffusion capacity and lower explosive limit than conventional natural gas. Therefore, it is of great significance to study the leakage and diffusion law of hydrogen-enriched natural gas (HENG) pipelines for the safe transportation of hydrogen energy. In this study, the leakage and diffusion characteristics of urban buried HENG pipelines are investigated numerically, and the dangerous degree of leakage is analyzed based on the time and area when the gas concentration reaches the lower explosive limit. The influences of hydrogen blending ratio (HBR), operating pressure, leakage hole size and direction, as well as soil type on the leakage and diffusion law of HENG are analyzed. Results show that the hydrogen mixing is not the key factor in increasing the degree of risk after gas leakage for urban buried HENG pipelines. When the HBR is 5%, 10%, 15% and 20%, the corresponding first dangerous time is 1053, 1041, 1019 and 998 s, respectively. This work is expected to provide a valuable reference for the safe operation and risk prevention of HENG pipelines in the future.Graphic Abstract
Keywords
As global warming is becoming serious, many countries have begun to introduce relevant policies to limit the emission of greenhouse gas. The development of clean energy has become an important issue facing the world’s energy industry [1,2]. As a kind of clean energy with zero carbon emission, hydrogen has attracted much attention in recent years [3–5]. However, the transportation of hydrogen seriously restricts its wide utilization. At present, the main delivery methods of hydrogen include road, rail, pipelines and ocean transportation in the form of gaseous hydrogen, cryogenic liquid hydrogen, and solid or liquid hydrogen carriers [6–11]. Among these methods, pipeline transportation is generally viewed as an effective way to achieve the large-scale and long-distance delivery of hydrogen. However, due to the flammable and explosive properties of hydrogen, some safety issues of hydrogen pipeline transportation must be considered.
There are two common ways for hydrogen delivery through pipelines, one is the pure hydrogen pipelines, and the other is mixing hydrogen into natural gas pipelines [12,13]. Considering the cost of the above two methods, the latter one that is blending a certain proportion of hydrogen into natural gas is a good choice in the transition period of hydrogen energy industry [14]. Transporting the hydrogen-enriched natural gas (HENG) to downstream users through existing natural gas pipelines can save the cost of new pipelines and related equipment [15,16]. However, the mixing of hydrogen can affect the mechanical properties of pipeline steels. For example, the welds can be subjected to hydrogen degradation and the various pipeline defects can be places of hydrogen accumulation which leads to hydrogen embrittlement of the pipe wall [17–25]. Compared with natural gas, hydrogen has a wider explosive limit, larger diffusion coefficient and lower ignition energy, which is more prone to explosion accidents once leakage occurs. Therefore, attention must be paid to the safe operation of HENG pipelines.
In recent years, there have been many studies on the risk assessment of oil and gas pipelines [26,27], among which pipeline leakage is one of the most critical research hotspots. Many scholars have carried out experimental studies on the leakage and diffusion of natural gas pipelines [28–30], in which the high-pressure gas cylinders were used to mimic the leakage process of natural gas pipelines and the sensors were placed in the soil to detect the leakage gas concentration. For example, Hideki et al. [28] conducted a full-scale experiment on buried natural gas pipeline leakage, it was found the molecular diffusion caused by the difference of gas density and concentration has a great influence on the gas leakage and diffusion, and the experimental results were in accord with Darcy’s law and Fick’s law. Bonnaud et al. [29] experimentally studied the influence of pipeline gas leakage on soil properties, and the effects of leakage surface, gas pressure, pipeline buried depth and water content on soil migration and crater formation were analyzed. Yan et al. [30] carried out leakage experiments with a mixture of 2.5% (volume fraction) of methane and 97.5% of air, and installed multiple combustible gas sensors around the leakage hole to monitor the variation of gas concentration around the soil over time.
With the development of computer technology, many scholars used numerical simulation methods to investigate the leakage law of buried natural gas pipelines and obtained abundant research results [31–34]. Compared with experimental study, the numerical simulation possesses the advantages of safety, high efficiency and flexible variable control, which is easier to analyze the law of gas leakage and diffusion under different working conditions. For instance, Wang et al. [31] adopted ANSYS Fluent to simulate the leakage process of buried natural gas pipelines, and analyzed the influence of different pipeline internal pressures, leakage hole sizes, leakage direction, soil properties and pipelines buried depth on the leakage characteristics. Results showed that the leakage hole size, leakage direction and internal pressure are the key factors affecting the leakage and diffusion processes. Amir et al. [32] established an accurate formula for calculation of leakage flow according to simulation results, which illustrated that the relationship between gas leakage flow and pipeline pressure, leakage hole size and the ratio of leakage hole size to pipeline diameter was linear, second-order and fourth-order, respectively, and the error between mathematical model and simulation results was within 7%. Javad et al. [33] adopted finite element methods to simulate the leakage process of buried natural gas pipelines, in which the soil anisotropy was taken into account and the water content of each soil layer was supposed to be variable. The influence of soil mechanical and hydraulic properties on gas diffusion was analyzed, and the relationship between leakage flow rate and pipeline pressure and leakage hole diameter was derived. Liu et al. [34] established a mathematical model to estimate the leakage rate of buried natural gas leakage through experiments and CFD simulation. From the above analysis, it can be seen that scholars have used different numerical methods or established a series of models to describe and study the leakage process of natural gas, including the detection and positioning of leakage points [35,36] and the calculation of leakage flow [37,38], etc.
Although there are a lot of studies focusing on the leakage of buried natural gas pipelines, the research on the leakage of HENG pipelines is still rarely reported in the literature. Compared with traditional natural gas pipelines, HENG pipelines are more prone to leakage risk due to the embrittlement effect of hydrogen on pipeline steels. In addition, hydrogen has the characteristics of low explosive limit, high flame temperature and fast flame propagation speed, so once an explosion occurs, its destructive power will be far more than that of traditional natural gas. Therefore, it is of great significance to study the leakage and diffusion of HENG to ensure the safe transportation of hydrogen energy. In this study, the risk increase caused by the blending of hydrogen was quantitatively analyzed by using parameters, such as dangerous time and dangerous distance, which makes up the gap in the safety of hydrogen transportation in pipelines at present. As urban gas pipelines are usually located in areas with high population density, once the leakage occurs, it will cause more serious consequences. Thus, in this study, the urban buried HENG pipelines are taken as the research object. Compared with long-distance pipelines, urban natural gas pipelines are usually characterized by small diameters and low pressure.
This study mainly focuses on the common small hole leakage of buried pipelines, in which the leakage and diffusion processes of HENG in the soil are considered, and the leakage and diffusion of gas in the air after spilling from the soil are ignored. The reason is that the urban natural gas pipelines are generally laid under roads. As roads are generally covered with asphalt, the leakage gas is usually hard to escape from the ground surface in large quantities. Moreover, due to the strong diffusion effect of hydrogen, the leakage gas generally diffuses into the atmosphere quickly, and it is difficult to be accumulated in air. Therefore, the diffusion process of HENG in air is not the focus in this work. As shown in Fig. 1, the leakage area is simplified into a rectangular area of 4 m × 4 m × 2.5 m. The pipeline is located in the center of the area, the diameter and depth of the pipeline are 100 and 1.5 m, respectively, and the leakage hole is a circular hole located in the center of the pipeline.
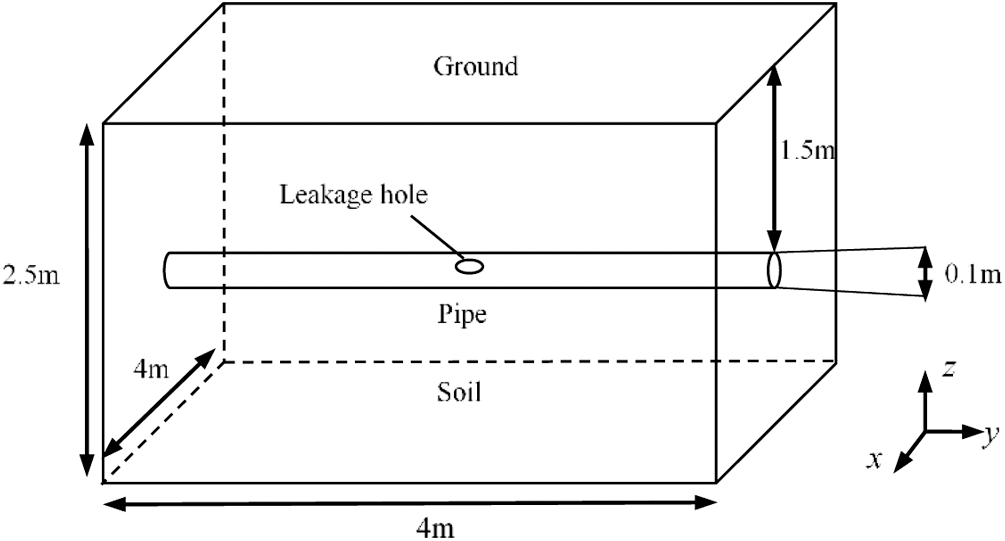
Figure 1: Schematic diagram of the physical model
The following hypotheses are made to simplify the model and calculation: (1) The leakage gas mixture is an ideal gas, the heat transfer between gas and soil is ignored and only the mass transfer is considered; (2) The soil is isotropic and evenly distributed, and the soil structure does not change during the gas leakage process; (3) The operating pressure of the pipeline is constant during the gas leakage process; (4) There is no moisture in the soil, and the soil pore is fully filled with air.
Based on above assumptions, the leakage mathematical model of urban buried HENG pipelines includes mass conservation equation, momentum conservation equation, species transport equation and turbulence model.
(1) Mass conservation equation,
(2) Momentum conservation equation [39],
where the first term at the right-hand side of the equation is the viscous loss term, and the second term denotes the inertia loss term. Dij and Cij are the specified matrices.
For simple and uniform porous media, Eq. (3) can be simplified as,
where 1/a is the viscous resistance coefficient, 1/m2; C2 is the inertial resistance coefficient, 1/m.
To obtain the 1/a and the C2 in Eq. (4), the Ergun equation should be solved simultaneously [40]. Ergun equation is a semi-empirical formula applicable to a wide range of Reynolds number and a variety of filler, which can be written as,
where Dp is the average diameter of porous medium particles, mm; The formulas for calculating the resistance coefficient and the inertial resistance coefficient are described by,
The leakage and diffusion of HENG is a multi-component fluid flow process, for the mass transfer process, it can be described by the species transport equation.
(3) Species transport equation,
where c is the mass concentration of gas; D is the diffusion coefficient, m2/s.
The process of gas leakage from the pipeline at a certain pressure can be regarded as a high-speed jet. Thus, the k-ε model is used to describe the turbulence process in this study.
(4) The k-ε turbulence model,
In this study, the ICEM 2020R1 is used to discretize the computational domain of the buried pipeline. The structured grid is adopted in this study, which has better computational efficiency and grid quality than unstructured grids. In addition, an O-grid mesh is used in the area of leakage hole and the pipeline cross section to better deal with the irregular geometry [41], and the fine mesh is adopted at the leakage hole, as shown in Fig. 2.
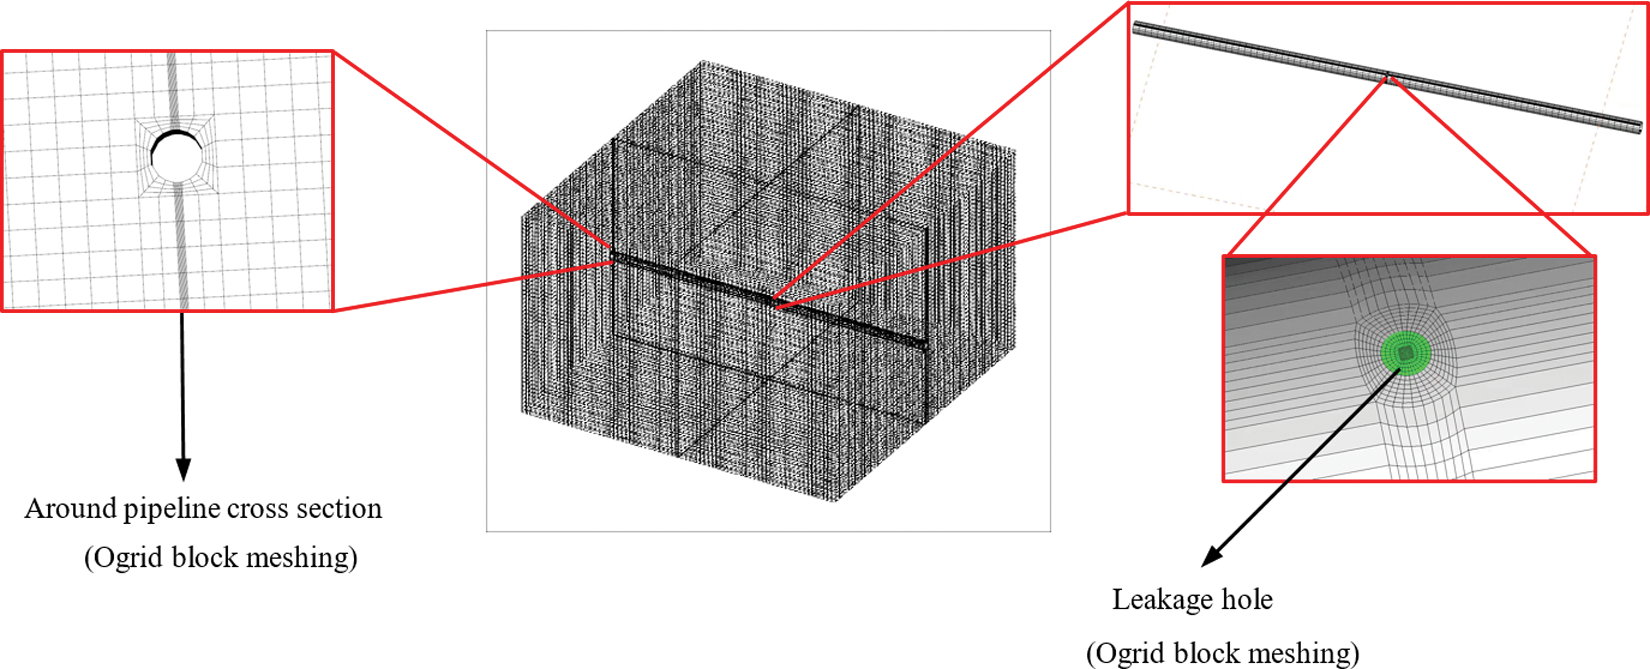
Figure 2: Schematic diagram of meshing
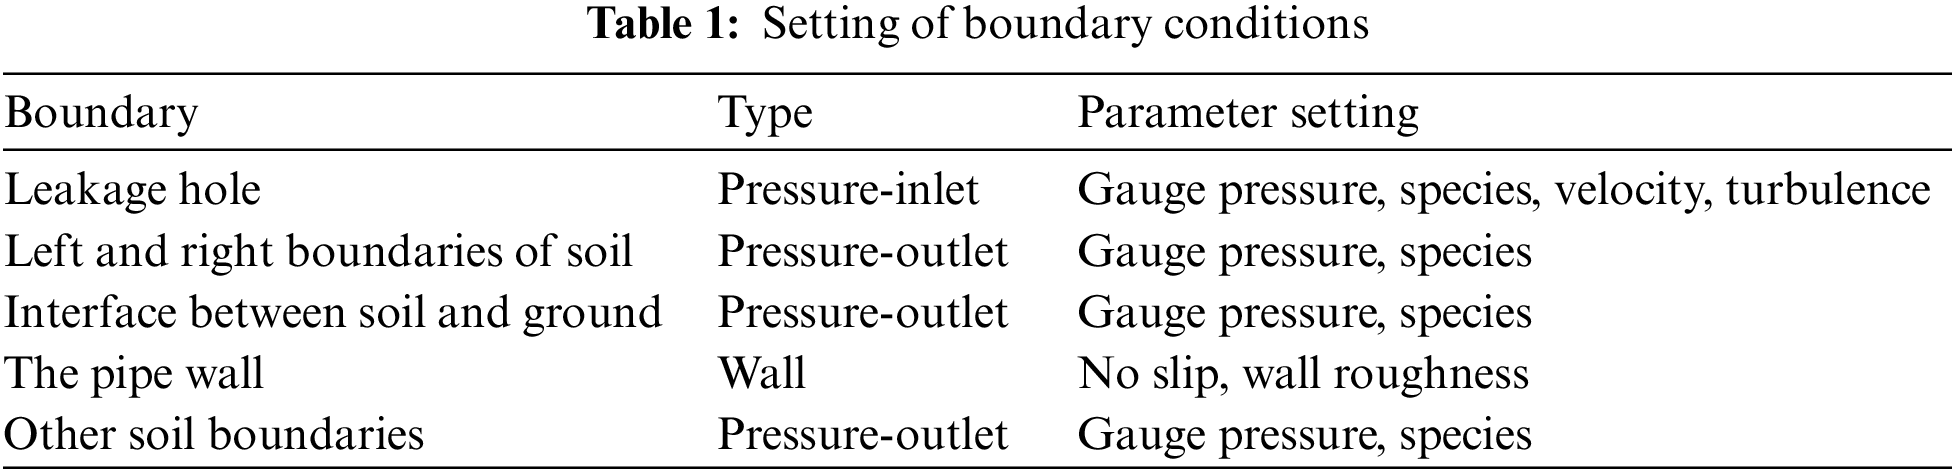
3.2 Boundary Conditions and Solution Methods
In ANSYS Fluent software, the setting of boundary conditions is shown in Table 1. At the initial moment, the soil pore is considered to be fully filled with air, and the initial leakage rate and concentration of HENG are both set as 0 in soil, and the initial pressure is set as the atmospheric pressure.
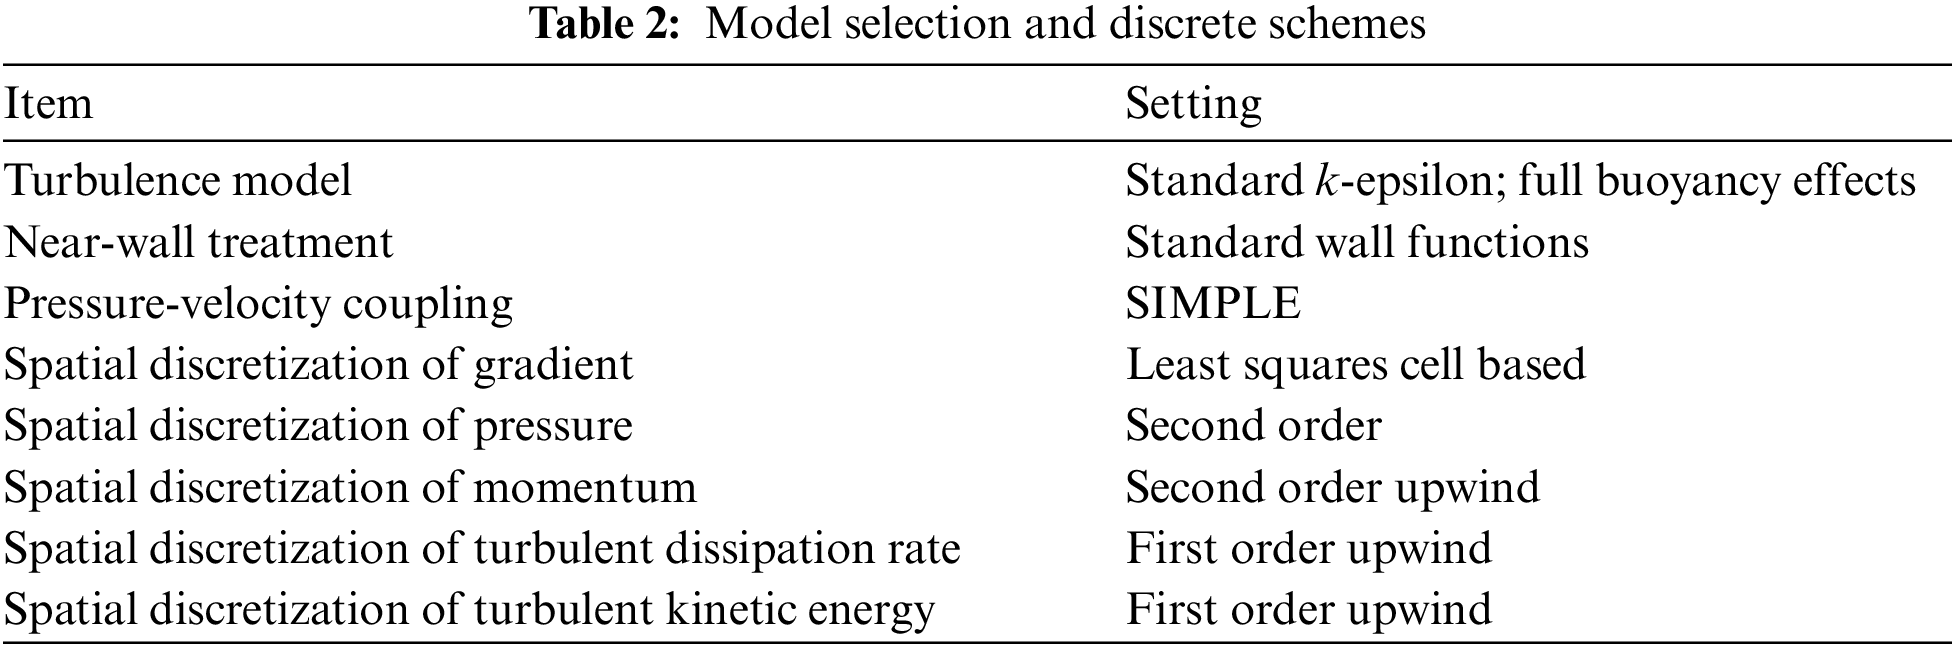
The finite volume method is used to discretize the governing equations, and the pressure and velocity coupling is handled with SIMPLE algorithm (Semi-Implicit Method for Pressure-Linked Equation). The selected models and discrete schemes are shown in Table 2.
To quantitatively analyze the concentration variation of leaked HENG around the soil in the leakage and diffusion processes of pipeline, 10 monitoring points are set around the leakage hole. The coordinate origin is located in the center of the whole computational domain, and the location and the distribution of monitoring points (red points) are presented in Table 3 and Fig. 3, respectively.
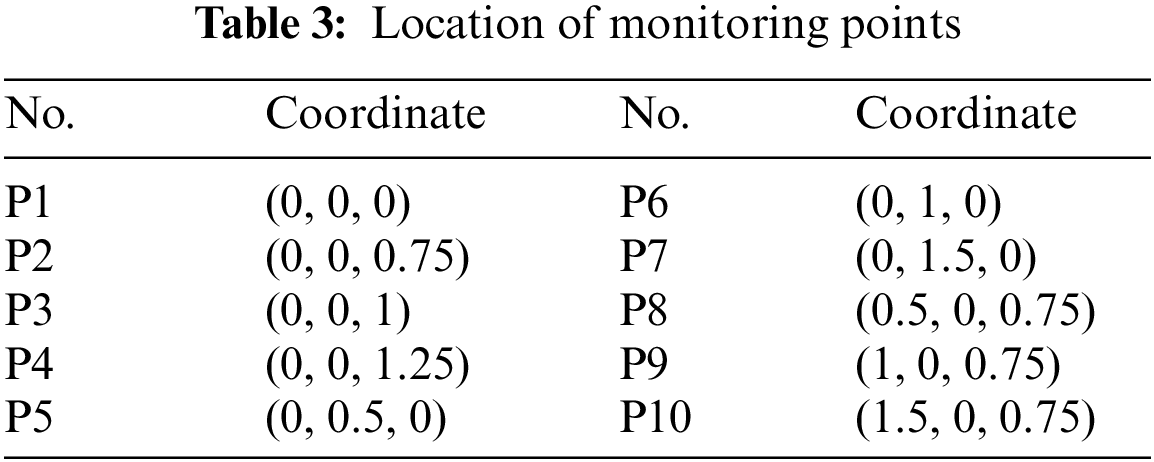
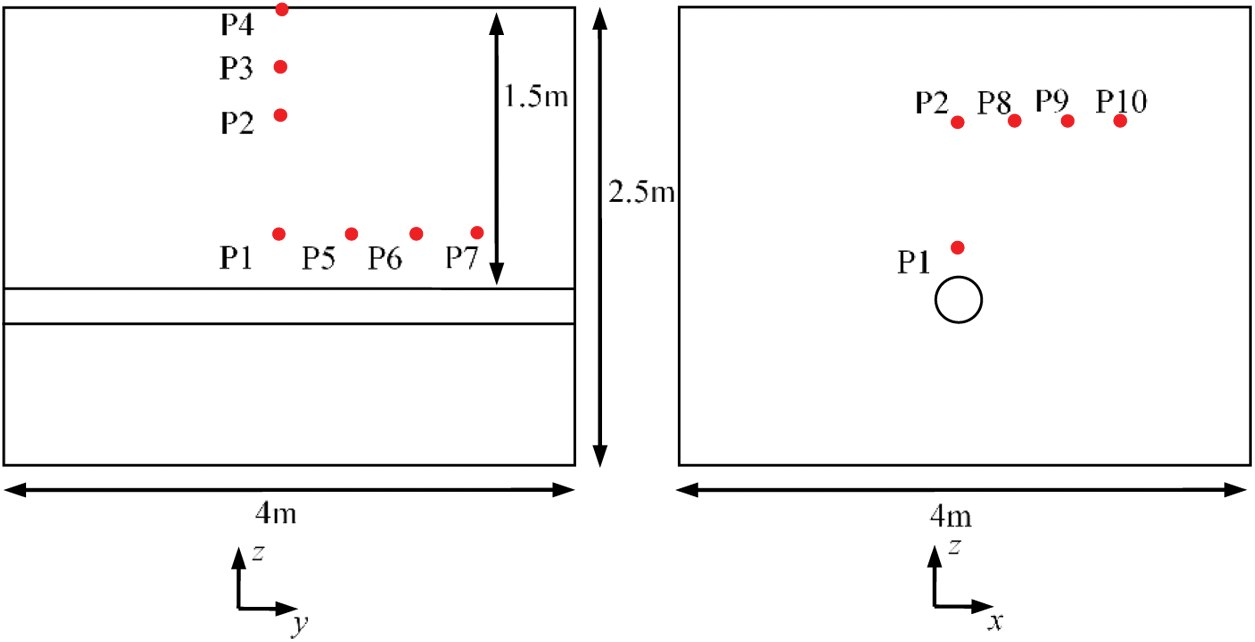
Figure 3: Distribution of monitoring points
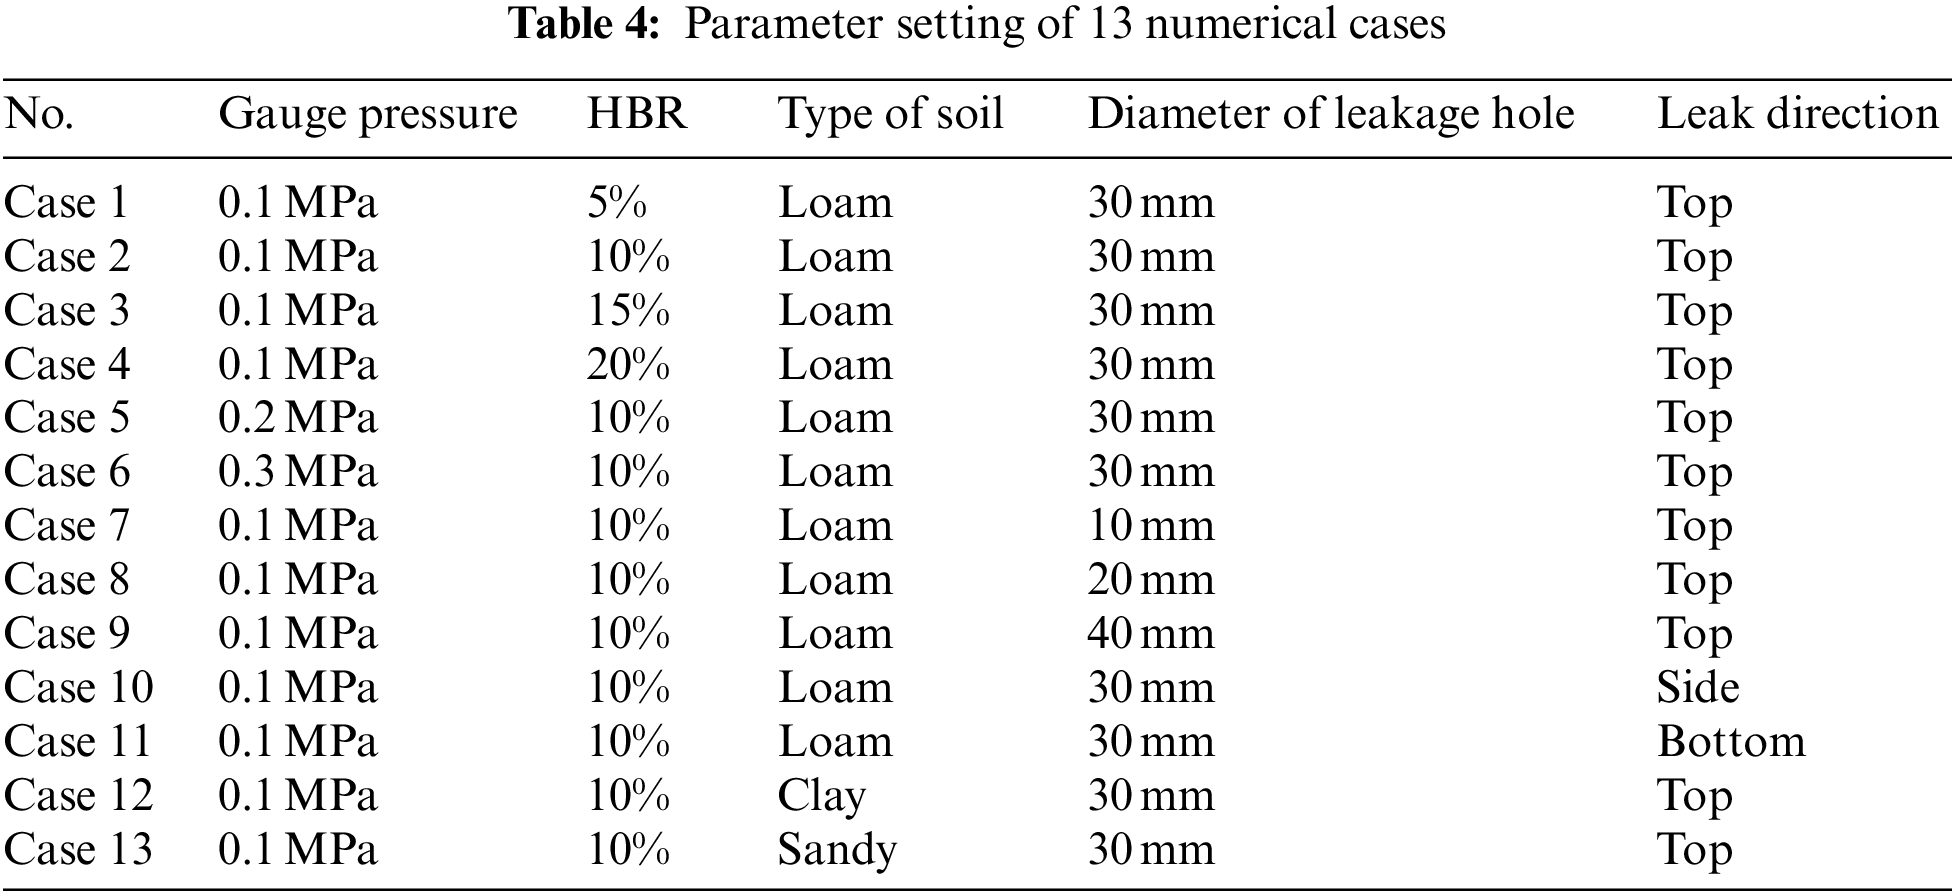
To analyze the effects of influencing factors such as pipeline operating pressure, HBR, soil type, leakage hole diameter and leakage direction on the leakage and diffusion law of HENG, 13 groups of numerical cases are designed and presented in Table 4.
4.1 Validation of Grid-Independent Solution
The grid number has an important influence on calculation results. Generally sparse meshes cannot guarantee high numerical accuracy, while too fine meshes can increase the computational burden. To obtain grid-independent solutions, the leakage gas concentration at P1 point is monitored in four grid numbers of 132060, 180435, 261030 and 321694, as shown in Fig. 4. It can be seen that with the increase of grid number, the curves of monitored gas concentration with leakage time are getting closer with each other. When the grid number of 261030 is used, the calculation result is almost the same as that of 321694, thus 261030 grids are adopted in this study.
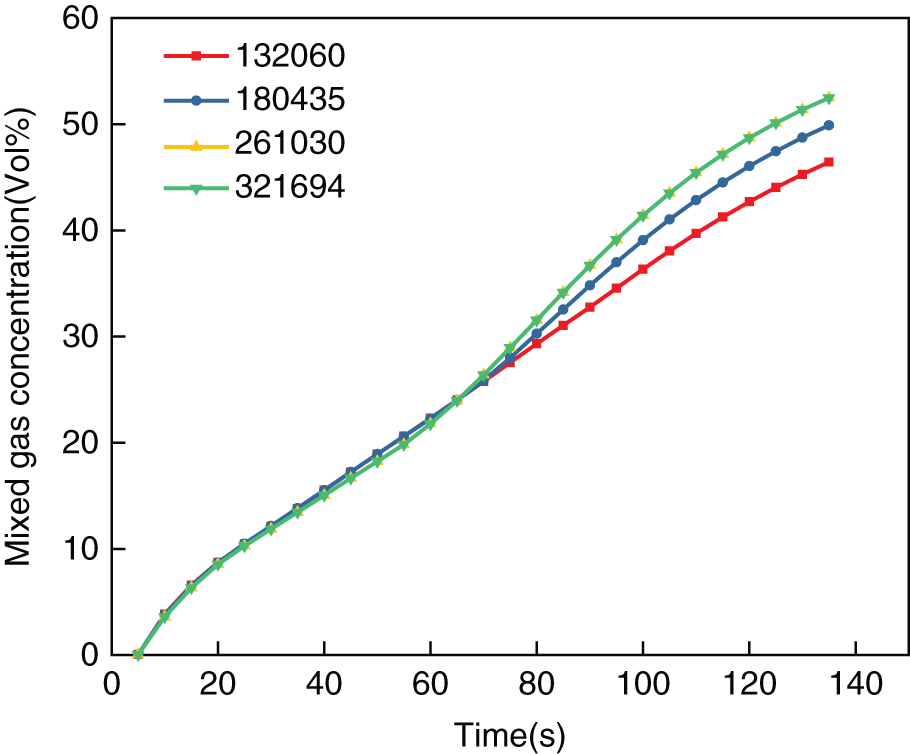
Figure 4: Validation of grid-independent solution
4.2 Validation of Mathematical Model
Yan et al. [30] conducted a concentration detection experiment of gas leakage from a buried pipeline in 2015, which was carried out in a 5 m × 5 m × 3 m earthen tank. Gas concentration sensors were installed in multiple positions inside the earthen tank to detect the concentration of leakage gas. To validate the mathematical model established in this study, the numerical simulation is conducted to mimic the experiment. The comparison between experimental data and simulation results under the same condition is shown in Fig. 5.
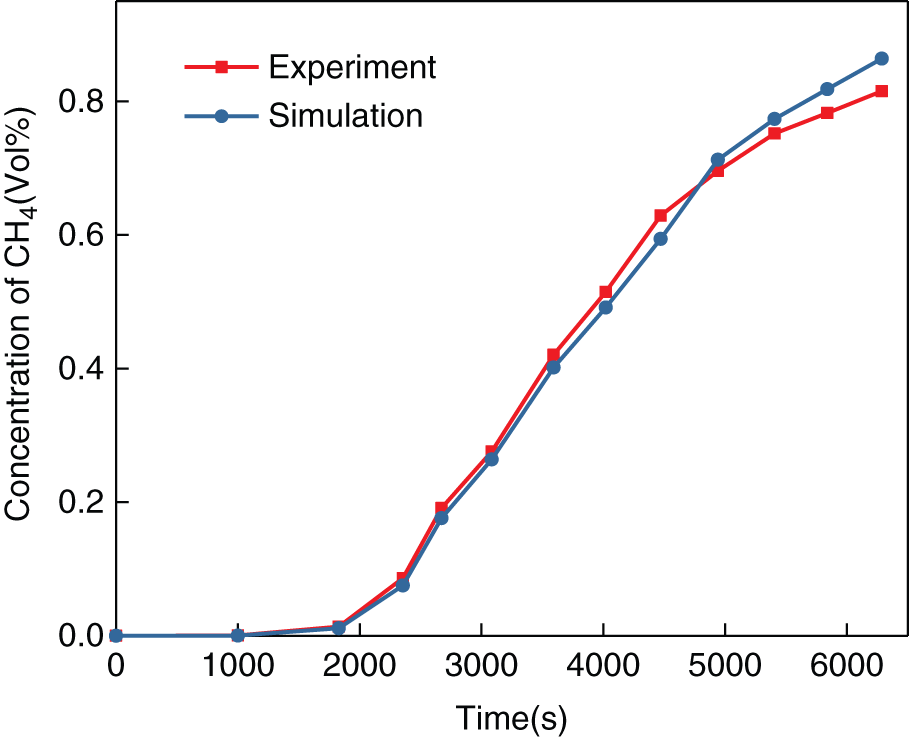
Figure 5: Model validation by experiment
It is worth noting that in this experiment, 2.5% (volume fraction) methane and 97.5% air were mixed to ensure experimental safety, and only methane concentration was detected. As the volume fraction of methane is low, the concentration variation can only be observed after a relatively long experiment time, as shown in Fig. 5 that the methane concentration is only about 0.8% at t = 6000 s. It is also obvious to see that the predicted methane concentration by the established model in this study agrees well with the methane concentration measured in Yan’s experiment, indicating that the established mathematical model is reliable.
5 Analysis of Leakage and Diffusion Processes
5.1 Leakage and Diffusion Processes
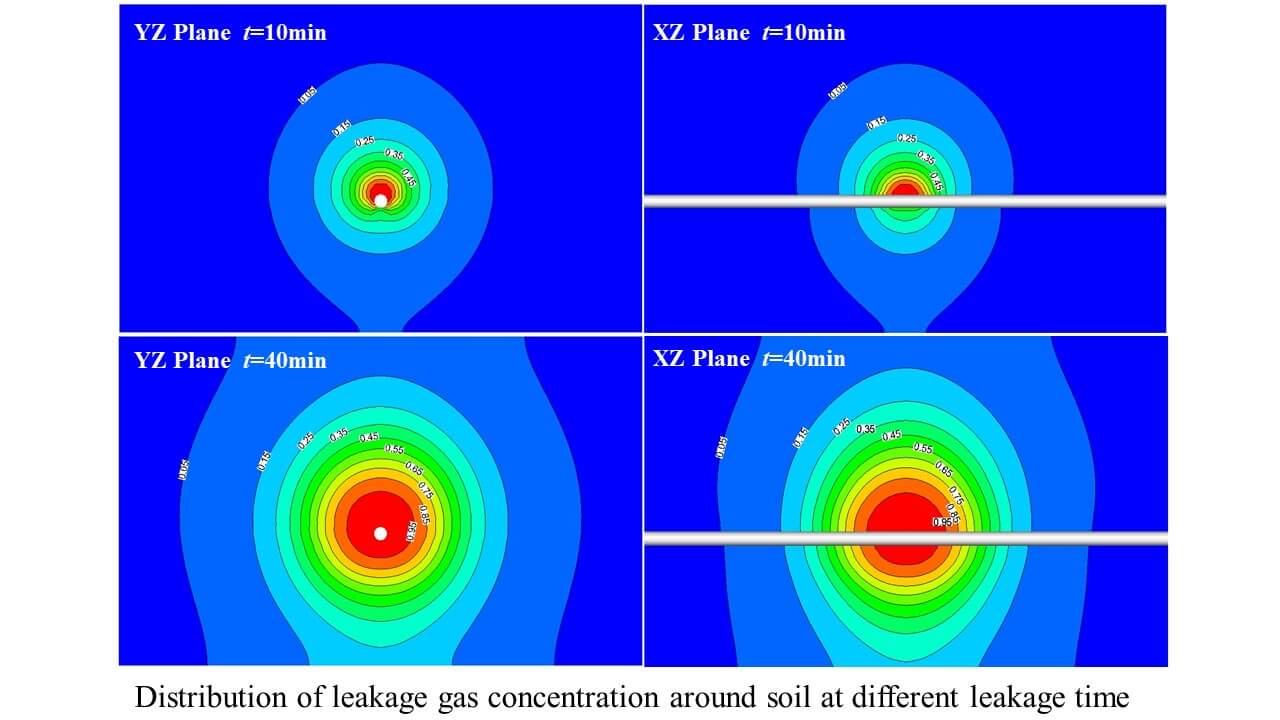
In this part, firstly the case 2 is taken as an example to show the variation of HENG concentration over time in leakage and diffusion processes through 2D slices, as shown in Fig. 6. The slice is located at the center of the computational domain and is parallel to the x and y axes, respectively. As can be seen from Fig. 6, at the beginning of leakage process, the leakage gas diffuses into soil under the influence of pressure and concentration difference, and the concentration of leakage gas around the leakage point increases rapidly, and the whole leakage and diffusion area shows a spherical distribution. It can also be noted that there exists a high concentration area (red area with volume fraction > 0.95) around the leakage hole. The size of high concentration area increases significantly within t = 40 min after the leakage occurs, and changes slightly after 40 min. There is also risk in the periphery of the spill area (the light blue part with volume fraction > 0.05), the leakage gas concentration in this area is larger than the lower explosive limit (LEL) of pure methane, and thus it is also larger than the LEL of HENG. The area continues to increase with the leakage time and the dangerous area spreads to the surface at t = 20 min, and the whole computational domain reaches the dangerous concentration at t = 80 min.
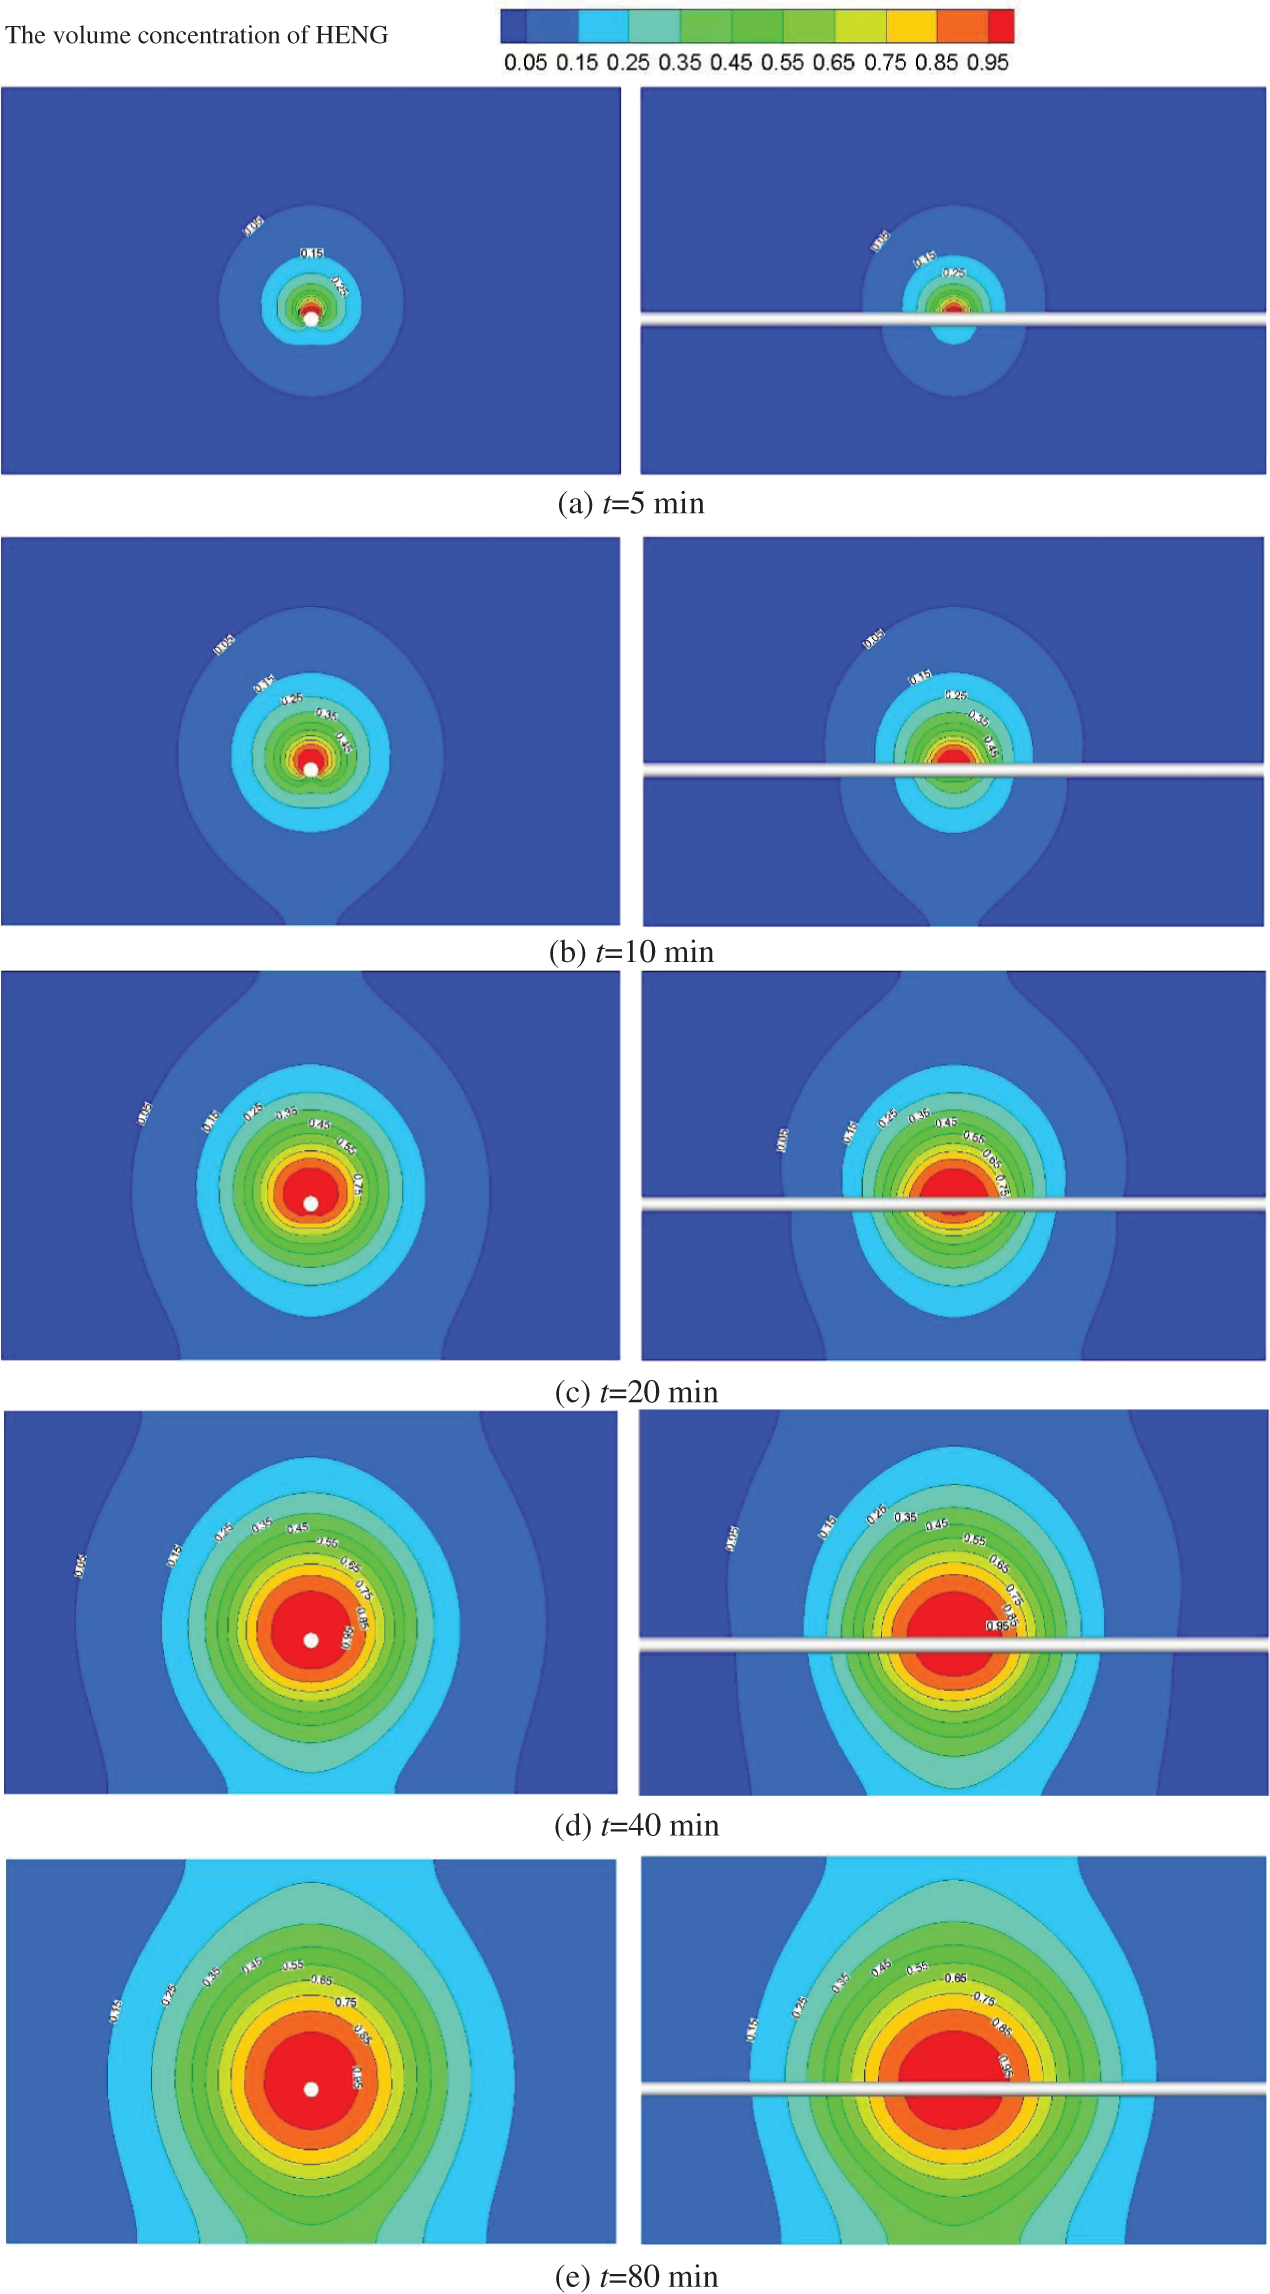
Figure 6: Distribution of leakage gas concentration around soil at different leakage time
Fig. 7 demonstrates the streamline of the leakage gas flow at t = 80 min. Due to the isotropy of soil, the streamline of the leakage gas is uniform and stable, and the leakage gas flows out perpendicular to the boundary. After the pipeline leakage, the HENG will spread evenly around. At the boundary, the gas flows freely and the streamlines are almost perpendicular to the soil boundary.
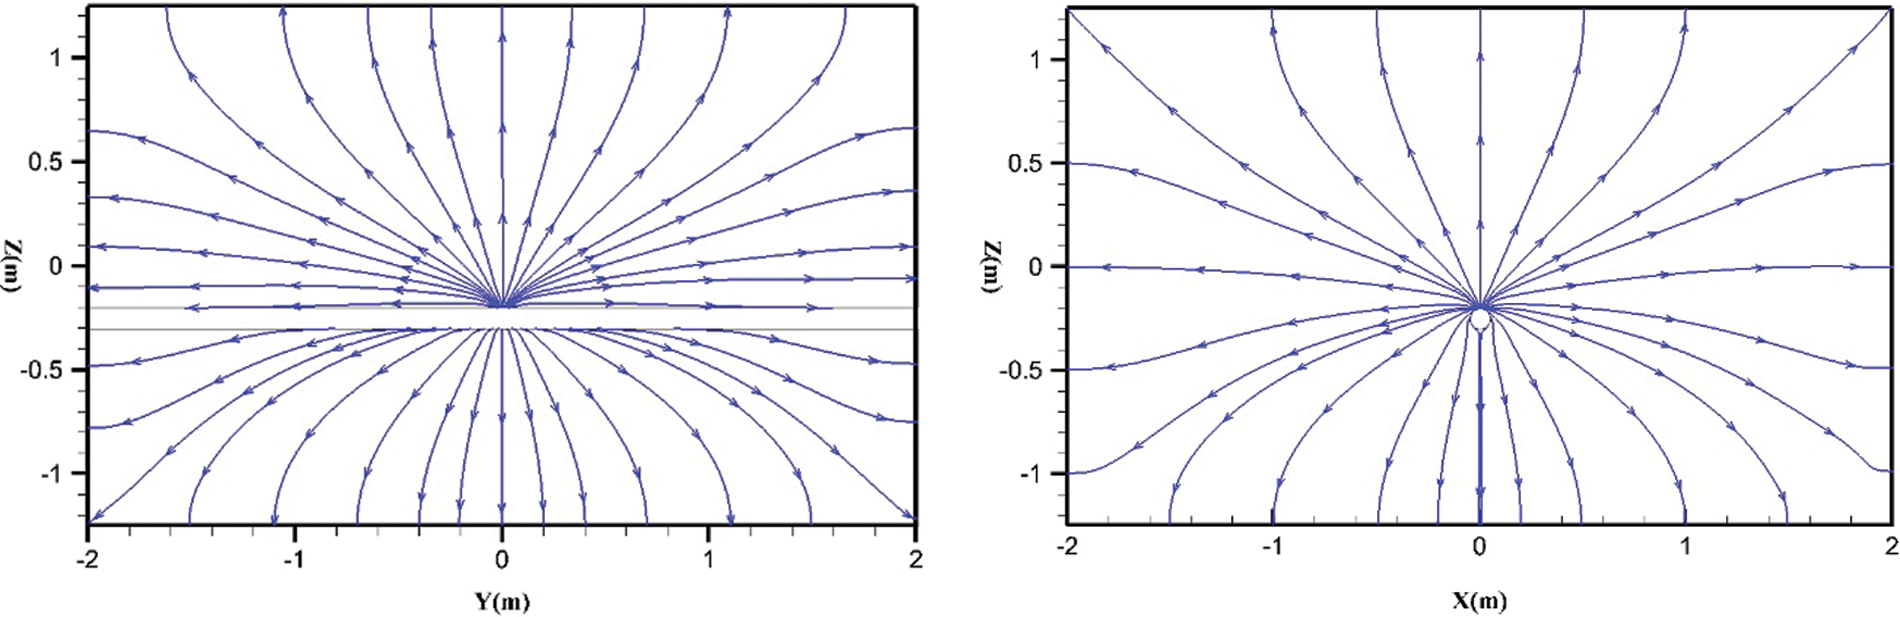
Figure 7: Streamlines distribution of leakage gas on the slices
5.2 Variation of Leakage Gas Concentration at Different Positions
Fig. 8 shows the concentration change of leakage gas measured at 10 monitoring points in case 2 with time. It can be seen that the location closer to the leakage hole has a higher gas concentration, and the time for the leakage gas concentration to reach equilibrium is much shorter. It takes about 2000 s for the concentration of leakage gas measured at P1 to reach equilibrium and stabilize at about 98%, and the other monitoring points will take much longer time to reach an equilibrium state. Because the diffusion of leakage gas is uniform, the variation trend of leakage gas concentration along x, y, and z directions is basically the same.
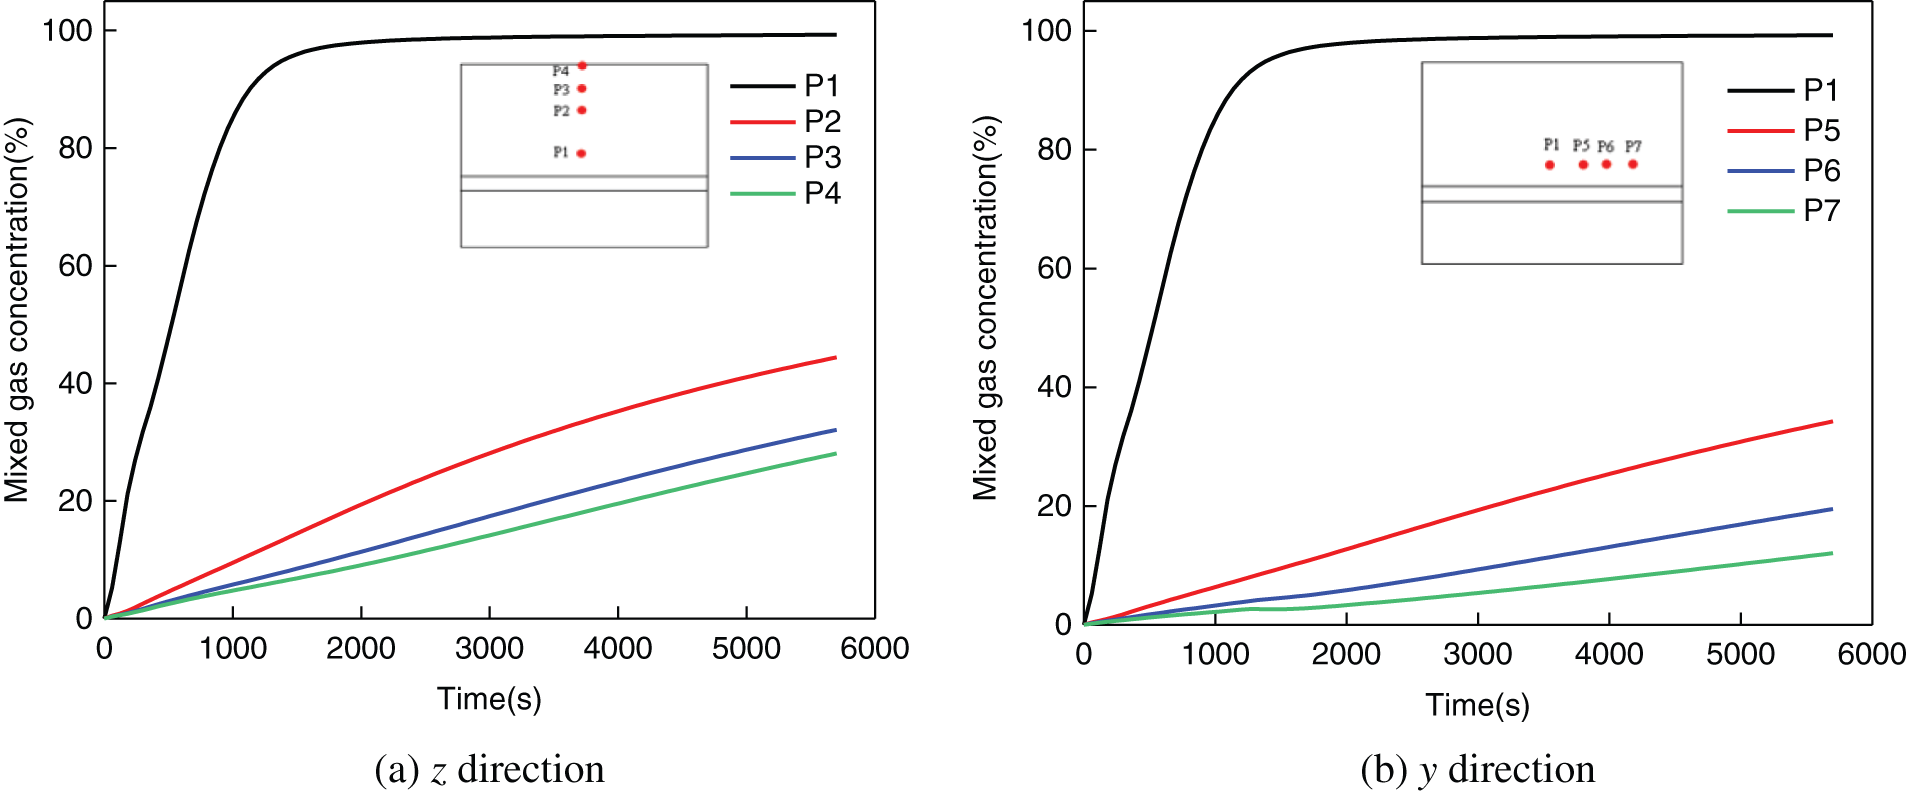
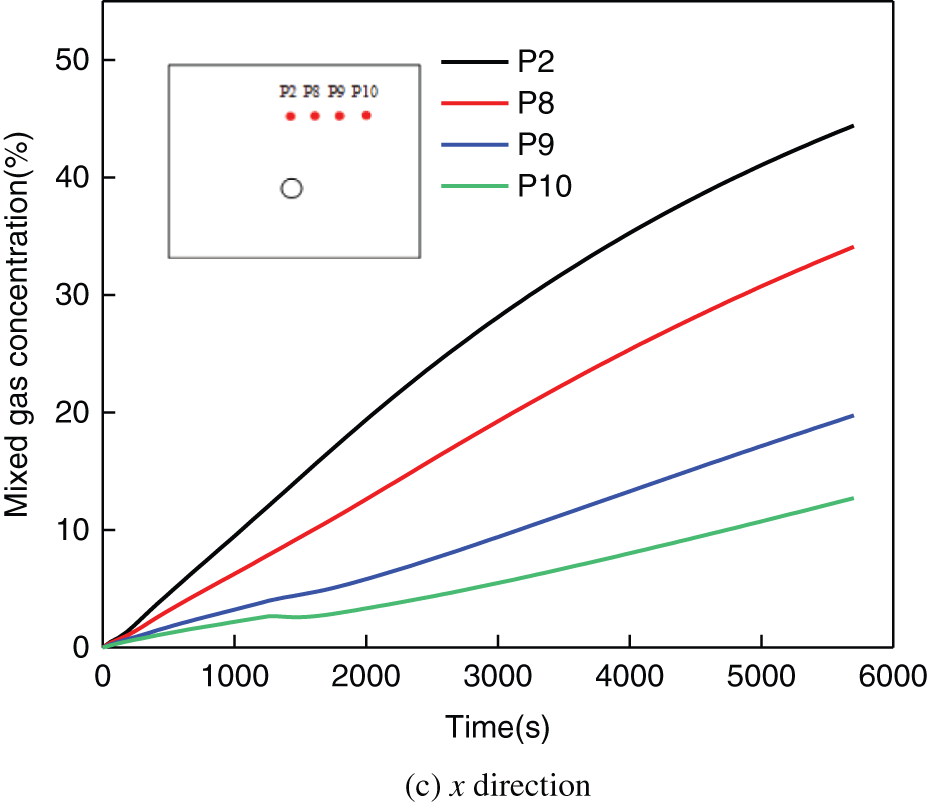
Figure 8: Variation of leakage gas concentration at monitoring points over time
6 Analysis of Leakage Consequence
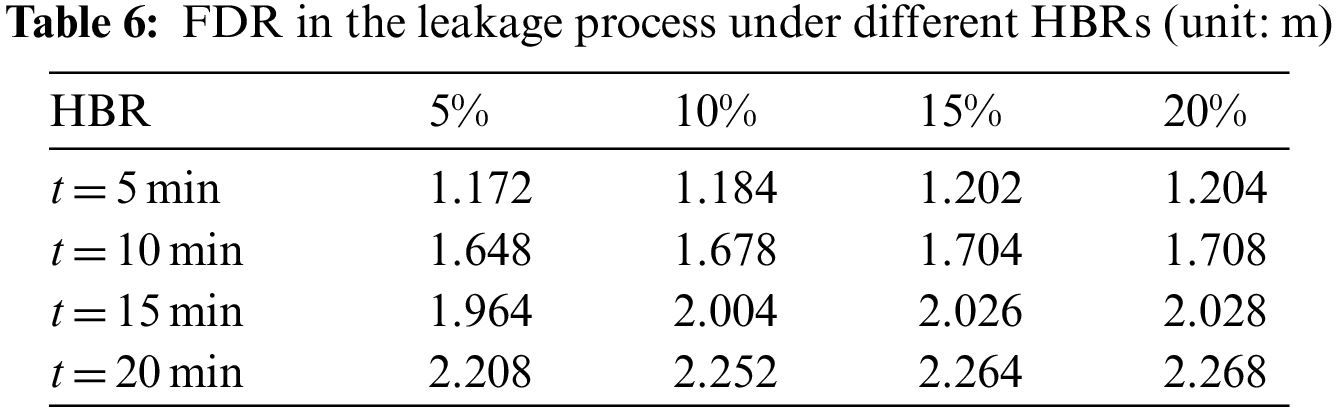
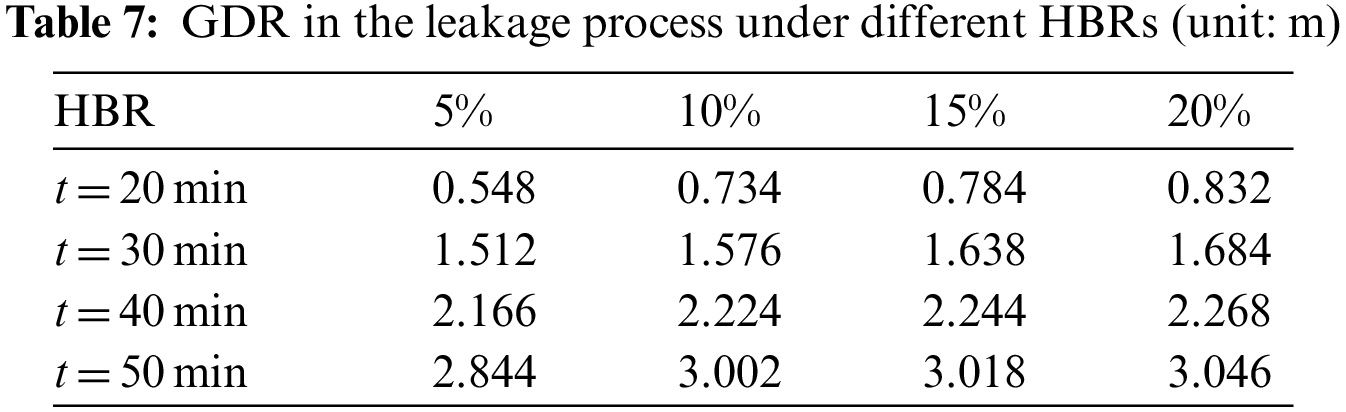
To quantitatively describe the degree of risk of flammable gas leakage and diffusion in soil, Bu et al. [42] defined three parameters: the first dangerous time (FDT), the farthest dangerous range (FDR) and the ground dangerous range (GDR). Wherein, FDT represents the time required for the gas concentration at the ground surface directly above the leakage hole to reach the LEL. At this time, once there is an ignition source at the ground surface, the leakage gas will be ignited and cause explosion risk. FDR denotes the farthest distance that the gas cloud with a concentration above the LEL can diffuse along the pipeline. GDR stands for the maximum extent that the gas cloud at the ground surface can diffuse. It is obvious that both FDR and GDR are time-dependent parameters.
6.1 Analysis of Leakage Consequence under Different HBRs
Hydrogen blending ratio (HBR) has significant impacts on the leakage and diffusion of HENG. However, the determination of HBR is restricted by many factors and the upper limit of HBR is different in various countries [43]. In this study, the volume fraction (also mole fraction) of 20% is taken as the upper limit of HBR. Taking cases 1∼4 as examples, the leakage and diffusion of pipeline when HBR is 5%, 10%, 15% and 20% is studied, respectively.
To analyze the influence of HBR on leakage risk, the Le Chatelier law [44,45] expressed by Eq. (11) is applied to calculate the explosive limit of HENG under different HBRs. The calculation results are shown in Table 5.
where LELmix is the LEL of mixed gas; LELi is the LEL of gas component i; yi is the volume fraction of gas component i.
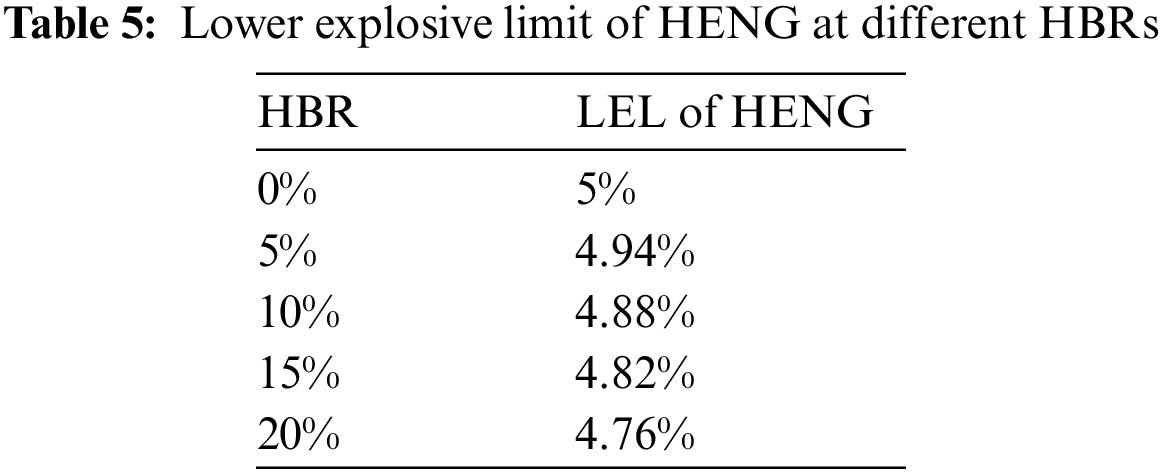
Since the monitoring point P4 is at the ground surface and directly above the leakage hole of the pipeline, the leakage time of P4 when the concentration of mixed gas reaches the LEL is FDT. Fig. 9 shows the concentration variation of methane, hydrogen and mixed gas with time under different HBRs. It can be seen that when the HBR is 5%, 10%, 15% and 20%, the corresponding FDT is 1053, 1041, 1019 and 998 s, respectively. The reason can be attributed to that the increase of HBR leads to the decrease of LEL of mixed gas, and the mixed gas concentration at P4 remains unchanged under the same pipeline pressure, thus the FDT is shortened. Therefore, the increase of HBR will lead to the increase of explosion risk after leakage diffusion, which is another key factor limiting HBR after the embrittlement of pipelines and the deterioration of ignition performance of the terminal stove.
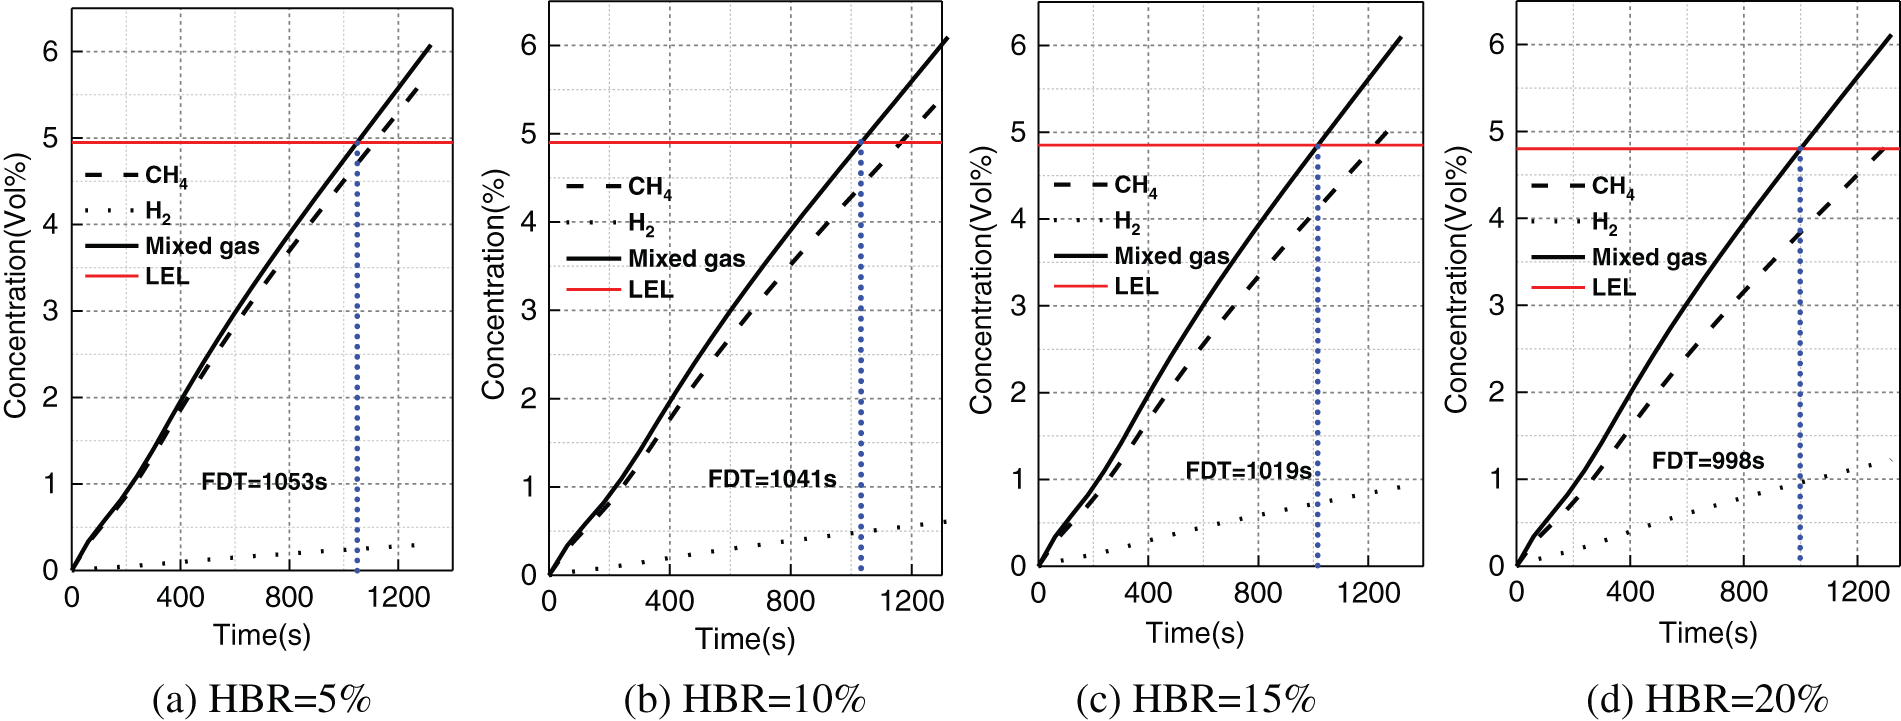
Figure 9: Variation of mixed gas concentration at P4 under different HBRs
Tables 6 and 7 display the FDR and GDR at different HBRs and leakage time. It can be clearly seen that the FDR and GDR increase with the rise of the HBR and leakage time. There are two main reasons for this phenomenon. First, the increase of HBR leads to the decrease of LEL, and the dangerous concentration can be reached at a relatively low concentration of mixed gas. Second, the diffusion of hydrogen in the soil is stronger, and its diffusion range is larger at the same time. These two reasons aggravate the development of combustible gas cloud, resulting in the increase of FDR and GDR.
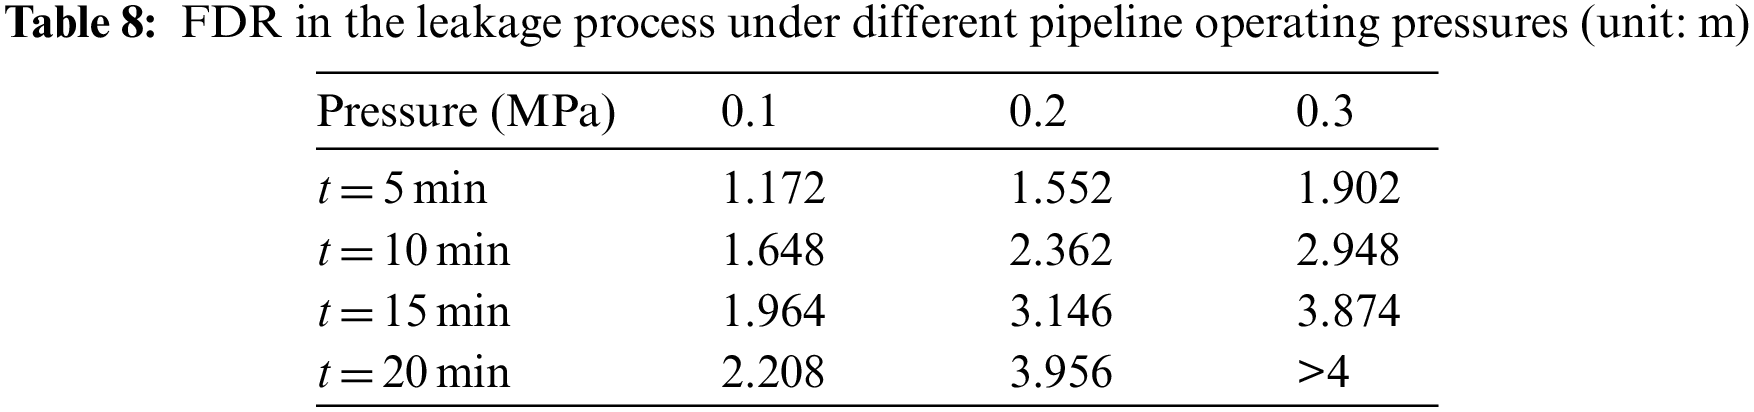
6.2 Analysis of Leakage Consequence under Different Operating Pressures
In this part, the consequences of HENG leakage under different pipeline operating pressures are analyzed by cases 2 (0.1 MPa), 5 (0.2 MPa) and 6 (0.3 MPa). Fig. 10 shows the change of leakage gas concentration with time under different pipeline operating pressures, and depicts the FDT under different pressures. As can be seen from Fig. 10, when the operating pressure is 0.1, 0.2 and 0.3 MPa, the corresponding FDT is 1041, 498 and 361 s, respectively. The increase in pipeline operating pressure will increase the gas leakage rate, and the gas diffusion rate in the soil will also be faster, so the LEL is reached in a shorter time. Tables 8 and 9 respectively present the FDR and GDR in the leakage process under different pipeline operating pressures and leakage time. As the simulated computational domain is limited, the value larger than 4 m is marked as “> 4 m” in these two tables. It can be observed that both FDR and GDR increase with the rise of pipeline operating pressure at any time. The main reason lies in that with the increase of pipeline operating pressure, the gas leakage rate will increase significantly, resulting in the increase of gas cloud diffusion area at the same time.
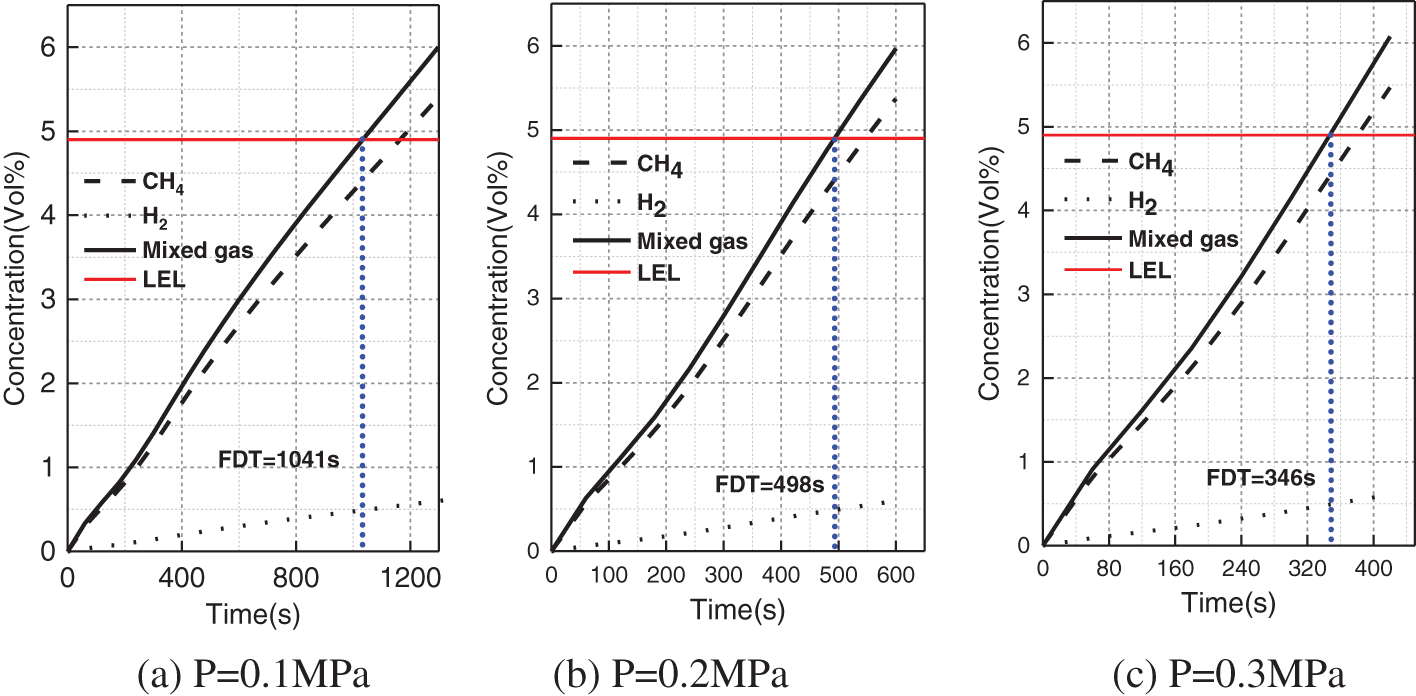
Figure 10: Variation of mixed gas concentration at P4 under different pipeline operating pressures
6.3 Analysis of Leakage Consequence under Different Leakage Hole Diameters
Taking cases 2, 7, 8 and 9 as examples, the leakage consequences of HENG with leakage hole diameters of 10, 20, 30 and 40 mm respectively are analyzed and discussed in this part. Fig. 11 shows the change of mixed gas concentration with time under different diameters of leakage hole. It can be seen that when the diameter of leakage hole is 10, 20, 30 and 40 mm, the corresponding FDT is 4981, 1876, 1041 and 618 s, respectively. Under the same pipeline pressure, the increase of leakage hole size will increase the leakage flow rate, which leads to the decrease of FDT at P4. Tables 10 and 11 respectively present the FDR and GDR values in the leakage process. It is found that both the FDR and GDR increase with the rise of the leakage hole diameter and leakage time. This is because that the increase of the leakage hole diameter can lead to the increase of the leakage flow, thus the gas cloud of the leakage gas increases at the same time, and both FDR and GDR increase.
Figure 11: Variation of mixed gas concentration at P4 under different leakage hole diameters
6.4 Analysis of Leakage Consequence under Different Leakage Directions
In this part, the influence of leakage direction on the leakage consequence of HENG is analyzed by cases 2, 10 and 11, where the leakage hole is located directly above, on the horizontal side and directly below the pipeline, respectively. Fig. 12 shows the distribution of mixed gas concentration in x-z plane of the three cases at the leakage time 30 min.
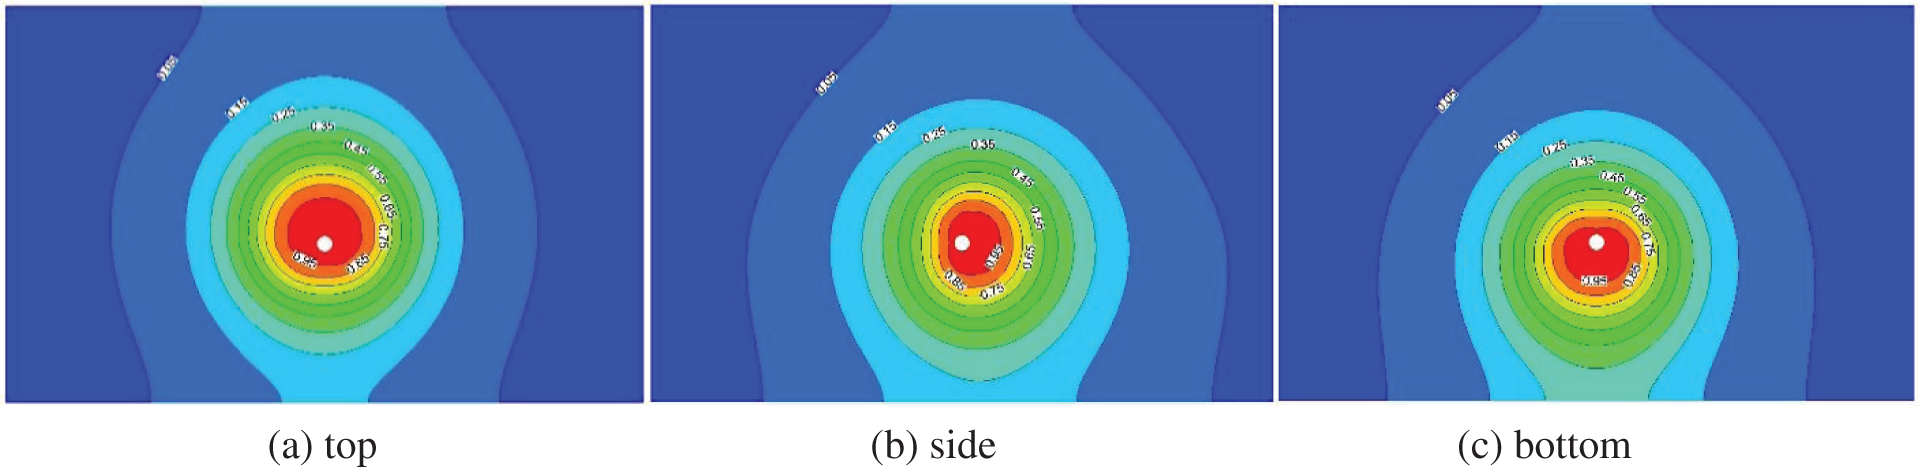
Figure 12: Distribution of mixed gas concentration under different leakage directions
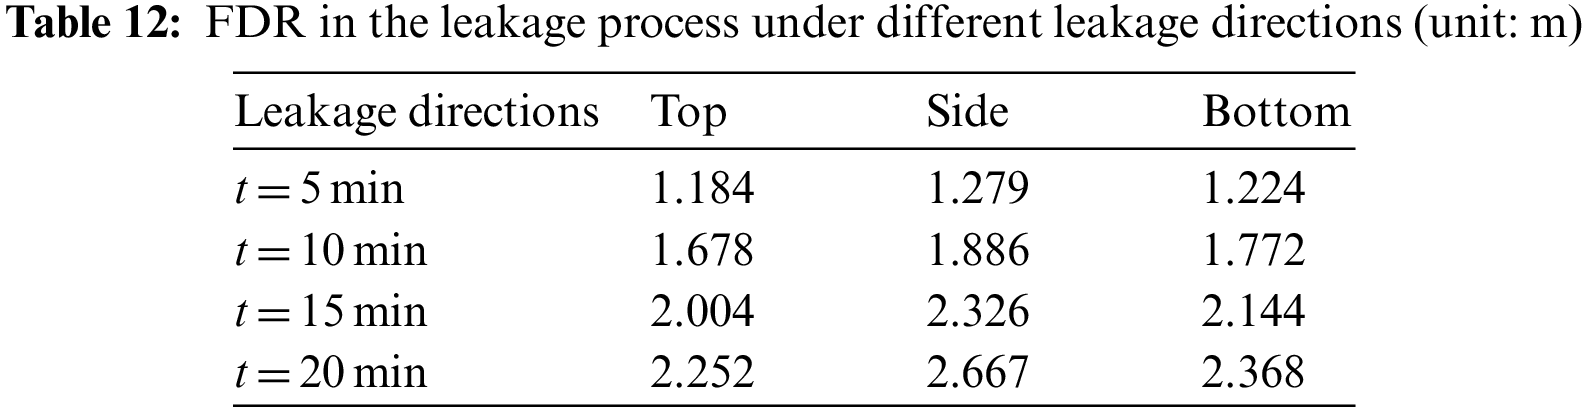
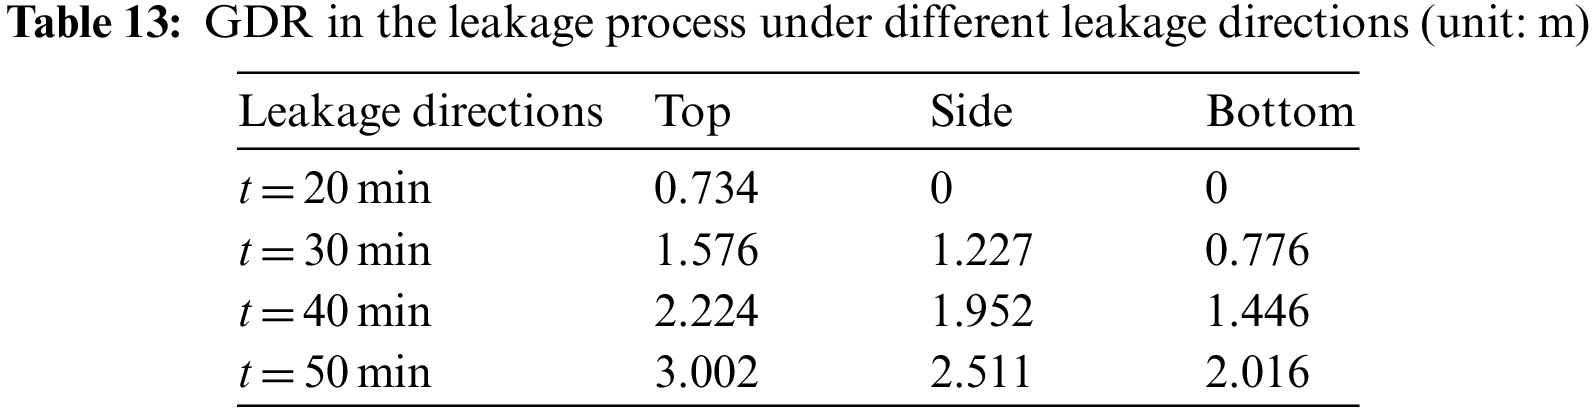
Fig. 13 demonstrates the change of leakage gas concentration detected at monitoring point P4 in cases 2, 10 and 11 with time. It is found that when the leakage hole is located directly above, horizontally and directly below the pipeline, the corresponding FDT is 1041, 1442 and 1558 s, respectively. Tables 12 and 13 present the FDR and GDR values under different leakage directions. It indicates that the FDR value is the largest when the leakage hole is located on the horizontal side of pipeline. Because when the leakage hole is located on the horizontal side, the diffusion of leakage gas along the pipeline will be intensified. For GDR, the value is the largest when the leakage hole is vertically upward, this is because the leakage gas can diffuse quickly to the ground surface to form gas clouds.
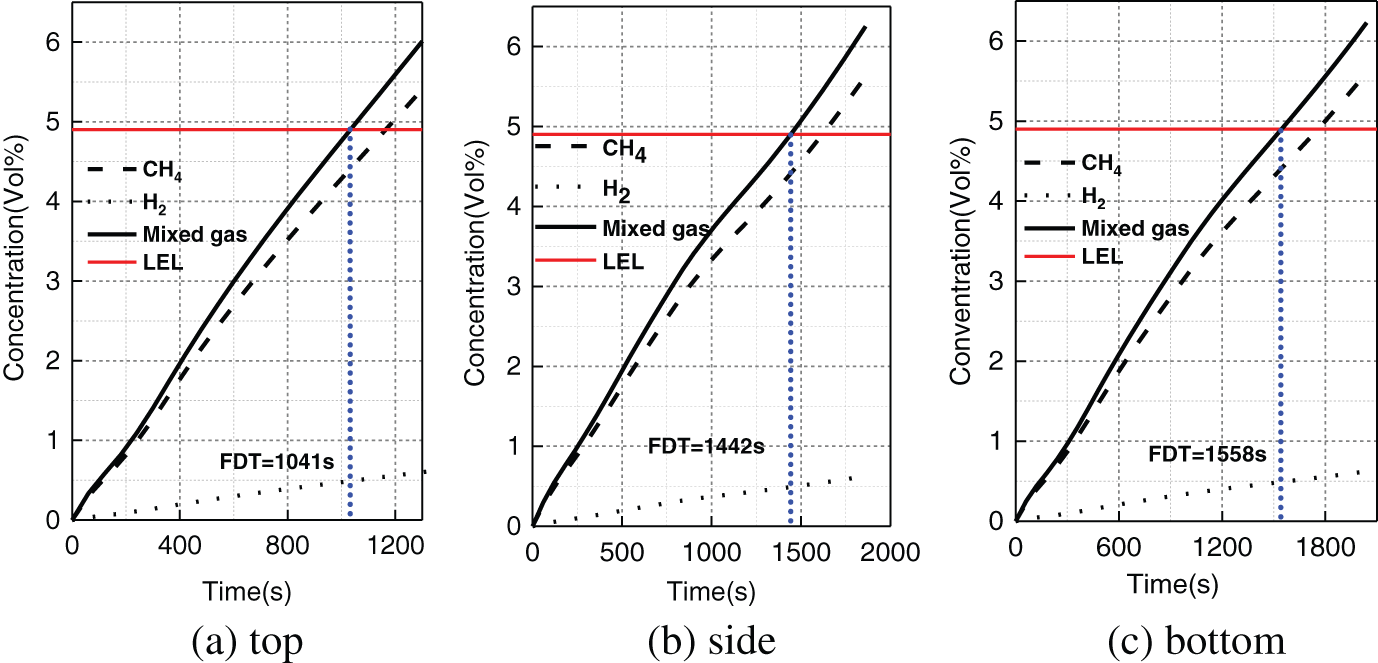
Figure 13: Variation of mixed gas concentration at P4 under different leakage directions
6.5 Analysis of Leakage Consequence under Different Soil Types
Taking cases 2, 12 and 13 as examples, the influence of soil type on the consequences of HENG leakage is analyzed. First, according to the particle diameter and porosity of soil, the viscous resistance coefficient and inertial resistance coefficient are calculated by using Eqs. (6) and (7), as shown in Table 14.
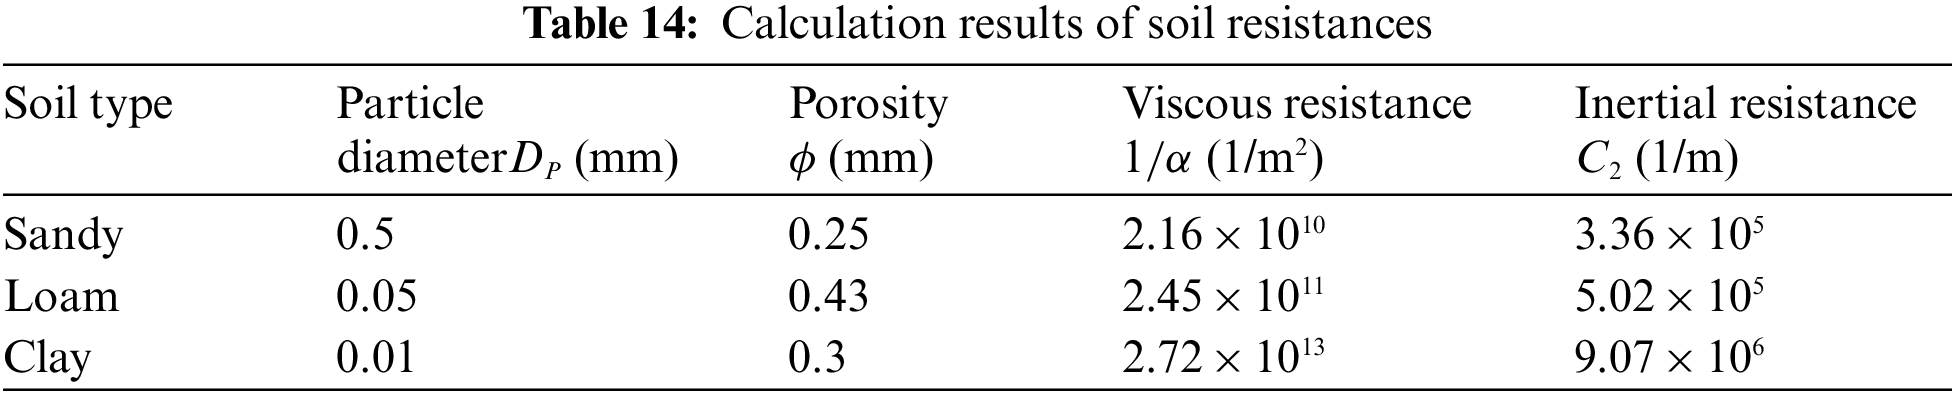
Fig. 14 shows the change of leakage gas concentration monitored at P4 point in cases 12 and 13 with time. The analysis shows the corresponding FDT of sand, loam and clay is 157, 1041 and 69062 s, respectively. The soil type has great influences on gas leakage and diffusion processes. There exists remarkable difference in FDT between different soil types, for instance, the difference between the FDT of sand and clay is up to two orders of magnitude.
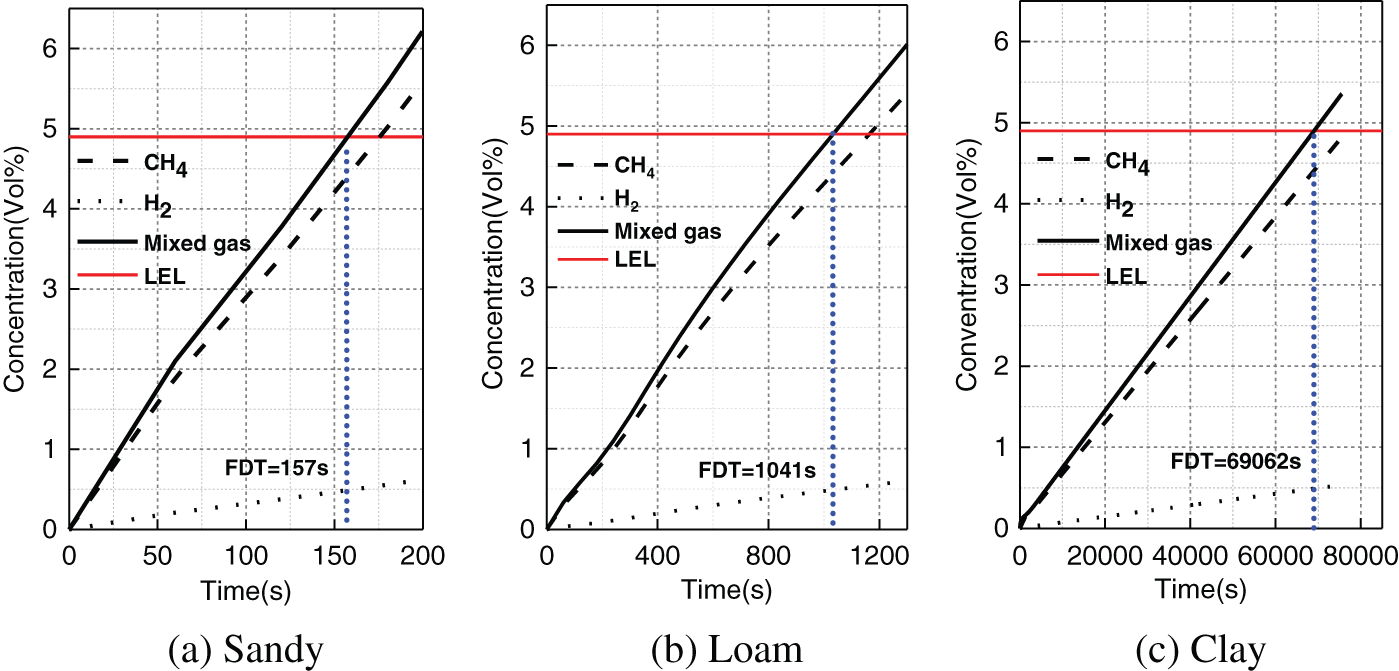
Figure 14: Variation of mixed gas concentration at P4 under different soil types
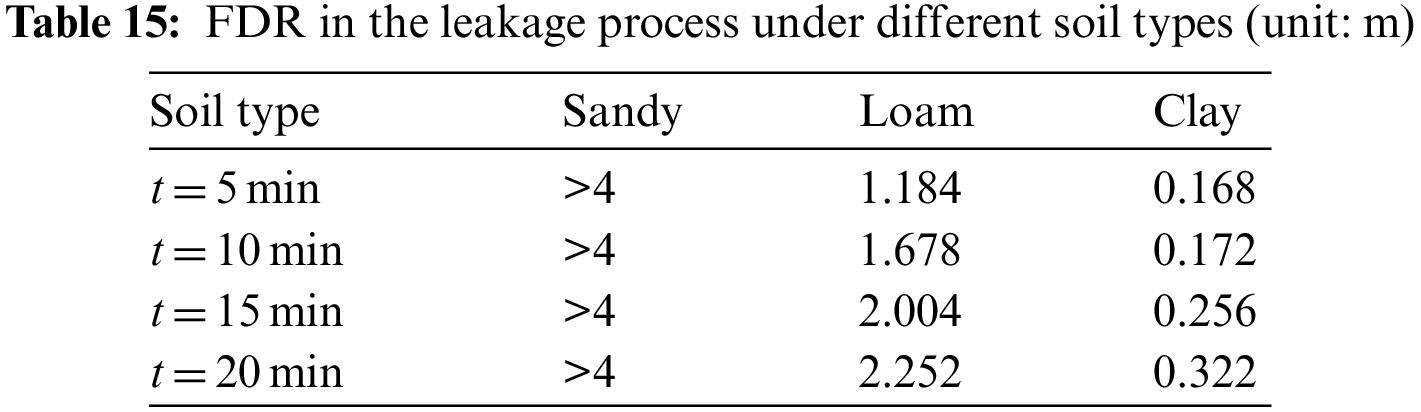
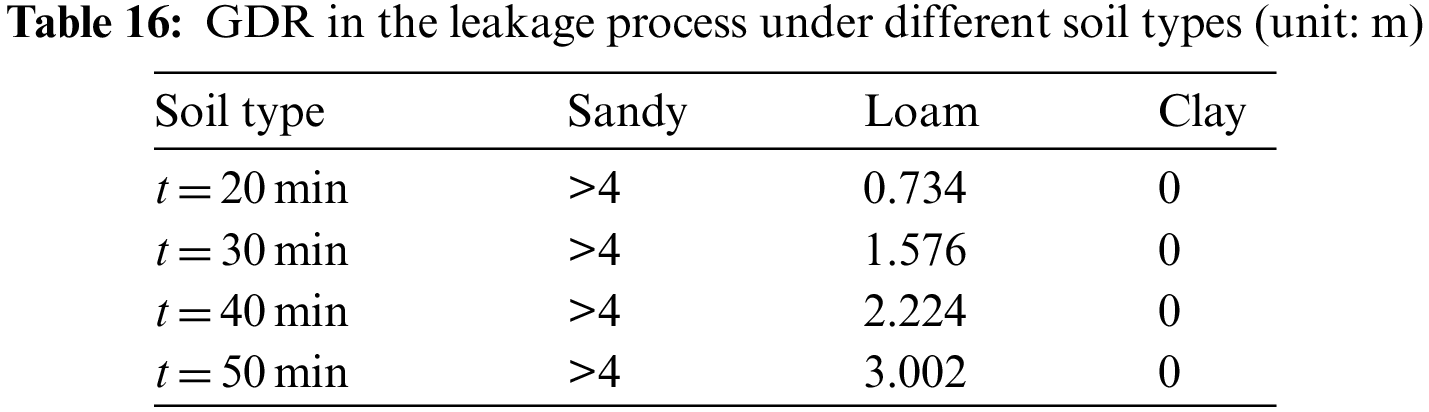
Table 15 presents FDR values in the leakage process under different soil types. It can be observed that FDR value meets the relationship of sand > loam > clay at different times. At t = 5 min the FDR of sand is larger than the size of computational domain. Table 16 shows GDR values in the leakage process under different soil types. It can be found that the HENG concentration at the ground surface of clay still fails to reach the LEL at t = 50 min. For sand, the GDR value exceeds the size of computational domain at t = 20 min.
6.6 Comparison of Different Influencing Factors
Fig. 15 displays the comparison of FDT, FDR and GDR in the leakage process under different cases, in which the presented FDR and GDR values correspond to the values measured at t = 20 min. It is clearly seen among the influencing factors discussed in this study, the soil type has the greatest influence on the leakage and diffusion processes for urban buried HENG pipeline. The FDT value of clay is about 440 times larger than that of sand. In addition, the leakage hole diameter and pipeline operating pressure also have great influence on leakage and diffusion processes of urban buried HENG pipeline. The influence of leakage direction and HBR are relatively small. Especially the HBR has the weakest influence, and the differences of FDT, FDR and GDR at different HBRs are subtle.
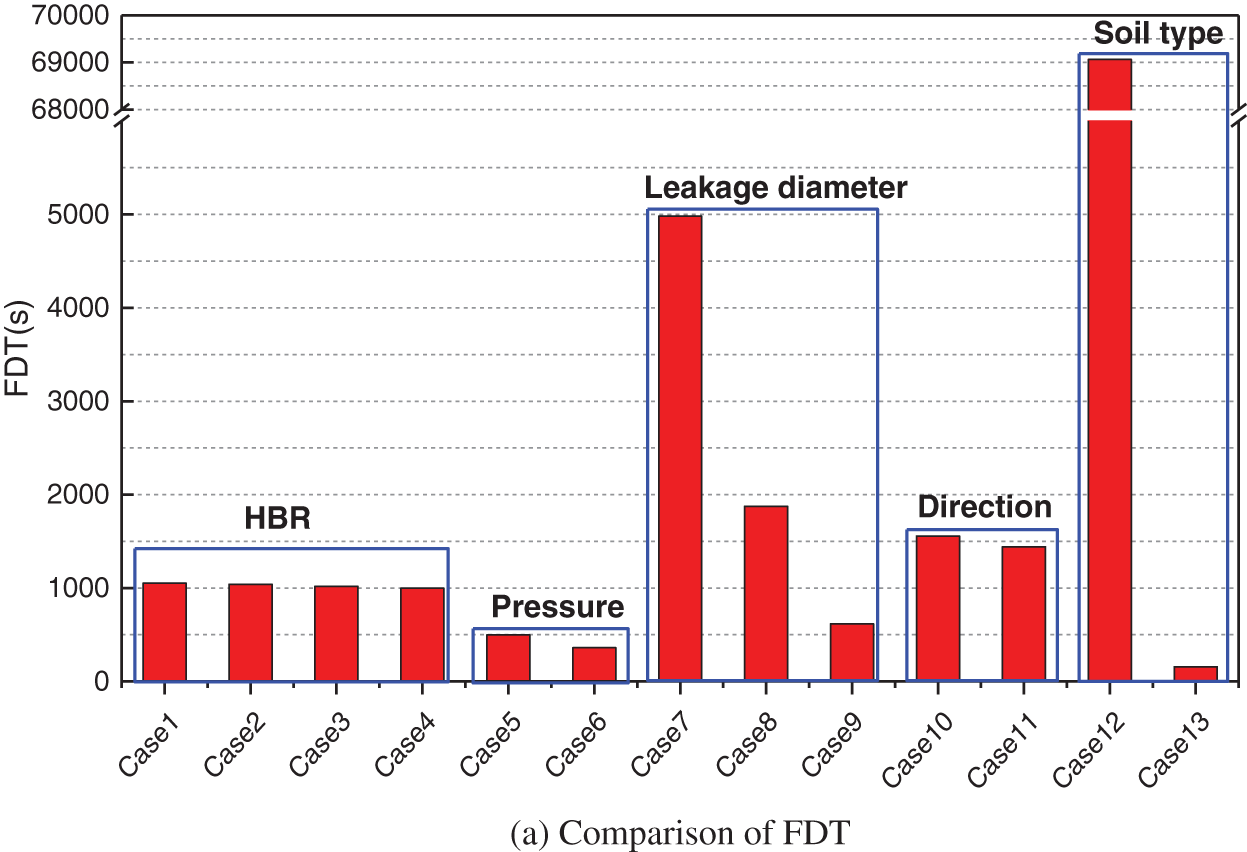
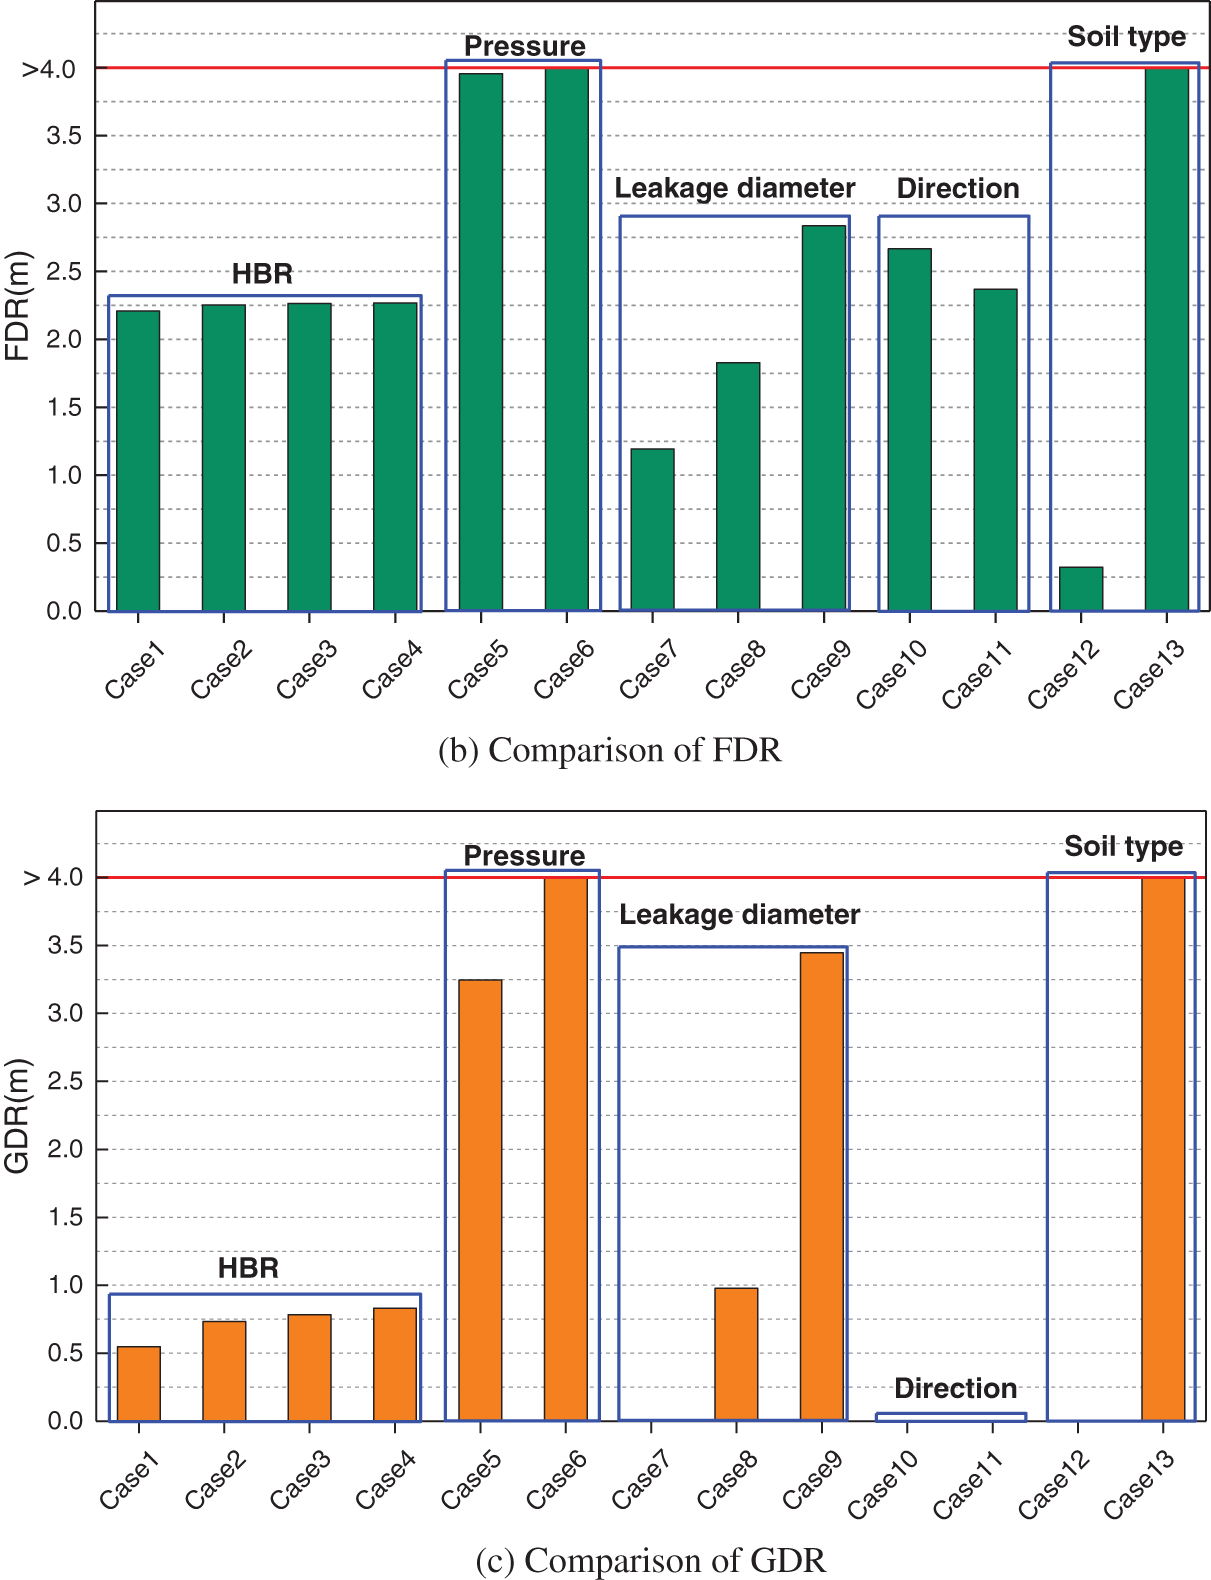
Figure 15: Analysis of leakage consequences under different calculation conditions
In summary, hydrogen has a wider explosive limit and is easier to diffuse than natural gas, which requires additional safety measures, including leakage monitoring equipment and upgraded ventilation systems to prevent explosions which may occur after gas leakage.
In this study, the leakage of urban buried HENG pipelines is investigated numerically, and the influences of HBR, pipeline operating pressure, the diameter of leakage hole, leakage direction and soil type on the leakage consequences are analyzed and discussed in detail. The concluding remarks of this work can be summarized as follows:
(1) The HENG presents a spherical diffusion process when it leaks from urban buried pipelines. The gas concentration field around the leakage hole changes rapidly at the initial stage of the leakage, and then gradually becomes stable. The whole leakage area basically conforms to the fact that the closer to the leakage hole, the higher the leakage gas concentration is and the more stable it tends to be. Because of the strong diffusion effect of hydrogen, the increase of HBR will enlarge the whole gas cloud.
(2) The severity of the leakage consequences for urban buried HENG pipeline is affected by multiple influencing factors, among which the soil type is the most critical factor. For clay and sand, the FDT difference is up to two orders of magnitude. The pipeline operating pressure and leakage hole diameter also influence leakage consequences obviously, but the leakage direction and HBR exert slight effects on the leakage and diffusion of urban buried HENG pipeline.
(3) For natural gas pipelines, if the influence of hydrogen on pipeline mechanical properties is not considered, the analysis of FDT, FDR and GDR show the hydrogen blending is not the key factor in increasing the risk after urban buried pipeline leakage.
Funding Statement: This study is supported by the National Key R&D Program of China (No. 2021YFB4001602), the National Natural Science Foundation of China (No. 51904031) and the Award Cultivation Foundation from Beijing Institute of Petrochemical Technology (No. BIPTACF-002).
Conflicts of Interest: The authors declare that they have no known competing financial interests or personal relationships that could have appeared to influence the work reported in this paper.
References
1. Li, B. Q., Li, Z. (2022). Towards world’s low carbon development, the role of clean energy. Applied Energy, 307, 108160. DOI 10.1016/j.apenergy.2021.118160. [Google Scholar] [CrossRef]
2. Mamidi, V., Marisetty, V. B., Thomas, E. N. (2021). Clean energy transition and intertemporal socio-economic development, evidence from an emerging market. Energy Economics, 101, 105392. DOI 10.1016/j.eneco.2021.105392. [Google Scholar] [CrossRef]
3. Zhang, X. Q. (2021). The development trend of and suggestions for China’s hydrogen energy industry. Engineering, 7(6), 719–721. DOI 10.1016/j.eng.2021.04.012. [Google Scholar] [CrossRef]
4. Karapekmez, A., Dincer, I. (2021). Development of a multigenerational energy system for clean hydrogen generation. Journal of Cleaner Production, 299, 126909. DOI 10.1016/j.jclepro.2021.126909. [Google Scholar] [CrossRef]
5. Ozturk, M., Dincer, I. (2020). Development of renewable energy system integrated with hydrogen and natural gas subsystems for cleaner combustion. Journal of Natural Gas Science and Engineering, 83, 103583. DOI 10.1016/j.jngse.2020.103583. [Google Scholar] [CrossRef]
6. Lahnaoui, A., Wulf, C., Heinrichs, H., Dalmazzone, D. (2019). Optimizing hydrogen transportation system for mobility via compressed hydrogen trucks. International Journal of Hydrogen Energy, 44(35), 19302–19312. DOI 10.1016/j.ijhydene.2018.10.234. [Google Scholar] [CrossRef]
7. Hurskainen, M., Ihonen, J. (2020). Techno-economic feasibility of road transport of hydrogen using liquid organic hydrogen carriers. International Journal of Hydrogen Energy, 45(56), 32098–32112. DOI 10.1016/j.ijhydene.2020.08.186. [Google Scholar] [CrossRef]
8. Wickham, D., Hawkes, A., Vega, F. J. (2022). Hydrogen supply chain optimisation for the transport sector–focus on hydrogen purity and purification requirements. Applied Energy, 305, 117740. DOI 10.1016/j.apenergy.2021.117740. [Google Scholar] [CrossRef]
9. Ma, Y., Wang, X. R., Li, T., Zhang, J. W., Gao, J. et al. (2021). Hydrogen and ethanol, production, storage, and transportation. International Journal of Hydrogen Energy, 46(54), 27330–27348. DOI 10.1016/j.ijhydene.2021.06.027. [Google Scholar] [CrossRef]
10. Meng, Q. F., Huang, Y. Q., Ye, J. K., Xia, G. L., Wang, G. F. et al. (2021). Electrospun carbon nanofibers with in-situ encapsulated Ni nanoparticles as catalyst for enhanced hydrogen storage of MgH2. Journal of Alloys and Compounds, 851(15), 156874. DOI 10.1016/j.jallcom.2020.156874. [Google Scholar] [CrossRef]
11. Abdin, Z., Tang, C. G., Liu, Y., Catchpole, K. (2021). Large-scale stationary hydrogen storage via liquid organic hydrogen carriers. iScience, 24(9), 102996. DOI 10.1016/j.isci.2021.102966. [Google Scholar] [CrossRef]
12. Oney, F., Veziro, T. N., Dulger, Z. (1994). Evaluation of pipeline transportation of hydrogen and natural gas mixtures. International Journal of Hydrogen Energy, 19(10), 813–822. DOI 10.1016/0360-3199(94)90198-8. [Google Scholar] [CrossRef]
13. Dries, H., William, D. H. (2007). The use of the natural-gas pipeline infrastructure for hydrogen transport in a changing market structure. International Journal of Hydrogen Energy, 32, 1381–1386. DOI 10.1016/j.ijhydene.2006.10.018. [Google Scholar] [CrossRef]
14. Liu, B., Liu, S. X., Guo, S. S., Zhang, S. X. (2020). Economic study of a large-scale renewable hydrogen application utilizing surplus renewable energy and natural gas pipeline transportation in China. International Journal of Hydrogen Energy, 45(3), 1385–1398. DOI 10.1016/j.ijhydene.2019.11.056. [Google Scholar] [CrossRef]
15. Zhao, Y., McDonell, V., Samuelsen, S. (2019). Influence of hydrogen addition to pipeline natural gas on the combustion performance of a cooktop burner. International Journal of Hydrogen Energy, 44, 12239–12253. DOI 10.1016/j.ijhydene.2019.03.100. [Google Scholar] [CrossRef]
16. Zhao, Y., McDonell, V., Samuelsen, S. (2019). Experimental assessment of the combustion performance of an oven burner operated on pipeline natural gas mixed with hydrogen. International Journal of Hydrogen Energy, 44, 26049–26062. DOI 10.1016/j.ijhydene.2019.08.011. [Google Scholar] [CrossRef]
17. Pluvinage, G. (2021). Mechanical properties of a wide range of pipe steels under influence of pure hydrogen or hydrogen blended with natural gas. International Journal of Pressure Vessels and Piping, 190, 104293. DOI 10.1016/j.ijpvp.2020.104293. [Google Scholar] [CrossRef]
18. Meliani, M. H., Azari, Z., Matvienko, Y. G., Pluvinage, G. (2011). The effect of hydrogen on the master failure curve of APL 5L gas pipe steels. Procedia Engineering, 10, 942–947. DOI 10.1016/j.proeng.2011.04.155. [Google Scholar] [CrossRef]
19. Dadfarnia, M., Sofronis, P., Brouwer, J., Sosa, S. (2019). Assessment of resistance to fatigue crack growth of natural gas line pipe steels carrying gas mixed with hydrogen. International Journal of Hydrogen Energy, 44(31), 10808–10822. DOI 10.1016/j.ijhydene.2019.02.216. [Google Scholar] [CrossRef]
20. Zhao, W. M., Yang, M., Zhang, T. M., Deng, Q. S., Jiang, W. et al. (2018). Study on hydrogen enrichment in X80 steel spiral welded pipe. Corrosion Science, 133, 251–260. DOI 10.1016/j.corsci.2018.01.011. [Google Scholar] [CrossRef]
21. Ronevich, J. A., Somerday, B. P., Feng, Z. (2017). Hydrogen accelerated fatigue crack growth of friction stir welded X52 steel pipe. International Journal of Hydrogen Energy, 42(7), 4259–4268. DOI 10.1016/j.ijhydene.2016.10.153. [Google Scholar] [CrossRef]
22. Maruschak, P., Prentkovskis, O., Bishchak, R. (2016). Defectiveness of external and internal surfaces of the main oil and gas pipelines after long-term operation. Journal of Civil Engineering and Management, 22(2), 279–286. DOI 10.3846/13923730.2015.1100672. [Google Scholar] [CrossRef]
23. Hutsaylyuk, V., Maruschak, P., Konovalenko, I., Panin, S., Bishchak, R. et al. (2019). Mechanical properties of gas main steels after long-term operation and peculiarities of their fracture surface morphology. Materials, 12(3), 491. DOI 10.3390/ma12030491. [Google Scholar] [CrossRef]
24. Cazenave, P., Jimenez, K., Gao, M., Moneta, A., Hryciuk, P. (2021). Hydrogen assisted cracking driven by cathodic protection operated at near −1200 mV CSE–An onshore natural gas pipeline failure. Journal Pipe Science Engineering, 1(1), 100–121. DOI 10.1016/j.jpse.2021.02.002. [Google Scholar] [CrossRef]
25. Li, Y. X., Zhang, R., Liu, C. W., Wang, C. L., Yang, H. C. et al. (2022). Hydrogen embrittlement behavior of typical hydrogen-blended natural gas pipeline steel. Oil & Gas Storage and Transportation, 41(6), 732–742. DOI 10.6047/j.issn.1000-8241.2022.06.015. [Google Scholar] [CrossRef]
26. Zhao, B., Chen, H., Gao, D. K., Xu, L. Z. (2020). Risk assessment of refinery unit maintenance based on fuzzy second generation curvelet neural network. Alexandria Engineering Journal, 59(3), 1823–1831. DOI 10.1016/j.aej.2020.04.052. [Google Scholar] [CrossRef]
27. Zhao, B., Song, H. Y. (2021). Fuzzy shannon wavelet finite element methodology of coupled heat transfer analysis for clearance leakage flow of single screw compressor. Engineering with Computers, 37, 2493–2503. DOI 10.1007/s00366-020-01259-6. [Google Scholar] [CrossRef]
28. Hideki, O., Yasushiro, G. (2011). Empirical research on diffusion behavior of leaked gas in the ground. Journal of Loss Prevention in the Process Industries, 24, 531–540. DOI 10.1016/j.jlp.2011.01.007. [Google Scholar] [CrossRef]
29. Bonnaud, C., Cluzel, V., Corcoles, P., Dubois, J. P., Louvet, V. et al. (2018). Experimental study and modelling of the consequences of small leaks on buried transmission gas pipeline. Journal of Loss Prevention in the Process Industries, 55, 308–312. DOI 10.1016/j.jlp.2018.06.010. [Google Scholar] [CrossRef]
30. Yan, Y. T., Dong, X. Q., Li, J. M. (2015). Experimental study of methane diffusion in soil for an underground gas pipe leak. Journal of Natural Gas Science and Engineering, 87, 82–89. DOI 10.1016/j.jngse.2015.08.039. [Google Scholar] [CrossRef]
31. Wang, X. M., Tan, Y. F., Zhang, T. T., Xiao, R., Yu, K. C. et al. (2021). Numerical study on the diffusion process of pinhole leakage of natural gas from underground pipelines to the soil. Journal of Natural Gas Science and Engineering, 87, 103792. DOI 10.1016/j.jngse.2020.103792. [Google Scholar] [CrossRef]
32. Amir, E. M., Mahmood, F. G., Ahmad, A., Ali, J. M. (2018). CFD analysis of natural gas emission from damaged pipelines, correlation development for leakage estimation. Journal of Cleaner Production, 199, 257–271. DOI 10.1016/j.jclepro.2018.07.127. [Google Scholar] [CrossRef]
33. Javad, B., Esmaeil, F., Ali, R. (2020). CFD investigation of natural gas leakage and propagation from buried pipeline for anisotropic and partially saturated multilayer soil. Journal of Cleaner Production, 277, 123940. DOI 10.1016/j.jclepro.2020.123940. [Google Scholar] [CrossRef]
34. Liu, C. W., Liao, Y. H., Liang, J., Cui, Z. X., Li, Y. X. (2021). Quantifying methane release and dispersion estimations for buried natural gas pipeline leakages. Process Safety and Environmental Protection, 146, 552–563. DOI 10.1016/j.psep.2020.11.031. [Google Scholar] [CrossRef]
35. Kim, S., Park, J. S., Park, J. W. (2019). A leak detection and 3D source localization method on a plant piping system by using multiple cameras. Nuclear Engineering and Technology, 51, 155–162. DOI 10.1016/j.net.2018.09.012. [Google Scholar] [CrossRef]
36. Batzias, F. A., Siontorou, C. G., Spanidis, P. M. P. (2011). Designing a reliable leak bio-detection system for natural gas pipelines. Journal of Hazardous Materials, 186(1), 35–58. DOI 10.1016/j.jhazmat.2010.09.115. [Google Scholar] [CrossRef]
37. Bagajewicz, M., Valtinson, G. (2014). Leak detection in gas pipelines using accurate hydraulic models. Industrial & Engineering Chemistry Research, 53(44), 16964–16972. DOI 10.1021/ie501322g. [Google Scholar] [CrossRef]
38. Montiel, H., Vílchez, J. A., Casal, J., Arnaldos, J. (1998). Mathematical modelling of accidental gas releases. Journal of Hazardous Materials, 59, 211–233. DOI 10.1016/S0304-3894(97)00149-0. [Google Scholar] [CrossRef]
39. Wang, X. Y., Du, M. P., Wang, T., Bai, Y. Q., Xiang, Y. (2018). Numerical simulation of leakage of gas from buried pipeline and its diffusion process. China Safety Science Journal, 2, 49–54. DOI 10.16265/j.cnki.issn10033033.2018.02.008. [Google Scholar] [CrossRef]
40. Langer, M. (1993). The role of engineering geology for planning and construction of underground openings. Engineering Geology, 35, 143–147. DOI 10.1016/0013-7952(93)90001-S. [Google Scholar] [CrossRef]
41. Han, O., Zhang, Y., Li, A. G. (2020). Experimental and numerical study on heavy gas contaminant dispersion and ventilation design for industrial buildings. Sustainable Cities and Society, 55, 102016. DOI 10.1016/j.scs.2020.102016. [Google Scholar] [CrossRef]
42. Bu, F. X., Liu, Y., Liu, Y. B., Xu, Z., Chen, S. Q. et al. (2021). Leakage diffusion characteristics and harmful boundary analysis of buried natural gas pipeline under multiple working conditions. Journal of Natural Gas Science and Engineering, 94, 104047. DOI 10.1016/j.jngse.2021.104047. [Google Scholar] [CrossRef]
43. Li, J. F., Su, Y., Zhang, H., Yu, B. (2021). Research progresses on pipeline transportation of hydrogen-blended natural gas. Natural Gas Industry, 41(4), 124–139. [Google Scholar]
44. Mendiburu, A. Z., Coronado, R., Carvalho, J. A. (2020). Difficulties on the determination of the flammability limits of fuel mixtures by the Law of Le Chatelier. Process Safety and Environmental Protection, 142, 45–55. DOI 10.1016/j.psep.2020.05.047. [Google Scholar] [CrossRef]
45. Huang, L. H., Pei, S. F., Wang, Y., Zhang, L., Ren, S. R. et al. (2019). Assessment of flammability and explosion risks of natural gas-air mixtures at high pressure and high temperature. Fuel, 247, 47–56. DOI 10.1016/j.fuel.2019.03.023. [Google Scholar] [CrossRef]
Cite This Article
 Copyright © 2023 The Author(s). Published by Tech Science Press.
This work is licensed under a Creative Commons Attribution 4.0 International License , which permits unrestricted use, distribution, and reproduction in any medium, provided the original work is properly cited.
 Downloads
 Citation Tools