
 Submit a Paper
 Propose a Special lssue
 Open Access
ARTICLE

Credit Card Fraud Detection on Original European Credit Card Holder Dataset Using Ensemble Machine Learning Technique
Department of Electrical and Electronic Engineering, FETBE, UCSI University, Kuala Lumpur, 56000, Malaysia
* Corresponding Author: Yih Bing Chu. Email:
Journal of Cyber Security 2023, 5, 33-46. https://doi.org/10.32604/jcs.2023.045422
Received 26 August 2023; Accepted 09 October 2023; Issue published 03 November 2023
 View Full Text
 Download PDF
Abstract
The proliferation of digital payment methods facilitated by various online platforms and applications has led to a surge in financial fraud, particularly in credit card transactions. Advanced technologies such as machine learning have been widely employed to enhance the early detection and prevention of losses arising from potentially fraudulent activities. However, a prevalent approach in existing literature involves the use of extensive data sampling and feature selection algorithms as a precursor to subsequent investigations. While sampling techniques can significantly reduce computational time, the resulting dataset relies on generated data and the accuracy of the pre-processing machine learning models employed. Such datasets often lack true representativeness of real-world data, potentially introducing secondary issues that affect the precision of the results. For instance, under-sampling may result in the loss of critical information, while over-sampling can lead to overfitting machine learning models. In this paper, we proposed a classification study of credit card fraud using fundamental machine learning models without the application of any sampling techniques on all the features present in the original dataset. The results indicate that Support Vector Machine (SVM) consistently achieves classification performance exceeding 90% across various evaluation metrics. This discovery serves as a valuable reference for future research, encouraging comparative studies on original dataset without the reliance on sampling techniques. Furthermore, we explore hybrid machine learning techniques, such as ensemble learning constructed based on SVM, K-Nearest Neighbor (KNN) and decision tree, highlighting their potential advancements in the field. The study demonstrates that the proposed machine learning models yield promising results, suggesting that pre-processing the dataset with sampling algorithm or additional machine learning technique may not always be necessary. This research contributes to the field of credit card fraud detection by emphasizing the potential of employing machine learning models directly on original datasets, thereby simplifying the workflow and potentially improving the accuracy and efficiency of fraud detection systems.Keywords
As technology evolves, traditional cash payments are gradually yielding to cashless transactions. This shift provides consumers with a more convenient approach for conducting transactions from the comfort of their homes, leveraging internet technology. Consequently, there has been a surge in the utilization of e-commerce services, online billing payment, and near field communication (NFC) or contactless payment [1].
Credit card, as a digital payment tool, empowers consumers to make advance payments within a predetermined credit limit. Consequently, many online retailers and physical stores now offer credit card payment services, which have gained global prevalence [2]. Unfortunately, this prevalence has also attracted the attention of fraudsters who seek to exploit credit card transactions. According to reports from the Federal Trade Commission (FTC), more than 1,579 data breaches have occurred, with credit card frauds accounting for the highest number of cases among various form of digital frauds. As a result, it has become imperative to identify potentially fraudulent transactions to safeguard user accounts and mitigate financial loss.
The sheer volume of data, compounded by the categorization of records, has made it increasingly challenging to process and analyse fraudulent transactions using conventional statistical methods [3]. Moreover, many datasets are unbalanced, with normal transactions significantly outnumbering fraudulent ones, possibly leading to misrepresentation of attributes and the inadvertent neglect of crucial information. In response to these challenges, robust and intelligent classification techniques such as machine learning models, have been proposed.
Various supervised machine learning models, including decision trees, logistic regression, and Support Vector Machine (SVM), can be trained and employed for fraud detection. However, most machine learning studies in credit card classification have been conducted using oversampled or under-sampled datasets [4]. It is important to note that such sampling techniques do not uncover the genuine patterns of fraudulent transactions but are primarily aimed at conserving computational time when dealing with extensive datasets. Over-sampling involves duplicating minority class datasets, potentially leading to overfitting or the classification of similar data points. Conversely, under-sampling reduces majority class datasets, risking the loss of critical information and underfitting. In essence, the sampled datasets are artificially generated and may not faithfully represent the actual patterns of fraudulent transactions. Machine learning models trained on such sampled data lack reliability, resulting in inconsistent detection accuracy and the potential approval of fraudulent transactions, ultimately leading to client losses. Therefore, it is essential to formulate accurate models based on the original dataset to identify the behaviour of hijacked accounts.
In this study, we aim to assess the performance of several machine learning models in classifying credit card fraudulent transactions using the original European card holders’ dataset [5], without employing sampling techniques. We also explore various combinations of machine learning models, including ensembled stacking, to enhance research comprehensiveness. We believe this investigation will provide valuable insights for future research, particularly by facilitating performance comparisons of machine learning models when applied to original datasets. Replicating identical sampled datasets used in previous studies is virtually impossible, making our research results a valuable addition to this limited knowledge space.
The remainder of this paper is structured as follows: Section 2 provides an overview of related works. Section 3 elaborates on the machine learning models and associated techniques employed in the study. Section 4 discusses the results and evaluates the performance of these machine learning models. Finally, Section 5 presents conclusions, discusses limitations, and outlines future improvements.
This section provides an overview of recent studies in credit card fraud detection employing machine learning techniques.
Dornadula et al. [2] applied various machine learning models, including logistic regression, decision trees, random forests, and SVM, to classify fraudulent transaction. Due to dataset imbalance, they proposed the Synthetic Minority Over-sampling Technique (SMOTE) to address this issue. Results showed that random forests achieved the highest performance, with an accuracy, precision, and Matthews Correlation Coefficient (MCC) of 99.94%, 93.10% and 82.68%, respectively. Notably, common over-sampling methods introduce unwanted data or overfitting, potentially affecting result reliability.
Itoo et al. [6] introduced random under-sampling (RUS) to resample original datasets at different fraud-to-non-fraud ratios (25:75, 50:50, and 75:25). They compared the performance of logistic regression, Naive Bayes, and K-Nearest Neighbor (KNN) on the resampled dataset, with logistic regression consistently outperforming other models, achieving a maximum accuracy of 95.9%. However, the authors noted potential information loss and suggested improved sampling methods as future work.
In 2022, Ileberi et al. [4] applied SMOTE to resample the original dataset and employed genetic algorithms combined with random forests to achieve the highest accuracy of approximately 99.98%, while genetic algorithms paired with decision trees or artificial neural networks achieved 100% accuracy on specific datasets. The authors acknowledged the need for further research given the limited dataset and training vectors used.
In the same year, Alfaiz et al. [1] conducted machine learning training directly on the original dataset, arguing that the recorded transactions in the original dataset represent the real-world without missing information. After preprocessing the dataset with principal component analysis for customer information anonymization, they found that Category Boosting (CatBoost) produced the highest accuracy of 99.96% following a resampling technique with AllKNN technique.
Recently, Afriyie et al. [3] compared the performance of logistic regression, decision trees, and random forests in credit card fraud detection using the dataset from the Western United States. They applied an under-sampling technique to balance the data distribution, resulting in a 50:50 ratio between fraudulent and non-fraudulent transactions. The study concluded that random forests achieved the best performance, with an accuracy rate of approximately 96%.
These studies, conducted over the past three years, predominantly employed datasets from European cardholders [5]. It is evident that most of these studies rely on resampling of the original datasets, potentially leading to information loss and overfitting. In alignment with the arguments put forth by Alfaiz and Fati, it is suggested that all the processed vectors are equally important, and further processing may not be necessary. Consequently, our study aims to conduct a similar machine learning investigation on the European dataset without sampling or feature reduction methods. This holistic approach allows us to gain a comprehensive understanding of the selected machine learning algorithms performances concerning the roles of all the existing feature vectors. Our study also includes a comparative analysis of the selected machine learning models and explores the potential advantages of hybrid or stacking approaches.
3 Machine Learning Models and Methodology
3.1.1 Support Vector Machine (SVM)
The Support Vector Machine (SVM) is a supervised machine learning algorithm renowned for its efficiency in both regression and classification tasks. It operates by identifying an optimal hyperplane within a high-dimensional space to segregate distinct classes. In the context of credit card fraud detection, SVM excels due to its ability to manage high-dimensional data and capture intricate nonlinear relationships among features.
To tackle high-dimensional datasets, SVM employs a kernel function that transforms data points into a higher-dimensional space, where it can delineate data using an appropriate hyperplane. SVM, as noted by Zareapoor et al. [7], is particularly apt for binary classification tasks such as credit card fraud detection. It seeks to establish a separator or hyperplane that distinguishes the dataset into positive and negative classes. Two critical factors contributing to SVM’s precision in classifying data with multiple features are kernel representation and margin optimization.
Through data transformation from 2-D to 3-D, the hyperplane achieves enhanced classification accuracy. Moreover, in higher-dimensional spaces, the model considers a multitude of feature dimensions, reducing the likelihood of misclassifications. In such cases, the one-dimensional separation vector in 2-D becomes a two-dimensional separation plane in 3-D space.
Chen et al. [8] conducted comparative study between SVM and Artificial Neural Network (ANN) for credit card fraud detection. While ANN yielded slightly more accurate results than SVM, it often suffered from overfitting issues, a drawback not observed in SVM. Consequently, we propose employing SVM over ANN in our subsequent study of credit card fraud classification.
3.1.2 K-Nearest Neighbour (KNN)
The K-Nearest Neighbor (KNN) algorithm classifies data points based on a specified distance metric, calculating distances to query data points [9]. One commonly used distance metric in KNN is the Euclidean formula, determining the nearest neighbors. The ‘K’ value in KNN represents the number of nearest neighbors considered for predictions. Typically, ‘K’ is set as an odd number to serve as a tiebreaker in determining classification outcomes. In this study, we set ‘K’ to approximately 115 for better coverage of neighbouring data points in classification.
During classification, the model identifies the nearest neighbors within the training dataset and assigns labels based on the majority class’s closest distance to the subject data point [10]. As suggested by Maneesha [10], KNN excels in solving classification related problems.
The Decision Tree (DT) machine learning model is another powerful method with significant applications in credit card fraud detection [11]. It is frequently employed for both classification and regression tasks within supervised learning algorithms [12]. The primary objective of a decision tree is to efficiently create tree-like structure that divides data points into different groups by determining the most informative features at each split.
Decision trees excel in managing complex and high-dimensional datasets, especially in the context of credit card fraud detection [13]. They can effectively discern patterns and correlations among various transactional attributes, facilitating the differentiation between legitimate and fraudulent transactions.
One key advantage of decision trees is their ability to handle both numerical and categorical data without necessitating extensive data preprocessing. This makes them particularly suitable for credit card transaction data, which often comprises diverse attributes. The decision tree algorithm operates by recursively dividing the data into subsets based on feature values. At each node, it selects the most informative feature to split the data into classes. This process continues until leaf nodes, representing final classification choices such as ‘fraudulent’ or ‘non-fraudulent,’ are generated. These nodes enable the model to predict new and unforeseen fraudulent credit card transactions.
To enhance the robustness and generalization of the decision tree model, hyperparameter adjustments are crucial [14]. Thoughtful parameter selection, including the maximum tree depth, minimum samples required internal node splitting, and minimum samples needed at leaf node, mitigates overfitting and ensures reliable performance with new data.
The interpretability of decision trees is a critical aspect in credit card fraud identification. Due to their tree-like structure, analysts and investigators can easily follow the decision-making process, simplifying the understanding of why a particular transaction was labeled as fraudulent or not. This transparency bolsters the model’s predictability.
However, decision trees may challenges when dealing with highly imbalanced datasets, a common occurrence in credit card fraud detection scenarios where fraudulent transactions are relatively infrequent compared to legitimate ones. In such cases, ensemble techniques like random forests or gradient boosting may be more suitable, as they can enhance model performance by amalgamating different decision trees.
3.1.4 Adaptive Boosting (AdaBoost)
Adaptive boosting, commonly referred to as AdaBoost, is an ensemble learning technique that leverages boosting to construct a robust model through a series of weak learners [15–17]. The term ‘Adaptive’ in AdaBoost signifies its ability to adjust the weights of misclassified samples by the current weak learner, gradually building a strong leaner. A visual representation of AdaBoost is depicted in Fig. 1, where weak learner 3 learns from weak learner 2, which in turn learns from the errors made by weak learner 1. Eventually, the classification boundaries learned by these three weak learners are combined to create a strong learner.
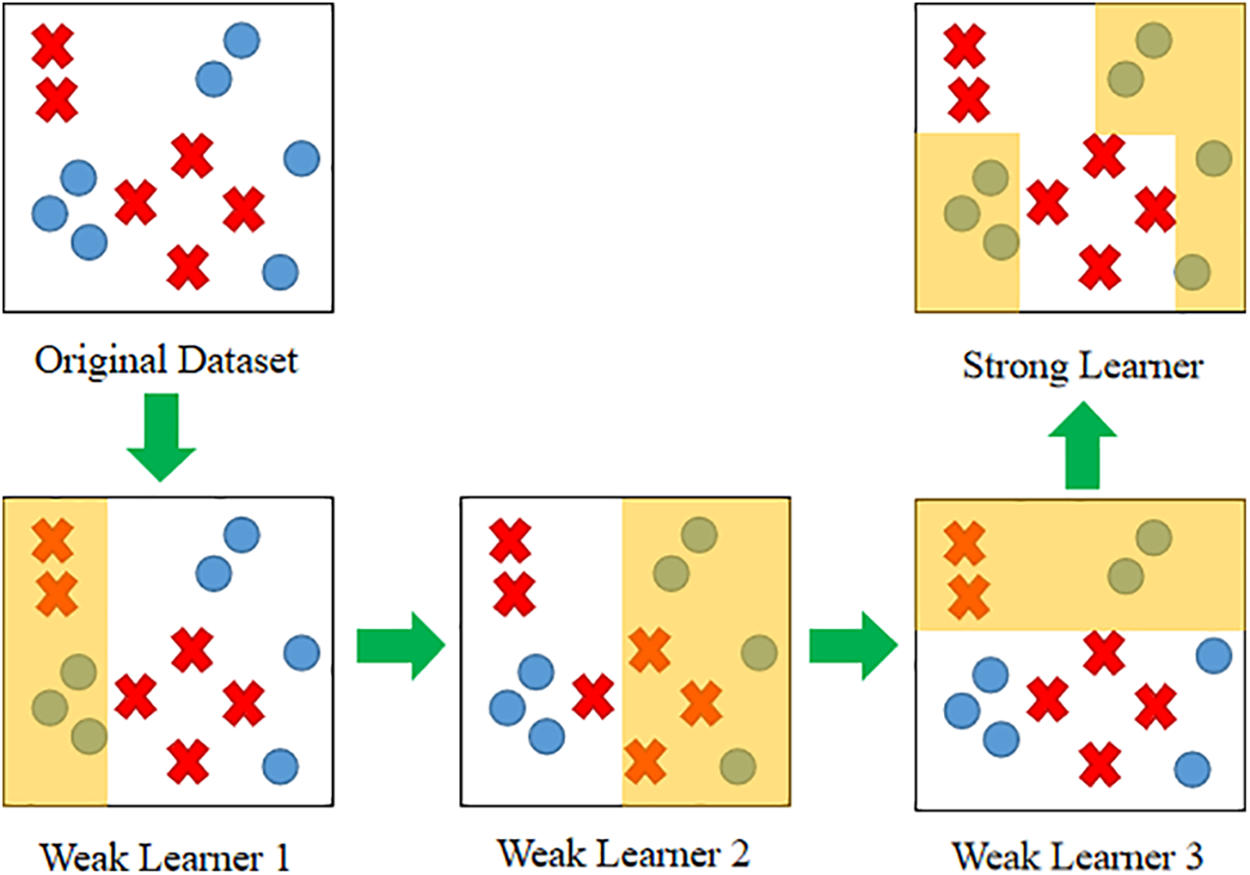
Figure 1: General conceptual process for AdaBoost technique to adaptively improve mistakes made by each weak learner to form a strong learner
The AdaBoost algorithm places significant emphasis on sample weights, highlighting the importance of misclassified samples training. This is achieved by assigning higher weights to misclassified samples or data points after each iteration, enabling the model to focus more on these challenging samples in subsequent iterations. In a study conducted by Chowdary et al. [18], AdaBoost exhibited the highest accuracy, reaching 94.389%, when compared to other boosting techniques.
In this work, we will explore a fundamental AdaBoost model implemented with 100 decision stumps serving as weak learners to construct a final robust classifier model. A decision stump consists of only one level or a single split, connecting the root directly to its leaves. In simpler terms, a decision stump makes predictions based on a single input feature. The weights of the stump models are updated during each training iteration based on the performance of each decision stump in classifying the samples until the optimal performance is achieved.
Blending is one of the stacking methods that involves partitioning the data into training and hold-out validation sets to enhance model performance [19]. The validation set serves as a hold-out set for the target output, utilized in the weak learner to make relevant predictions in line with our training dataset. Multiple heterogenous weak learners are individually trained to produce base predictions. These predictions from the weak learners serve as input features for our meta-learner. The meta-learner is trained to effectively combine the predicted output from the validation set to achieve superior predictions. Once the meta-learner is trained, the entire training set is utilized to predict the test data, resulting in optimized predictions. The blending architecture, comprising two model levels, is illustrated in Fig. 2, with the weak learner as the zero-level model and our meta leaner as the first-level model. The validation set, composed of the predicted output from the weak learner, is situated between these levels and is fed into the meta learner.
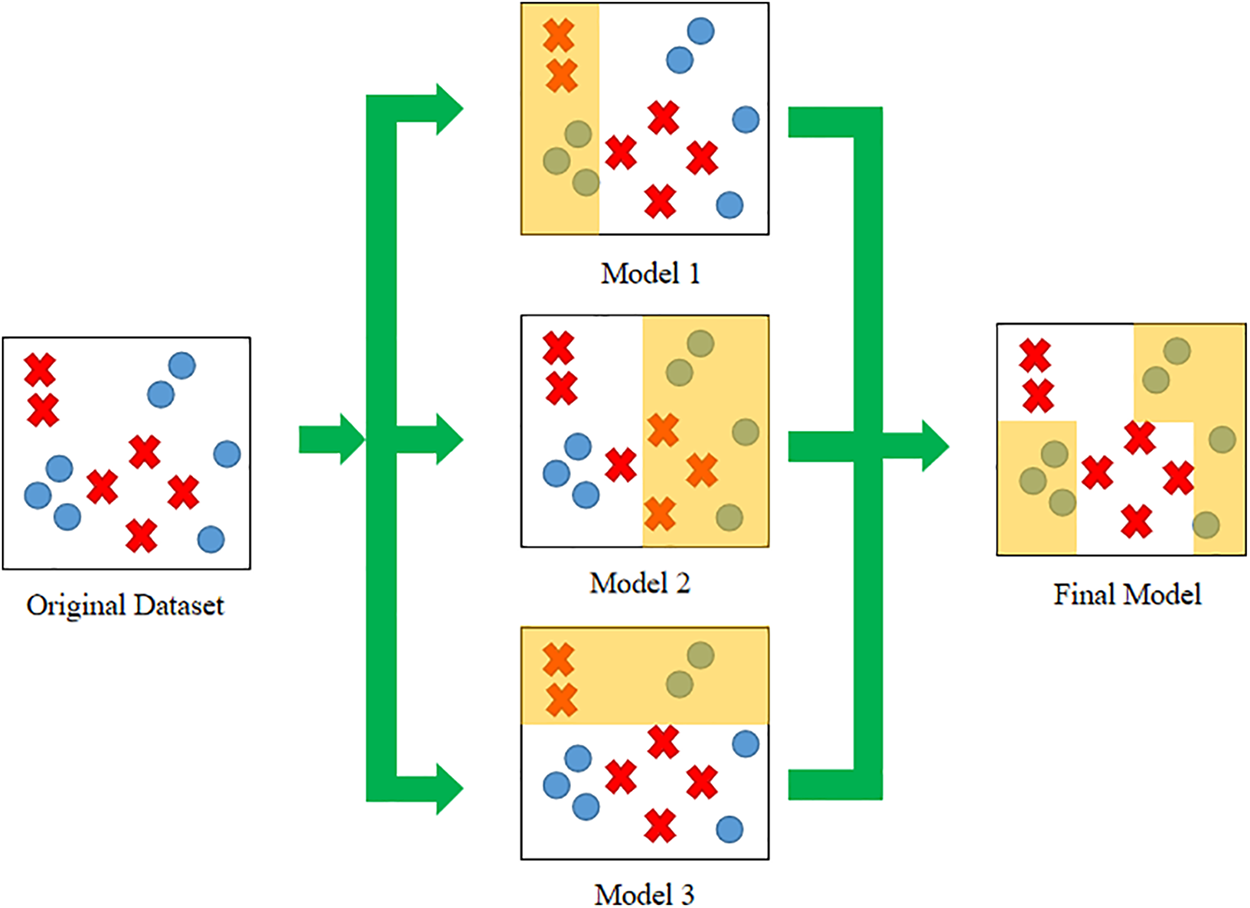
Figure 2: The general conceptual representation of blending architecture
Blending follows a similar procedure to the bagging technique, where weak learners are ensembled in parallel to generate their individual prediction. However, in bagging, each weak learner contributes equally to the meta-learner, regardless of the model’s performance. Blending adopts a weighted average ensemble approach, where the contribution of the meta-learner’s result is weighed based on the trust in the predicted output for generating the best prediction. A generalization of this approach involves employing Linear Regression or Logistic Regression for regression or classification problems, as the meta-learner assigns weightage to the model features contributed by the meta learner.
According to Soleymanzadeh et al. [20], the ensemble blending technique achieved the highest accuracy at 93.46% compared to other stacking methods. However, the general stacking technique had a longer training time of 21.71 s due to division of the training dataset into multiple equalized folds during cross-validation. In contrast, blending required approximately 8.42 s for training. Therefore, they concluded that blending is the preferred choice for credit card fraud detection with a simplified dataset. The quicker training time facilitates faster production of final predictions by the ensemble model.
For this study, the blending model is implemented by integrating SVM, KNN, and decision tree.
Upon training the model with a vast dataset of credit card transactions, it becomes imperative to assess its performance and results. In the field of machine learning, a plethora of evaluation metrics is available, including Recall (RC), F1-score, Precision, Mathew Correlation Coefficient (MCC), Area Under the Curve (AUC), Log Loss, Root Mean Squared Error (RMSE), and more. Nevertheless, within the context of credit card fraud detection, specific metrics are commonly preferred due to the inherent imbalance characteristics in the datasets. The following paragraphs elucidate the frequently employed metrics for the classification of fraudulent credit card transactions, which will be applied in this study [1,4,21].
Accuracy (AC) quantifies the frequency with which a model makes correct predictions on a scale ranging from 0 to 1, often represented as a percentage. An AC value approaching 1 signifies highly accurate results, while a value nearing 0 indicates low accuracy. The formula for AC is as follows:
While AC measures overall accuracy, recall (RC) is utilized to gauge how effectively the model correctly identifies positive cases from all actual positive instances within the dataset. Analogously, an RC value approaching 1 indicates high sensitivity, while a value approaching 0 suggests low sensitivity. The equation for RC is as follows:
F1-score is an evaluation metric that combines precision and RC scores to assess the model’s class-wise performance rather than overall performance like AC. A model that produces no false positive predictions will have a precision close to 1. A higher F1-score value indicates that the model maintains a good balance between precision and RC value. The formula for the F1-score is as follows:
On the other hand, some researchers employ Area Under Curve (AUC) to evaluate the performance of binary classification models. Nevertheless, AUC can yield misleading scores as it is highly influenced by the number of correct or incorrect predictions. AUC considers the true positive rate and false positive rate of the model across various cut-off thresholds [22,23]. It is also referred to as the ‘Area Under the Curve’ because it represents the area under the “Receiver Operating Characteristics” (ROC) curve. The ROC curve is plotted with the true positive rate against the false positive rate, making it a popular metric for assessing the model’s ability to distinguish between classes. AUC values range from 0 to 1, where values close to 1 indicate good model performance, while low values close to 0 indicate poor model performance.
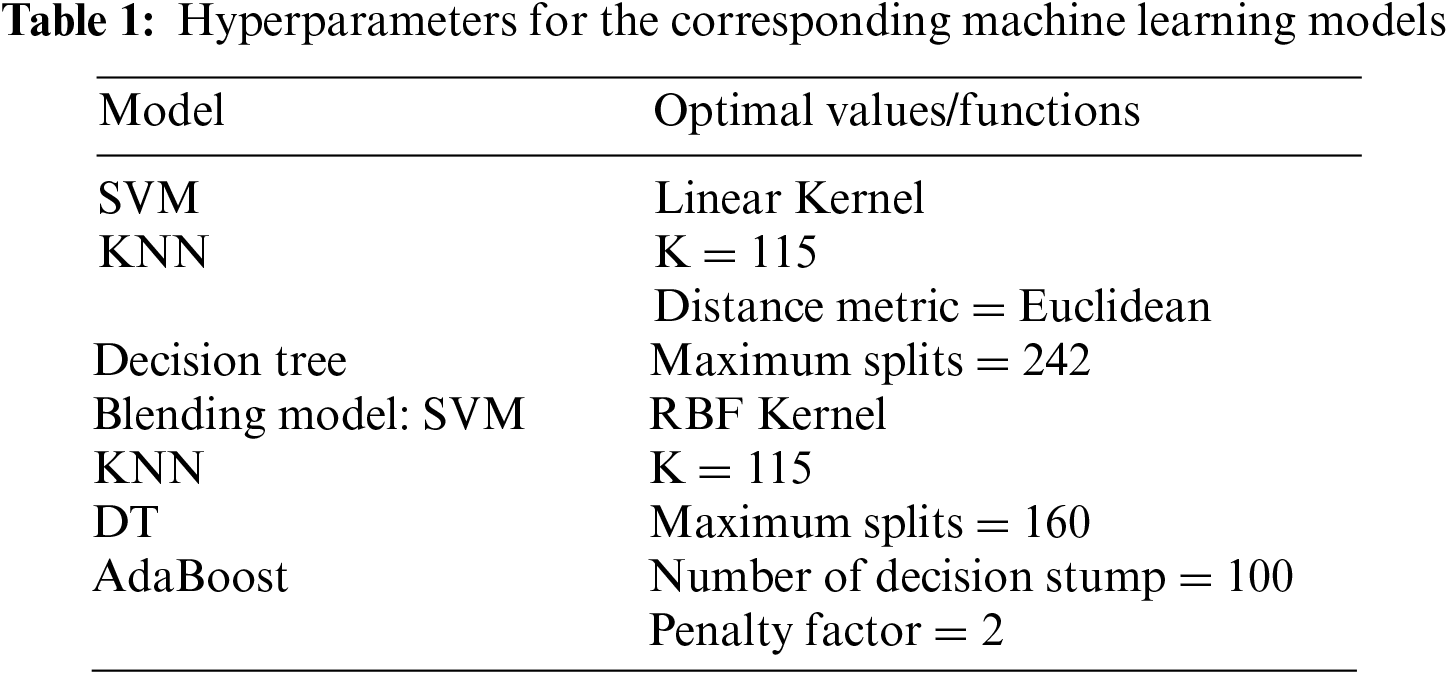
The experiment was conducted utilizing the original European credit card dataset on a branded laptop equipped with AMD Ryzen 7 4800 H processor and NVIDIA GTX 1650 graphic card. Approximately 80% of the data was employed as the training set, while the remaining 20% was reserved to assess the performance of the trained machine learning models. All machine learning models were trained using the built-in commands available in Matlab with default settings. Table 1 presents the corresponding hyperparameters employed in the study.
The testing of the trained SVM model produced an average accuracy exceeding 96%, which is generally deemed acceptable for classification models. However, relying solely on accuracy as a performance indicator can be misleading. Therefore, various attributes have been computed to provide a more comprehensive evaluation of the model’s performance. Based on the result, the SVM model demonstrates satisfactory performance, with an accuracy of 99.17%, recall of 92%, F1-score of 96%, and an AUC of 96%.
A scatter plot of the test data is shown in Fig. 3, demonstrating how non-fraud data are clustered close to each other, while the fraudulent ones appear to be distinctively separated. The scatter plot also highlights two misclassifications of fraudulent data. This suggests that the high accuracy observed is likely not solely due to overfitting but rather because of accurate classification of non-fraudulent transactions. Since all transaction data from the original dataset were tested, the high accuracy is indicative of correct classifications for these cases.
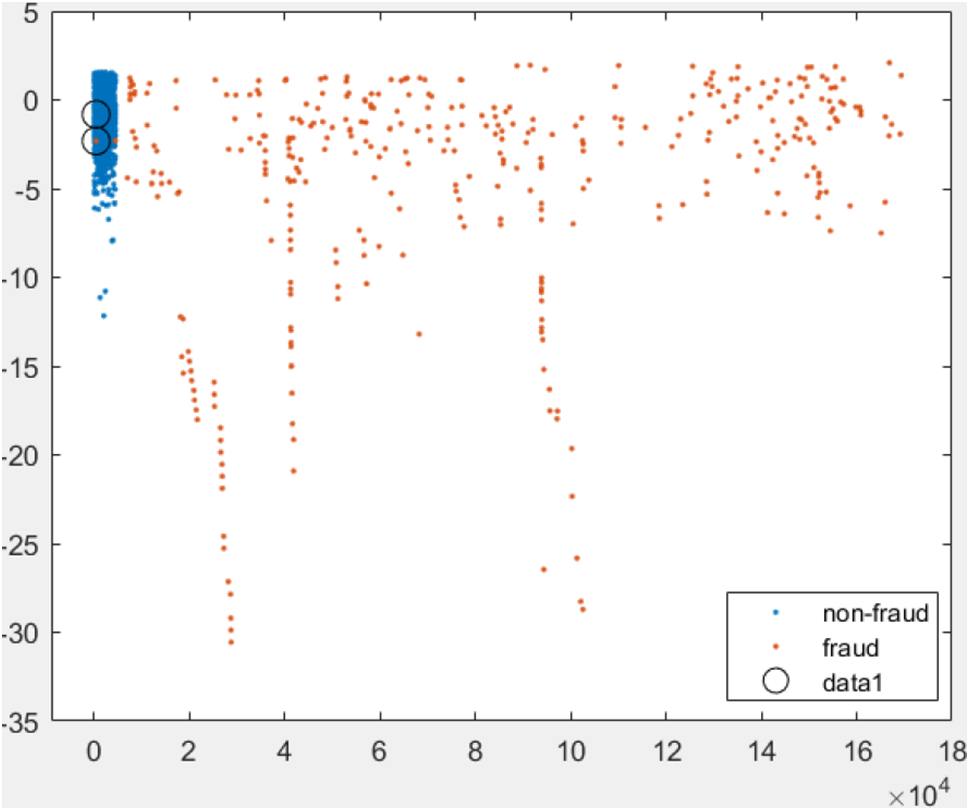
Figure 3: Scattered 2D plot of the test data using SVM machine
The KNN model exhibits accuracy above 90%, indicating acceptable predictive capabilities. However, as accuracy alone is insufficient for assessing the classifier performance, especially for imbalanced datasets, other metrics were considered.
Calculating true positive (TP), false positive (FP), true negative (TN), and false negative (FN) led to precision, recall, and F1-score calculations. In the case of KNN classifier, these metrics provide insights into its performance, particularly in handling imbalanced datasets. The F1-score and AUC values of 83% and 88.8%, respectively, support the KNN model’s solid performance. Nevertheless, the relatively lower recall at 78% suggests that the KNN model may have a slightly higher specificity in classifying false positive data compared to true positive transactions.
The decision tree model demonstrates an impressive accuracy of 99.92%, implying its capability to make highly accurate predictions. Precision stands at 0.74, recall at 0.82, and the F1-score at 0.78, indicating a well-balanced performance between precision and recall. The AUC for the decision tree model is 0.91, suggesting its effectiveness in distinguishing true fraudulent transactions. However, it is important to note that metrics other than accuracy are significantly lower. This suggests that the decision tree model may misclassify normal transactions as frauds, as indicated by the lower recall and AUC values. Overall, the model adeptly detects fraudulent transactions but may require tuning to address potential misclassifications.
The blending model achieves an accuracy of 99.963%, but, as discussed previously, accuracy can be misleading in imbalanced datasets. Therefore, other evaluation metrics like recall, F1-score, and AUC were considered for a more comprehensive assessment.
Based on the results, the blending model records values of 81%, 88% and 90.50% for recall, F1-score, and AUC, respectively. High recall suggests the model’s effectiveness in correctly identifying positive instances (credit card fraud cases) from the entire pool of actual positives in the dataset. Similarly, a high F1-score indicates a good balance between precision and recall, signifying accurate classification of both positive and negative instances. Nevertheless, the considerably higher accuracy compared to the other metrics suggests the model may misclassify normal transactions as fraud.
Overall, the F1-score and AUC of the blending model are more consistent and closely aligned. The model attains the highest accuracy while maintaining balanced values for recall, F1-score, and AUC, outperforming the individual models (SVM, KNN, DT). This improvement can be attributed to the blending model’s ability to leverage information from the base models. By combining outputs and feeding them to the meta-learner (logistic regression), the blending model effectively harnesses the strengths of each base model, resulting in enhanced predictive capabilities.
Following training and testing, the AdaBoost model is evaluated with the discussed metrics. Results show an accuracy (AC) of 99.90%, recall (RC) of 72.28%, F1-score of 73.37%, and AUC of 86.12%. While the model attains high accuracy, its performance in recall and F1-score is relatively lower.
The imbalanced dataset, where the majority class comprises non-fraudulent transactions and the minority class represents about 0.179% of the data as fraudulent transactions, explains the performance gap. The AdaBoost model may not perform well in classifying fraudulent results as a whole due to the lower score of recall and F1-score.
4.6 Comparison between Individual, Stacking and Boosting Models
This section aims to determine the most effective model for credit card fraud detection by comparing the performances of all the models examined in this study. Table 2 provides the detailed performance results for each model.
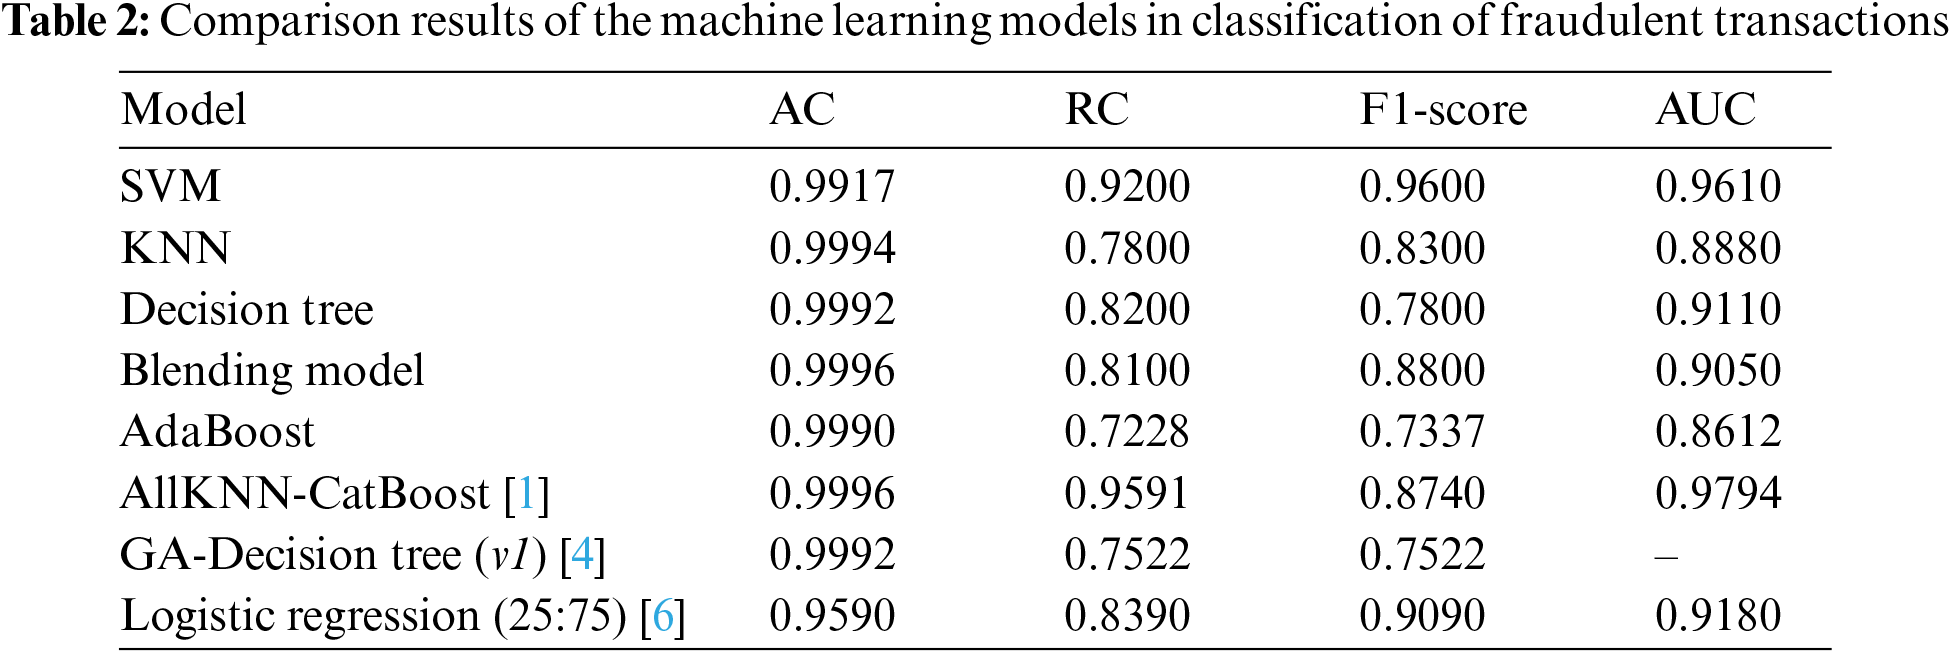
As depicted in Table 2, it is evident that SVM achieved the highest scores across all evaluation metrics except for accuracy. On the other hand, the blending model stands out with the highest accuracy of 99.96%. Nevertheless, as discussed earlier, accuracy might not be the most dependable metric for imbalanced datasets. Hence, a comprehensive assessment considering RC, F1-score, and AUC becomes crucial to evaluate the model performance.
Ensemble models, including the blending model and AdaBoost, did not achieve particularly high values for recall and F1-score when compared to individual machine learning models such as SVM, KNN, and the decision tree. This discrepancy can be attributed to the distinct approaches employed by these models. SVM aims to identify a decision boundary that maximizes the margin between classes, essentially classifying the fraudulent status of transactions based on their proximity to this boundary. In contrast, ensemble models seek to capture patterns from both majority and minority classes by adjusting weights and combining features from individual component models. While acknowledging the dataset’s inherent imbalance, we chose not to employ sampling techniques to address this issue. This decision stems from the potential pitfalls of such techniques. Under-sampling may lead to underfitting as critical information is lost due to dataset reduction, while over-sampling can result in overfitting as the model memorizes minority class instances, leading to poor generalization to new data. Instead, we opted to work with the original imbalanced dataset and devised a model that consistently performs well across various evaluation metrics.
In light of the results, the SVM model emerges as the top performer across most evaluation metrics, except for accuracy. However, given the dataset’s imbalance characteristics, the high scores in recall, F1-score, and AUC raise concerns about potential overfitting during training, which might not be apparent during testing. On the other hand, the ensemble model, particularly the blending model, excels in terms of accuracy and maintains balanced values for recall, F1-score and AUC. This suggests that the blending model may be superior choice for training on imbalanced datasets, offering robust performance without overfitting or underfitting issue.
Comparing our approach using SVM with previous works utilizing European datasets, our method outperforms all previous models in terms of F1-score. It achieves nearly identical accuracy compared to prior works but exhibit over a 3% improvement compared to logistic regression for detection. In terms of recall and AUC, our SVM model narrowly trails behind the AllKNN-CatBoost model by approximately 3% and 2%, respectively. In conclusion, our credit card fraud detection approach appears not only feasible but capable of achieving superior or comparable results when compared to models trained on sampled datasets.
One of the primary limitations of this study is the examination of a limited number of machine learning models with default parameters, primarily due to the utilization of built-in functions. To further enhance these models, future research should focus on parameter refinement for ensemble models, the integration of additional machine learning techniques into ensemble models, and exploration of alternative machine learning models. Additionally, it would be valuable to test and validate these machine learning models using datasets other than the European transaction dataset to obtain more conclusive results.
In conclusion, the development of an AI-based credit card fraud detection system necessitates meticulous consideration of various data preprocessing steps. These steps encompass addressing imbalanced datasets through sampling techniques, standardizing data to ensure consistent scaling, and selecting pertinent features for the model. Nevertheless, it is essential to note that in this study, sampling techniques were deliberately omitted to avoid potential overfitting or underfitting issues. The individual machine learning models employed in the work demonstrated commendable performance, with SVM emerging as the top-performing model. However, there is a notable concern regarding the potential overfitting of SVM to the data, which could impact its generalization capabilities for new data entries. Additionally, this might lead to extended training times due to processing of a larger dataset. Conversely, ensemble models, with particular emphasis on the blending model, outperformed AdaBoost. Ensemble learning showcased its strength in achieving consistently strong performance across various evaluation metrics. This underscores the potential of ensemble learning techniques in amalgamating multiple models to capture patterns from both majority and minority classes, rendering them more suitable for addressing credit card fraud detection challenges prevalent in the financial and banking industry. This study does come with certain limitations. The study was constrained by the limited number of machine learning models assessed for fraudulent transaction classification. Given the utilization of built-in functions without parameter adjustments, the trained models reported here may not be optimized for peak performance. Future research endeavours could explore the integration of alternative machine learning models, including deep learning, within the stacking model to further enhance the ensemble learning approach. Moreover, since the concern of imbalanced datasets persists, it is crucial to explore other datasets to arrive at a more comprehensive solution for fraudulent classification. In essence, this study contributes to the burgeoning field of credit card fraud detection by shedding light on the potential of ensemble machine learning models, particularly the blending model, as a promising avenue for improving accuracy and generalization in tackling the complexities of fraudulent transaction identification.
Acknowledgement: We extend our gratitude to all the authors and the institution who supported this research.
Funding Statement: The authors received no specific funding for this study.
Author Contributions: The authors confirm contribution to the paper as follows: study conception and design: Y. B. Chu; training and testing of the algorithm: Zhi Min Lim, Bryan Keane, Ping Hao Kong, Ahmed Rafat Elkilany, Osama Hisham Abusetta; analysis and interpretation of results: Yih Bing Chu; Zhi Min Lim, Bryan Keane, Ping Hao Kong, Ahmed Rafat Elkilany, Osama Hisham Abusetta; draft manuscript preparation: Yih Bing Chu. All authors reviewed the results and approved the final version of the manuscript.
Availability of Data and Materials: The dataset used in the study is publicly available and can be accessed through the URL: https://www.kaggle.com/datasets/mlg-ulb/creditcardfraud.
Conflicts of Interest: The authors declare that they have no conflicts of interest to report regarding the present study.
References
1. N. S. Alfaiz and S. M. Fati, “Enhanced credit card fraud detection model using machine learning,” Electronics, vol. 11, no. 4, pp. 662, 2022. [Google Scholar]
2. V. N. Dornadula and S. Geetha, “Credit card fraud detection using machine learning algorithms,” Procedia Computer Science, vol. 165, pp. 631–641, 2019. [Google Scholar]
3. J. K. Afriyie, K. Tawiah, W. A. Pels, S. Addai-Henne, H. A. Dwamena et al., “A supervised machine learning algorithm for detecting and predicting fraud in credit card transactions,” Decision Analytics Journal, vol. 6, no. 2, pp. 100163, 2023. [Google Scholar]
4. E. Ileberi, Y. Sun and Z. Wang, “A machine learning based credit card fraud detection using the GA algorithm for feature selection,” Journal of Big Data, vol. 9, no. 1, pp. 24, 2022. [Google Scholar]
5. The Credit Card Fraud. [Online]. Available: https://www.kaggle.com/datasets/mlg-ulb/creditcardfraud (accessed on 28/04/2022) [Google Scholar]
6. F. Itoo, Meenakshi and S. Singh, “Comparison and analysis of logistic regression, Naive Bayes and KNN machine learning algorithms for credit card fraud detection,” International Journal of Information Technology, vol. 13, no. 4, pp. 1503–1511, 2021. [Google Scholar]
7. M. Zareapoor and P. Shamsolmoali, “Application of credit card fraud detection: Based on bagging ensemble classifier,” Procedia Computer Science, vol. 48, no. 1, pp. 679–685, 2015. [Google Scholar]
8. R. C. Chen, S. T. Luo, X. Liang and V. C. S. Lee, “Personalized approach based on SVM and ANN for detecting credit card fraud,” in 2005 Int. Conf. on Neural Networks and Brain, Beijing, China, pp. 810–815, 2005. [Google Scholar]
9. M. Alamri and M. Ykhlef, “Survey of credit card anomaly and fraud detection using sampling techniques,” Electronics, vol. 11, no. 23, pp. 4003, 2022. [Google Scholar]
10. R. Maneesha, “Fraud detection in transaction data using KNN,” Kaggle. [Online]. Available: https://www.kaggle.com/code/maneesha96/fraud-detection-in-transaction-data-using-knn (accessed on 19/07/2023) [Google Scholar]
11. L. Breiman, J. H. Friedman, R. A. Olshen and C. J. Stone, “Introduction to tree classification,” in L. Breiman (Ed.Classification and Regression Trees, pp. 18–55, New York, USA: Routledge, 2017. https://doi.org/10.1201/9781315139470 [Google Scholar] [CrossRef]
12. J. Han, M. Kamber and J. Pei, “Classification: Basic concepts,” in J. Han, M. Kamber and J. Pei (Eds.Data Mining: Concepts and Techniques, pp. 327–391, Waltham, USA: Morgan Kaufmann, 2012. https://doi.org/10.1016/B978-0-12-381479-1.00017-4 [Google Scholar] [CrossRef]
13. L. Rokach, “Ensemble-based classifiers,” Artificial Intelligence Review, vol. 33, no. 1–2, pp. 1–39, 2010. [Google Scholar]
14. H. Zhang and B. Singer, “Classification trees for a binary response,” in H. Zhang and B. Singer (Eds.Recursive Partitioning and Applications, pp. 31–62, New York, USA: Springer Science & Business Media, 2010. https://doi.org/10.1007/978-1-4419-6824-1 [Google Scholar] [CrossRef]
15. S. Misra, H. Li and J. He, “Noninvasive fracture characterization based on the classification of sonic wave travel times,” in S. Misra, H. Li and J. He (Eds.Machine Learning for Subsurface Characterization, pp. 243–287, Cambridge, USA: Gulf Professional Publishing, 2020. https://doi.org/10.1016/B978-0-12-817736-5.09995-6 [Google Scholar] [CrossRef]
16. R. Wang, “AdaBoost for feature selection, classification and its relation with SVM, a review,” Physics Procedia, vol. 25, no. 5, pp. 800–807, 2012. [Google Scholar]
17. K. Randhawa, C. K. Loo, M. Seera, C. P. Lim and A. K. Nandi, “Credit card fraud detection using AdaBoost and majority voting,” IEEE Access, vol. 6, pp. 14277–14284, 2018. [Google Scholar]
18. B. S. S. Chowdary and J. C. Kumaran, “Comparing the accuracy in credit card fraud detection using XGBoost comparing with novel AdaBoost,” European Chemical Bulletin, vol. 12, pp. 4655–4660, 2023. [Google Scholar]
19. “Stacking in machine learning,” javaTpoint. [Online]. Available: https://www.javatpoint.com/stacking-in-machine-learning (accessed on 24/07/2023) [Google Scholar]
20. R. Soleymanzadeh, M. Aljasim, M. W. Qadeer and R. Kashef, “Cyberattack and fraud detection using ensemble stacking,” AI, vol. 3, no. 1, pp. 22–36, 2022. [Google Scholar]
21. F. K. Alarfaj, I. Malik, H. U. Khan, N. Almusallam, M. Ramzan et al., “Credit card fraud detection using state-of-the-art machine learning and deep learning algorithms,” IEEE Access, vol. 10, pp. 39700–39715, 2022. [Google Scholar]
22. N. Rtayli and N. Enneya, “Selection features and support vector machine for credit card risk identification,” Procedia Manufacturing, vol. 46, pp. 941–948, 2020. [Google Scholar]
23. Z. Salekshahrezaee, J. L. Leevy and T. M. Khoshgoftaar, “The effect of feature extraction and data sampling on credit card fraud detection,” Journal of Big Data, vol. 10, no. 1, pp. 6, 2023. [Google Scholar]
Cite This Article
 Copyright © 2023 The Author(s). Published by Tech Science Press.
This work is licensed under a Creative Commons Attribution 4.0 International License , which permits unrestricted use, distribution, and reproduction in any medium, provided the original work is properly cited.
 Downloads
 Citation Tools