
 Submit a Paper
 Propose a Special lssue
 Open Access
ARTICLE

Identification of Cardiac Risk Factors from ECG Signals Using Residual Neural Networks
Department of Electronics Engineering, Madras Institute of Technology, Anna University, Chennai, 600044, India
* Corresponding Author: Vignesh Ochathevan. Email:
Congenital Heart Disease 2025, 20(4), 477-501. https://doi.org/10.32604/chd.2025.070372
Received 15 July 2025; Accepted 05 September 2025; Issue published 18 September 2025
 View Full Text
 Download PDF
Abstract
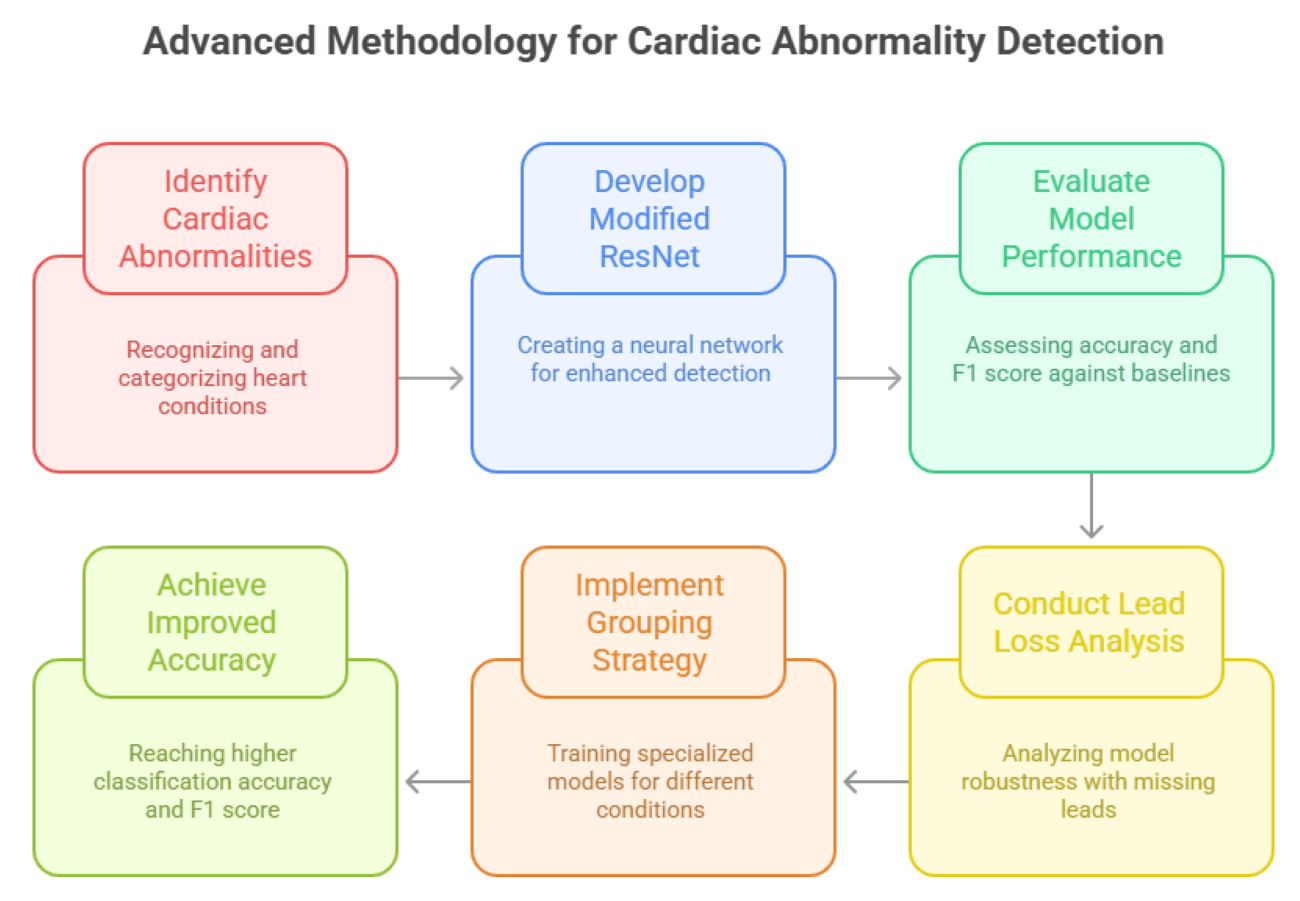
Background: The accurate identification of cardiac abnormalities is essential for proper diagnosis and effective treatment of cardiovascular diseases. Method: This work introduces an advanced methodology for detecting cardiac abnormalities and estimating electrocardiographic age (ECG Age) using sophisticated signal processing and deep learning techniques. This study looks at six main heart conditions found in 12-lead electrocardiogram (ECG) data. It addresses important issues like class imbalances, missing lead scenarios, and model generalizations. A modified residual neural network (ResNet) architecture was developed to enhance the detection of cardiac abnormalities. Results: The proposed ResNet demonst rated superior performance when compared with two linear models and an alternative ResNet architectures, achieving an overall classification accuracy of 91.25% and an F1 score of 93.9%, surpassing baseline models. A comprehensive lead loss analysis was conducted, evaluating model performance across 4096 combinations of missing leads. The results revealed that pulse rate-based factors remained robust with up to 75% lead loss, while block-based factors experienced significant performance declines beyond the loss of four leads. Conclusion: This analysis highlighted the importance of addressing lead loss impacts to maintain a robust model. To optimize performance, targeted training approaches were developed for different conditions. Based on these insights, a grouping strategy was implemented to train specialized models for pulse rate-based and block-based conditions. This approach resulted in notable improvements, achieving an overall classification accuracy of 95.12% and an F1 score of 95.79%.Graphic Abstract
Keywords
Cardiovascular disorders account for 32% of global fatalities, nearly 17.9 million per year, underscoring the vital necessity for precise and prompt diagnosis [1]. Electrocardiograms (ECGs) play a vital role in cardiac health by analyzing voltage changes generated by the heart’s electrical conduction system; ECGs provide essential insights into the heart’s rhythm, rate, and functionality, enabling the diagnosis of conditions such as arrhythmias, conduction blocks, and structural heart diseases.
Traditional methods for interpreting Electrocardiogram (ECG) signals rely on manual analysis by healthcare professionals, involving the visual inspection of tracings to identify abnormalities such as left bundle branch block (LBBB), right bundle branch block (RBBB), 1st-degree atrio-ventricular block (1dAVB), sinus bradycardia (SB), sinus tachycardia (ST), and atrial fibrillation (AF). This process requires expertise and careful evaluation of wave forms, intervals, and rhythms. However, manual interpretation is prone to challenges such as observer variability, fatigue, and diagnostic errors, particularly in subtle or complex cases. These limitations increase the risk of missed diagnoses or false positives, especially in critical scenarios such as predicting heart attacks.
To address these issues, automated approaches leveraging advanced deep learning techniques have emerged as a promising solution. A 12-lead ECG, the global standard for cardiac assessment, provides detailed information about the heart’s electrical activity through a combination of limb and chest leads. This configuration enables the detection of localized abnormalities and enhances diagnostic accuracy compared to simpler ECG setups.
Recent breakthroughs in deep learning, especially convolutional neural networks (CNNs) and residual neural networks (ResNets), have markedly enhanced the automated processing of ECG signals. CNNs excel in detecting localized waveform patterns, while ResNets, with their skip connections, enable deeper architectures that effectively capture subtle signal variations and long-term dependencies. Additionally, the concept of ECG Age provides a novel perspective on cardiac health, reflecting physiological heart age and offering insights into underlying cardiovascular conditions [2].
Beyond cardiac monitoring, integrating novel therapeutic and biomedical approaches is crucial. For instance, natural compounds like xanthohumol have shown potential in mitigating cardiac fibroblast activation via PTEN/Akt/mTOR pathways, highlighting opportunities for pharmacological intervention in cardiovascular disorders [1]. Moreover, advancements in secure medical data sharing in internet of medical things (IoMT) applications ensure that sensitive patient information, including ECG data, can be analyzed safely for clinical and research purposes [3].
This combination of advanced technologies and methodologies addresses traditional challenges, including class imbalance and missing lead scenarios, paving the way for more reliable and scalable solutions for cardiac abnormality detection and heart health monitoring.
The organization of this paper is as follows. Section 2 reviews the related works in automated ECG analysis. Section 3 describes the proposed work, including the dataset used, preprocessing methods, train–validation–test split, and hyperparameter tuning strategy. Section 4 presents residual learning and highlights its advantages in ECG signal classification. Section 5 discusses heart abnormality detection, including the proposed model, comparative models, and a baseline model. Section 6 reports the experimental results and performance evaluation. Section 7 analyzes the effect of model performance in situations of lead loss. Finally, Section 8 concludes the study and outlines directions for future work.
Ribeiro et al. investigated the potential of deep neural networks to automate ECG analysis, offering an end-to-end learning approach over traditional manual feature extraction [1]. Using the CODE dataset of over 2 million ECGs, their ResNets achieved very high F1 score, outperforming cardiology residents in detecting arrhythmias. Lima et al. highlighted advancements in deep neural network applications, including ECG-age prediction to estimate biological age as a cardiovascular risk marker. The study demonstrated the effectiveness of ResNets in identifying subtle abnormalities and predicting mortality risk using datasets like CODE-15%, achieving significant improvements in prediction accuracy [2].
Dhyani et al. proposed using 3D discrete wavelet transform for ECG signal preprocessing and feature extraction, paired with support vector machines [3]. The model achieved 99.02% accuracy in arrhythmia classification, outperforming alternative methods like complex support vector machines. Mengze et al. developed a 12-layer Convolutional Neural Network (CNN) for arrhythmia classification, introducing wavelet self-adaptive threshold denoising to isolate key features [4]. Their model achieved 97.41% classification accuracy, surpassing blood pressure neural networks and random forest classifiers.
Wu et al. created an automated deep learning algorithm for digitizing paper-based ECGs, facilitating integration into machine learning applications [5]. Their model achieved a 99% correlation between digitized and ground-truth signals, enabling robust classification of conditions like atrial fibrillation and left ventricular dysfunction. Wan et al. introduced an enhanced CNN for identity recognition using ECG signals, integrating feature extraction and classification into a unified process [6]. The model achieved 98.49% accuracy on single-lead ECGs and 99.35% on multi-lead signals, significantly outperforming Linear discriminant analysis (LDA) methods. Sankar et al. combined CNNs, Long Short-Term Memory Networks, and autoencoders to predict cardiovascular diseases using ECG data. The hybrid model achieved a cardiovascular disease prediction accuracy of 97%, particularly excelling in handling noise and missing data [7].
Raymond et al. applied deep learning to ECG images instead of raw signals, enabling diagnostics in regions with limited access to digital ECG systems [8]. Their CNN-based model achieved performance comparable to signal-based approaches with high sensitivity and specificity. Holmstrom et al. (2024) created a deep learning model for sudden cardiac death prediction using 12-lead ECGs, leveraging the entire waveform instead of specific features [9]. The model achieved an Area Under the Receiver Operating Characteristic Curve (AUROC) of 0.889, outperforming conventional risk stratification tools. Andrew et al. enhanced sudden cardiac death risk stratification by combining five key ECG abnormalities into a cumulative risk score [10]. Their approach demonstrated superior predictive accuracy compared to individual ECG markers in both internal and external cohorts.
Panjaitan et al. employed heart rate variability (HRV) analysis with a 1D-CNN wavenet model to detect sudden cardiac death early, analyzing ECG signals segmented into 5-min intervals [11]. The model achieved 99.30% accuracy, 97% sensitivity, and 99.60% specificity, showcasing its potential for clinical use.
Kolk et al. employed multimodal artificial intelligence (AI) models integrating ECG, imaging, and clinical data to enhance sudden cardiac death risk prediction [12]. Their approach personalized risk assessments, outperforming traditional methods by capturing subtle nonlinear patterns in large-scale datasets.
Hayıroğlu and Altay reviewed the role of AI in coronary artery disease (CAD) and AF, highlighting applications in diagnosis, risk prediction, therapy guidance, and monitoring. They noted that AI models using multimodal data can outperform traditional methods in detecting CAD risk factors, predicting restenosis, and managing arrhythmias. The paper also emphasized the potential of deep learning and reinforcement learning for personalized treatment, while recognizing challenges such as data quality, model generalizability, and ethical concerns [13].
Cicek et al. developed a multimodal deep learning (mmDL) model to predict 30-day mortality in acute pulmonary embolism (PE) patients, integrating CT angiography with clinical and demographic data. Using 207 cases, their framework combined 3D residual neural network (ResNet) feature extraction with XGBoost classification, achieving an Area Under the Curve (AUC) of 0.98 and significantly outperforming the PE severity index (AUC 0.86). The study demonstrated that imaging features and biomarkers such as B-type natriuretic peptide (BNP) and tricuspid annular plane systolic excursion (TAPSE) enhance prognostic accuracy, highlighting the potential of deep learning to surpass traditional risk scores in guiding early, personalized PE management [14].
Alkhodari et al. investigated deep learning approaches for automated arrhythmia detection using ECG signals, addressing limitations of manual interpretation and traditional machine learning [15]. They employed convolutional and recurrent neural networks to classify arrhythmias from benchmark datasets, achieving high accuracy and demonstrating the effectiveness of end-to-end learning in extracting temporal and morphological ECG features. The study emphasized the potential of deep learning to enhance diagnostic reliability and reduce clinician workload, while noting challenges such as data imbalance, noise sensitivity, and the need for clinical validation.
Wang et al. presented a multicenter evaluation of the neuroendoscopic parafascicular evacuation of spontaneous intracerebral hemorrhage (NESICH) technique [16], designed as a minimally invasive approach to preserve the corticospinal tract while maximizing clot removal. In a cohort of 154 patients with deep supratentorial intracerebral hemorrhage (ICH), the method achieved an average hematoma clearance of 89%, with low rebleeding (3.2%) and 30-day mortality (7.8%). At six months, 58.4% of patients attained favorable outcomes (mRS 0–3), supporting the feasibility and safety of NESICH compared to conventional craniotomy. The authors emphasized its potential to improve functional recovery in ICH, while noting the need for randomized trials to validate long-term benefits.
The dataset used in this study is a subset of the CODE dataset, specifically the CODE-15% dataset (https://github.com/antonior92/ml4ecg-resources?tab=readme-ov-file (accessed on 04 September 2025)), comprising 345,779 ECG exams collected from 233,770 patients between 2010 and 2016. This data was gathered by the Telehealth Network of Minas Gerais, which serves rural and underserved regions in Brazil. Designed to facilitate automated ECG analysis, the dataset includes comprehensive information on both ECG tracings and associated patient metadata. Variability in signal duration, ranging from 7 to 10 s, was addressed by zero-padding, resulting in uniform signal lengths of 4096 samples across all 12 leads. The ECG tracings, stored as multichannel time-series data, represent 12-lead ECG recordings corresponding to various body positions [17].
In addition to the tracings, the dataset includes patient metadata and labels essential for training models to detect cardiac abnormalities. This metadata comprises patient age, sex, and diagnostic labels indicating the presence of specific cardiac conditions, including 1dAVb, RBBB, LBBB, SB, ST, and AF. Normal ECG classifications are also included, and each exam is uniquely identified by an exam ID. This structured and standardized dataset forms a robust foundation for advancing automated ECG analysis.
Efficient preprocessing of ECG signals is crucial for the precise identification of cardiac anomalies, as unprocessed ECG data generally includes noise generated during acquisition. Various studies in the literature, including the work by Ribeiro et al. [1] that utilized the CODE-15% dataset, do not explicitly describe significant noise-removal techniques in their preprocessing pipelines. The absence of such steps can adversely affect the quality of the data and, consequently, the performance of machine learning models. To address these challenges, a comprehensive preprocessing pipeline was designed to eliminate natural noise commonly encountered in real-world ECG recordings, thereby enhancing the suitability of the data for analysis.
The raw ECG data in the CODE-15% dataset includes substantial noise such as, power line interference, baseline wander and muscle noise as shown in Fig. 1, all of which can distort the signal and obscure critical features.
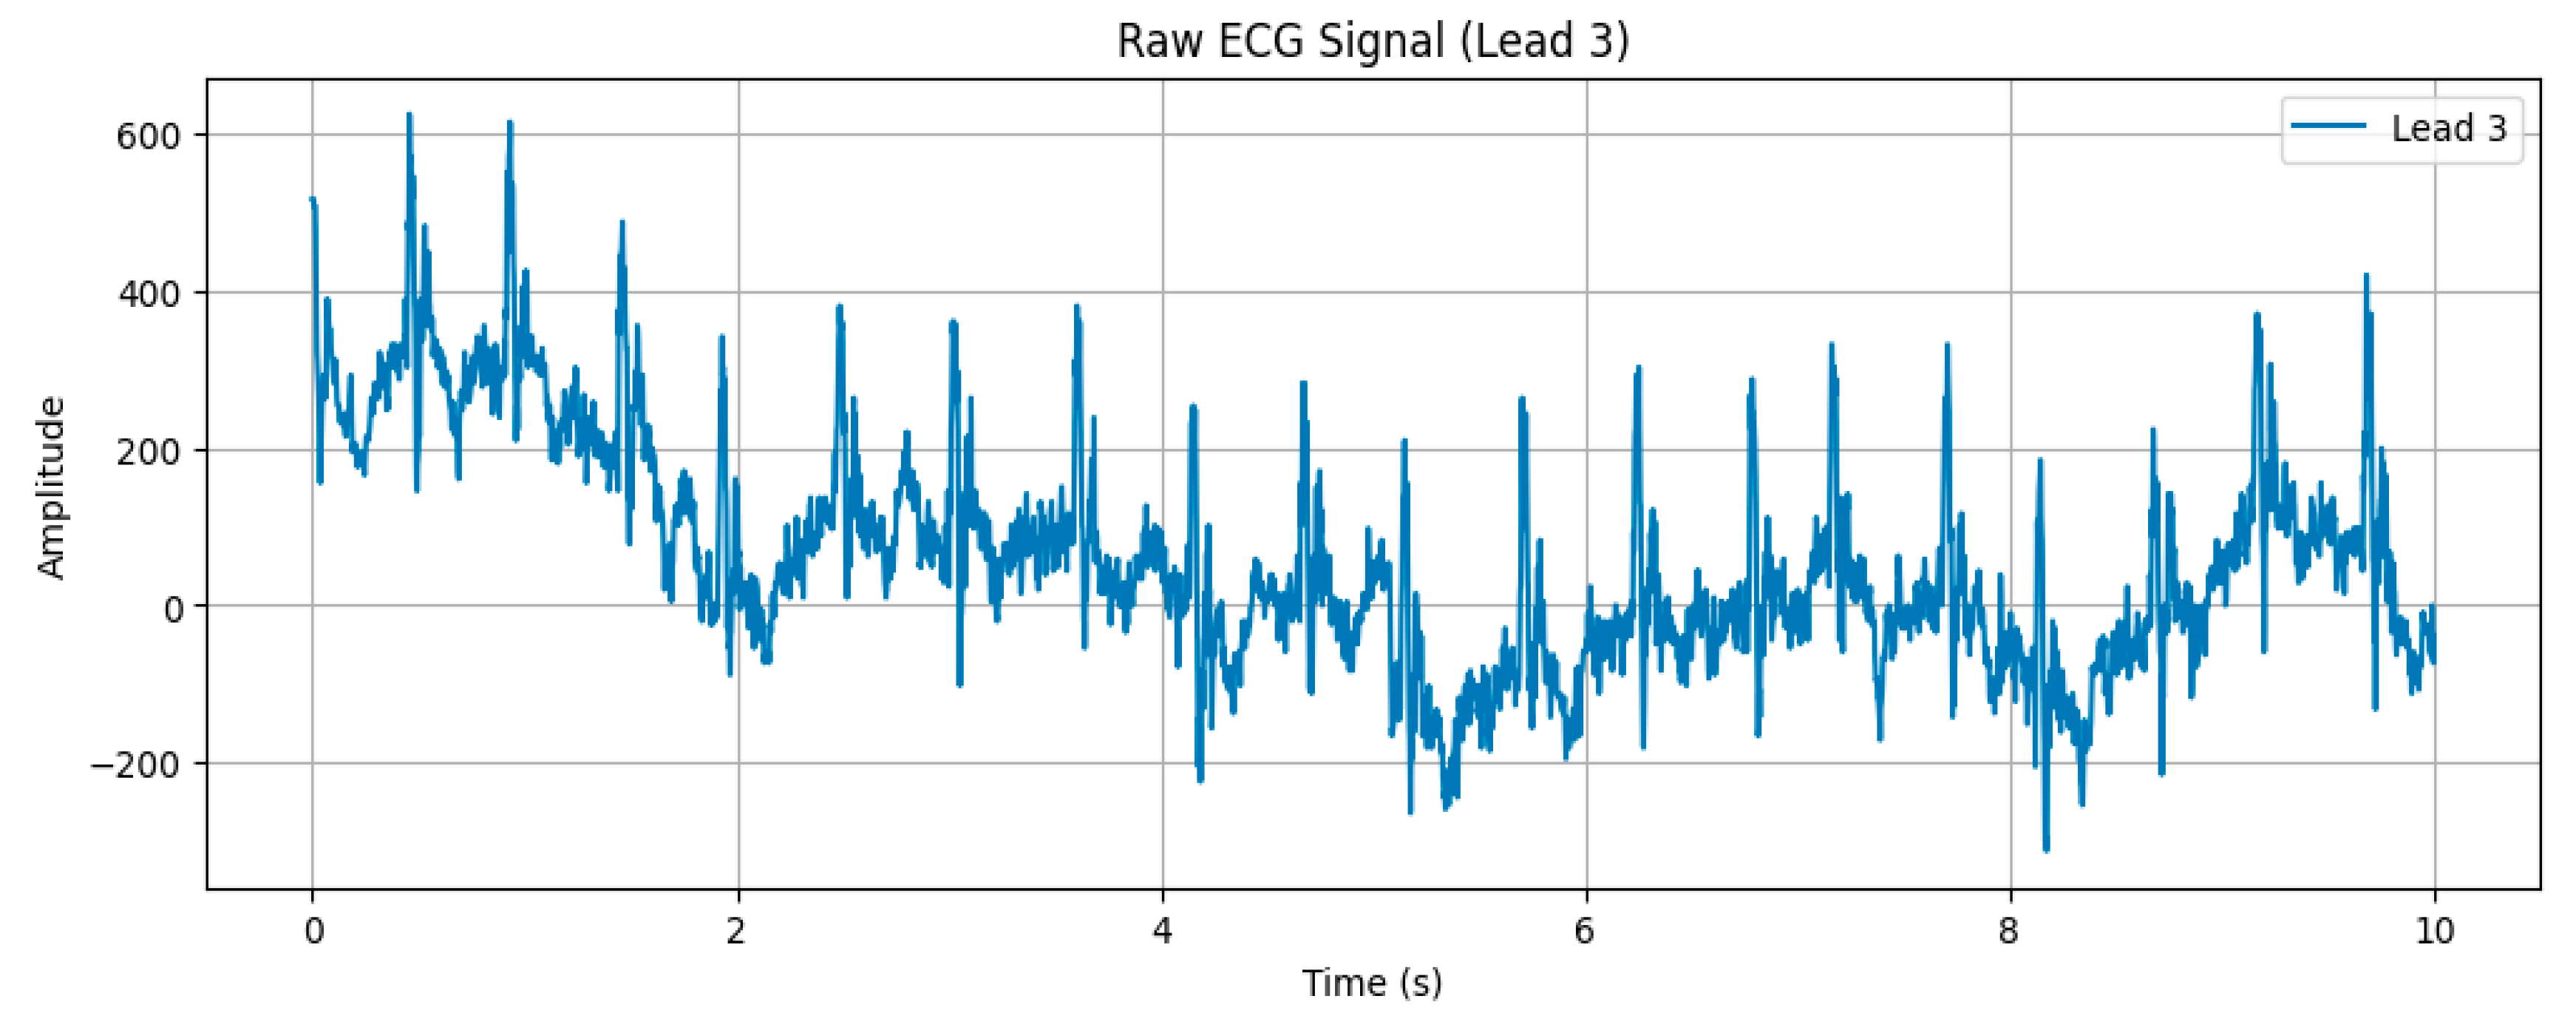
Figure 1: A raw and unprocessed ECG signal (Lead 3).
To mitigate these issues, a high-pass filter with a cutoff frequency of 0.5 Hz was employed to remove low-frequency noise and baseline wander. This step eliminates slow fluctuations in the ECG signal while retaining high-frequency components that are diagnostically relevant. Furthermore, a notch filter was applied to suppress 50 Hz power line interference, a common environmental artefact. By specifically targeting this frequency, the notch filter ensures minimal signal distortion. Fig. 2 illustrates the effectiveness of these filtering techniques in comparison to the raw signal in Fig. 1 in reducing high- and low-frequency noise.
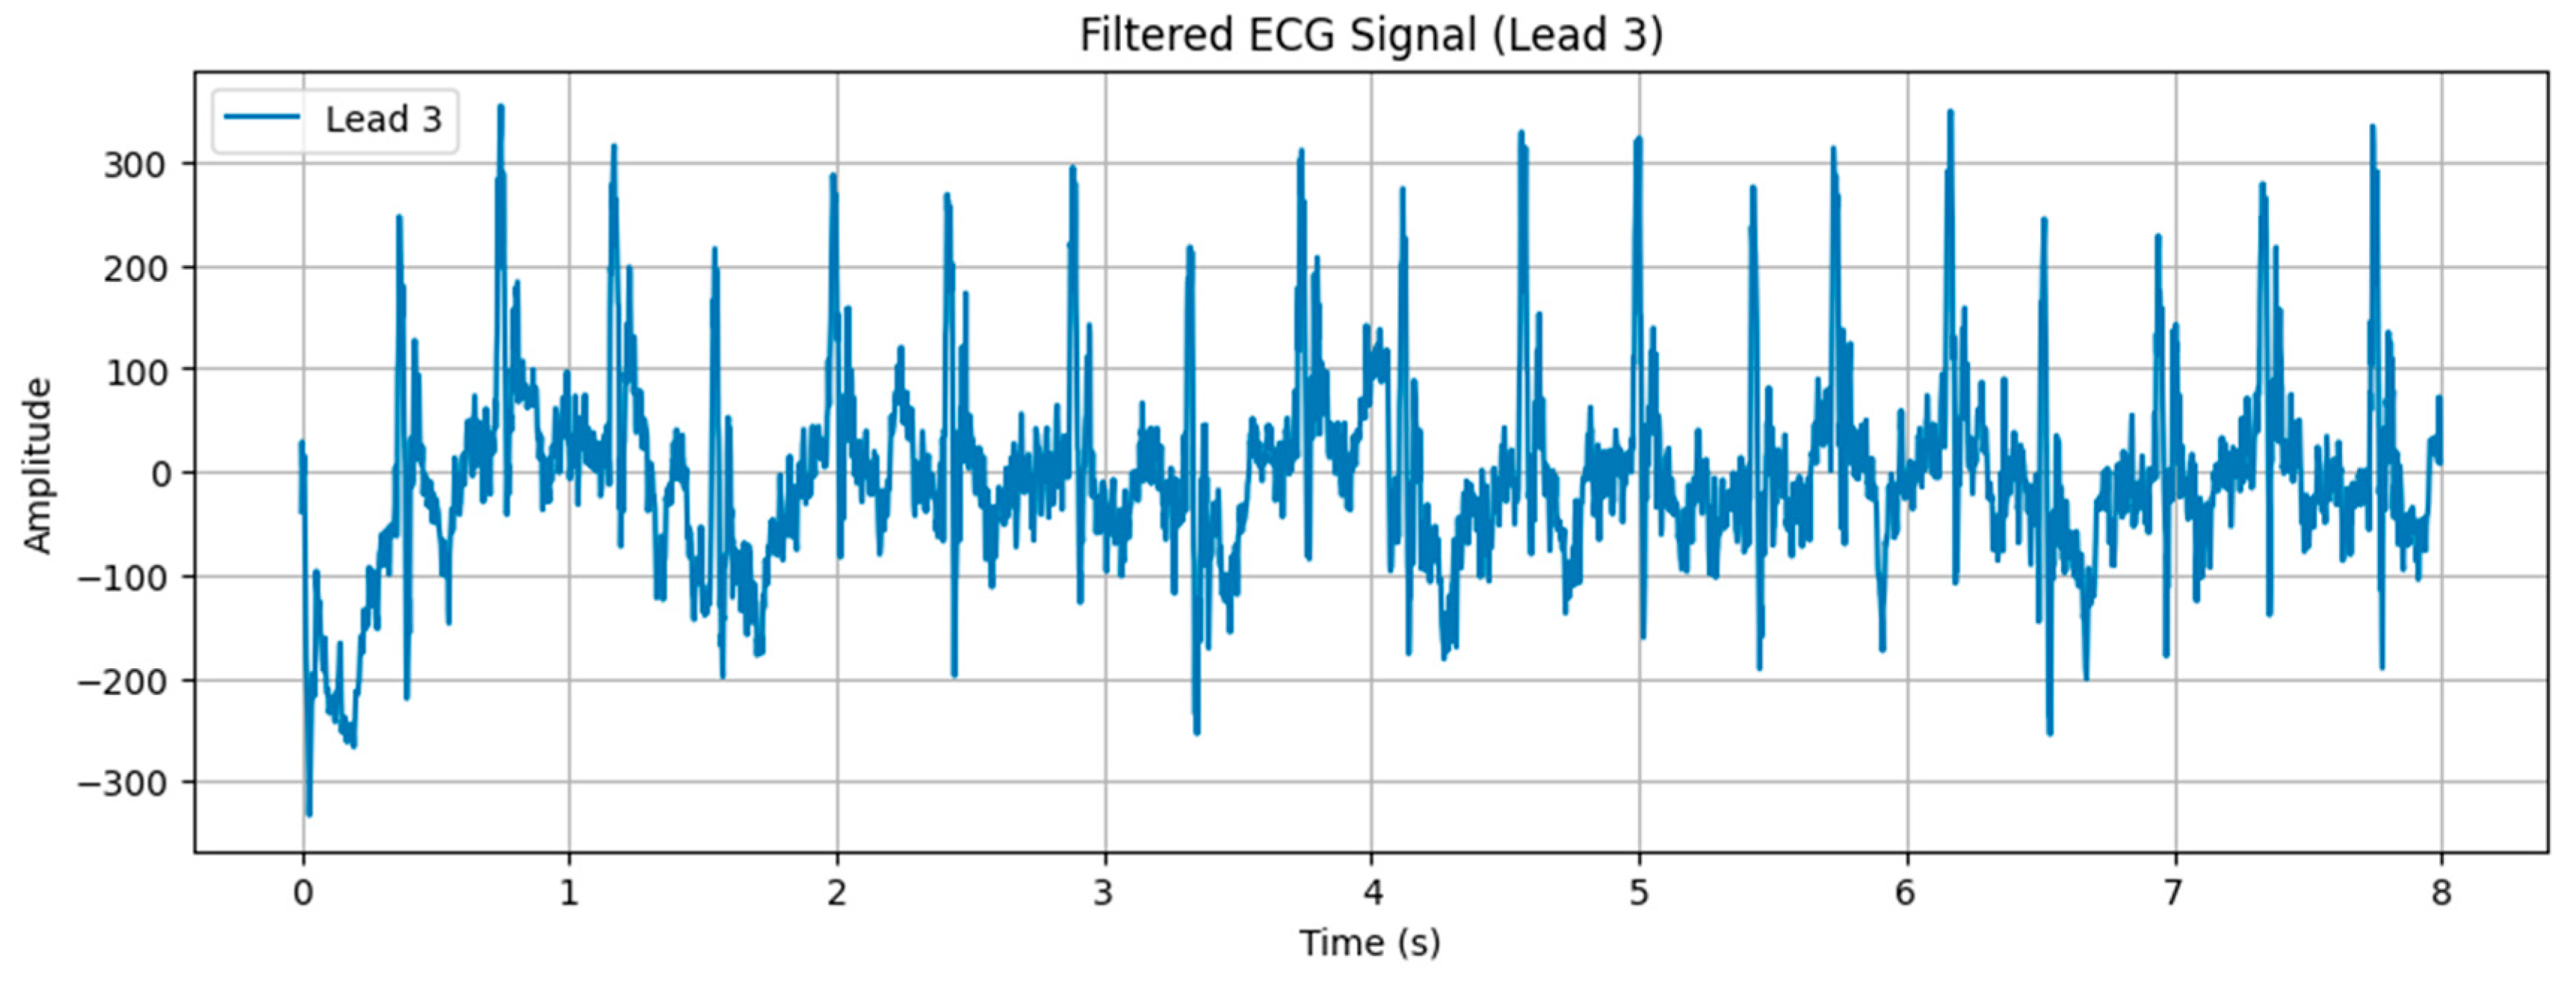
Figure 2: Filtered ECG signal (Lead 3).
Baseline wander, a slow-varying component caused by factors such as respiration and electrode drift, was addressed using morphological filtering. This technique involved a sequence of opening-closing (OC) and closing-opening (CO) operations. These operations were performed iteratively to ensure robust noise removal while preserving key features of the ECG signal. The width of the structural element used in morphological filtering was determined based on the sampling frequency and a predefined width factor. The filtering process began with an OC operation followed by CO filtering and then reversed the order to apply CO-OC operations for enhanced robustness. Fig. 3 demonstrates the ECG signal after baseline wander removal, highlighting the elimination of slow-varying noise.
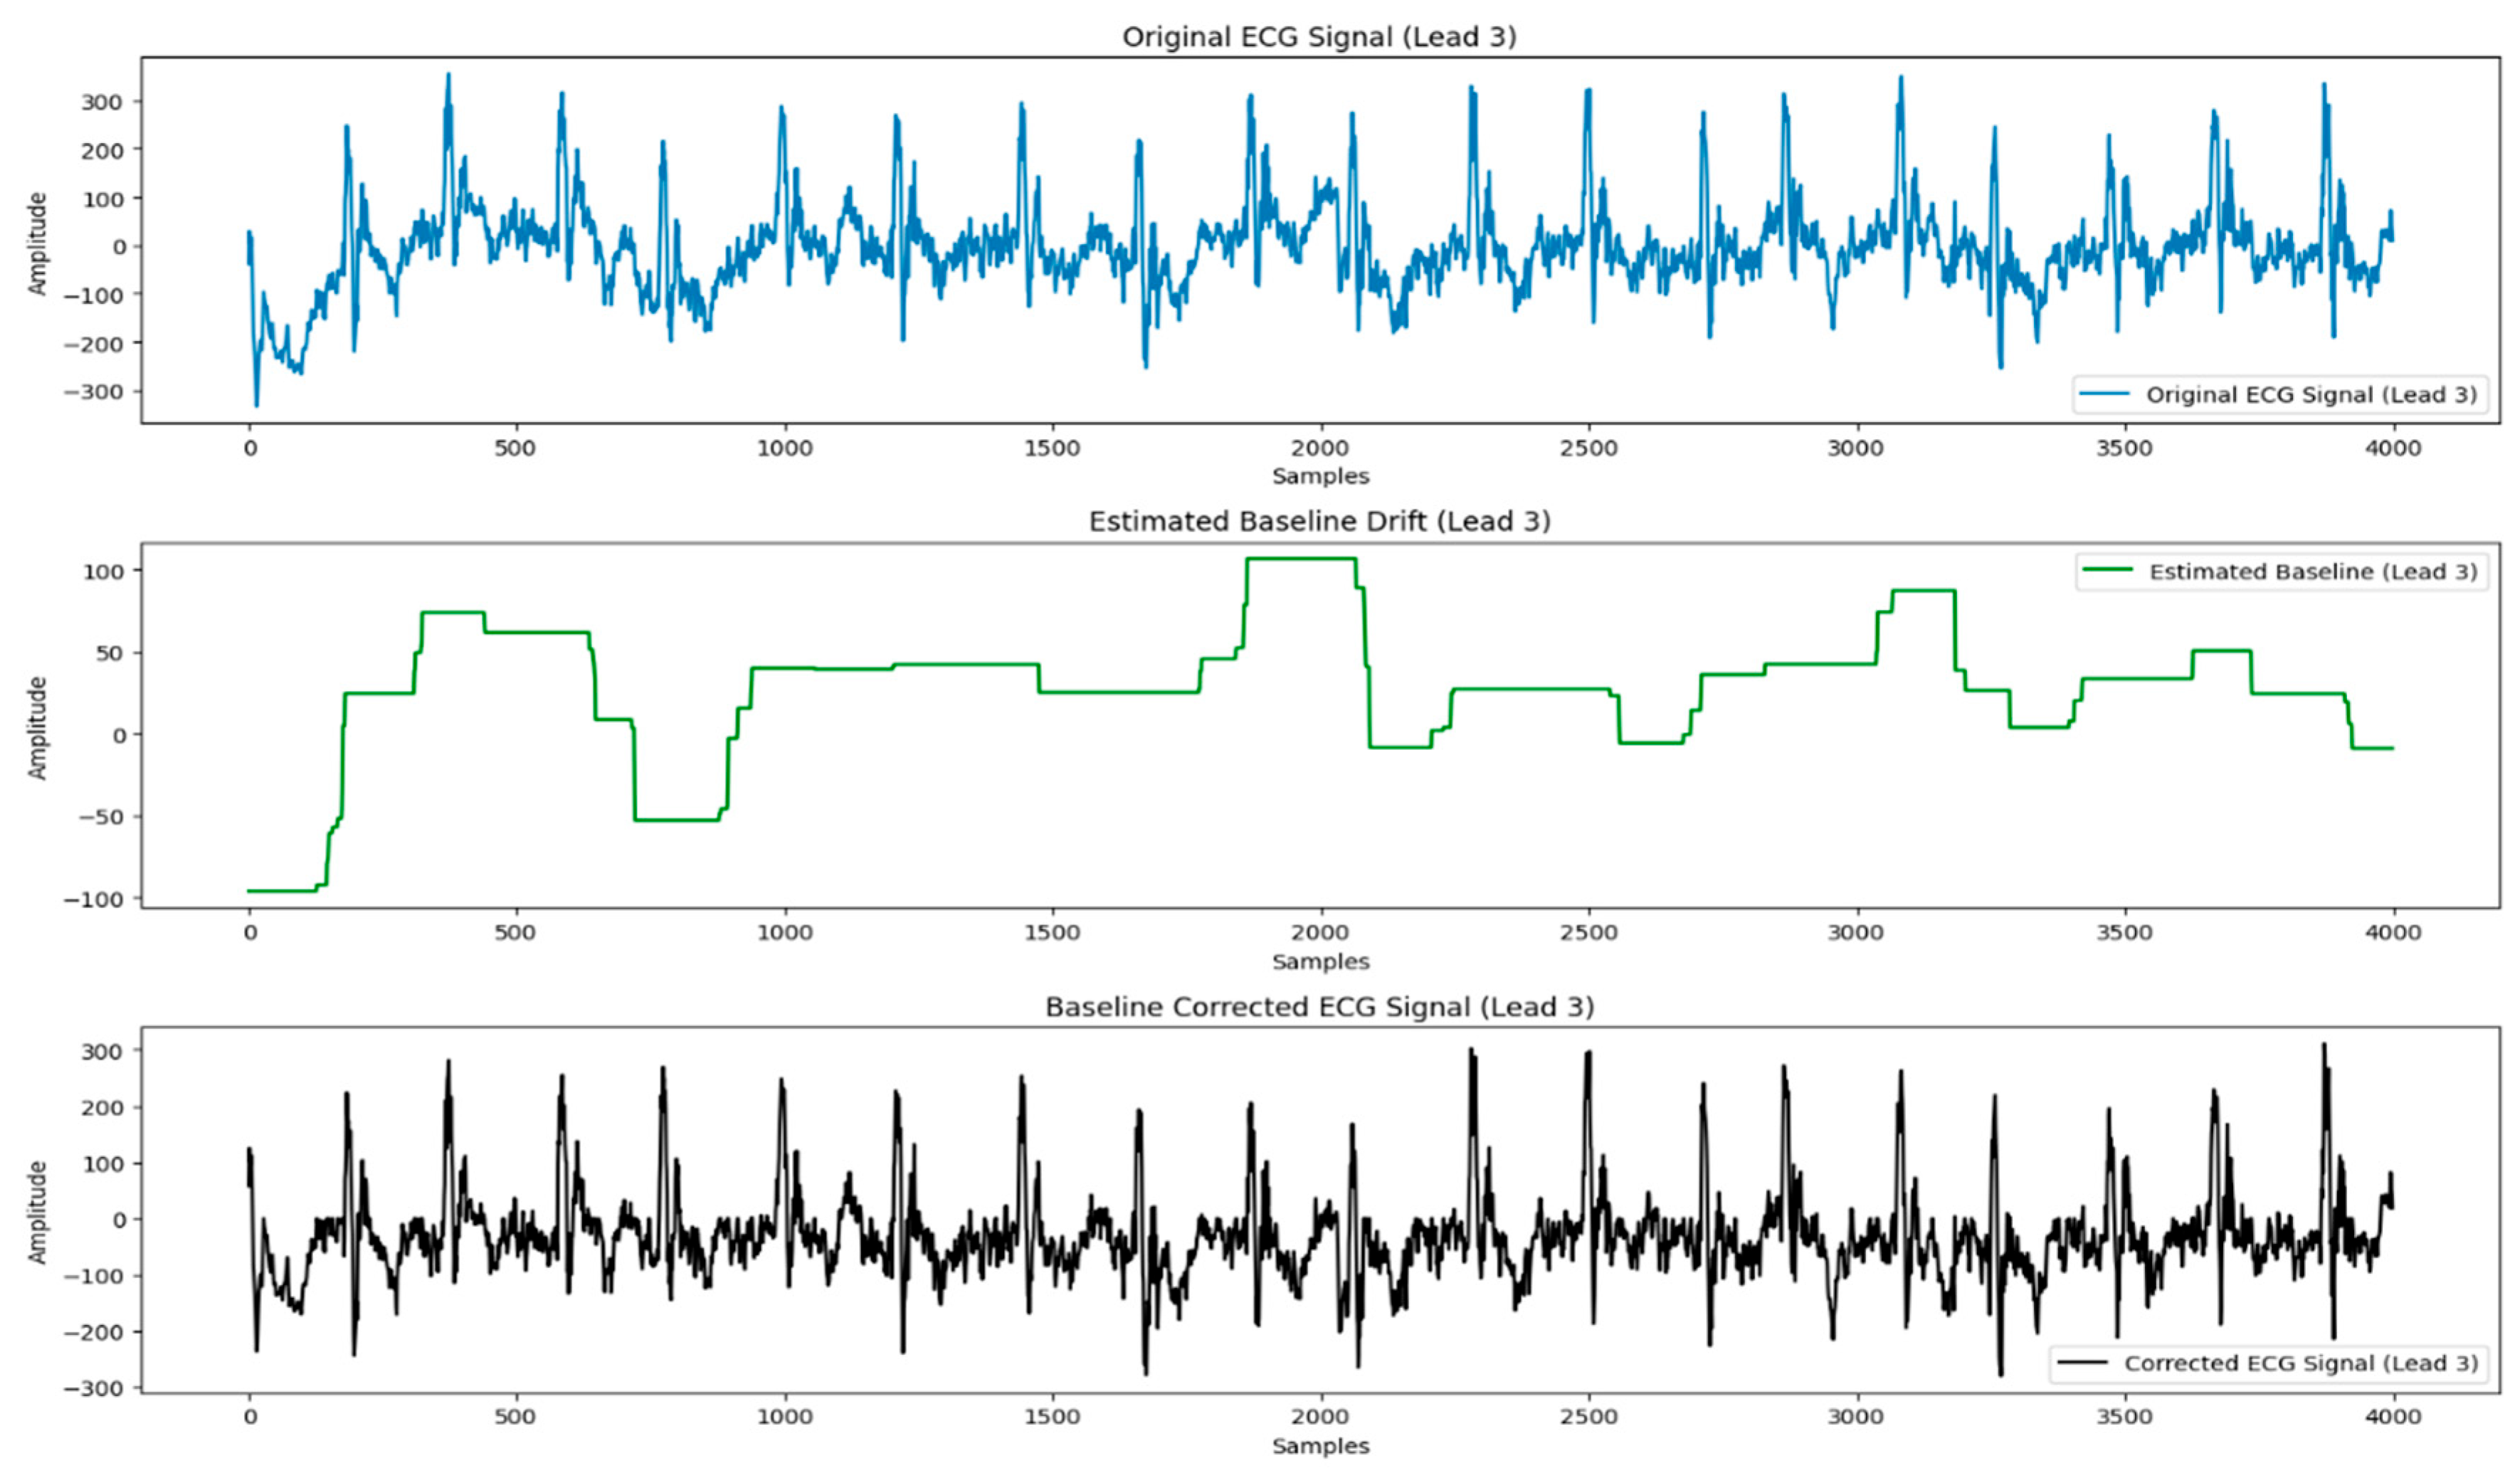
Figure 3: Base line corrected ECG signal (Lead 3).
Wavelet transforms were then employed for de-noising, using the db4 wavelet (Daubechies wavelet with 4 vanishing moments). This method effectively balances smoothness and localization, making it highly suitable for capturing and suppressing both high-frequency and low-frequency noise. The wavelet transform preserves the essential features of the ECG signal while removing artifacts such as muscle noise and electrical interference. Fig. 4 shows the denoised ECG signal with significant suppression of such artifacts.
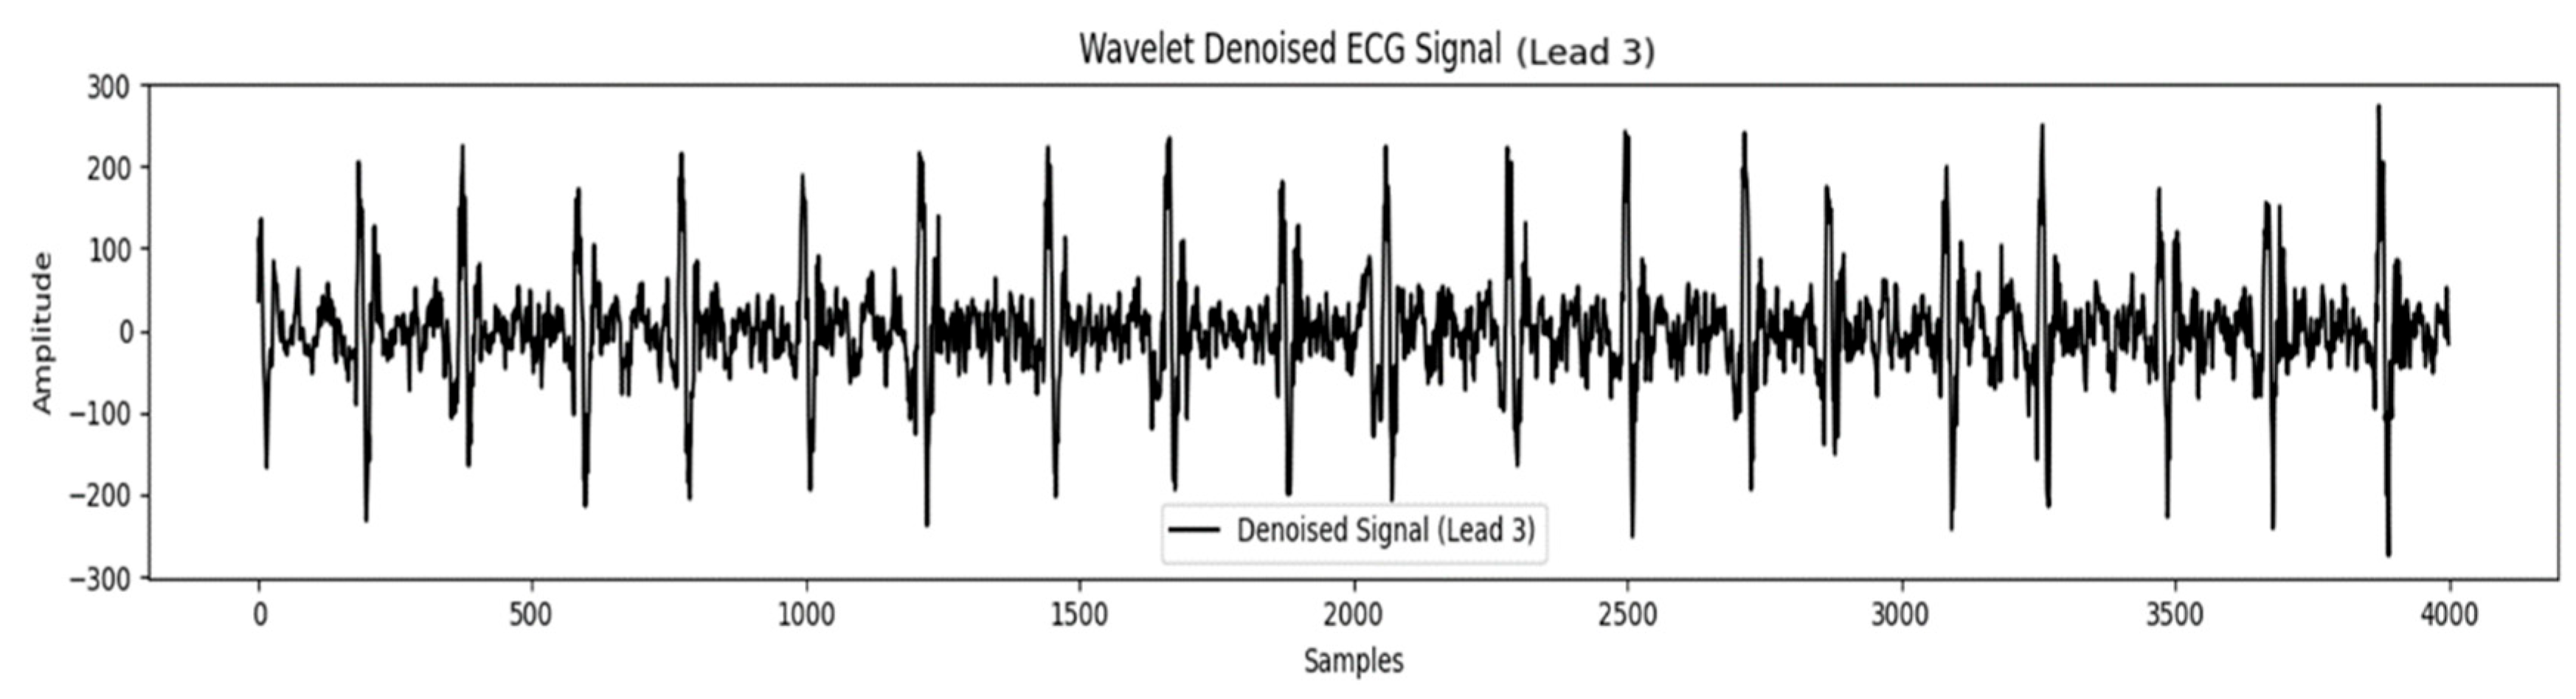
Figure 4: Wavelet denoised ECG signal (Lead 3).
After completing these preprocessing steps, the cleaned ECG signals were saved as tensors with a standardized shape of (4096, 12). Each tensor corresponds to a 10-s ECG recording sampled at 400 Hz, where 4096 represents the number of samples per lead, and 12 corresponds to the number of leads in the recording. These processed and structured data representations, illustrated in Fig. 4, served as input to the neural network for training and evaluation. This preprocessing pipeline ensures high-quality ECG signals, laying the foundation for improved model performance and robust cardiac abnormality detection.
3.3 Train-Validation-Test Split
The dataset includes 172,432 samples with a significant class imbalance across the various ECG abnormalities. Normal ECGs dominate the dataset, representing 78.09% of the total samples, while the remaining abnormalities are distributed as follows: 1dAVb at 3.31%, RBBB at 5.61%, LBBB at 3.49%, SB at 3.25%, ST at 4.40%, and AF at 4.08%. This imbalance presents challenges for training models capable of detecting less frequent abnormalities effectively.
To address the class imbalance, a subset of 30,000 samples was extracted from the CODE 15% dataset. The selection was performed through random sampling while monitoring class distributions, ensuring that each abnormality was represented at a comparable level. Since the task is multilabel, where individual ECG records may belong to more than one class, the sampling strategy was guided to approximate an even distribution across classes. In the resulting subset, the distribution was relatively balanced: Normal ECGs constituted 16.37% of the samples, 1dAVb 16.68%, RBBB 16.81%, LBBB 16.70%, SB 14.96%, ST 14.63%, and AF 16.73%. This approach reduced the dominance of normal ECGs and enabled the model to learn from a diverse set of abnormalities without bias.
The balanced 30,000-sample subset was divided into training, validation, and test sets using a 70-20-10 split while preserving the class distribution. The training set (21,000 samples) provided data for teaching the model to recognize abnormalities [18,19,20]. The validation set (6000 samples) was utilized for hyper-parameter tuning and monitoring model performance during training. The test set (3000 samples) was reserved for final evaluation, providing an unbiased estimate of the model’s ability to generalize to unseen data. This structured approach ensured that each subset reflected the balanced distribution of the selected samples, facilitating reliable and equitable model training and assessment.
3.4 Hyperparameter Tuning and Model Training
Hyperparameters are predefined parameters that control a model’s structure and training behavior, and their appropriate selection is crucial for optimizing performance, ensuring accuracy, efficiency, and generalization. In this study, hyperparameter tuning was performed using a grid search strategy combined with validation performance monitoring [21]. Candidate values were explored for key parameters such as learning rate, batch size, and regularization strength, and the model was trained iteratively across these configurations. The final set of hyperparameters was chosen based on validation accuracy and loss, ensuring a balance between effective learning and generalization [22,23,24,25].
The learning rate controls the step size during optimization. If it is too small, convergence is slow; if too large, the model may overshoot optimal values. For this model, a learning rate of 0.001 was chosen, balancing effective feature learning with efficient convergence [26,27].
The batch size determines the number of training samples processed before updating the model parameters. It influences both the stability of gradient estimates and the speed of training. A smaller batch size provides more frequent updates and may improve generalization but increases noise in gradient estimation, while a larger batch size improves computational efficiency but may converge to sharp minima. In this study, a batch size of 32 was selected to achieve a balance between training efficiency and model performance.
Optimizers adjust model weights during back propagation to improve training efficiency. The Adam optimizer was used, as it combines the benefits of momentum and RMSprop. Adam adapts learning rates for each parameter, accelerates convergence, and is well-suited for handling sparse gradients making it an effective choice for this task.
To prevent over-fitting and improve generalization, L2 regularization was applied. This technique adds a penalty to the loss function for large weights, discouraging overly complex models and promoting robustness on unseen data.
For multilabel classification, binary cross-entropy loss was employed. This function measures the difference between predicted probabilities and true labels, ensuring the model is optimized for accurate predictions across multiple classes.
The model was trained on Kaggle, utilising the built-in NVIDIA P100 graphics processing unit (GPU) resources. Training was conducted for 100 epochs with early stopping enabled (patience = 10). This means that if the validation accuracy did not improve for 10 consecutive epochs, training was halted to prevent overfitting.
4 Residual Learning and Its Advantages in ECG Signal Classification
4.1 Residual Learning Advantage
ECG signals, characterized by subtle variations and complex patterns, present significant challenges for traditional deep neural networks when it comes to accurately detecting abnormalities. As deep neural networks grow deeper, they often face issues such as vanishing gradients, overfitting, and difficulties in capturing fine-grained signal patterns. These challenges hinder the learning process, especially when working with high-dimensional, multi-lead ECG data.
ResNets addresses these issues by reformulating the learning process. Instead of modelling the entire mapping function from input to output, ResNets focus on learning the residuals, i.e., the difference between the desired output and the model’s prediction. This is mathematically expressed as: F(x) = Y(x) − X(x)(1) where
A core feature of ResNets is the use of skip connections. These connections allow the input
- 1.Gradient Preservation: Deep networks are prone to vanishing gradients, where gradients become so small during backpropagation that weights in earlier layers stop updating effectively. Skip connections alleviate this issue by ensuring that gradients flow directly through the network without diminishing. The gradient flow during backpropagation becomes:
This ensures stable gradient updates, even in very deep networks, making it possible to train models effectively with more layers.
- 2.Pattern Preservation: The skip connection also ensures that the input signal
4.3 Handling Complex ECG Signals
ECG data typically consists of multi-dimensional signals from 12 leads, each capturing different aspects of heart activity. The inherent complexity of these signals, combined with the high-dimensional nature of ECG data, makes it challenging for traditional deep neural networks to learn effectively. ResNets, with their deeper architecture and residual learning framework, are well-suited to handle these challenges.
By employing residual learning and skip connections, ResNets can scale to deeper models without performance degradation. This ability allows the network to better capture complex features across multiple leads and over time, ensuring accurate detection of abnormalities, even in large, noisy datasets.
The study aims to evaluate the effectiveness of a proposed ResNet-based model for ECG classification. The analysis focuses on comparing the performance of this advanced architecture with simpler linear models and a benchmark model proposed by Ribeiro et al., which was developed using the same CODE dataset. Through a comprehensive comparison of multiple architectures, the study seeks to demonstrate the advantages of residual connections, particularly their capacity to address the complexities and noise inherent in ECG signals [28].
The motivation for this comparative analysis arises from the unique challenges associated with automated ECG classification. ECG data are high-dimensional, multivariate time-series signals that are often influenced by noise sources such as baseline wander and power line interference. These factors complicate the task of accurately capturing subtle variations in the signals that are critical for identifying cardiac abnormalities. Simpler models, particularly linear ones, while advantageous in terms of computational efficiency and interpretability, lack the representational capacity required to learn the intricate patterns embedded in such data. As a result, their performance tends to decline when applied to noisy and imbalanced datasets like the CODE dataset.
The benchmark model developed by Ribeiro et al. includes residual layers, making it a suitable reference point for comparison due to its compatibility with the dataset’s characteristics. Residual layers are particularly advantageous for handling complex patterns and mitigating the degradation problem in deeper networks. However, the performance of residual architectures is highly sensitive to design variations, such as the number of layers or specific configurations. To comprehensively assess these factors, the study incorporates a modified version of Ribeiro’s model. This modified architecture adjusts the depth of residual layers, enabling a detailed evaluation of how structural changes influence model accuracy, robustness, and overall suitability for ECG classification.
5.1 Proposed ResNet Model for ECG Abnormality Detection
The proposed model, depicted in Fig. 5, introduces a ResNet architecture designed explicitly for the classification of ECG abnormalities. The model leverages the principles of residual learning to effectively address the challenges posed by high-dimensional, multivariate ECG signals. Its architecture is structured to ensure robust feature extraction, efficient gradient flow, and resistance to common issues such as vanishing gradients, which are prevalent in deeper networks.
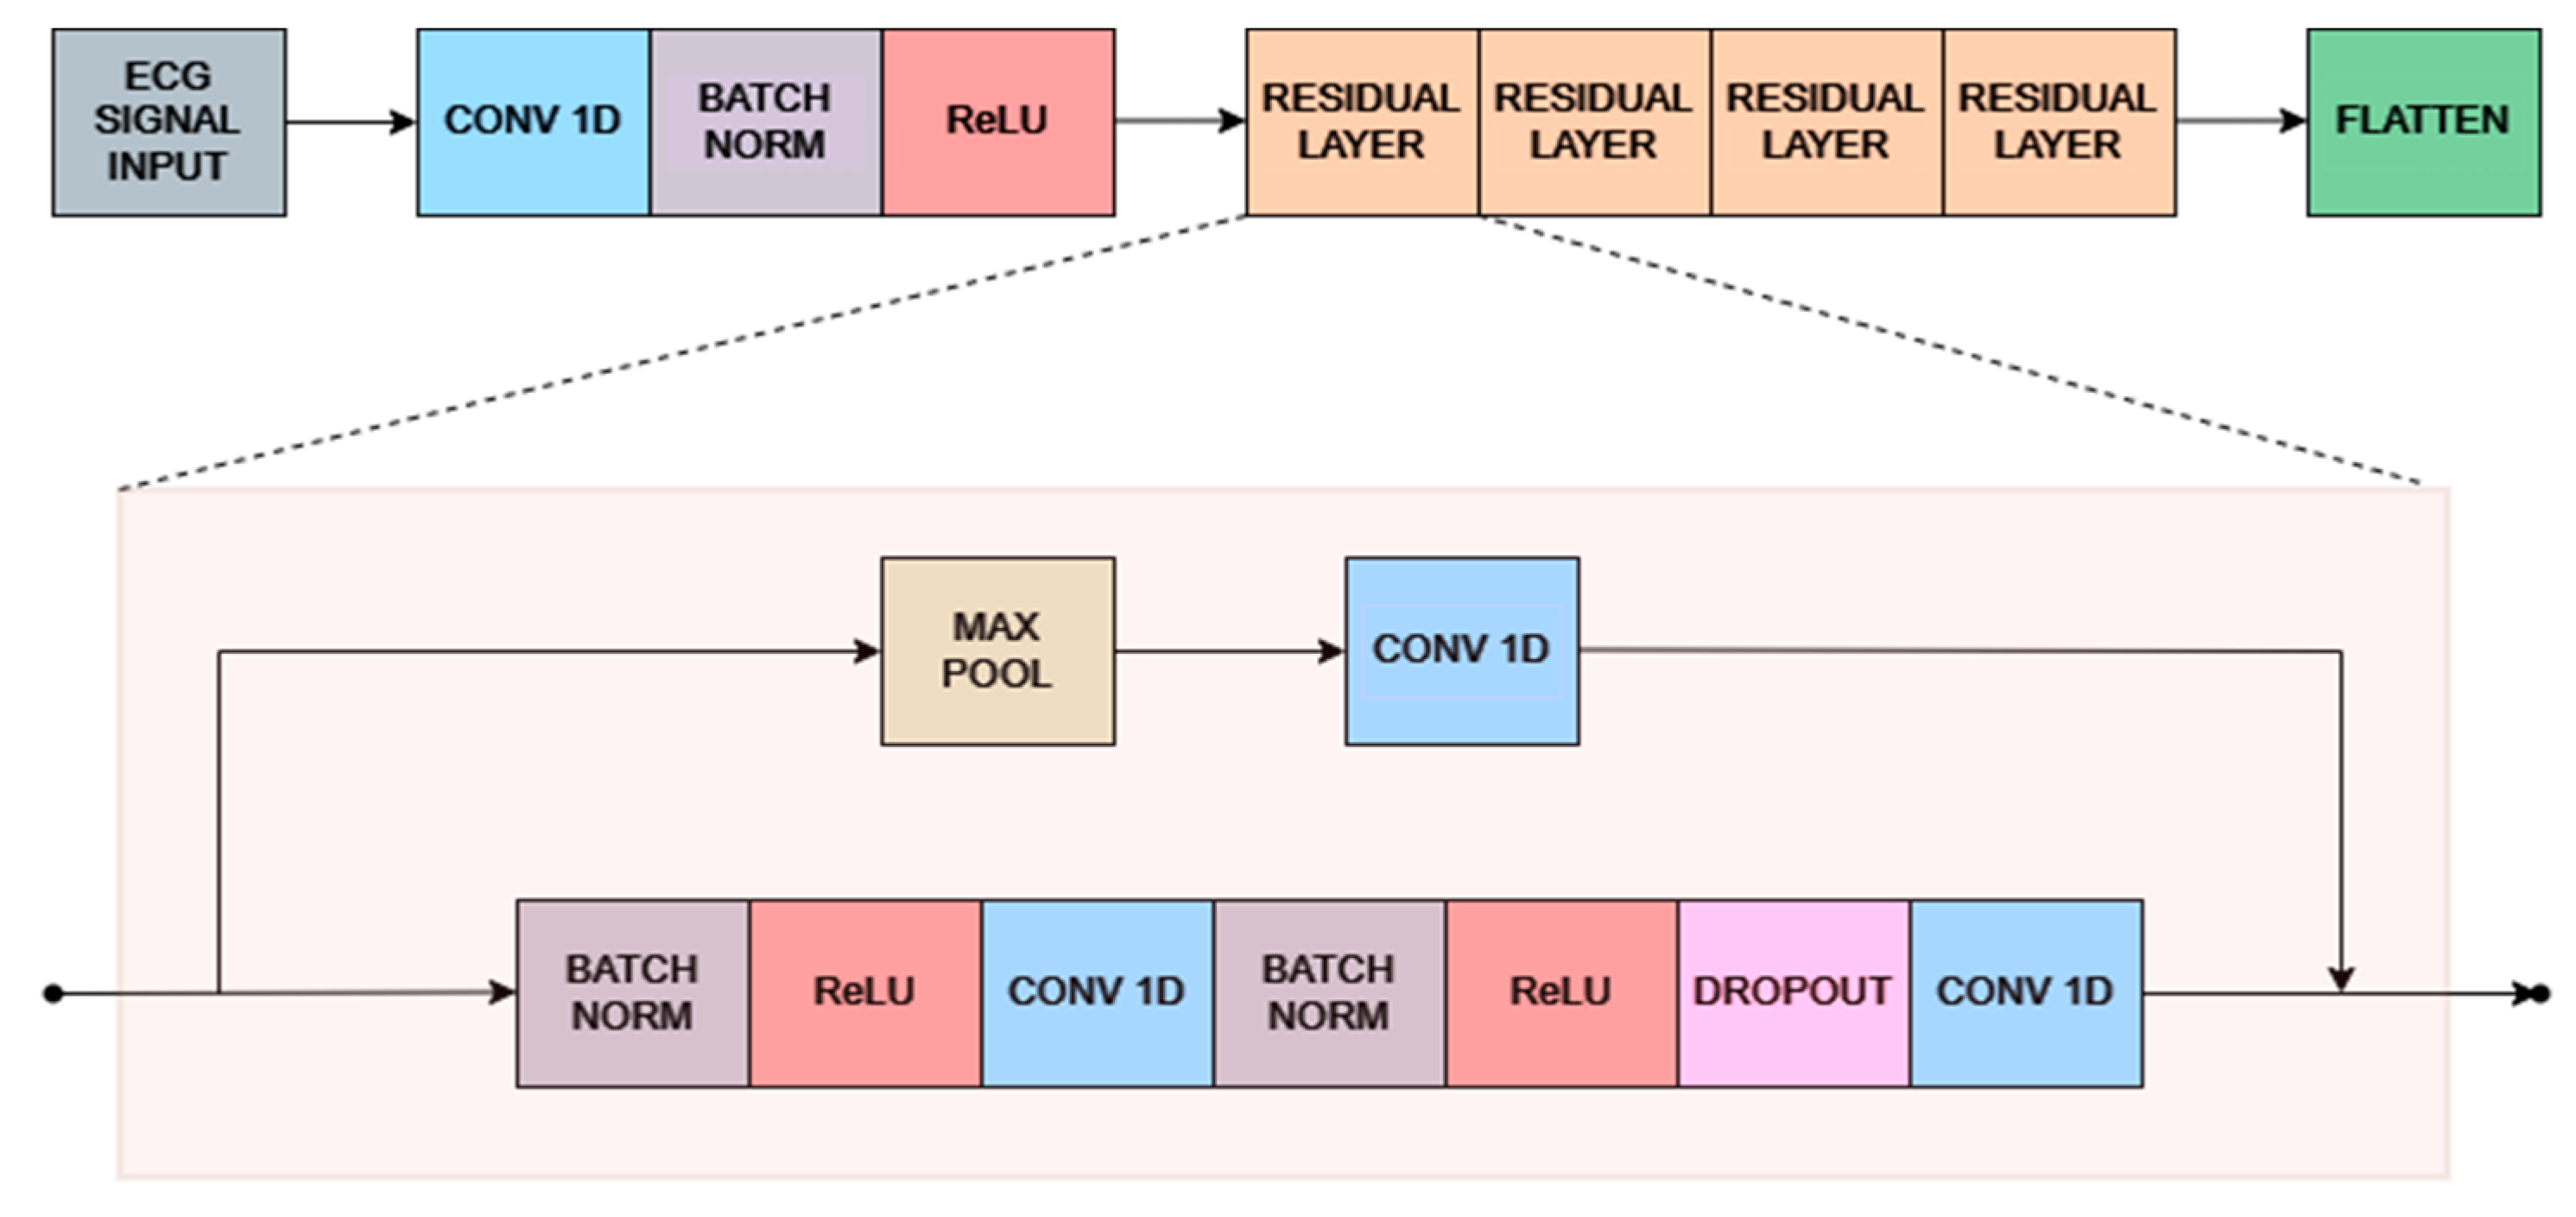
Figure 5: Proposed ResNet architecture.
5.1.1 Initial Convolutional Block
The model begins with an initial convolutional block consisting of a one-dimensional convolutional layer with 64 filters, each having a kernel size of 16, a stride of 1, and “same” padding. The layer is initialized using the He-normal initializer without bias. This convolutional layer is followed by batch normalization to stabilize the distribution of activations and accelerate convergence, and a rectified Linear unit (ReLU) activation function to introduce non-linearity. Together, this block ensures that the raw ECG signals are transformed into structured low-level features suitable for deeper processing in subsequent layers.
The core of the architecture is composed of a series of residual units that progressively reduce the temporal resolution of the ECG signal while simultaneously expanding the feature dimensionality. Each residual unit contains two Conv1D layers with a kernel size of 17, initialized with He-normal, and applied with “same” padding. Batch normalization and ReLU activation are integrated after each convolution, and dropout regularization with a rate of 0.2 is employed to reduce overfitting. Shortcut connections are used to align the input and output dimensions of each unit, ensuring efficient gradient flow and mitigating vanishing gradient problems in the deeper stages of the network. The residual pathway begins by downsampling the input to 1024 time steps with 32 filters, and subsequently reduces the resolution to 256 time steps with 64 filters, 64 time steps with 128 filters, 16 time steps with 256 filters, 4 time steps with 512 filters, and finally to a single time step with 1024 filters. This hierarchical arrangement allows the model to capture increasingly abstract representations of the ECG signal, transitioning from local waveform features to global patterns indicative of cardiac abnormalities.
Following the residual layers, a max pooling operation is applied to reduce the dimensionality of the feature maps. This pooling step highlights the most relevant features while mitigating redundancy, paving the way for higher-level feature abstractions. Additional Conv1D layers after pooling further refine the extracted features, allowing the model to maintain hierarchical learning while minimizing information loss.
5.1.4 Flattening and Dense Layers
Following the residual units, the final output is flattened into a one-dimensional vector and passed through a sequence of fully connected layers to consolidate the extracted features for classification. The dense layers contain 1024, 256, 64, and 16 neurons, respectively, each activated with ReLU to preserve non-linearity. The final classification layer consists of a number of neurons equal to the target classes, with a sigmoid activation function applied to enable multi-label prediction. This design ensures that the model can assign independent probabilities to each class, aligning with the multi-label nature of the dataset.
5.2 Adapted Models for Comparison
To evaluate the performance of the proposed ResNet architecture, two linear models were adapted for ECG abnormality detection. These models were selected to provide a baseline comparison, demonstrating the advantages of deeper networks and residual connections for complex signal processing.
The first linear model, shown in Fig. 6, is an adaptation of the 12-layer CNN originally proposed by Divya et al. [26]. Designed initially for fingerprint classification, the architecture comprises six convolutional blocks, each containing two convolutional layers.
To tailor the model for ECG abnormality detection, the following modifications were implemented:
- Input Layer: Adjusted to accommodate the multichannel structure and temporal characteristics of ECG signals.
- Output Layer and Activation Function: Modified for multilabel classification, enabling the detection of multiple cardiac abnormalities.
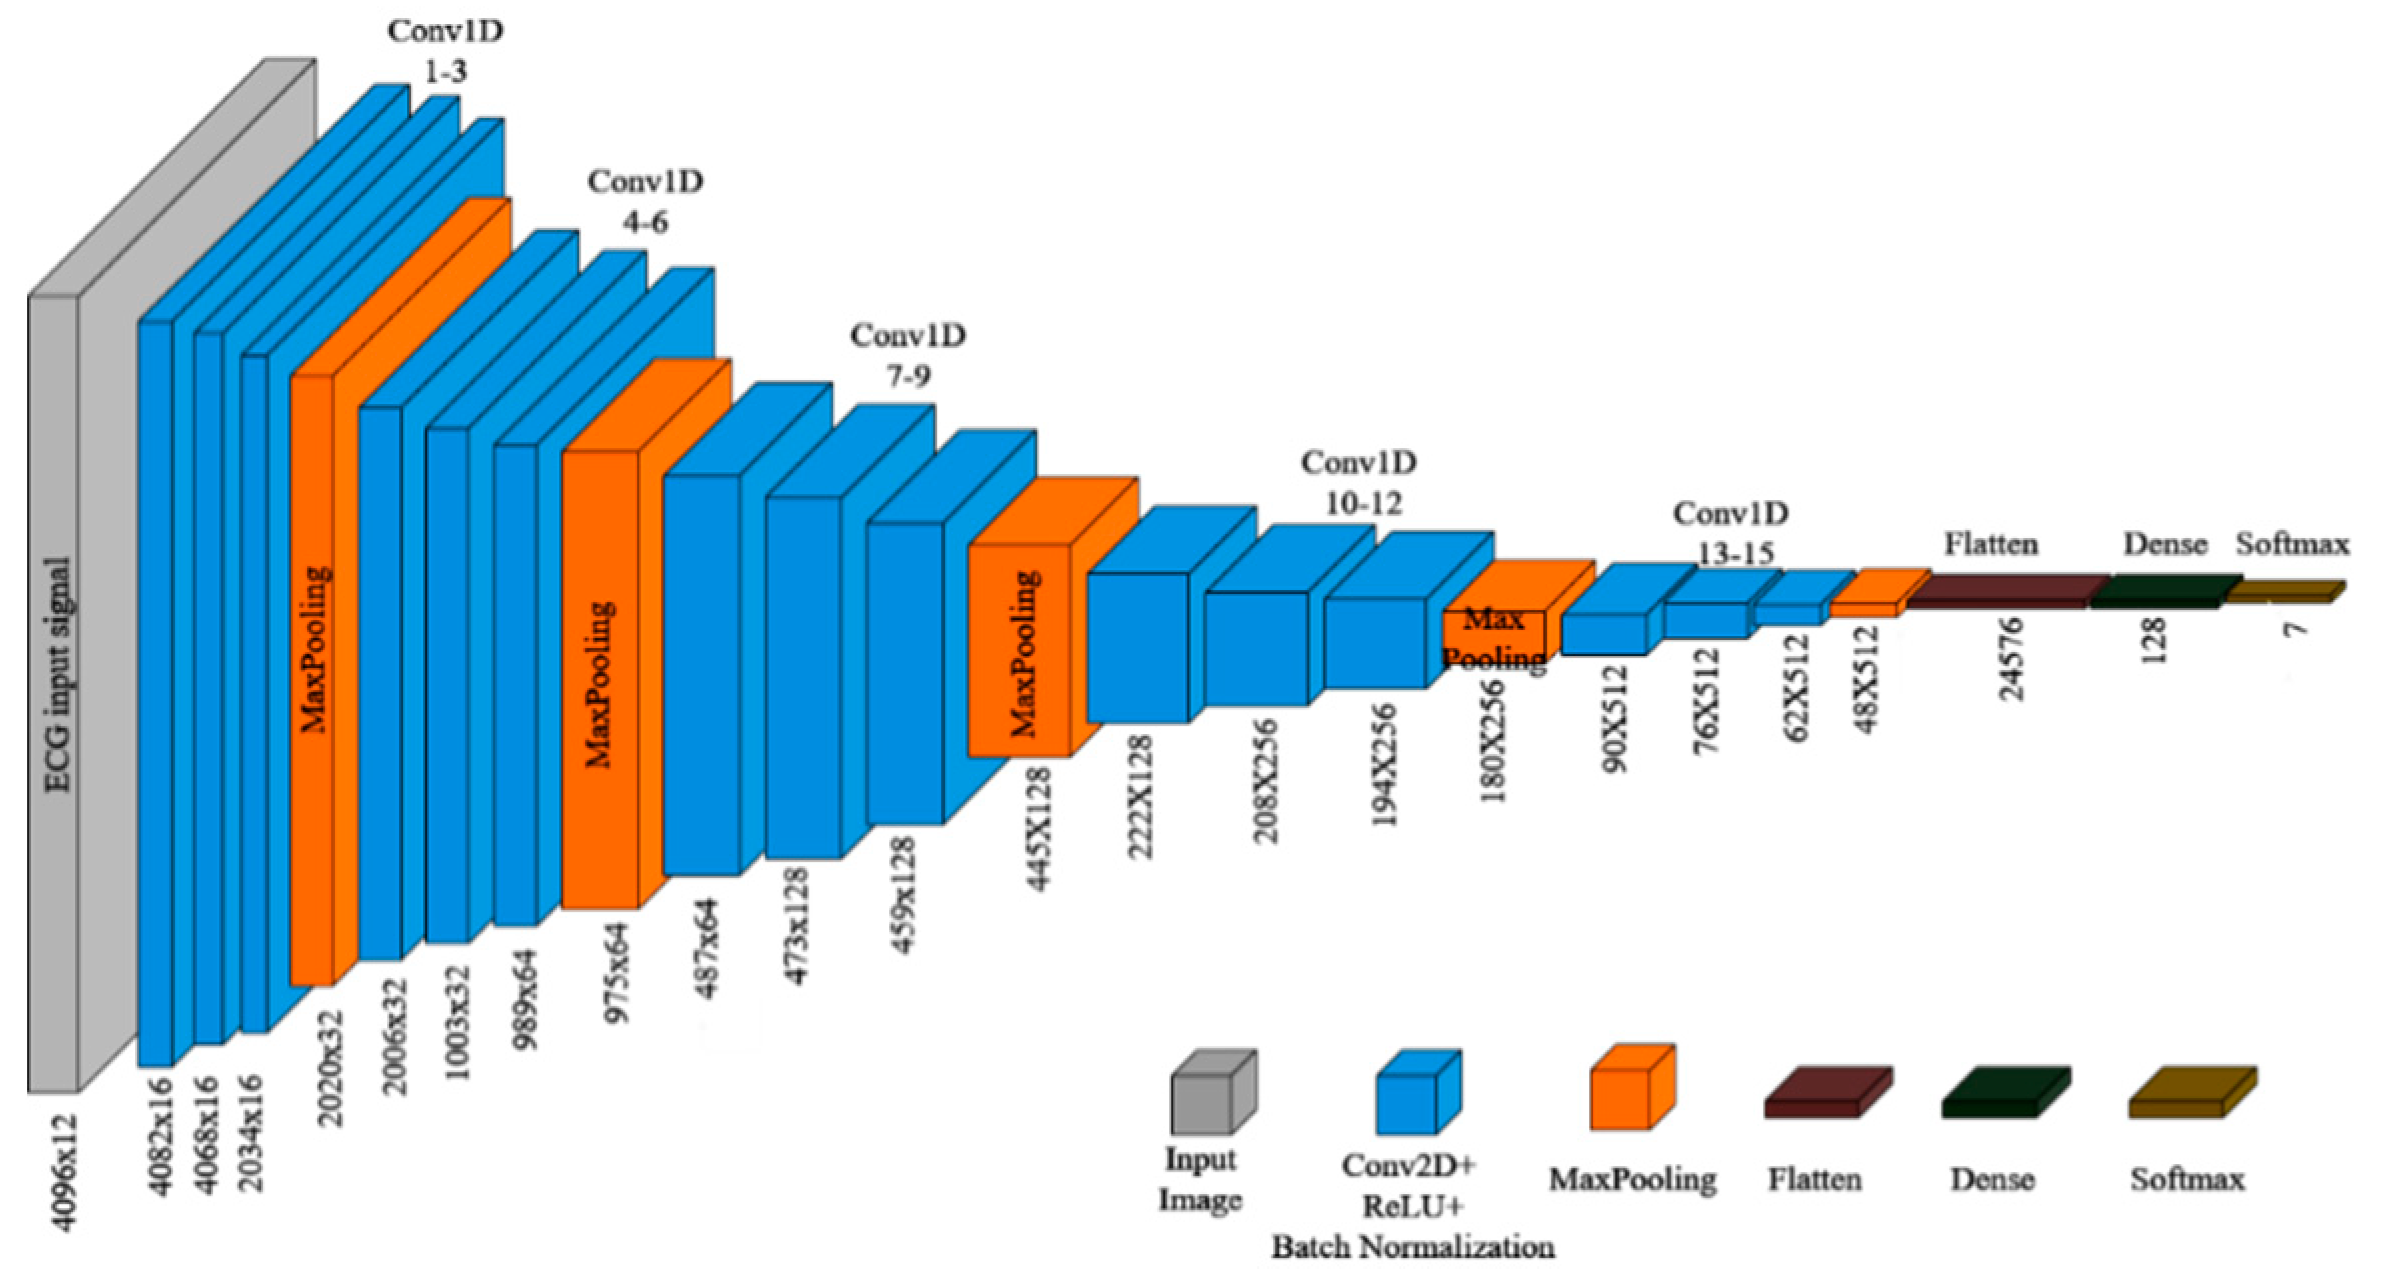
Figure 6: Modified 12 layer CNN for ECG abnormality detection.
The second linear model is a 15-layer CNN, shown in Fig. 7, built upon the foundation of the 12-layer architecture, with additional layers and refined configurations aimed at enhancing feature extraction capabilities.
The model comprises the following key components:
- Convolutional Blocks: Each block includes a Conv2D layer with Batch Normalization and ReLU activation. The initial convolution uses 16 filters, which are progressively doubled after each layer to capture increasingly complex features.
- Max Pooling Layers: Applied after each convolutional block, these layers utilize a kernel size of 2 × 22, halving the spatial dimensions of the feature maps. Repeated five times, this results in a final feature map size of 1 × 1 × 256 after the fifteenth convolutional block.
- Flattening and Dense Layers: The reduced feature map is flattened and passed through two dense layers with 64 and 16 units, respectively, for further dimensionality reduction.
- Output Layer: A softmax activation layer is employed for final classification into target classes.
The 15-layer architecture extends the 12-layer design by introducing more convolutional blocks, enabling the network to learn deeper hierarchical features. The gradual reduction in feature map size through pooling and the addition of dense layers further enhances its ability to extract and generalize meaningful features from ECG signals.
These linear models serve as critical baselines for assessing the effectiveness of the proposed ResNet model. While the 12-layer model demonstrates the performance of a compact CNN with limited depth, the 15-layer model offers insights into the benefits of increased depth within a purely linear framework.
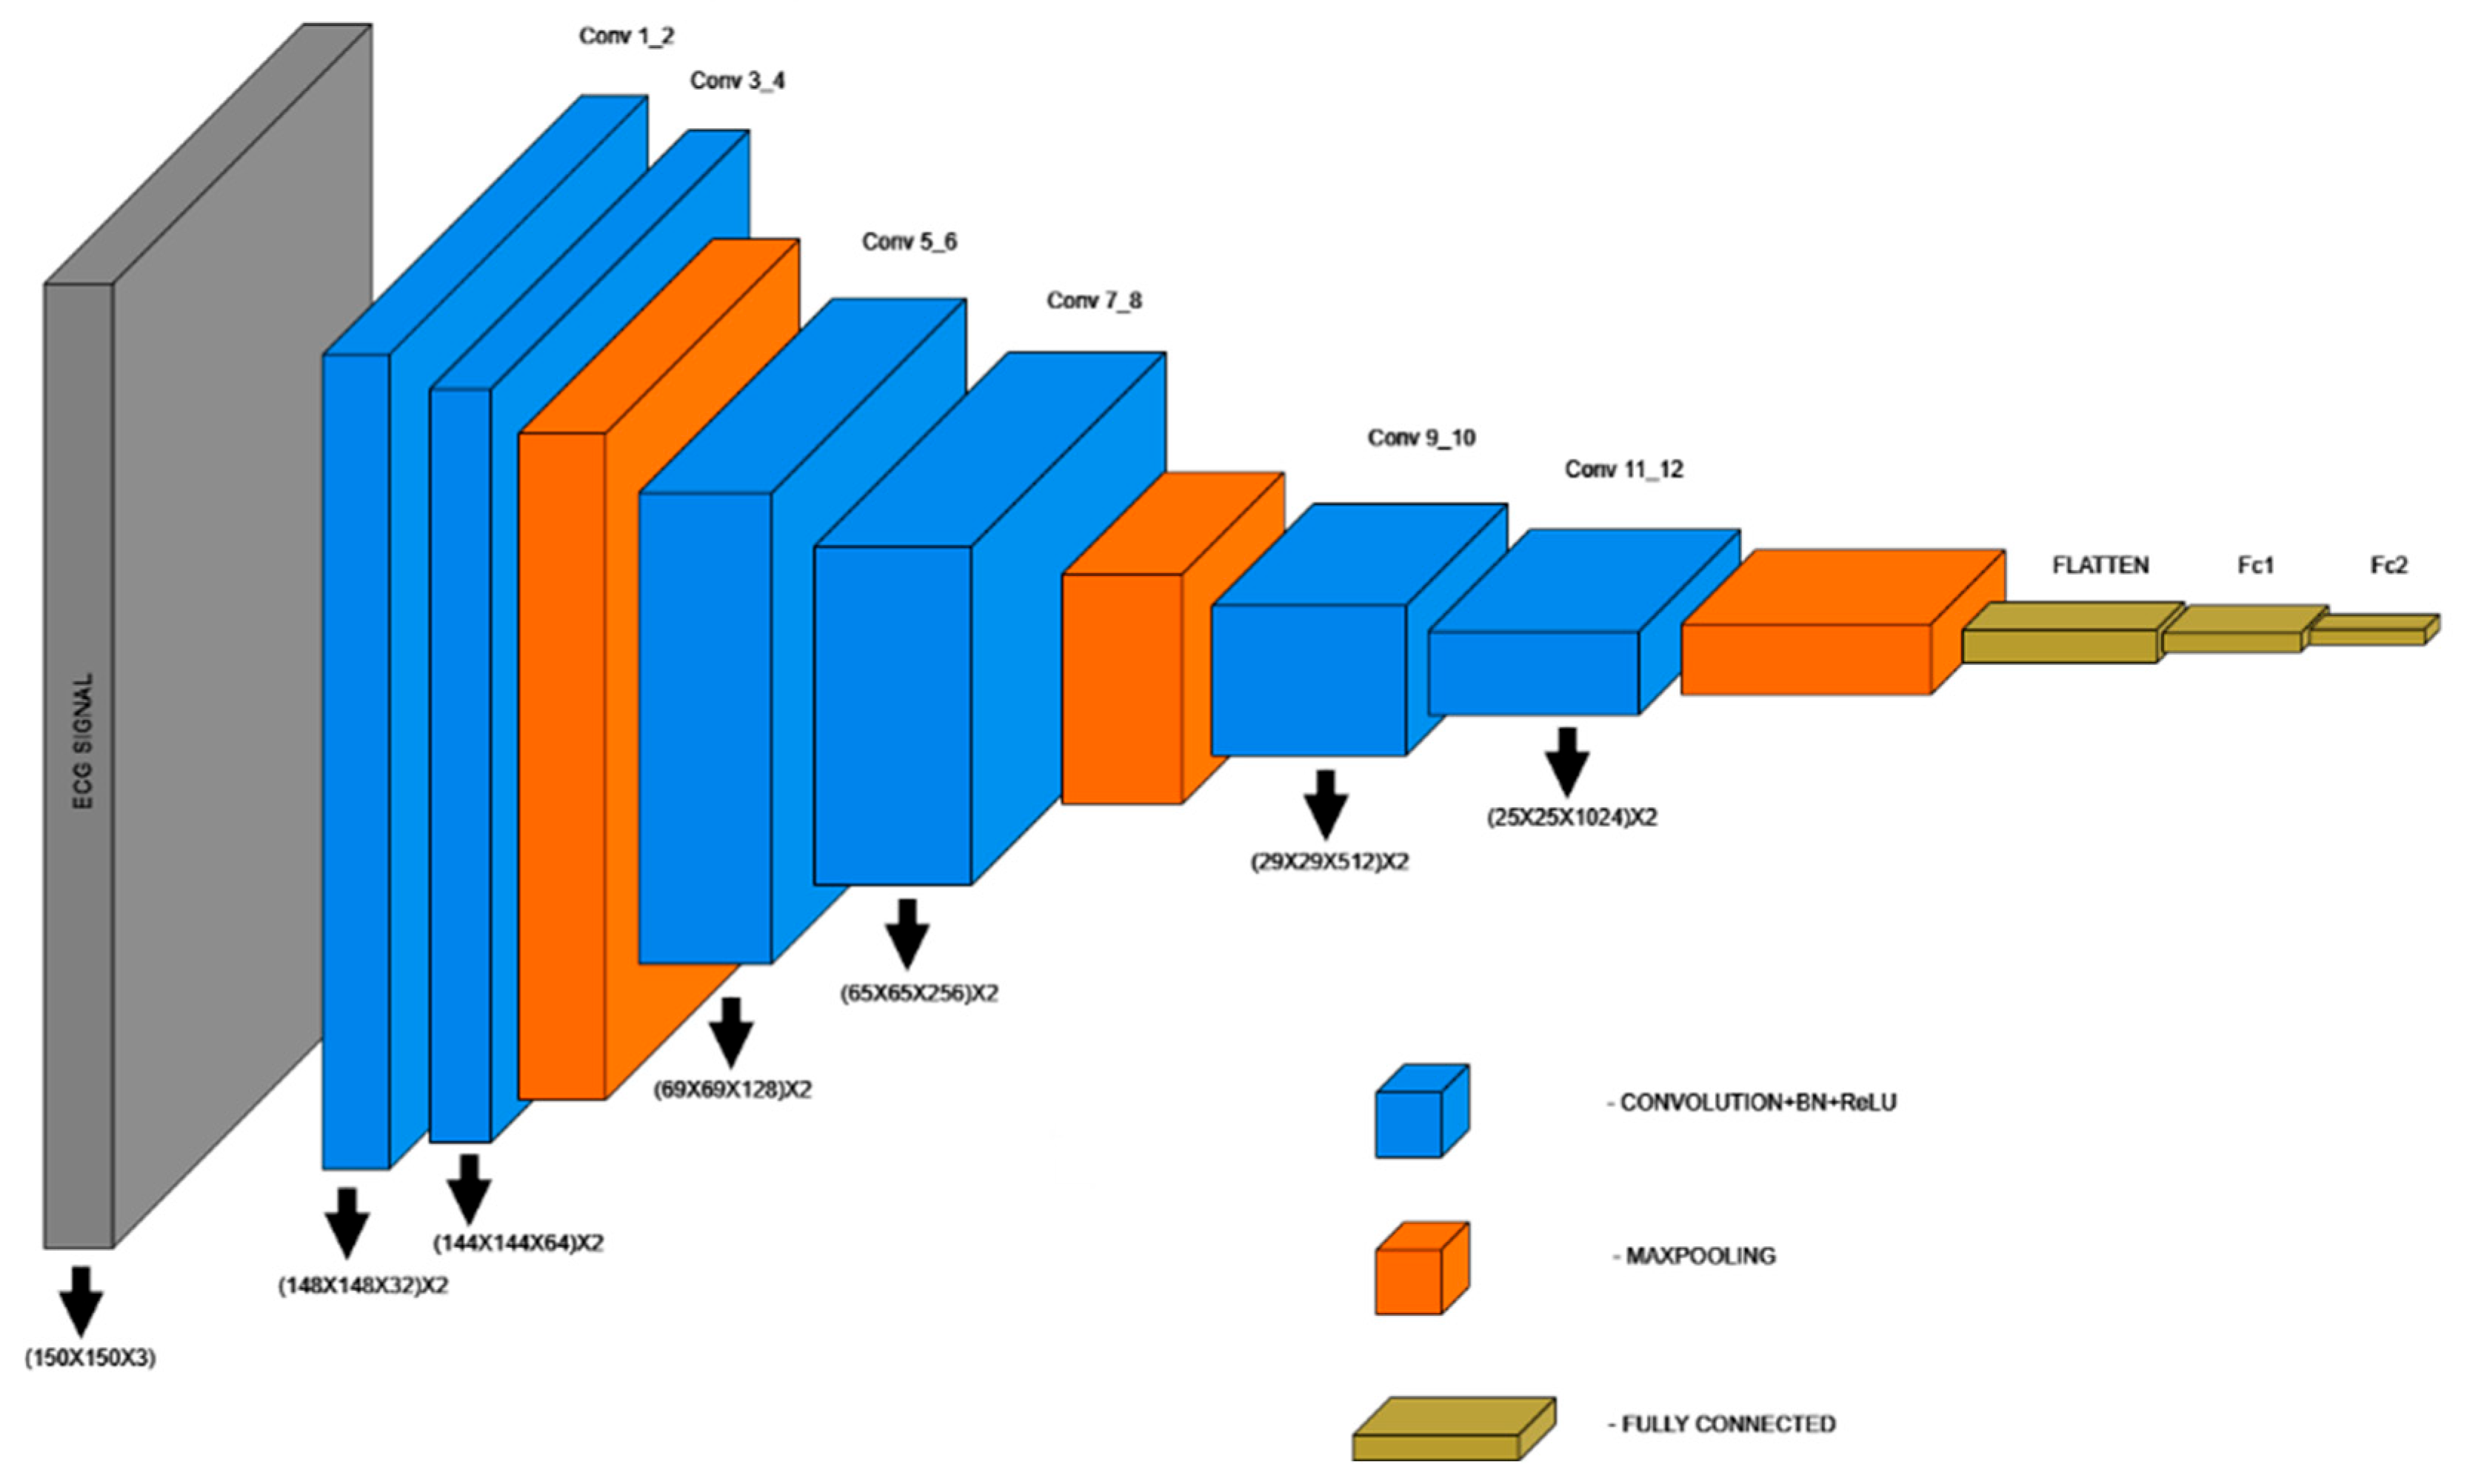
Figure 7: 15-layer CNN model for ECG classification.
5.3 Ribeiro et al.’s Contribution in ECG Diagnostics
The study by Ribeiro et al. [1], published in Nature Communications, serves as a foundational work for automated ECG diagnostics using deep learning. Leveraging the extensive CODE dataset, their research demonstrates the feasibility of detecting ECG abnormalities at scale.
5.3.1 Dataset and Preprocessing
Ribeiro et al. utilized the CODE dataset, a large collection of 12-lead ECG recordings from over 1.6 million patients. Each recording was standardized to a sampling rate of 400 Hz, and zero-padding ensured uniform length across all signals. Labels were derived from a combination of automated analyses and cardiologist reviews to maintain quality, although the dataset exhibited significant class imbalance, with over 80% of recordings classified as normal.
5.3.2 Key Contributions and Performance
Their approach highlighted the potential of deep learning in ECG analysis, achieving high F1 scores and specificity for several cardiac abnormalities. The model demonstrated superior performance compared to human cardiology residents and students in multiple diagnostic categories but however possess the following limitations:
- Class Imbalance: The dataset’s skewed distribution towards normal ECGs challenged the model’s ability to detect rarer abnormalities, despite employing class-weighting strategies.
- Evaluation Metrics: While standard metrics such as F1 score and precision were reported, additional multilabel metrics like Jaccard Index or Hamming Loss could provide a more comprehensive evaluation of the model’s real-world performance.
- Preprocessing Constraints: The reliance on zero-padding and resampling did not fully address common noise artifacts in ECG signals, potentially impacting robustness in real-world applications.
- Imbalance in Detection Performance: The model exhibited variation in F1 scores across classes, performing better for certain abnormalities while showing reduced effectiveness for others, indicating room for improvement in uniform detection capabilities. For example, conditions like LBBB achieved an F1 score of 1, indicating near-perfect performance, while others like AF achieved an F1 score of only 0.87.
The findings underscore the importance of leveraging large datasets and advanced architectures for ECG diagnostics. However, the challenges noted particularly class imbalance and preprocessing noise highlight opportunities for further refinement.
Electrocardiographic age (ECG Age) refers to an estimate of an individual’s physiological heart age, derived from the analysis of 12-lead ECG data using machine learning or deep learning algorithms. Unlike chronological age, which represents the time elapsed since birth, ECG Age reflects the heart’s functional state and cardiovascular health. By analyzing patterns in the electrical activity of the heart, ECG Age captures subtle changes in features such as heart rate, rhythm, and waveform morphology. These changes can indicate whether the heart is ageing prematurely or if there are underlying health issues, such as arrhythmias or cardiovascular diseases.
A discrepancy between ECG Age and chronological age can serve as a marker of cardiovascular risk. For instance, a higher ECG Age compared to chronological age may indicate accelerated cardiac ageing, suggesting an increased likelihood of heart disease, cardiac events, or even reduced life expectancy. This makes ECG Age a valuable tool for assessing cardiovascular health, predicting long-term outcomes, and enabling early intervention in at-risk individuals.
This study focuses on predicting ECG Age as a continuous variable using a deep-learning model. The dataset used was filtered to include only normal ECG signals during the initial phase to reduce noise from abnormalities. The model was trained to predict ECG Age by comparing it with chronological age, which was achieved by modifying the output layer of the neural network to use a linear activation function, enabling continuous age prediction.
The data was split into training, validation, and test sets. The model learned cardiac ageing patterns from the ECG waveform features by fitting the predicted ECG Age to the true chronological age. Mean absolute error (MAE) was used to evaluate the model’s performance, capturing the difference between the predicted and true age values. The primary focus was to observe the model’s ability to predict ECG Age accurately across normal and abnormal ECG signals, with particular attention to deviations from the chronological age when abnormalities were present.
6.1 Performance Comparison of Neural Networks in ECG Abnormality Detection
This section presents the comparative evaluation of four models: the 12-layer CNN, the 15-layer CNN, the proposed model, and Ribeiro et al.’s model. The evaluation is based on various metrics that assess model performance in detecting ECG abnormalities.
These include Hamming Loss, Subset Accuracy, Macro and Micro Precision, Recall, F1 Score, Jaccard Index, and Coverage Error. Table 1 shows the comparison of the metrics for all the four models. The proposed model consistently outperformed the others in several key metrics, such as Subset Accuracy (0.90557), Hamming Loss (0.02154), and Coverage Error (1.25729), showcasing its ability to accurately predict abnormalities in ECG signals while minimizing errors.
Table 1: Comparison of evaluation metrics for various models.
| Metric | 12-Layer CNN | 15-Layer CNN | Ribeiro et al. | Proposed ResNet |
|---|---|---|---|---|
| Hamming Loss | 0.02812 | 0.02913 | 0.027429 | 0.02154 |
| Subset Accuracy | 0.84824 | 0.84553 | 0.86557 | 0.90557 |
| Macro Precision | 0.9602 | 0.95643 | 0.91236 | 0.93236 |
| Macro Recall | 0.86132 | 0.85843 | 0.90621 | 0.93621 |
| Macro F1 Score | 0.90674 | 0.90331 | 0.90922 | 0.93922 |
| Micro Precision | 0.96014 | 0.95578 | 0.91326 | 0.93326 |
| Micro Recall | 0.85862 | 0.85619 | 0.9076 | 0.9376 |
| Micro F1 Score | 0.90655 | 0.90325 | 0.91042 | 0.93042 |
| Jaccard Index | 0.83115 | 0.82529 | 0.83505 | 0.90505 |
| Coverage Error | 1.91057 | 1.92683 | 1.538957 | 1.25729 |
In the context of multilabel classification, where ECG records often exhibit multiple abnormalities simultaneously, the proposed model demonstrated exceptional performance. It achieved the lowest Hamming Loss at 0.02154, indicating minimal misclassifications at the individual label level. The Subset Accuracy of 0.90557 highlights its ability to correctly classify all labels in a sample more frequently than the other models.
The Jaccard Index for the proposed model was the highest at 0.90505, showcasing its superior capability to accurately capture the overlap between predicted and true label sets. With a Macro F1 Score of 0.93922 and a Micro F1 Score of 0.93042, the proposed model exhibited balanced performance across both frequent and rare abnormalities, ensuring reliable classification for all labels. The Coverage Error was also the lowest, at 1.25729, indicating that the model ranked correct labels ahead of incorrect ones with high consistency. These results highlight the proposed model’s effectiveness in handling the challenges of multilabel ECG abnormality detection, particularly in scenarios involving co-occurring conditions, making it highly suitable for clinical applications.
To further validate the robustness of the proposed model beyond standard precision, recall, and F1 metrics, Cohen’s Kappa score was computed for each class. The results demonstrated consistently high levels of agreement beyond chance, with values of 0.884 for Normal, 0.880 for 1dAVb, 0.906 for RBBB, 0.846 for LBBB, 0.900 for SB, 0.834 for ST, and 0.885 for AF. These values highlight the model’s strong reliability across all abnormalities, with particularly high consistency in detecting RBBB and SB. While slightly lower scores were observed for LBBB and ST, they still indicate substantial agreement, reflecting that the model maintains dependable classification performance across diverse ECG abnormalities.
The model demonstrated that for normal ECG signals, the deviation between predicted ECG Age and chronological age remained consistently lower than the MAE of the model, as shown in Fig. 8. This indicates that the model is able to closely approximate true biological age in healthy individuals, reflecting the stability of their cardiac electrophysiology. In contrast, for abnormal ECG signals, the deviation was significantly greater. Specifically, in 96.63% of the test data, the predicted ECG Age exceeded the MAE, and this deviation increased proportionally with the number of co-occurring abnormalities.
This trend suggests that abnormal electrical patterns in the heart manifest as an “accelerated ECG Age”, which can be interpreted as a surrogate marker of cardiovascular stress or deterioration. From a physiological standpoint, conduction delays, hypertrophy, or arrhythmic patterns captured in abnormal ECGs likely contribute to the model perceiving the heart as “older” than its chronological counterpart. Clinically, this implies that ECG Age could serve not only as an indicator of overall cardiac health but also as an early warning biomarker for individuals at elevated risk. Patients with a larger deviation between ECG Age and chronological age may warrant closer clinical monitoring or early intervention to mitigate the progression of cardiovascular disease.
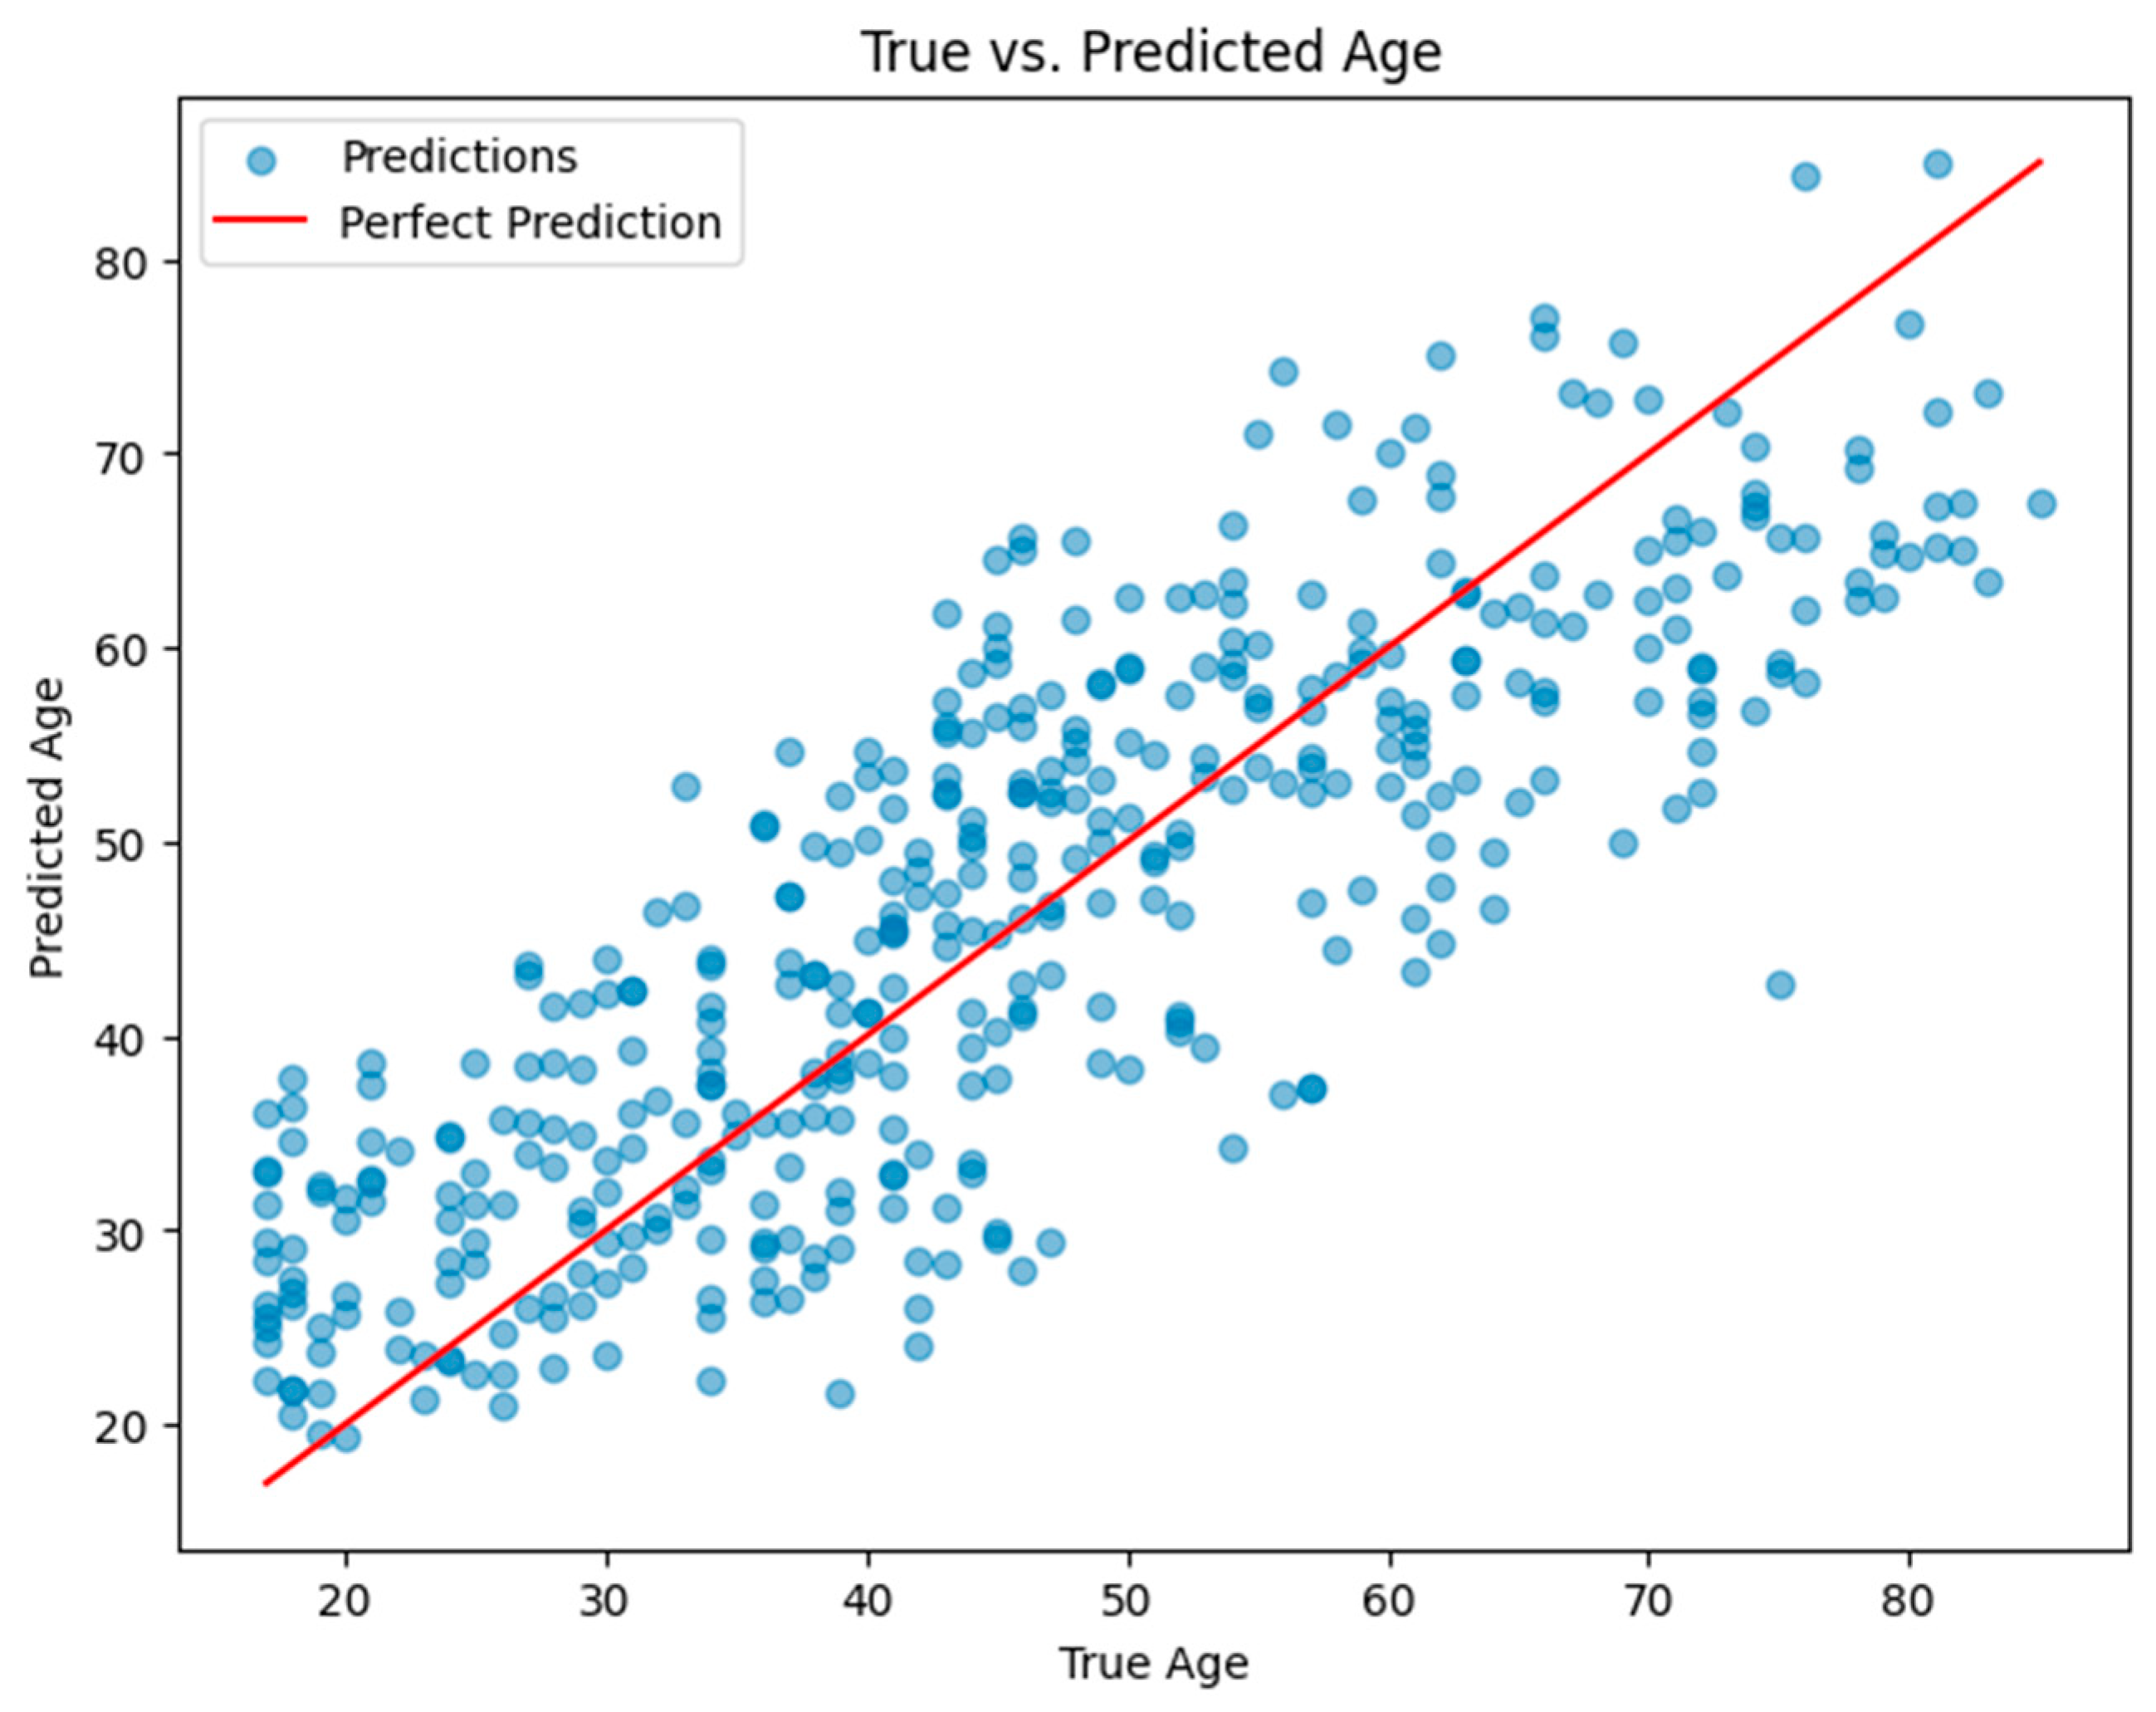
Figure 8: Plot of true age vs. predicted age for the ECG age prediction model for normal labels.
6.3 Validation of Model Design via Ablation Study
An ablation study was conducted to quantify the importance of architectural components. Removing residual connections reduced micro-F1 from 95.81% to 90.92% and decreased micro-recall by 10.2 percentage points, indicating that residual learning substantially improves model stability and sensitivity to abnormalities. Reducing network width halved the parameter count and lowered latency by ~30% while incurring a modest drop in performance, suggesting a viable trade-off for edge deployment. Disabling dropout or L2 regularization increased validation variance and degraded generalization metrics, confirming their role in preventing overfitting. Finally, replacing Binary Cross-Entropy with focal loss improved recall on minority labels, indicating a promising direction for handling class imbalance. These findings validate the architectural choices of the proposed model and provide concrete options for optimization depending on deployment constraints.
7 Effect of Model’s Performance in Situations of Lead Loss
The performance of the proposed residual model was evaluated by simulating scenarios where specific leads were missing from the standard 12-lead ECG signals. This is a critical issue in clinical settings, where incomplete or noisy ECG signals are often encountered due to issues such as lead detachment or signal interference. The objective was to assess how well the model generalizes to incomplete ECG data and to determine its robustness across various lead loss scenarios.
To explore the impact of lead loss on the model’s performance, we systematically removed combinations of leads from the 12-lead ECG signals. The removal process was executed iteratively, setting specific leads to zero and using the modified ECG signals for model predictions. The notation “12Cx” was used to denote the number of ways to choose
To measure the impact of missing leads on the model’s classification capabilities, two key metrics were used: the F1 Score and the Jaccard Index. The F1 Score is particularly useful as it provides a balance between precision and recall, highlighting the model’s ability to accurately classify both positive and negative cases. The Jaccard Index, on the other hand, measures the overlap between the predicted and true labels, offering insights into the model’s accuracy in terms of correctly identifying the presence or absence of specific abnormalities [29,30].
7.3 Observations from Lead Loss Analysis
The analysis of lead loss demonstrated significant variability in model performance depending on the number of missing leads, with certain abnormalities exhibiting greater resilience to lead loss than others. Table 2 shows the numerical conclusions of the Lead Loss Analysis.
Table 2: Lead loss analysis of the proposed ResNet model before grouping.
| Disease | Average | STD | Min | Max | Average | STD | Min | Max | |
|---|---|---|---|---|---|---|---|---|---|
| 1dAVb | Accuracy | 0.876 | 0.011 | 0.83 | 0.896 | 0.78 | 0.017 | 0.71 | 0.812 |
| F1 Score | 0.84 | 0.036 | 0.607 | 0.888 | 0.725 | 0.05 | 0.436 | 0.799 | |
| Jaccard | 0.712 | 0.106 | 0.173 | 0.854 | 0.562 | 0.116 | 0.095 | 0.746 | |
| RBBB | Accuracy | 0.947 | 0.023 | 0.776 | 0.966 | 0.9 | 0.04 | 0.634 | 0.934 |
| F1 Score | 0.896 | 0.099 | 0.172 | 0.966 | 0.823 | 0.135 | 0.094 | 0.934 | |
| Jaccard | 0.689 | 0.261 | 0 | 0.962 | 0.579 | 0.277 | 0 | 0.927 | |
| LBBB | Accuracy | 0.947 | 0.01 | 0.881 | 0.96 | 0.899 | 0.017 | 0.787 | 0.923 |
| F1 Score | 0.93 | 0.029 | 0.653 | 0.961 | 0.871 | 0.047 | 0.484 | 0.925 | |
| Jaccard | 0.851 | 0.128 | 0.054 | 0.957 | 0.758 | 0.157 | 0.028 | 0.917 | |
| SB | Accuracy | 0.934 | 0.003 | 0.924 | 0.941 | 0.876 | 0.005 | 0.859 | 0.888 |
| F1 Score | 0.93 | 0.005 | 0.906 | 0.941 | 0.869 | 0.009 | 0.829 | 0.889 | |
| Jaccard | 0.916 | 0.028 | 0.616 | 0.934 | 0.846 | 0.04 | 0.445 | 0.876 | |
| ST | Accuracy | 0.949 | 0.002 | 0.940 | 0.956 | 0.904 | 0.004 | 0.886 | 0.916 |
| F1 Score | 0.945 | 0.006 | 0.904 | 0.955 | 0.895 | 0.011 | 0.826 | 0.914 | |
| Jaccard | 0.922 | 0.045 | 0.397 | 0.949 | 0.858 | 0.058 | 0.248 | 0.904 | |
| AF | Accuracy | 0.901 | 0.006 | 0.856 | 0.914 | 0.82 | 0.01 | 0.748 | 0.842 |
| F1 Score | 0.871 | 0.034 | 0.553 | 0.912 | 0.773 | 0.051 | 0.383 | 0.838 | |
| Jaccard | 0.715 | 0.15 | 0.012 | 0.874 | 0.573 | 0.148 | 0.006 | 0.777 | |
| Normal ECG | Accuracy | 0.94 | 0.006 | 0.903 | 0.952 | 0.887 | 0.01 | 0.823 | 0.908 |
| F1 Score | 0.925 | 0.023 | 0.695 | 0.954 | 0.862 | 0.038 | 0.533 | 0.911 | |
| Jaccard | 0.809 | 0.172 | 0 | 0.945 | 0.706 | 0.189 | 0 | 0.896 |
The following results were observed from the table:
- Group 1 (ST, SB, AF): These abnormalities, which primarily rely on variations in heart rate, showed greater resilience to lead loss. Even when up to 9–11 leads were missing, these conditions retained high classification accuracy. For instance, the AF abnormality exhibited a F1 Score of 0.769 with 9–11 leads missing, compared to 0.715 in the baseline analysis. Similarly, ST showed consistent performance with a F1 Score of 0.793 with 9–11 leads missing, reflecting its robustness in the face of incomplete ECG data.
- Group 2 (1dAVb, RBBB, LBBB): These abnormalities, which rely on specific patterns in the ECG waveform, showed greater sensitivity to lead loss. As the number of missing leads increased, performance deteriorated more significantly compared to pulse rate-based abnormalities. For 1dAVb, the model maintained a F1 Score of 0.956 when 5–8 leads were missing, showing a significant improvement over the baseline score of 0.839. Similarly, RBBB exhibited an increase in F1 Score from 0.895 to 0.956 in the grouped approach, indicating a more stable performance under lead loss.
7.4 Impact of Grouping Abnormalities
One of the most significant findings of this study was the differential impact of lead loss on different types of abnormalities. To address this, the abnormalities were grouped into two distinct categories:
- Pulse Rate-Based Abnormalities: These include conditions such as ST, SB, and AF, which primarily depend on heart rate variations that are less affected by lead loss. These conditions are primarily characterized by alterations in heart rate or rhythm, which can often be captured reliably even when fewer leads are available, since the global rate irregularity remains evident across most lead configurations.
- Block-Based Abnormalities: These include 1dAVb, RBBB, and LBBB, which rely on specific waveform patterns that degrade with missing leads. These abnormalities depend heavily on the precise morphology and timing of specific waveforms, particularly the P wave, QRS complex, and their interrelations, which require multiple leads for accurate characterization.
By grouping the abnormalities based on their characteristics, it allowed the model to focus on the simpler pulse rate-based abnormalities while devoting more resources to the more complex block-based abnormalities. When leads are missing, the subtle prolongations, delays, or morphological changes that define these block-based abnormalities are more difficult to detect, leading to a sharper decline in model performance. By distinguishing abnormalities in this domain-specific manner, the model could be optimized to allocate resources differently, with pulse rate–based conditions requiring less structural information while conduction blocks demanded greater lead preservation. This categorization not only improved interpretability but also explained the observed performance gap, as reflected in higher F1 Scores and Jaccard Index values for conduction abnormalities when this grouping strategy was applied. Table 3 shows the lead loss analysis of the proposed model.
The results from the lead loss analysis provide valuable insights into the model’s ability to handle incomplete ECG data. The differential impact of lead loss on pulse rate-based and block-based abnormalities underscores the importance of tailoring model strategies to the specific characteristics of each type of abnormality. By grouping abnormalities into two categories—pulse rate-based and block-based—we were able to optimize the model’s performance, achieving higher classification accuracy and stability across different lead loss scenarios.
Table 3: Lead loss analysis of the proposed ResNet model after grouping.
| Disease | Average | STD | Min | Max | Average | STD | Min | Max | |
|---|---|---|---|---|---|---|---|---|---|
| 1dAVb | Accuracy | 0.959 | 0.003 | 0.950 | 0.965 | 0.922 | 0.005 | 0.905 | 0.933 |
| F1 Score | 0.956 | 0.004 | 0.908 | 0.965 | 0.916 | 0.007 | 0.831 | 0.933 | |
| Jaccard | 0.933 | 0.061 | 0.416 | 0.960 | 0.879 | 0.081 | 0.263 | 0.924 | |
| RBBB | Accuracy | 0.961 | 0.003 | 0.952 | 0.968 | 0.925 | 0.005 | 0.908 | 0.938 |
| F1 Score | 0.957 | 0.005 | 0.915 | 0.968 | 0.917 | 0.010 | 0.844 | 0.938 | |
| Jaccard | 0.931 | 0.072 | 0.184 | 0.959 | 0.876 | 0.086 | 0.102 | 0.922 | |
| LBBB | Accuracy | 0.945 | 0.003 | 0.929 | 0.953 | 0.896 | 0.006 | 0.867 | 0.911 |
| F1 Score | 0.931 | 0.018 | 0.759 | 0.952 | 0.872 | 0.030 | 0.611 | 0.909 | |
| Jaccard | 0.849 | 0.083 | 0.401 | 0.937 | 0.746 | 0.114 | 0.251 | 0.882 | |
| SB | Accuracy | 0.885 | 0.008 | 0.842 | 0.901 | 0.794 | 0.013 | 0.727 | 0.821 |
| F1 Score | 0.858 | 0.028 | 0.623 | 0.899 | 0.753 | 0.041 | 0.452 | 0.816 | |
| Jaccard | 0.769 | 0.104 | 0.070 | 0.872 | 0.634 | 0.116 | 0.036 | 0.773 | |
| ST | Accuracy | 0.948 | 0.021 | 0.831 | 0.971 | 0.902 | 0.037 | 0.712 | 0.943 |
| F1 Score | 0.912 | 0.063 | 0.533 | 0.972 | 0.845 | 0.097 | 0.364 | 0.945 | |
| Jaccard | 0.793 | 0.142 | 0.377 | 0.971 | 0.679 | 0.185 | 0.232 | 0.943 | |
| AF | Accuracy | 0.947 | 0.017 | 0.838 | 0.967 | 0.900 | 0.030 | 0.721 | 0.936 |
| F1 Score | 0.917 | 0.063 | 0.329 | 0.966 | 0.852 | 0.090 | 0.197 | 0.934 | |
| Jaccard | 0.770 | 0.221 | 0.004 | 0.961 | 0.668 | 0.240 | 0.002 | 0.925 | |
| Normal ECG | Accuracy | 0.956 | 0.007 | 0.905 | 0.965 | 0.915 | 0.013 | 0.827 | 0.933 |
| F1 Score | 0.941 | 0.026 | 0.718 | 0.965 | 0.890 | 0.043 | 0.560 | 0.933 | |
| Jaccard | 0.845 | 0.142 | 0.004 | 0.960 | 0.751 | 0.164 | 0.002 | 0.922 |
This grouping strategy not only improved the model’s robustness but also ensured that the model could handle real-world ECG data with varying levels of completeness. These findings emphasize the need for adaptive models that can efficiently process incomplete ECG signals, making them more suitable for deployment in clinical settings where missing leads are a common occurrence. Table 4 shows the evaluation metrics for the grouped classification.
Table 4: Evaluation metrics for the grouped classification of abnormalities.
| S. No. | Metric | Proposed |
|---|---|---|
| 1 | Hamming Loss | 0.02115 |
| 2 | Subset Accuracy | 0.95117 |
| 3 | Macro Precision | 0.96328 |
| 4 | Macro Recall | 0.95313 |
| 5 | Macro F1 Score | 0.95811 |
| 6 | Micro Precision | 0.96315 |
| 7 | Micro Recall | 0.95289 |
| 8 | Micro F1 Score | 0.95799 |
| 9 | Jaccard Index | 0.91964 |
| 10 | Coverage Error | 1.14367 |
The proposed model achieves an overall accuracy of 91.25%; however, misclassification cannot be fully avoided. Since the classification task is multilabel, accuracy improves only when all abnormalities in a given record are correctly identified. In practical scenarios, however, detecting even a single abnormality is often sufficient to trigger further medical evaluation. This is reflected in the performance metrics, with a micro-precision of 96.31% and a micro-recall of 95.29%, along with a macro-precision of 96.33% and a macro-recall of 95.31%. The high recall values indicate that the model effectively minimizes false negatives, ensuring that abnormalities are less likely to be overlooked, while the high precision demonstrates that false positives remain limited.
7.5 Clinical Implications and Potential Applications
The findings of this study suggest strong potential for integration of the proposed model into wearable devices designed for household use, particularly for high-risk populations such as elderly individuals or professional athletes who require continuous cardiac monitoring. The consistently high recall achieved by the model minimizes the likelihood of false negatives, ensuring that abnormalities are rarely overlooked during early screening. This makes the system a reliable tool for identifying individuals who may need timely medical attention, thereby reducing the risk of undetected cardiovascular events.
Moreover, the analysis of ECG Age deviation provides an additional layer of clinical insight. For normal ECGs, the close alignment of predicted ECG Age with chronological age reflects cardiac stability, whereas the pronounced deviations observed in abnormal cases highlight a potential marker for underlying cardiovascular stress or pathology. This metric could serve as an early warning signal, prompting further medical evaluation even before overt symptoms appear.
By combining accurate abnormality detection with ECG Age–based risk stratification, the model offers a practical pathway toward preventive cardiac care. In real-world deployment, flagged cases could be seamlessly referred for confirmatory diagnostic testing, while individuals with stable readings could be reassured. Such an approach aligns with the vision of proactive healthcare, where wearable devices extend the reach of clinical monitoring into daily life, enabling early intervention and reducing the burden of late-stage cardiovascular disease.
To enhance the evaluation of the proposed method, additional analyses were conducted on more practical and complex cases. Given the multilabel nature of the CODE-15% dataset, individual ECGs may contain multiple abnormalities. Performance was therefore examined separately for single-abnormality and multi-abnormality cases. Results indicated that while classification was most accurate for single-abnormality ECGs (micro-F1 = 98.65%), performance remained strong for multi-abnormality ECGs (micro-F1 = 95.16%), demonstrating the ability of the model to handle overlapping pathological conditions.
Further stratification by demographic factors confirmed robustness across population subgroups. Consistent recall values (>94.5%) were observed across different age groups (<40, 40–60, >60 years) and sexes, indicating that predictive performance was not biased towards specific cohorts.
In addition, representative case-level examples were examined to illustrate the clinical interpretability of the model. For a normal ECG, the deviation between chronological age and predicted ECG Age remained within the MAE, aligning with expected cardiac health. Conversely, for an ECG containing four abnormalities, the predicted ECG Age deviated substantially beyond the MAE, reflecting heightened cardiovascular risk. These examples demonstrate the model’s potential value for clinical screening and risk stratification.
7.6 Real-time Performance and Computational Requirements
Inference latency was benchmarked on a Kaggle-hosted NVIDIA P100 GPU using the trained model and a test set of 3282 ECG segments (input shape 4096 × 12). With a batch size of 16, a single model predict pass completed in approximately 3.0 s, corresponding to ~23 ms per step reported by Keras. This translates to an effective latency of ~0.914 ms per sample and a throughput of ~1094 samples/s under the tested configuration. These results demonstrate that the model is capable of near–real-time inference when applied to ECG windows of similar length. While these measurements provide an upper-bound estimate on commodity cloud graphics processing units (GPUs), future work will focus on profiling latency and memory footprint on resource-constrained edge devices (e.g., embedded GPUs and neural processing units (NPUs)), as well as central processing unit (CPU)-only deployments, to further validate the feasibility of real-world applications.
This research introduced a ResNet-based deep learning framework for the classification of ECG signals into six categories: Normal, AF, LBBB, RBBB, SB, and ST. The proposed approach demonstrated significant efficacy in leveraging deep convolutional architectures for accurate and robust automated ECG diagnosis. By employing a sophisticated feature extraction mechanism, the ResNet model consistently showcased strong performance, making it a valuable tool for advancing automated cardiology.
The study extended its scope to evaluate the impact of missing leads on model performance, addressing practical challenges in real-world ECG acquisition scenarios. While the model exhibited robust performance under conditions of minimal lead loss, significant degradation was observed as lead loss increased. This was particularly evident in ECG categories characterized by complex patterns, such as AF and LBBB, highlighting the sensitivity of certain conditions to data completeness. Variations in performance across categories emphasized the importance of adapting diagnostic strategies to the unique characteristics of specific cardiac abnormalities.
Comprehensive evaluation metrics, including F1 Score and Jaccard Index, provided a detailed understanding of the model’s capabilities and limitations. These metrics underscored the importance of signal integrity for achieving reliable diagnostic performance, particularly in resource-constrained environments or applications involving wearable devices.
Although the proposed model achieves an accuracy of 91.25%, misclassification cannot be fully avoided. As the approach is designed with the aim of future deployment in wearable devices, its primary role would be to function as an early warning and screening tool. In this context, recall and precision would be given more priority, since they deal with false positives and false negatives. In practical use, flagged abnormalities would be referred for further medical evaluation, thereby mitigating risks associated with misdiagnosis. This work makes a significant contribution to the field of automated ECG analysis by presenting a robust methodology for enhancing diagnostic accuracy. The insights gained from this analysis serve as a foundation for further developments aimed at improving the resilience of diagnostic systems to incomplete or noisy data. Future advancements may focus on incorporating domain adaptation techniques, leveraging transfer learning for rare cardiac conditions, and developing innovative methods for data augmentation and imputation.
Further directions include extending the approach to larger and more diverse ECG datasets, particularly those obtained from wearable sensors such as chest- and wrist-based devices. This would strengthen the model’s ability to operate reliably on real-world signals that are often noisy and incomplete. Another important avenue involves designing lightweight architectures suitable for deployment on portable and resource-constrained devices, enabling real-time ECG monitoring and efficient processing in everyday healthcare settings. Addressing the challenges of real-time noisy data streams and embedding robust models for continuous use will be critical to achieving dependable performance.
Although this study evaluated model performance under missing-lead scenarios, practical deployment requires strategies to handle lead loss in real-world applications. Future work could focus on developing methods to address this challenge, such as signal imputation using deep learning-based reconstruction models, prioritizing information from the most reliable leads, or training dedicated classifiers that can operate effectively with a reduced subset of leads. Another direction is to integrate a fallback mechanism that flags uncertain predictions when critical lead information is unavailable, prompting re-acquisition or confirmatory testing. These approaches would further enhance the robustness and reliability of the system, making it better suited for wearable and clinical applications where lead loss is common.
Finally, integration with telemedicine platforms and wearable health monitoring systems holds considerable potential. Embedding automated ECG models into such frameworks can enable instantaneous diagnostic feedback and real-time alert generation, supporting clinicians and empowering patients with early detection capabilities. These advancements would not only enhance the practicality of automated ECG analysis but also accelerate its translation into routine clinical practice, aligning technological progress with healthcare needs.
Acknowledgement:
Funding Statement: The authors received no specific funding for this study.
Author Contributions: The following contributions to the work are confirmed by the authors: Divya Arivalagan and Vignesh Ochathevan designed and conceptualized the study; Divya Arivalagan, Vignesh Ochathevan, and Rubankumar Dhanasekaran collected the data; Vignesh Ochathevan and Rubankumar Dhanasekaran analyzed and interpreted the findings; and Divya Arivalagan and Vignesh Ochathevan prepared the manuscript. All authors reviewed the results and approved the final version of the manuscript.
Availability of Data and Materials: The dataset used in this study is openly available at https://github.com/antonior92/ml4ecg-resources?tab=readme-ov-file, accessed on 04 September 2025 (https://doi.org/10.5281/zenodo.4916206). The data supporting this article shall be provided with upon reasonable request to the corresponding author, Vignesh Ochathevan.
Ethics Approval: Not applicable.
Conflicts of Interest: The authors declare no conflicts of interest to report regarding the present study. No author has received any financial assistance, employment, consultancies, stock ownership, honoraria, paid expert testimony, or other personal or institutional benefits from commercial entities or organizations that could be perceived to affect the conclusions or interpretation of this research. All authors confirm that they have no competing interests to declare, and the research was conducted independently and objectively.
Abbreviations
| 1st-Degree Atrio-Ventricular Block | |
| Atrial Fibrillation | |
| Convolutional Neural Network | |
| Electrocardiogram | |
| Electrocardiographic Age | |
| Left Bundle Branch Block | |
| Right Bundle Branch Block | |
| Residual Neural Network | |
| Sinus Bradycardia | |
| Sinus Tachycardia |
References
1. Ribeiro AH, Ribeiro MH, Paixão GM, Oliveira DM, Gomes PR, Canazart JA, et al. Automatic diagnosis of the 12-lead ECG using a deep neural network. Nat Commun. 2020;11(1):1760. doi:10.1038/s41467-020-15432-4. [Google Scholar] [CrossRef]
2. Lima EM, Ribeiro AH, Paixão GM, Ribeiro MH, Pinto-Filho MM, Gomes PR, et al. Deep neural network estimated electrocardiographic age as a mortality predictor. Nat Commun. 2021;12(1):5117. doi:10.1038/s41467-021-25351-7. [Google Scholar] [CrossRef]
3. Dhyani S, Kumar A, Choudhury S. Analysis of ECG-based arrhythmia detection system using machine learning. MethodsX. 2023;10:102195. doi:10.1016/j.mex.2023.102195. [Google Scholar] [CrossRef]
4. Wu M, Lu Y, Yang W, Wong SY. A study on arrhythmia via ECG signal classification using the convolutional neural network. Front Comput Neurosci. 2021;14:564015. doi:10.3389/fncom.2020.564015. [Google Scholar] [CrossRef]
5. Wu H, Patel KHK, Li X, Zhang B, Galazis C, Bajaj N, et al. A fully-automated paper ECG digitisation algorithm using deep learning. Sci Rep. 2022;12(1):20963. doi:10.1038/s41598-022-25284-1. [Google Scholar] [CrossRef]
6. Wan D, Zhang L, Bai Y, Xie Y. Research on identification algorithm based on ECG signal and improved convolutional neural network. J Phys Conf Ser. 2021;1757(1):012046. doi:10.1088/1742-6596/1757/1/012046. [Google Scholar] [CrossRef]
7. Sankar NP, Jayaram R, Sherly SI, Gnanaprakasam C. Study of ECG analysis based cardiac disease prediction using deep learning techniques. Int J Intell Syst Appl Eng. 2023;11(4):431–38. [Google Scholar]
8. Ao R, He G. Image-based deep learning in 12-lead ECG diagnosis. Front Artif Intell. 2023;5:1087370. doi:10.3389/frai.2022.1087370. [Google Scholar] [CrossRef]
9. Holmstrom L, Chugh H, Nakamura K, Bhanji Z, Seifer M, Uy-Evanado A, et al. An ECG-based artificial intelligence model for assessment of sudden cardiac death risk. Commun Med. 2024;4(1):17. doi:10.1038/s43856-024-00451-9. [Google Scholar] [CrossRef]
10. Ha AC, Doumouras BS, Wang CN, Tranmer J, Lee DS. Prediction of sudden cardiac arrest in the general population: review of traditional and emerging risk factors. Can J Cardiol. 2022;38(4):465–78. doi:10.1016/j.cjca.2022.01.007. [Google Scholar] [CrossRef]
11. Panjaitan F, Nurmaini S, Partan RU. Accurate prediction of sudden cardiac death based on heart rate variability analysis using convolutional neural network. Medicina. 2023;59(8):1394. doi:10.3390/medicina59081394. [Google Scholar] [CrossRef]
12. Kolk MZ, Ruipérez-Campillo S, Wilde AA, Knops RE, Narayan SM, Tjong FV. Prediction of sudden cardiac death using artificial intelligence: Current status and future directions. Heart Rhythm. 2024;22(3):756–66. doi:10.1016/j.hrthm.2024.09.003. [Google Scholar] [CrossRef]
13. Hayıroğlu Mİ, Altay S. The role of artificial intelligence in coronary artery disease and atrial fibrillation. Balk Med J. 2023;40(3):151–2. doi:10.4274/balkanmedj.galenos.2023.06042023. [Google Scholar] [CrossRef]
14. Cicek V, Orhan AL, Saylik F, Sharma V, Tur Y, Erdem A, et al. Predicting short-term mortality in patients with acute pulmonary embolism with deep learning. Circ J. 2025;89(5):602–11. doi:10.1253/circj.CJ-24-0630. [Google Scholar] [CrossRef]
15. Alkhodari M, Fraiwan L. Convolutional and recurrent neural networks for the detection of valvular heart diseases in phonocardiogram recordings. Comput Methods Programs Biomed. 2021;200:105940. doi:10.1016/j.cmpb.2021.105940. [Google Scholar] [CrossRef]
16. Wang L, Li X, Deng Z, Cai Q, Lei P, Xu H, et al. Neuroendoscopic parafascicular evacuation of spontaneous intracerebral hemorrhage (nesich technique): a multicenter technical experience with preliminary findings. Neurol Ther. 2024;13(4):1259–71. doi:10.1007/s40120-024-00642-5. [Google Scholar] [CrossRef]
17. Quiroz-Juárez MA, Jiménez-Ramírez O, Vázquez-Medina R, Ryzhii E, Ryzhii M, Aragón JL. cardiac conduction model for generating 12 lead ECG signals with realistic heart rate dynamics. IEEE Trans Nano Biosci. 2018;17(4):525–32. doi:10.1109/TNB.2018.2870331. [Google Scholar] [CrossRef]
18. Bousselijot RD. PTB Diagnostic ECG Database. Phys-Tech Bundesanst. 2004;212:10587. [Google Scholar]
19. Wagner P, Strodthoff N, Schaeffter T. PTB-XL, a large publicly available electrocardiography dataset. Sci Data. 2020;7(1):1–15. doi:10.1038/s41597-020-0495-6. [Google Scholar] [CrossRef]
20. Asmare MH, Filtjens B, Woldehanna F, Janssens L, Vanrumste B. Rheumatic heart disease screening based on phonocardiogram. Sensors. 2021;21(19):6558. doi:10.3390/s21196558. [Google Scholar] [CrossRef]
21. Yin J, Qiao Z, Han L, Zhang X. EEG-based emotion recognition with autoencoder feature fusion and MSC-TimesNet model. Comput Methods Biomech Biomed Engin. 2025:1–18. doi:10.1080/10255842.2025.2477801. [Google Scholar] [CrossRef]
22. Xu G, Fan X, Xu S, Cao Y, Chen XB, Shang T, et al. Anonymity-enhanced sequential multi-signer ring signature for secure medical data sharing in IoMT. IEEE Trans Inf Forensics Secur. 2025;20:5647–62. doi:10.1109/TIFS.2025.3574959. [Google Scholar] [CrossRef]
23. Yilmaz A, Hayıroğlu Mİ, Salturk S, Pay L, Demircali AA, Coşkun C, et al. Machine learning approach on high risk treadmill exercise test to predict obstructive coronary artery disease by using P, QRS, and T waves’ features. Curr Probl Cardiol. 2023;48(2):101482. doi:10.1016/j.cpcardiol.2022.101482. [Google Scholar] [CrossRef]
24. Pan H, Li Z, Fu Y, Qin X, Hu J. Reconstructing visual stimulus representation from EEG signals based on deep visual representation model. IEEE Trans Hum-Mach Syst. 2024;54(6):711–22. doi:10.1109/THMS.2024.3407875. [Google Scholar] [CrossRef]
25. Wang Y, Shen Y, Li J, Wang T, Peng J, Shang X. Enhanced RNA secondary structure prediction through integrative deep learning and structural context analysis. Nucleic Acids Res. 2025;53(11):gkaf533. doi:10.1093/nar/gkaf533. [Google Scholar] [CrossRef]
26. Arivalagan D, Bhoopathy Began K, Ewins Pon Pushpa S, Rajendran K. A novel intelligent 12-layer convolutional neural network model for gender classification using fingerprint images. J Intell Fuzzy Syst. 2023;45(2):2685–706. doi:10.3233/JIFS-224284. [Google Scholar] [CrossRef]
27. Arivalagan D, Manav M, Vignesh O. Unveiling Alzheimer’s stages through transfer learning and custom CNN Layers. In: Proceedings of the 2024 International Conference on Distributed Computing and Optimization Techniques (ICDCOT); 2024 Mar 15–16; Bengaluru, India. p. 1–6. doi:10.1109/ICDCOT61034.2024.10515404. [Google Scholar] [CrossRef]
28. Mogili R, Narishmha G. A study on ECG signals for early detection of heart disease using machine learning techniques. J Theor Appl Inf Technol. 2021;99(18):4412–24. [Google Scholar]
29. Ebrahmi Z, Loni M, Daneshtalab M, Gharehbaghi A. A review on deep learning methods for ECG arrhythmia classification. Expert Syst Appl X. 2020;7:100033. doi:10.1016/j.eswax.2020.100033. [Google Scholar] [CrossRef]
30. Kachuee M, Fazeli S, Sarrafzadeh M. ECG Heartbeat Classification: A Deep Transferable Representation. In: Proceedings of the 2018 IEEE International Conference on Healthcare Informatics (ICHI); 2018 Jun 4–7; New York, NY, USA. p. 443–4. doi:10.1109/ICHI.2018.00092. [Google Scholar] [CrossRef]
Cite This Article
 Copyright © 2025 The Author(s). Published by Tech Science Press.
This work is licensed under a Creative Commons Attribution 4.0 International License , which permits unrestricted use, distribution, and reproduction in any medium, provided the original work is properly cited.
 Downloads
 Citation Tools