
 Submit a Paper
 Propose a Special lssue
 Open Access
ARTICLE

Measuring Reliability of A Web Portal Based on Testing Profile
1 COMSATS University Islamabad Vehari, Vehari, 61100, Pakistan
2 Universiti Teknologi Malaysia, Johor Bahru, 81310, Malaysia
3 College of Computer Science and Engineering, Taibah University, Medina, 41477, Saudi Arabia
4 Information System Department, Sheba Region University, Marib, 14400, Yemen
5 Suranaree University of Technology, Nakhon Ratchasima, 30000, Thailand
6 Khon Kaen University, Khon Kaen, 40000, Thailand
7 Umm Al-Qura University, Mecca, 24382, Saudi Arabia
8 Taibah University, Medina, 42353, Saudi Arabia
* Corresponding Author: Settawit Poochaya. Email:
Computers, Materials & Continua 2023, 74(3), 6641-6663. https://doi.org/10.32604/cmc.2023.031459
Received 18 April 2022; Accepted 07 June 2022; Issue published 28 December 2022
 View Full Text
 Download PDF
Abstract
Conventionally, the reliability of a web portal is validated with generalized conventional methods, but they fail to provide the desired results. Therefore, we need to include other quality factors that affect reliability such as usability for improving the reliability in addition to the conventional reliability testing. Actually, the primary objectives of web portals are to provide interactive integration of multiple functions confirming diverse requirements in an efficient way. In this paper, we employ testing profiles to measure the reliability through software operational profile, input space profile and usability profile along with qualitative measures of reliability and usability. Moreover, the case study used for verification is based on a web application that facilitates information and knowledge sharing among its online members.The proposed scheme is compared with the conventional reliability improvement method in terms of failure detection and reliability. The final results unveil that the computation of reliability by using the traditional method (utilizing failure points with the assistance of Mean Time Between Failures (MTBF) and Mean Time To Failure (MTTF) becomes ineffective under certain situations. Under such situations, the proposed scheme helps to compute the reliability in an effective way. Moreover, the outcomes of the study provide insight recommendations about the testing and measurement of reliability for Web based software or applications.
Keywords
The Internet is a backbone of communication and connectivity, while web is a backbone of data and knowledge. The web has transformed not only the hardware industry but also the software because software era is inclining towards web applications, web portals and now interlinked mobile applications. Undeniably, the reliability of this class of software is still a question that needs to be answered. The reliability of software can be defined as an ability to perform the required functionality under certain conditions for a specific time [1]. Software reliability is itself a combination of few characteristics which are i) Maturity related to hardware, software or data, ii) Fault tolerance, and iii) Recoverability related to data, process and technology [2–5]. Although software reliability is significantly important for the quality of conventional software systems, web applications require another significant factor that is a software usability [6].
As stated by Khan [7], usable and reliable web-based software allow quick task execution in an interactive and efficient way. Usability is translated according to the handling of user requirements efficiently, and it is measured through six factors [8–11] that are (i) Functionally correctness: the system performs the functions that users need, (ii) Efficiency: the time required to perform some particular tasks, (iii) Ease of learning: how quickly users can be accustomed to utilizing some features or functions, (iv) Memorability potential of remembering the sequences, features or actions to perform a certain task, (v) Error tolerance: how well errors are prevented, and (vi) Aesthetics or subjectively pleasing. These factors require different testing, quantifications and quality measurements.
In this paper, we analyse the conventional method of computing reliability using failure points with the help of MTTF and MTBF. In addition, if the conventional method becomes inefficient, then we explore the effectiveness of the proposed work by calculating the reliability in an effective way. In order to achieve these objectives, the study computed reliability without testing profile using the case study and then it re-computed reliability with testing profile with the aim of unveiling the effectiveness of the proposed algorithm. The proposed work utilizes testing profile that includes a stack of weighted profiles, software operational profile and input space profile. Moreover, other profiles can be appended in the testing profile based on the significance and nature of software. In this case, reliability is quantified through standard reliability models. The scope of the study is not focused to comprehensive usability testing, which requires massive testing effort and quantification of maturity, precision, efficiency and generalizability.
Section 2 provides the related works. Section 3 explains the proposed approach applied on the selected case study, followed by the test design in Section 4. Section 5 reports the results and discussion of the study. Section 6 covers the reliability aspects and finally the paper is concluded in Section 7.
For websites, web portals or web-based applications, requirement specifications followed by the design level require conformance to the purpose. Software requirements should meet users’ stated requirements in this perspective too, otherwise it may loose users’ acceptance. A website exhibiting bad usability is losing its acceptance from potential users [12,13]. Software and technology developers focus heavily on usability testing to assessthe realistic usefulness of their products before the product actually reach commercial users. In [14], a case study is conducted to construct an automated tool for measuring realistic usability of the targeted web application or software.
In e-learning systems, it’s found that now companies are investing a significant amount of time and resources to achieve higher usability for a long term competitive edge compared to other quality factors that affect the overall cost. Properly designed usability plan during engineering of web software requires primitive adjustments with less resources to boast the level of usability [15,16]. Mobile application development requires a different methodology to inculcate better usability, user-oriented development with real user involvement in the process. Mobile applications require testing and design conformance with mobile context andconnectivity. Moreover potential users can provide feedback in almost all decisions such as screen sizes, layouts, data entry design and input methods of mobile application. Research conducted by Zahra et al. [17] showed that quality engineers focus less towards usability testing, while maintaining a higher focus on performance.
Uthansakul et al. [18] focuses on the need of usability, clarity and learnability for governmental websites to win the public trust. Ali-Shahid et al. [19] categorise usability inspection methods through Pluralistic Walkthrough (PW), Heuristic Evaluations (HE), Cognitive Walkthrough (CW), and feature review. The techniques that are in line for the assessment of their hypothesis constitute of performance evaluation, remote usability testing and coaching. Another research measured usability as a score based upon effectiveness, efficiency and satisfaction, still the scores are not used to measure reliability of part of any such measurement.
The gap found through existing research is absence of specialized reliability models for web based software engineering, mainly due to the complexity of constructing Web based operational profile as highlighted by Takagi et al. [20]. Theresearch is focusing identifiedarea by using a web based operational profile with an easy to implement guidelines. Typical test coverage is done via code coverage or execution path coverage with the assumption that it will reveal all the failure points [21,22]. Although this testing technique is insufficient for reliability testing, more focused reliability testing of Web based software or application is required.
3 Operational Profile Based Testing
Reliability testing falls under operational profile based testing or sometimes called operational testing. Targetsoftware is tested with estimated inputs to mimic users’ behaviour. Reliability is computed from the results using or crash data [23] which is novelty of this work. The research proposes an approach to improve reliability; verifiable through a case study that is a Web portal. Operational profile based testing is extended to include more profiles and generate test cases and test focus, which can be used to obtain desired results. Test results failure data can be analysed and used to computeMTTF and MTBF scores to gauge the desired reliability. The complete process adopted for the testing is shown in Fig. 1.
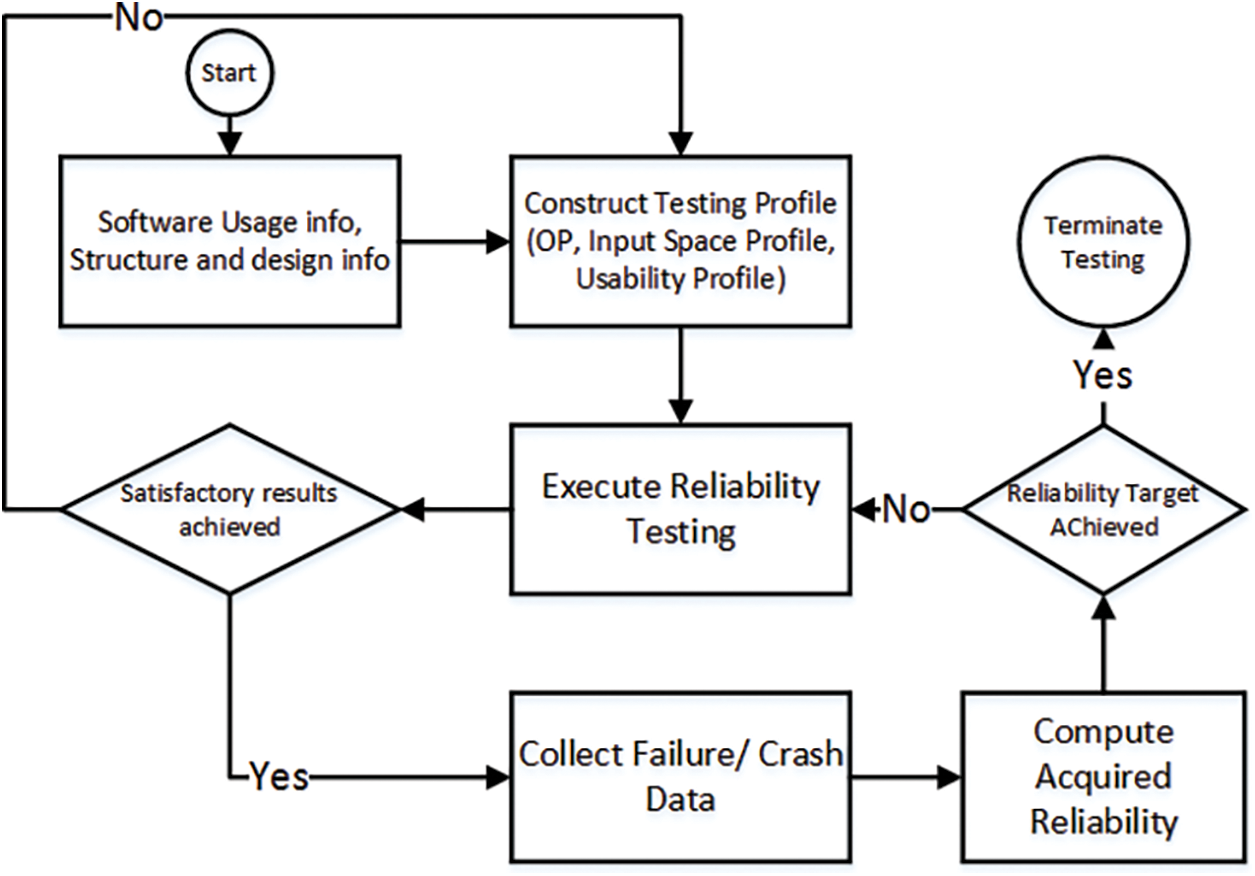
Figure 1: Process for software reliability testing
In order to improve software reliability and to achieve better coverage, multiple profiles are used. Every profile is given weight according to the software nature. For data and input driven software, Input Space Profile (ISP) gets higher weight. For Web based systems Usability Profile (Up), it is included, while operational profile (Op) remains a core part of software reliability engineering. Testing profile (TP) is shown in Eq. (1).
More weight is given to UP and less weight is given to OP. Operational profile estimates the usage of operations regarding probabilities. Input Space profile estimates the probability of each input influencing the operations, while usability profile estimates the usable likelihood of the software. Testing profile can guide testing as well as provide a better allocation of testing resources, for example, testing time for each unit of the application under test.
The selected case study is a web-portal, hosted on a Hypertext Preprocessor (PHP) based web-server, and the clients get HTML request responses with embedded JavaScript for client-side validation and authorization. Reliability is a main concern in cases when multiple instances are accessed and any of scripted module crashes or function failure occurs at the server. Usability focus is on how efficient and easiness users feel while accessing different modules. The software is designed with the help of Unified Modeling Language (UML) diagram, which is available to reliability and usability testers. The Fig. 2 shows the use case diagram of the Web application used as the case study.
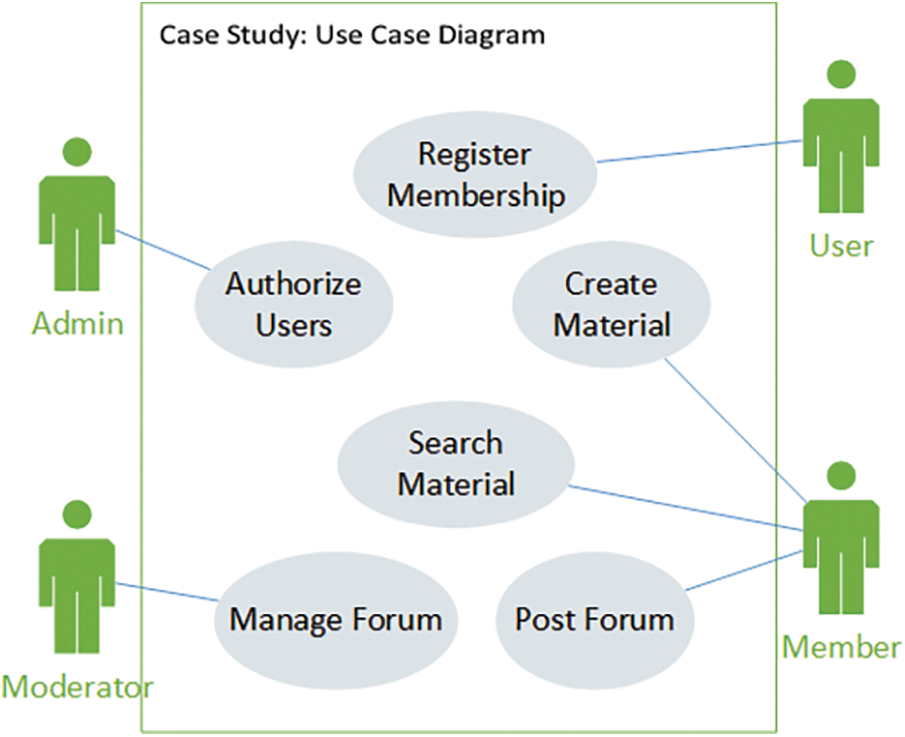
Figure 2: Use case diagram of the case study
The case study taken is having four core components:
• Member: the module presents the member view where a member can create new resources, search created resources, and if the member has special privileges, it can set privileges of other members.
• Material: the module presents material view. Material is created, associated with members and deleted after it is no more required.
• Forum: the module monitors the forum privileges allocated to different users as admin, moderator, and mentor.
• Login and Registration: to ensure the authorization and obtain the rights associated with the signing user.
There are three main actors as shown in the use case diagram (Fig. 2). The user gets permission through session-based privileges to act as a member or an admin. All three actors also elicit the user requirements, as these actors are coded as user roles into the system under test. State diagram in Fig. 3 shows the working of the software. Nodes show the states and arrows that contain the transition and are labelled with event number and/or trigger.
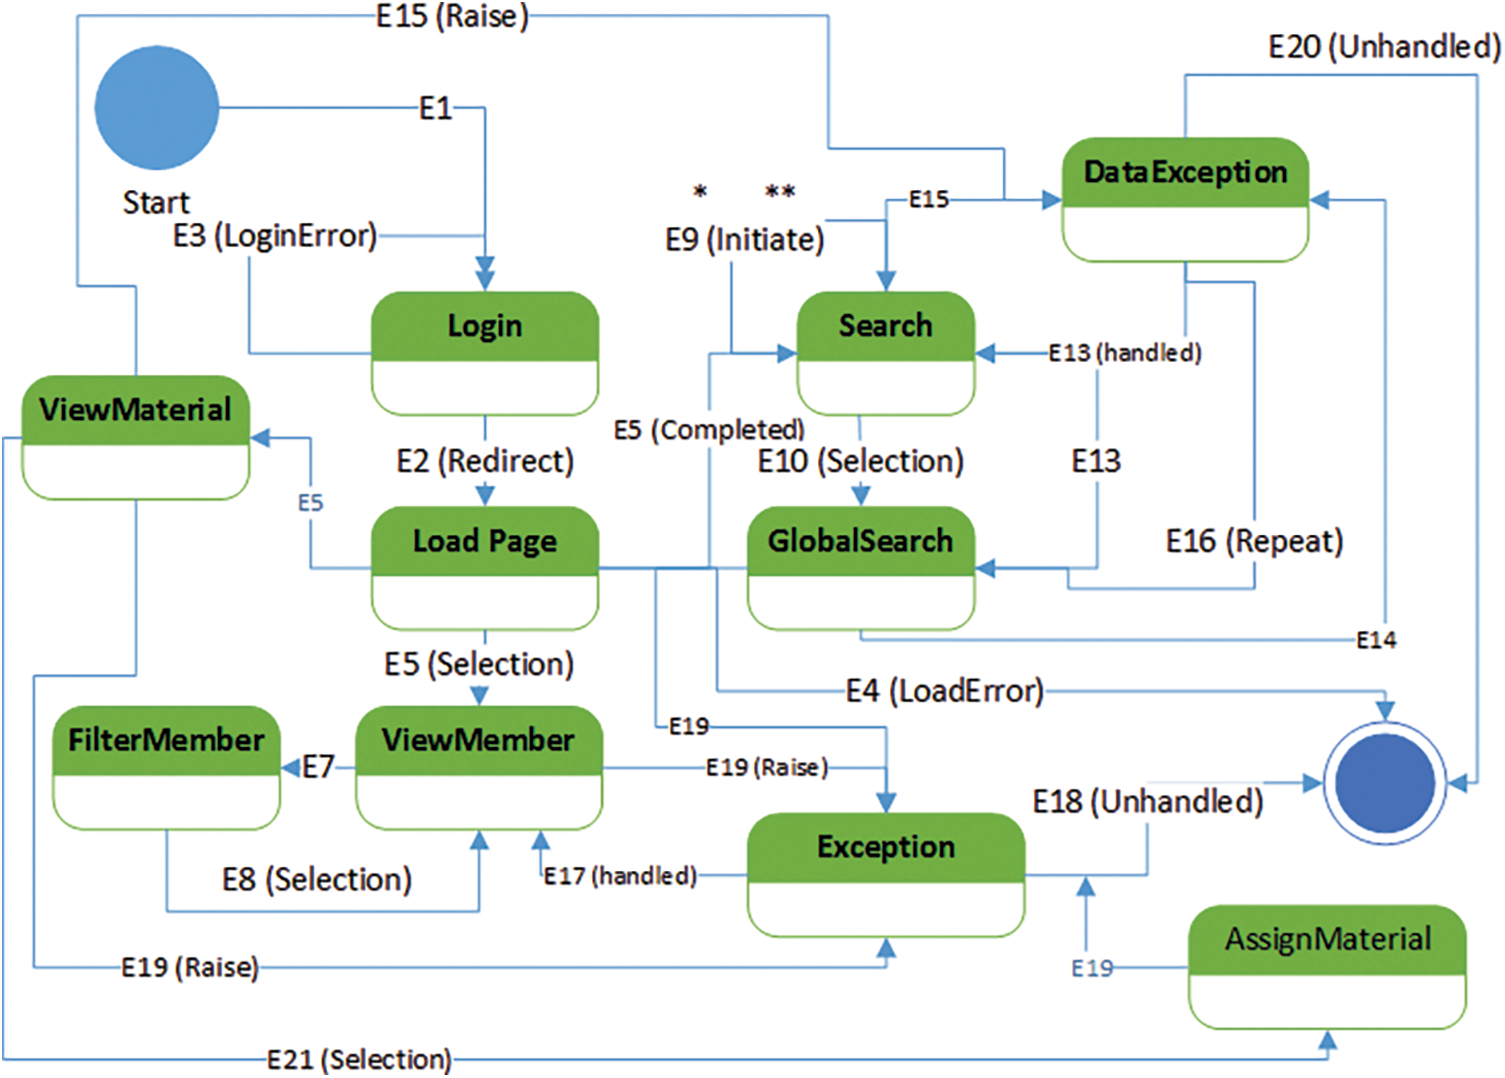
Figure 3: State diagram for the case study
Some states are self-repeating and controlled by some input or trigger, as login state keeps transiting to itself if the trigger is unsuccessful login. Although state diagram is not the actual representation of a website/web-portal, the website a webpage can yield two or even more states. The design of a webpage can accommodate single or multiple functions, and on contrast, a single function can be designed into many webpages. Hence, a state can spread over many Web pages as well. The main states that require a focus can be detected by counting total transitions that they are linked with, including self-transitions. Tab. 1 presents the total number of transitions for any state.

3.3 Operational Profile Construction
Transitions generated by each state are measured with the help of state counts as shown in Tab. 1. Three possible events occur in each state:
• The state is activated by some other states.
• The state transits to itself.
• The state transits to another state.
In Tab. 1, the links of each of three state transitions are counted. State diagram can help in estimating usage probabilities of functions, modules and then higher level components. The usage probabilities are used for the construction of software operational profile. Operational profile is a valuable tool for estimating the total number of test cases that each unit under test requires [24]. Tab. 2 contains the operational profile for modules, derived from state based operational profile of web modules.

Module system providing system functions as exception-handling possesses has the highest usage probability, while ungrouped webpages are grouped as other modules and contain the lowest usage probability. For more depth of reliability testing, operational profile for functions, users, and other standard hierarchical components can be generated as guided by operational profile based reliability studies [25,26]. Complete reliability testing is supervised by all three profiles which are the part of testing profile with their relative weights according to the nature of the software as shown is Fig. 4. The size ratio between each profile as shown in Eq. (1), determines the resources allocated and a number of test cases generated for each of the profile. Apparently, for this study, more resources are allocated to usability testing.
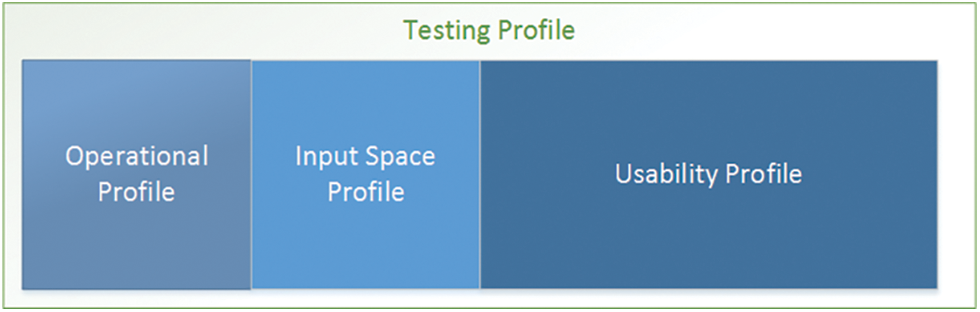
Figure 4: Testing profile for the case study
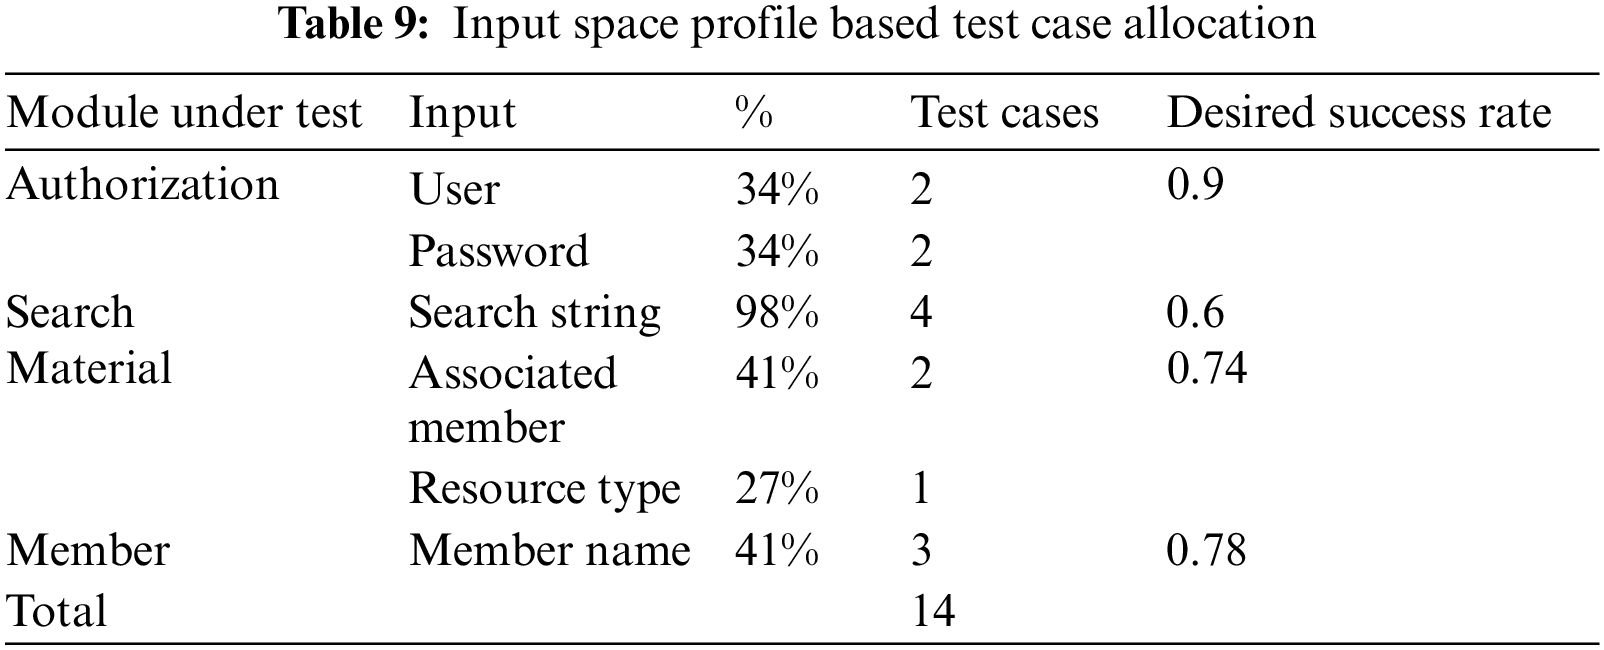
Input space profile estimates the cumulative probability of inputs attached to modules. With the help of input space profile, more resources can be associated with modules having a significant number of inputs (in terms of cumulative probability density). Also, better input coverage leads to improved reliability testing and focused test cases that can be created rather than having one test case for every input value [27]. Time management for total testing can be improved as well. Input space profile is shown in Tab. 3, using Eq. (2).

Inspecting the values (Eq. (2)) informs that search string contains most possibilities of inputs and requires more attention by reliability testers. Search modules also require more focus as it contains search string.
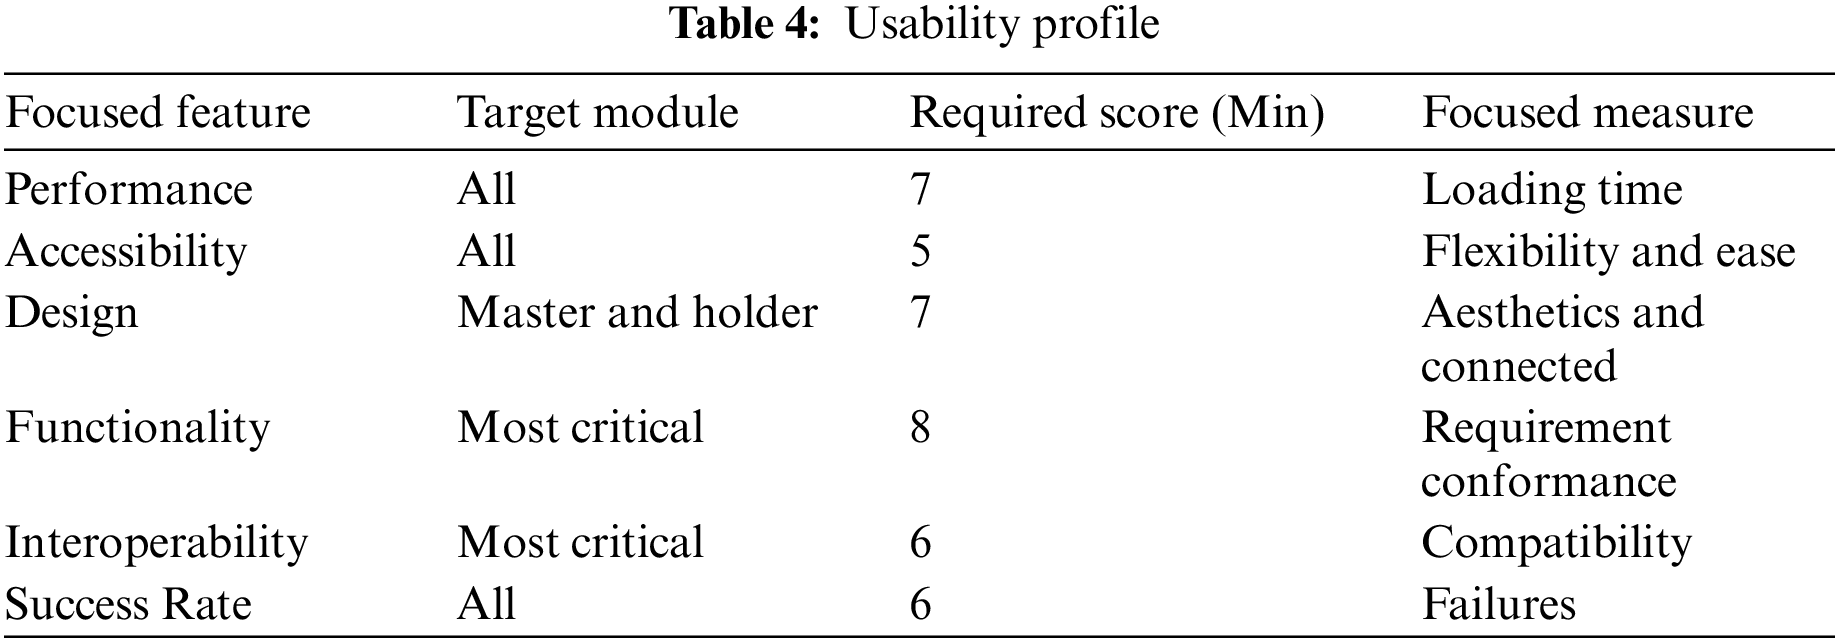
Usability testing requires users to test the software with real tasks, which requires a controlled environment and planned scenarios [28]. One of the most important aspects of a website in user’s perspective is its design. Usability testing can help to improve it. Usability testing can reveal errors, failures over the timeline which can be used for reliability calculations [29–31]. Usability profile for the case study is shown in Tab. 4 that guides usability testers to achieve required scores.
Test design specifies the test details, and the approaches adopted for the software feature(s). The chosen test design for this study contains three sections: (i) Objectives (ii) Test focus, (iii) Test plan and (iv) Coverage of tests, which are shown in Fig. 5.
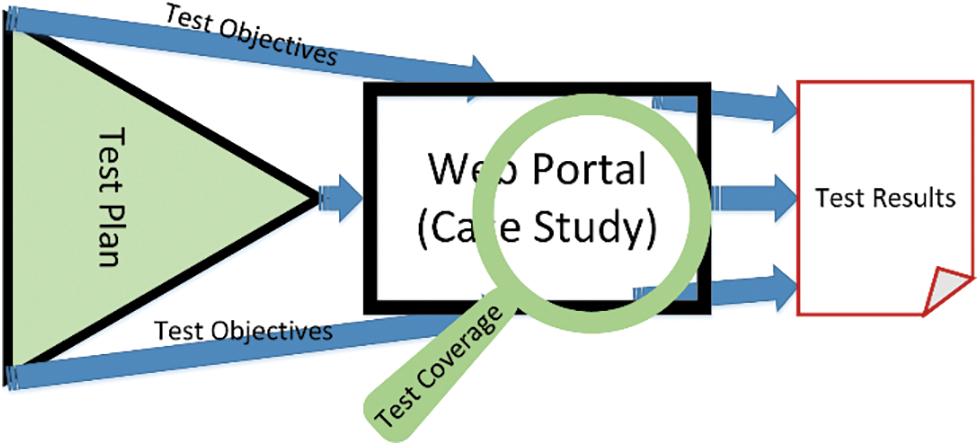
Figure 5: Test design for the case study
4.1 Test Objectives and Their Focus
Test objectives enlist the outcomes required, weaknesses targeted, and validation of test strength for Software Under Test (SUT). Test objectives are:
• The revelation of failure points
• The trapping of errors and crashes.
• Finding the weaknesses in design and theme of the software.
• Reducing the testing effort with a better focus.
The test focus adopted for the case study is evaluating the effectiveness of a web design that meets the laid requirements. Also, with conformance to requirements, reliability needs to be measured for the research. To measure usability and reliability, tasks have been focused with the help of usability profile. To accomplish focused tasks, testing scenarios are created, which mimics the realistic tasks to be performed using the software. Each scenario is assigned the weight, and the success gives positive score in the event of failure, zero score is given. Failure reasons and time are recorded for the reliability testing. Scenario generation is done not only for conformance testing (positive testing), but also for non-conformance testing (negative testing).
Scenarios are based upon certain task objective given in the form of questions. Such questions are answered using positive and negative narrative testing. Positive (+ve) testing verifies the presence of the required feature, property or functionality. While, negative (−ve) testing investigate the weaknesses, faults and defects in a testable unit (e.g., a code). For the particular case study, the focus towards conformance questions includes:
• Create a scenario that meets the task requirement (+ve testing).
• Create scenario where user supposedly completes a key task in certain time (+ve testing).
• Create a scenario that leads to task failure or possibly a crash (−ve testing).
• Create a scenario where user can give like certain features (+ve testing).
• Create a scenario where user feels irritated about certain feature (−ve testing).
This type of testing is geared towards usage measurement and requirement validation in the web design. This particular testing will identify tasks from the start to termination of a particular scenario being executed over the SUT. This method is required to verify the navigation and record the interaction that whether a user inputs legal or illegal inputs. The technique also records deviations from original test scenarios. Negative testing can potentially arouse failures or reveal faults.
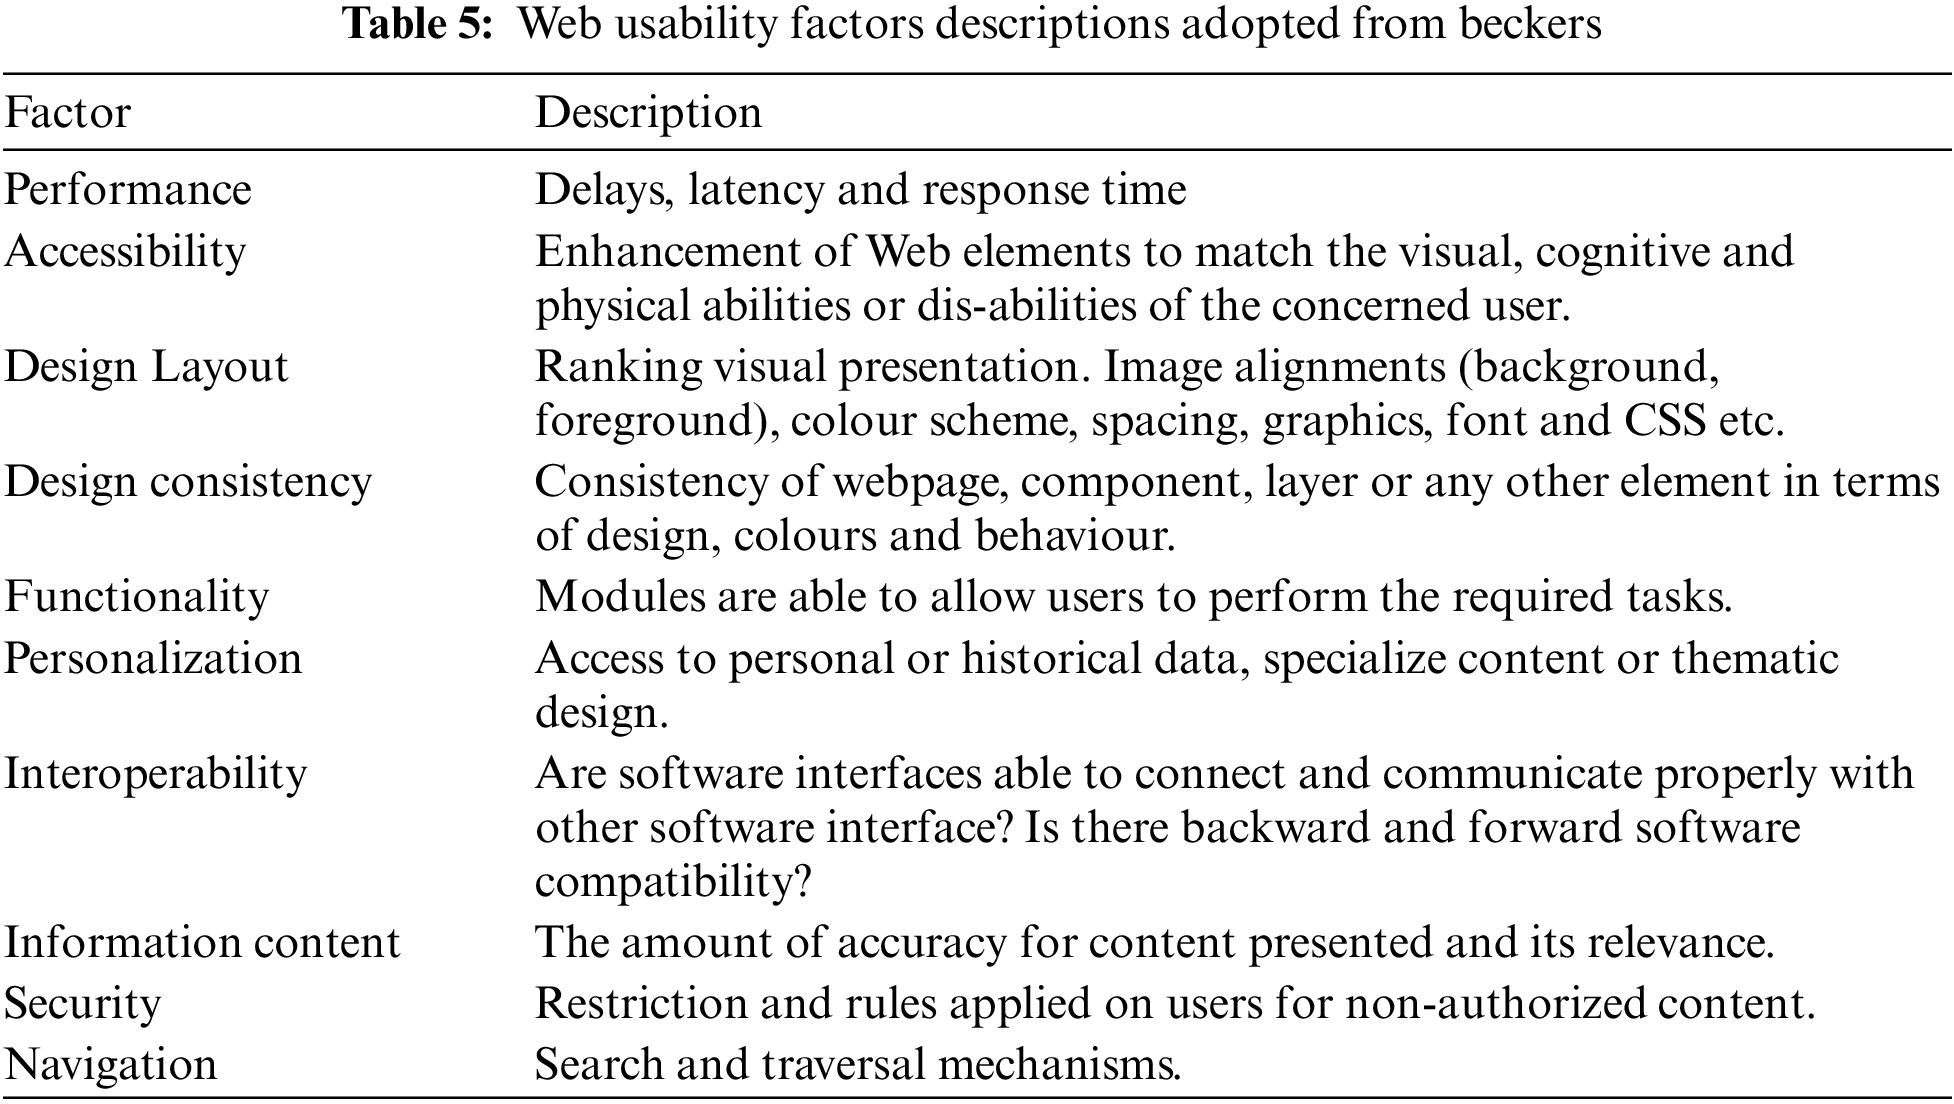
Usability is measured through Web usability factors as given in the usability profile (Tab. 5). A structured test plan with a workable test scheme can take care of important quality factors by using a scoring criteria. The scoring criteria can calculate the overall usability of SUT. Test objectives help to gauge certain characteristics and attributes from the design and requirements. Reliability engineering is essential for estimating the failure rate in advance.
4.3 Test Plan and Test Scenarios
Test plan testing type, nature and areas to be covered. This case study adopts operational profile based reliability testing mixed with usability testing. Test plan comprises of three main parts that are reliability testing, usability testing and calculation of coverage. Reliability testing includes:
• Generation of test cases using operational profile and input space profile Execution of two weeks and inspection of failure logs. Test Type is the black box and areas covered are functionality and testing is done through unit testing
• Computation of conventional reliability.
Test scenarios are created to answer six proposed questions:
Q1: The way users interact with the website?
Q2: What was the difficult task to perform?
Q3: Which form/report ended in no where?
Q4: What was the conveyed completed meanings?
Q5: What inquiry of information caused distrust or insecurity?
Q6: What was pleasing and what was unpleasing?
The answers to these questions can satisfy the objectives of the reliability testing. As suggested by Voas [29], any type of the testing alone cannot unhide all the faults and defects, but a well-planned testing can enhance overall software quality.
User scenarios is a tool to measure user experiences on actual tasks, whichcan be treated as user feedback. The scenarios created here have multiple roles. The first role is to find the usability of the tasks associated with each job. The most important role they serve is revealing the failure points during the testing. All scenarios are executed in a controlled environment, and the outputs are recorded. The Tabs. 6 to 8 show importanttest scenarios and their results. After completion of each scenario, users were asked question about the effort required to complete the scenario. Answers are rated on a scale of 1 to 5 (weaker to stronger). The codes assign to each weighted value are E = Easy, L = Little tricky, H = Hard, V= Very hard and I = not possible. Each question response is weighted on 5 different values; which are Easy (E) = 5, Little tricky (L) = 4, Hard (H) =3, Very Hard (V) = 2 and finally Not Possible (I) = 1.
Scenario 1: Create new user-The experience result for a test user are given in Tab. 6.
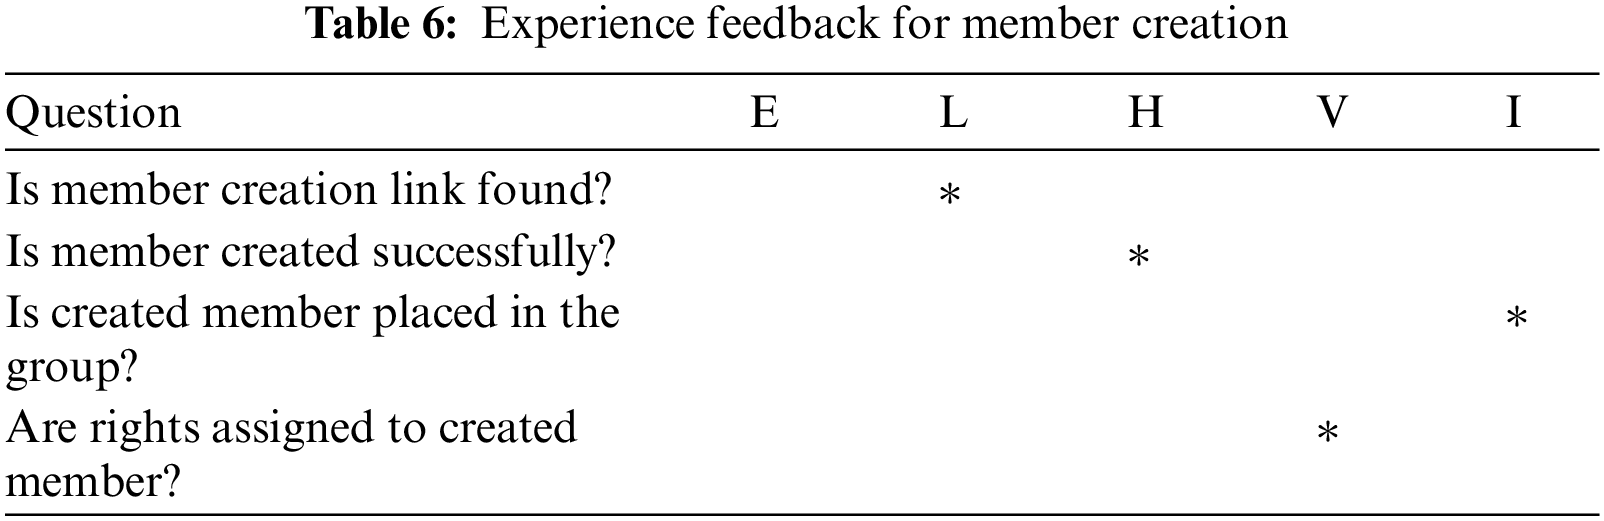
Each test case is repeated for 5 users, then resultant scores are averaged which yielded 4.7/10.
Scenario 2: Search a member-Scenario feedback results are presented in Tab. 7.
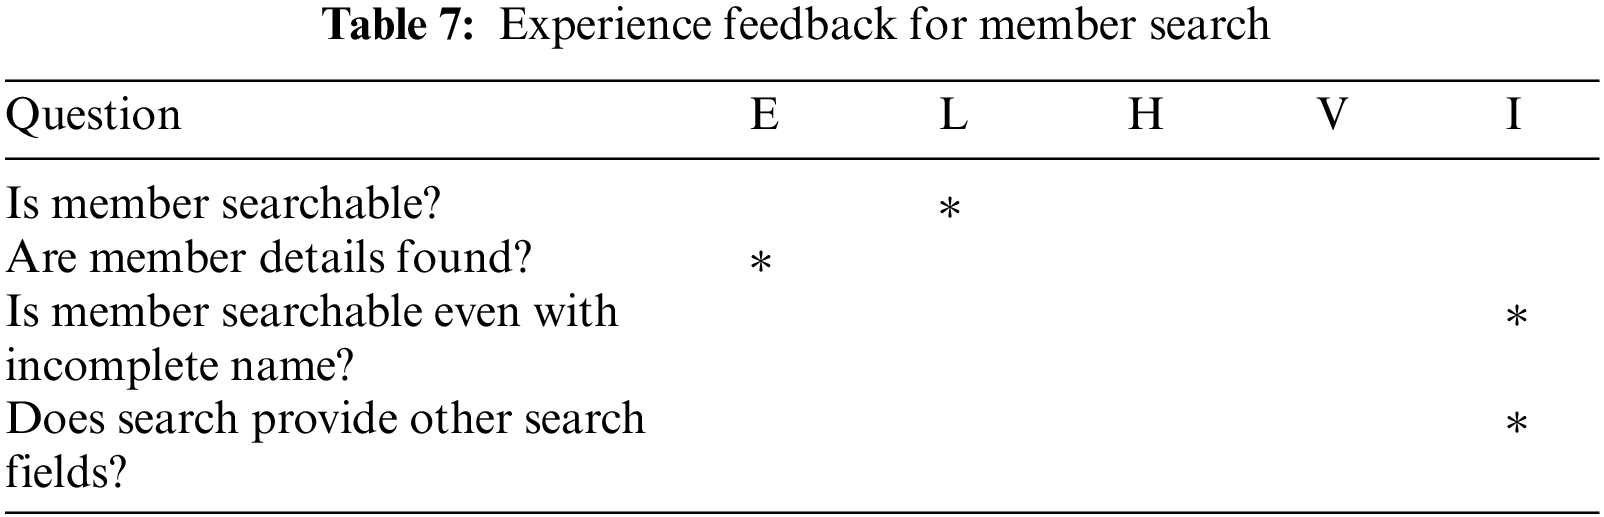
Test score for this scenario remained 2.7, which is very low. The scenarios for material module are: (i) Create a material (ii) Search a material (iii) Assigning material to member or activity (iv) Listing of material. The cumulative score of above-mentioned scenarios is given in Tab. 8.
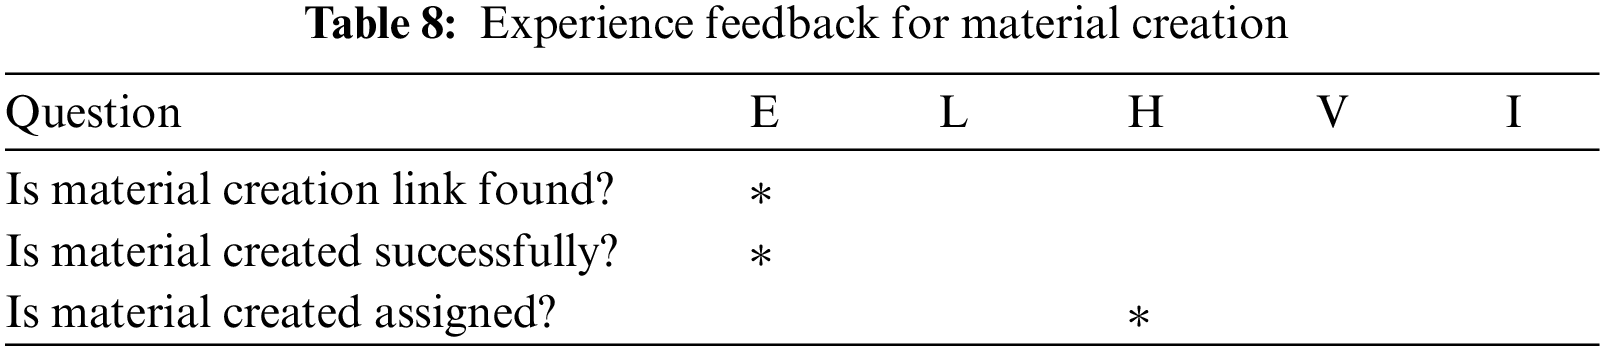
Average score obtained is 4.5. The score for scenario material assignment remained 2.7. Following are scenarios for authorization module: (i) Scenario 7: Perform login (ii) Scenario 8: Login with a wrong password (iii) Scenario 9: Call forget password. The case study achieved 7.3 scores for authorization scenarios. For system-based scenarios, not many options are there as mostly functions or tasks are called or linked with other modules, but few scenarios are still there: (i) Scenario 10: Create forum (ii) Scenario 11: Create post on forum (iii) Scenario 12: Delete post (iv) The overall system score remained 7.1.
4.4 Test Coverage and Test Cases
Test coverage covers diverse units and diverse levels of SUT. The testable units include components/modules, functions/operations and other design structures. Test coverage computation requires identification of test type and level of testing. One popular testing technique is black box, which has many testing techniques like boundary value, input space partitioning, interface based error guessing and many more. The study enlist some blackbox testing techniques and use them as well which are:
• Navigation Testing (i) Top to bottom link traverse (ii) Reiteration traversing of all in between links (iii) From bottom to top reverse traversal of all the parent links (iv) Repetition of step (iii) for all child pages.
• Design Test,which includes: (i) Layout according to specifications of device/container test (for example floating containers), (ii) Multiple, dynamic and intelligent screen resolution for compatible devices, (iii) Input space through input variable testing, (iv) Menu/options/choices testing.
• Functionality Testing includes: (i) Usability testing of main features (i) Operation and wb-object testing (ii) multiple user testing (iii) Transaction and data record tests.
Test cases are created to test navigation, designs and functionality. Test case allocation is done by operational profile values. Test cases are generated using all three profile, selection of test case is done on the bases of probability given in operational profile and input space profile. If total N test cases have to be performed, then they are divided by testing profile share that is N = 1OP + 1ISP + 2UP. Or if we find the proportion of OP in total N, it is ¼ N and ISP is ¼ N too while UP is ½ N. (Tabs. 9 and 13)
The following scheme is used to allocate N test cases to each of the units under test.
• Step-1: Multiply respective module probability computed through operational profile (shown in Tab. 3) with N/4 test cases.
• Step-2: Multiply respective input probability calculated through input space profile (shown in Tab. 4) with N/4.
• Step-3: Allocate N/2 test case resources to usability testing.
• Step-4: Allocate the minimum test cases (operational profile bases, input space profile based or usability bases) to the units of tests having occurrence probability approaching to zero.
• Step-5: Allocate maximum remaining test cases to the units having higher probabilities as per respective profile.
• Step-6: The total test cases (N) allocated are 60. Share of OP = 20, ISP = 20 and UP = 40 test cases respectively. Tab. 10 contains test case allocation using operational profile.
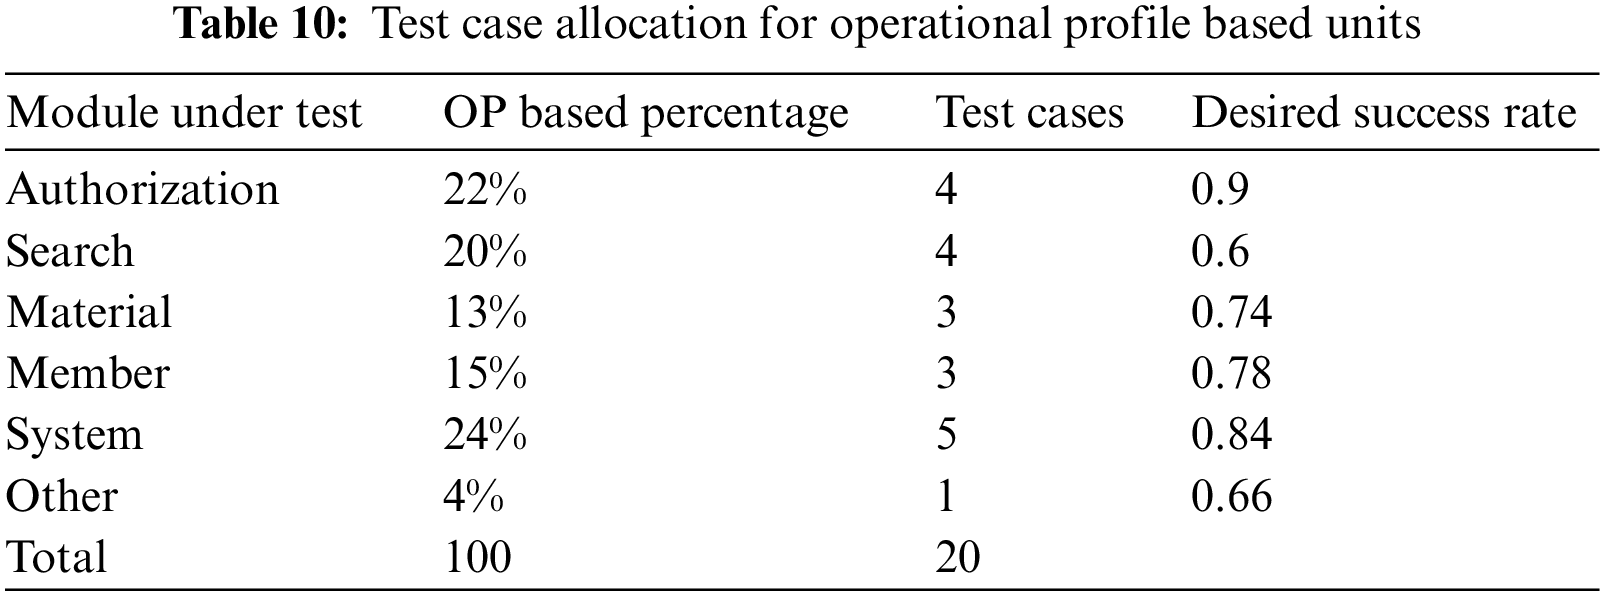
ISP based test cases inherit the probability for each input from their parent module (as set by OP based probability). Step-2 generates ISP based test allocation which is shown in Tab. 10. Modular probability remained the same as shown in Tab. 3. Each input received its share of probability as shown in Tab. 4. Authorization module divides the probabilities in both input variables. Search module has only one input variable and thus all test cases are allocated to it. For the usability profile, there are 40 test cases assigned as per testing profile. Sample test cases are given in Tab. 11 for testing “create user” function under the member module.
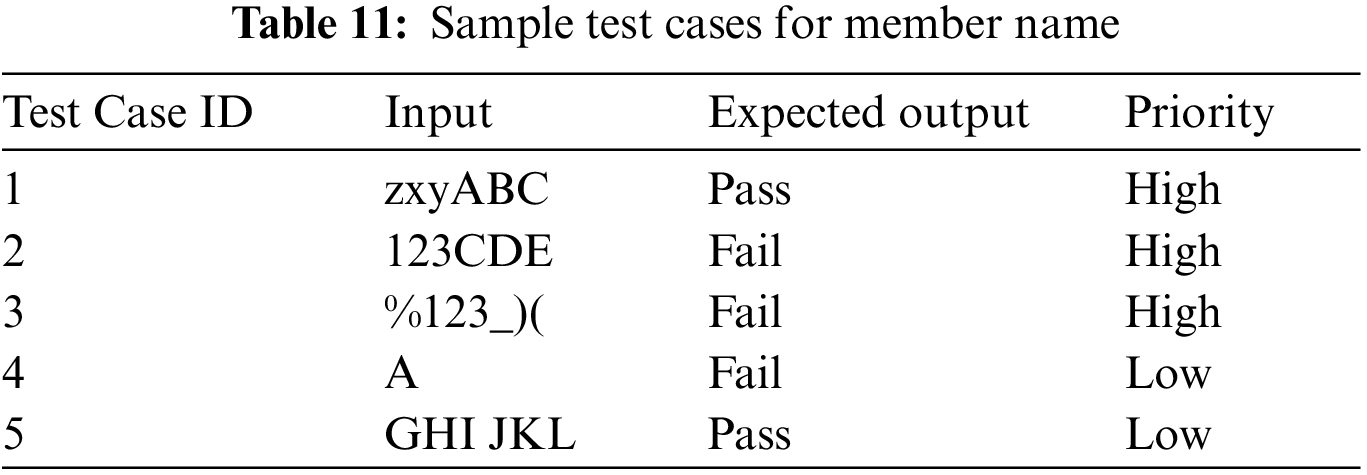
Some of the test cases in Tab. 11 have a high priority, as these are the test cases generated by proportion allocated to this input variable. The test cases having low priority are those who are not generated by the probability share, but they exist as per requirement. High priority test cases of all the input variables and operations are always executed in the first phase. If time and resources permit, the low priority test cases will be executed too.
Quality metrics are core test tools. Each metrics is divided into sub metrics. The main quality metrics to measure are i) Software usability, ii) Software performance, iii) Software accessibility, iv) Software design, v) Software functionality and vi) Software interoperability. Every metric or sub metric have defined way of measuring and quantifying its value. Following section contains those results.
In the perspective of software design, usability is divided into five factors. GTmetrix is the tool used to measure the testing scores for the design of a website. The results are given in Tab. 12.

The results from Tab. 12 reveal that the case study is low in usability when compared to the user requirements and user perceptions. In perspective of performance, usability has four more sub-metrics that are: (i) Success rate (whether users can perform the task at all) (ii) Maximum time a task requires for the completion (finish time) (iii) The error rate (covered inside reliability) (iv) Users' subjective satisfaction.
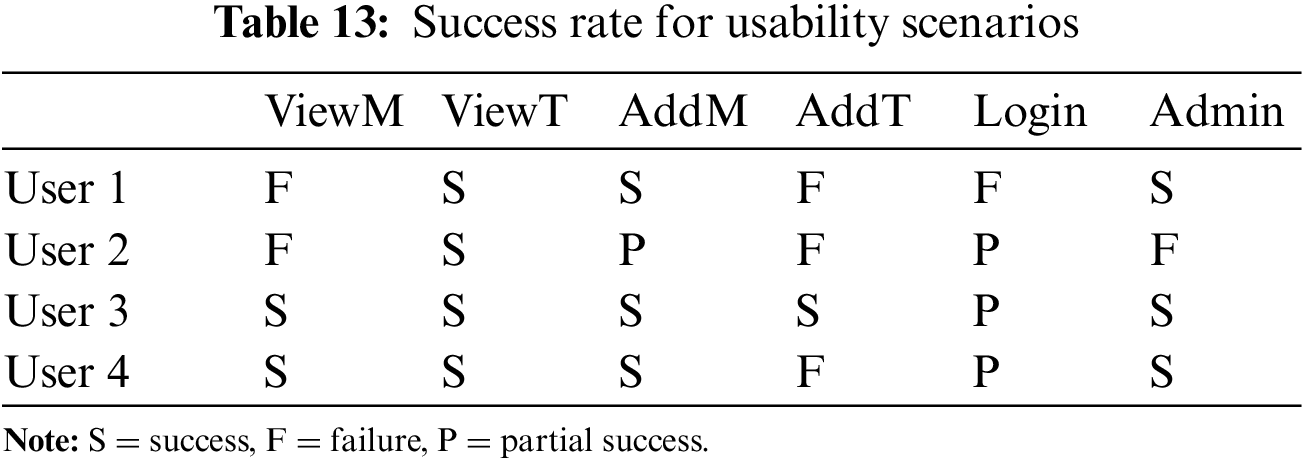
Reliability is analyzed in Section 6. The usability needs to be improved as it is one of the essential components of reliability as well. The testing also tried functions by their successful completion of desired specified functionality. The results are shown in success data of selected function for four test users. In Tab. 14, viewM is the column showing success rate of function viewMember; similarlyviewT is viewMaterial, addM is add new member, addT is adding new material and admin is for changing the settings and registering a new user.
In total, 24 executions of mentioned functions were done. Among them, 9 executions remained successful while 4 were partially successful and rest 11 being failure. For this particular case study, partial success got 0.5 score, success ranked at 1, while failure having 0 score. The total success rate using simple calculations remained 62% = (13 + (4 * 0.5))/24. The acceptable usability score must top 50%.
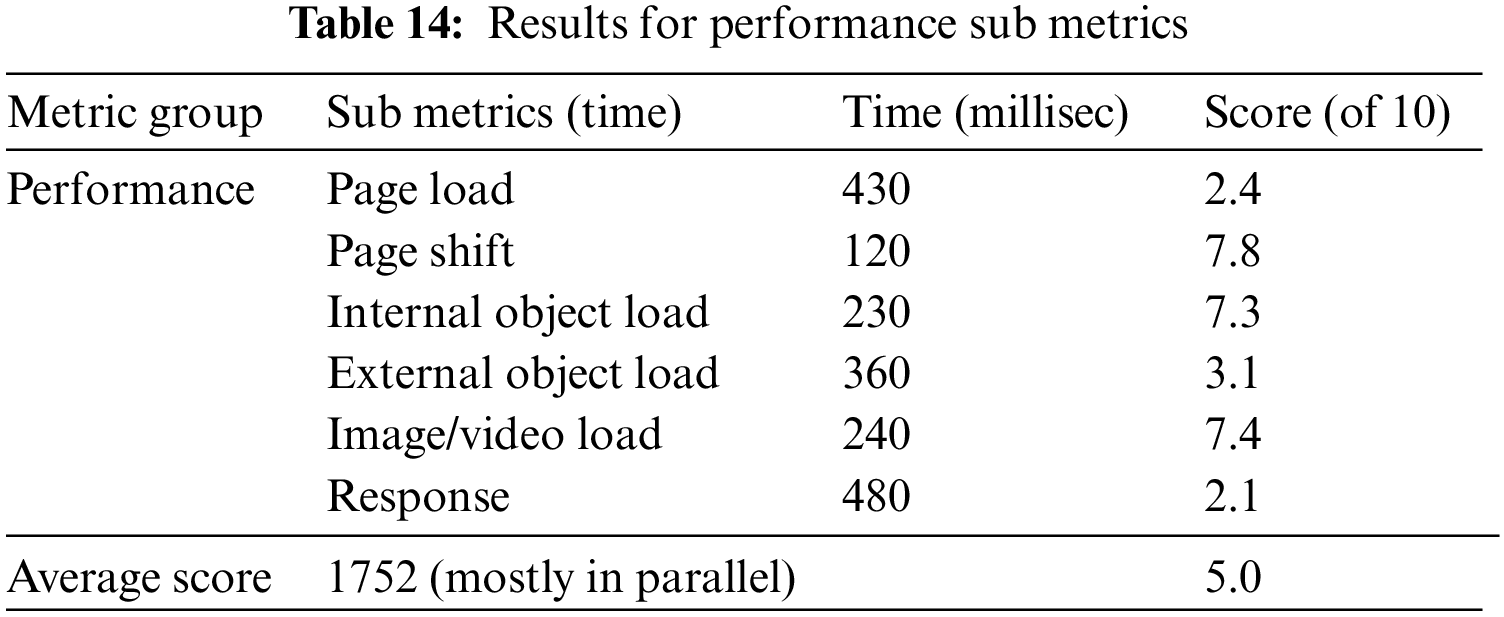
Webpage test tool is used to measure the performance which is composed of six factors. The performance results of the case study are given in Tab. 15. The results reveal that usability and reliability scores are not satisfactory. However, in few areas it performed well as for page shift and video load.
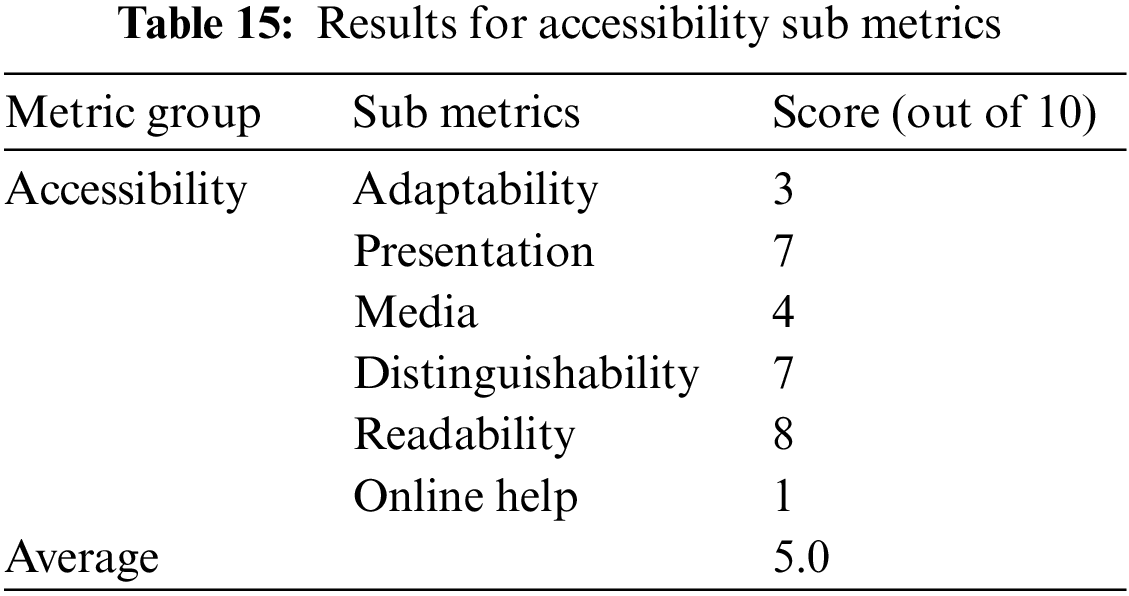
The Tab. 14 shows the results for accessibility using Wave Web accessibility tool.
Although the case study scored better for readability and individuality, overall accessibility score is unsatisfactory as shown in Tab. 15. Required accessibility and usability scores were 80 percent and above.
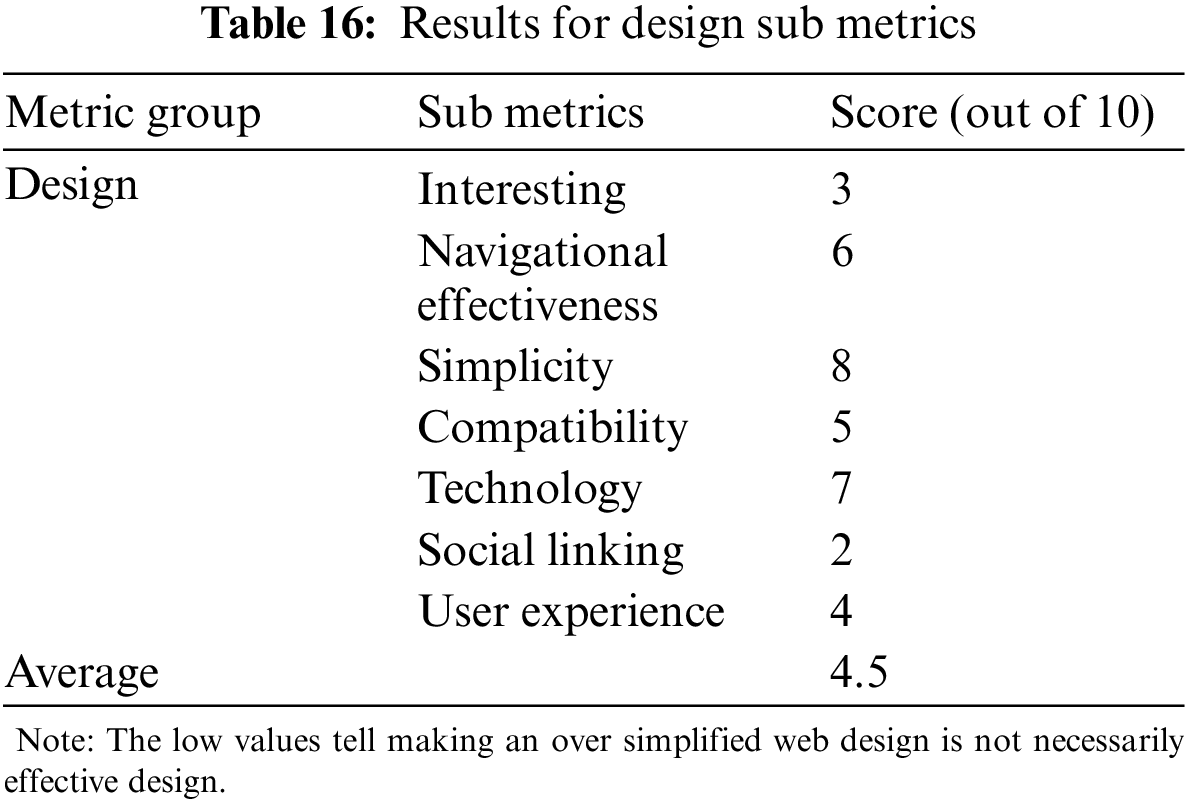
The Tab. 16 contains the results obtained for software design with the help of NibblerTest tool. The values of Interesting and linking to socialwebsitesare relatively low.
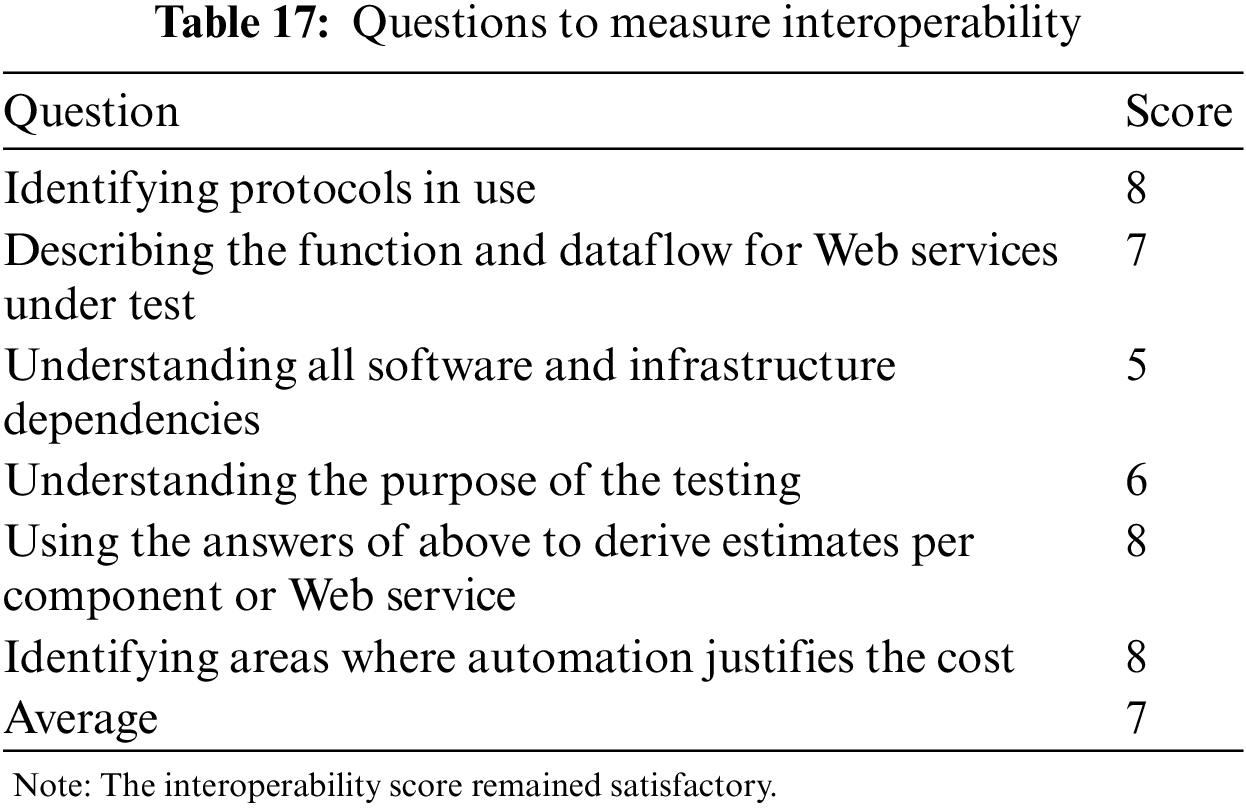
Interoperability can be measured by user experiences during integration testing. Here are the questions used to measure the scores related to interoperability in Tab. 17. The case study shows the acceptable values in this area.
To find the reliability, this study employed operational profile based reliability in conjunction with input space profiles. The design specific details revealed by analysis of the website covers the profiling hierarchy until the function level, but no detail was available for the server execution log, hence, operation sub-profile was not computed.
Operational profile helps testers to allocate the time, resources and order to the units of the software going under test by usage priority. This testing can then reveal the errors and faults (both seeded and unseeded), which can lead to the calculation of reliability.
The most common reliability measure is Mean Time to Failure (MTTF) for non-repairable software. Traditionally it is conceived as the expected length of time between the start of the function to the occurrence of the first failure/crash. In systems where time is not the underlying unit of reliability measurement, a more practical approach entails counting how many requests a user is likely to execute before a failure.
The reliability here is calculated with the help of Eq. (3).
In Eq. (3), U = number of testable units, H = total time (in hours) and A = acceleration rate (for this case study A is taken 1) and r is a number of failures. Every function has to go through certain tests governed by its respective operational profile and after a number of recurrences have been recorded for each failure for each function. Tab. 18 contains the failure history for all the functions and recurrences for each failure point.
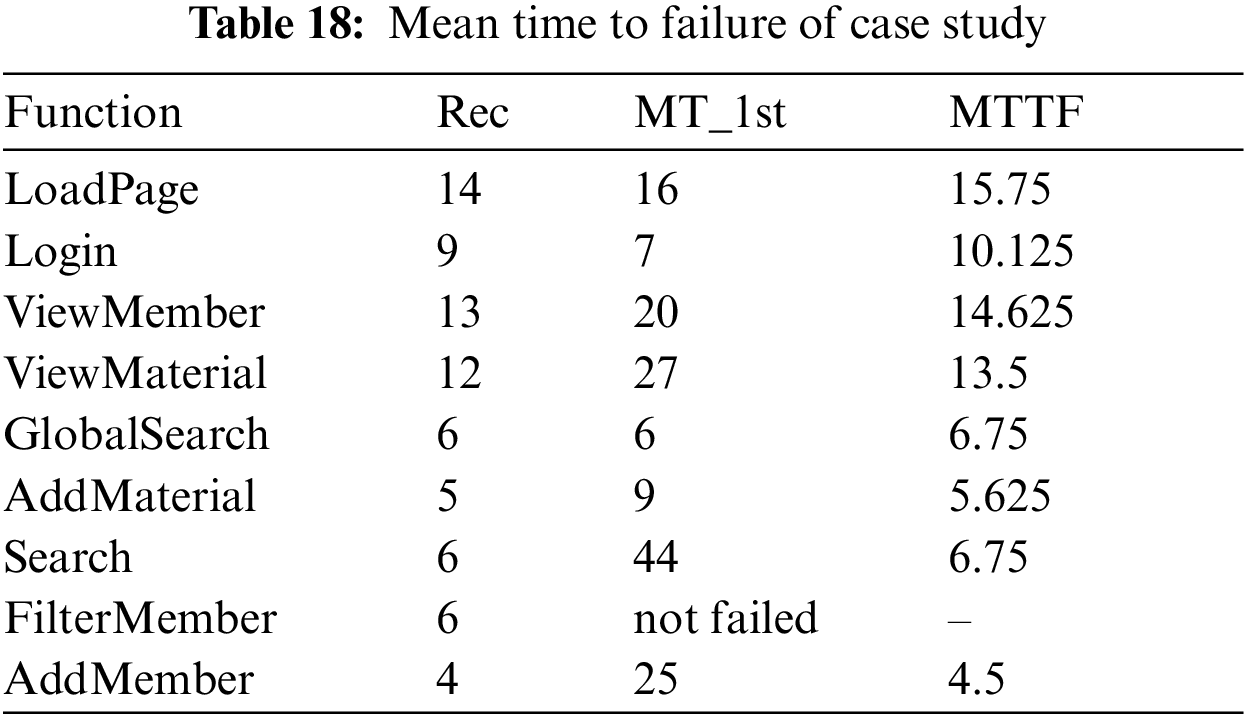
Colum rec is total number of recurrences for the failure; column MT_1st is the meantime taken until the first failure by all tests. First row for LoadPage shows that this function will take at least 15.75 unit times for the first failure and same way other function’s failure points are interpreted. MTTF does not tell anything about failures that occur after first failure or failures that occur after one function is repaired and tested again. The MTBF (reliability measure for repairable software shown in Eq. (4) covers this limitation and can estimate the failure frequency for any function between two time units (even it has failed once before and repaired and working again). From this measure, ViewMember function is the most reliable as it will take almost 14.6 unit times to meet its first failure, and AddMember function is most unreliable as it may fail just after 4.5 unit times of its initialization.
Here Ft is the failure point for this this function or unit under test, while Stest is the starting time of the first recurrence of the test. The calculated results for MTBF are shown in Tab. 19.
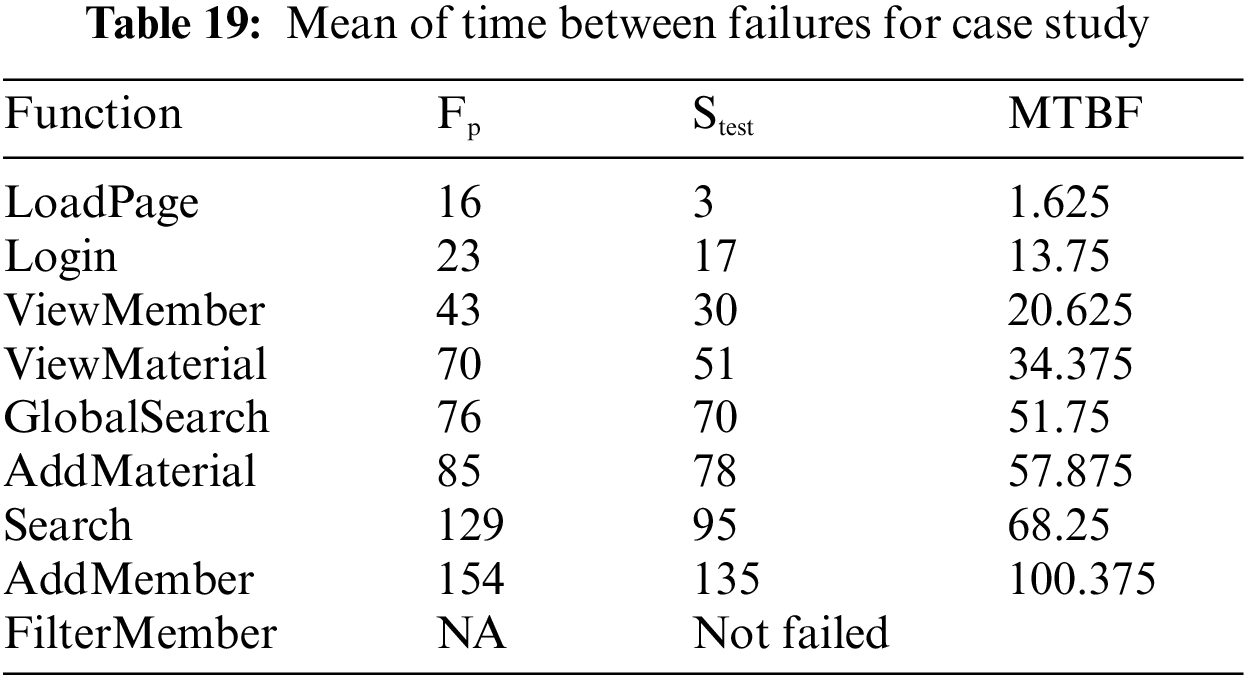
Fp column shows values for detected failure point, while Stest is the relative starting time for the test, and total failures found are eight. From inspecting values in row1 for LoadPage, MTBF is 1.625 mean of time which reflects that the reliability of the function is quite low, and it may take 1.625 unit times to meet the second or subsequent failure as per its failure frequency. A comparison between failure rates of all the modules is shown in Fig. 6. Failure rates can be calculated as 1/MTBF, also called failure intensity (λ) or failure rate. The most vulnerable function for failure is LoadPage and most reliable regarding MTBF is AddMember function that was proved by MTTF too. FilterMember achieves 100 percent reliability.
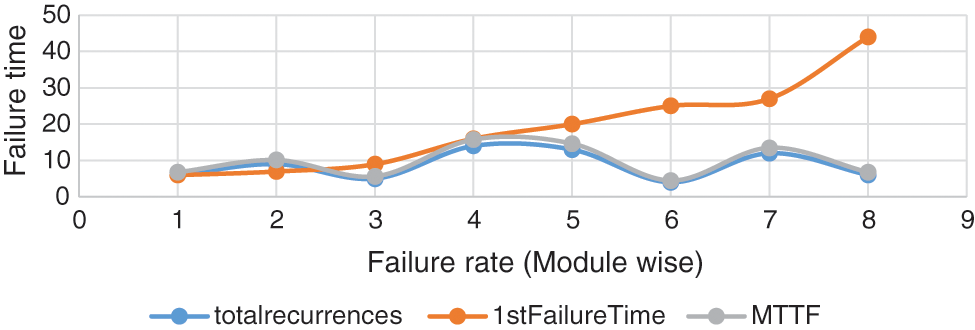
Figure 6: Failure rates for each module
Based on the graph, the highest failure rate (orange line) is exhibited by AddMember function, while the less failure prone is LoadPage. On contrast, the recurrence of failure is highest for ViewMaterial and lowest for AddMaterial.
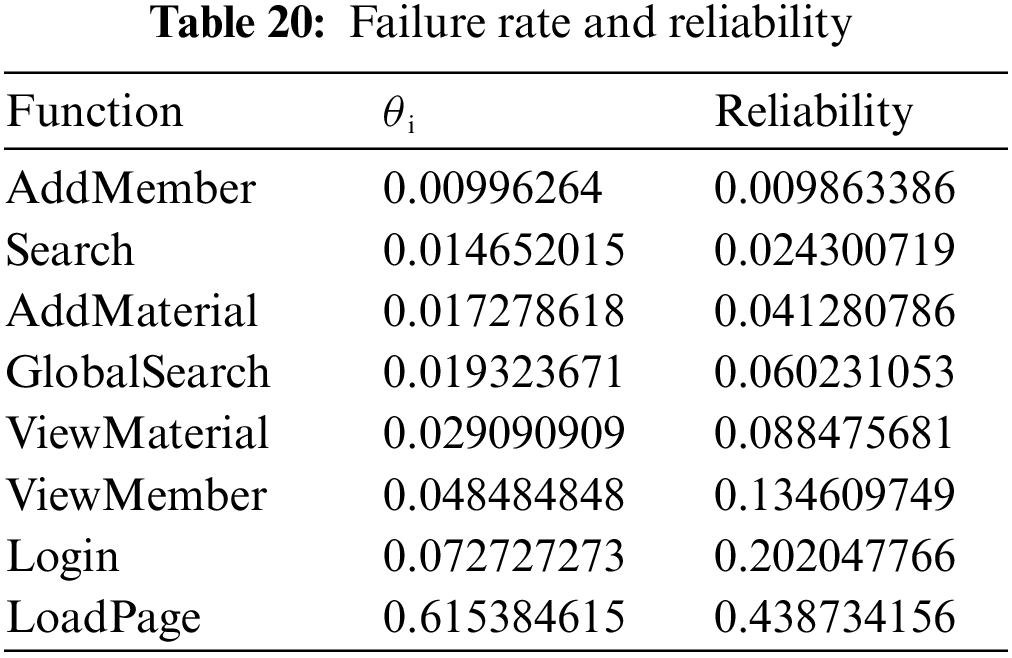
Conventional reliability is measured using classical Nelson method. To compute the reliability based upon operational profile is shown in Eq. (5).
The results of reliability calculation are shown in Tab. 20.
The conventional method of reliability does not take into account input based failure rates or criticality of failures or crashes. Eq. (6) compute reliability with all these factors as:
The failure rate data can help to compute the reliability, but the method also requires distinction between critical failures (θiC) and non-critical failures (θiN). These are termed as highly critical (α having higher value) and less critical (β having higher values) using usability and input space profile, while (θiS) is the success rate (total successful test cases divided by total test cases). Results are shown in Tab. 21.
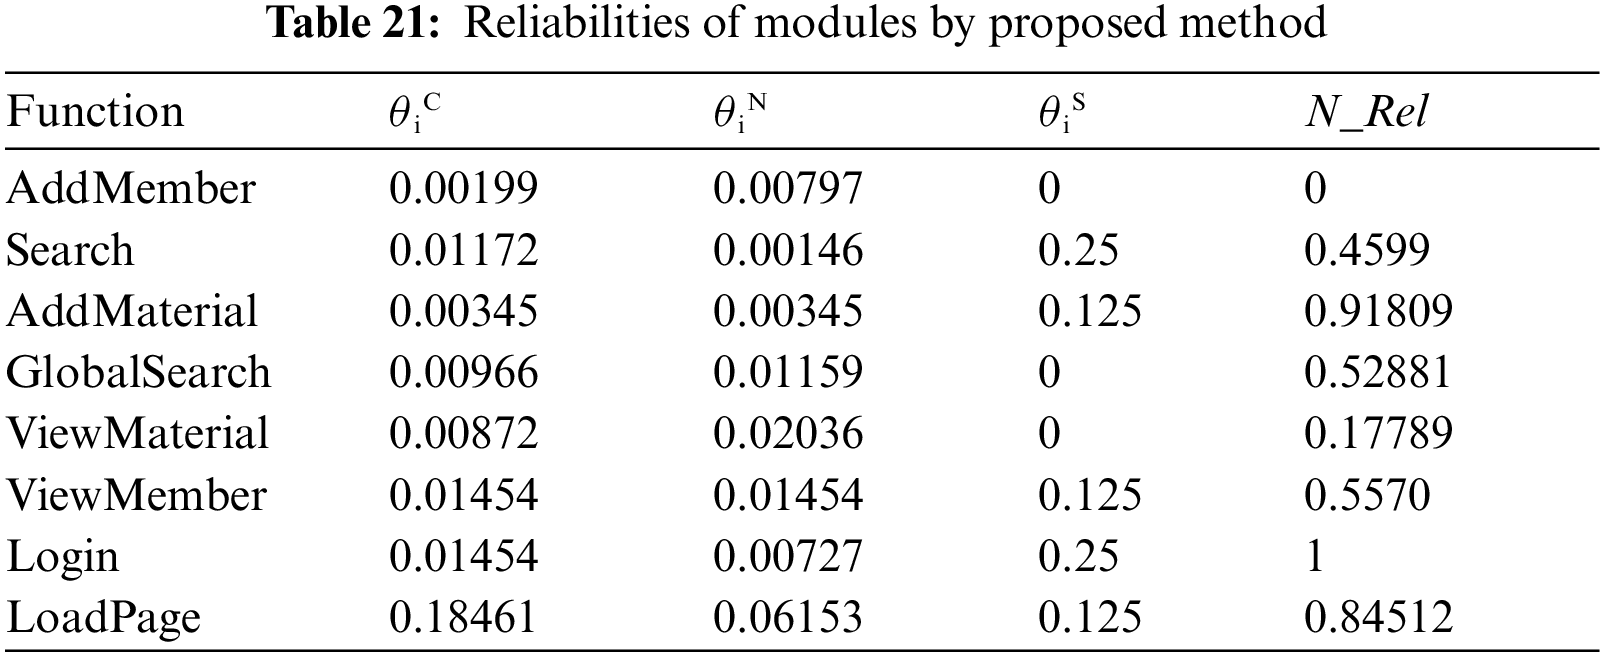
In Tab. 21, N_Rel is normalized reliability value (range 0:10). Failure data remained the same, but criticality and success rate has been changed due to allocation of test cases. The comparison of proposed reliability scheme with conventional reliability methods are shown in Fig. 7.
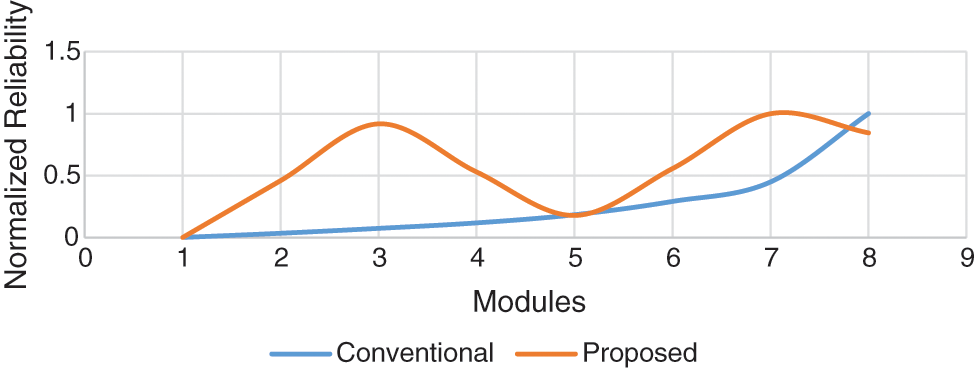
Figure 7: Comparison of reliabilities
Reliability could not be measured in a classic way using defect and error equations though few sub metrics like maturity, stability, performance and accessibility, and usability have been measured. The case study also revealed that software reliability computation using time-based or fault-based models was not appropriate for Web portals, as users are more concerned about requirements, functionality and usability experience. Faults discovery and error mitigation are mostly left for the host system software and other backend software in such cases. Previous studies are using conventional methods of computing reliability and relating it with effectiveness of web-based application, this study has taken into account usability and other key factors to compute effective reliability which is significant in comparing the performances and importance of the application being considered.
Thus, the study provided insights on how to measure usability based on ISO metrics using available online testing tools. The study also investigated the comparison of metrics and key factors in determining the reliability of software and a Web portal that are helpful in the measurement of both software reliability and usability for software of similar types. The future work may include testing of Web services that can be done using hybrid testing technique involving usability and statistical reliability.
In future the study will include other important attributes like access-time, criticality in testing profile to get more realistic analysis and predictions of web-based applications reliability. Also similar reliability estimations models can be developed for specific applications in health and other services. Moreover, with the further developments in the artificial intelligence and electronics, the performance of the system will be further improved [32–42].
Funding Statement:This study was supported by Suranaree University of Technology.
Conflicts of Interest:The authors declare that they have no conflicts of interest to report regarding the present study.
References
1. F. Febrero, C. Calero and M.Á. Moraga, “Software reliability modeling based on ISO/IEC Square,” Information and Software Technology, vol. 70, no. 5, pp. 18–29, 2016. [Google Scholar]
2. F. Saeed, M. Al-Sarem, M. Al-Mohaimeed, A. Emara, W. Boulila et al., “Enhancing parkinson's disease predictionusing machine learning and feature selection methods,” Computers, Materials & Continua, vol. 71, no. 3, pp. 5639–5658, 2022. [Google Scholar]
3. H. Moujahid, B. Cherradi, M. Al-Sarem, L. Bahatti, A. B. A. M. Y. Eljialy et al., “Combining cnn and grad-cam for covid-19 disease prediction and visual explanation,” Intelligent Automation & Soft Computing, vol. 32, no. 2, pp. 723–745, 2022. [Google Scholar]
4. J. Y. M. Ng, T. W. Lim, N. Tarib and T. K. Ho, “Development and validation of a progressive web application to educate partial denture wearers,” Health Informatics Journal, vol. 28, no. 1, pp. 1–13, 2022. [Google Scholar]
5. A. A. Khan, P. Uthansakul, P. Duangmanee and M. Uthansakul, “Energy efficient design of massive MIMO by considering the effects of nonlinear amplifiers,” Energies, vol. 11, no. 5, pp. 1045, 2018. [Google Scholar]
6. I. Fridman, L. Chan, J. Thomas, L. J. Fish, M. Falkovic et al., “A web-based personalized decision support tool for patients diagnosed with ductal carcinoma in situ: Development, content evaluation, and usability testing,” Breast Cancer Resource Treatment, vol. 192, no. 3, pp. 517–527, 2022. [Google Scholar]
7. A. A. Khan, “Energy efficient design of 5G massive mimo,” Ph.D. dissertation, Suranaree University of Technology, Thailand, 2018. [Google Scholar]
8. Z. G. Al-Mekhlafi, B. A. Mohammed, M. Al-Sarem, F. Saeed, T. Al-Hadhrami et al., “Phishing websites detection byusing optimized stacking ensemble model,” Computer Systems Science and Engineering, vol. 41, no. 1, pp. 109–125, 2022. [Google Scholar]
9. M. M. Ali-Shahid and S. Sulaiman, “Improving reliability using software operational profile and testing profile,” in 2015 Int. Conf. on Computer, Communications, and Control Technology (I4CT), Kuching, Malaysia, pp. 384–388, 2015. [Google Scholar]
10. S. N. Qasem, M. Al-Sarem and F. Saeed, “An ensemble learning based approach for detecting and tracking covid19rumors,” Computers, Materials & Continua, vol. 70, no. 1, pp. 1721–1747, 2022. [Google Scholar]
11. A. Jatain and Y. Mehta, “Metrics and models for software reliability: A systematic review,” in 2014 Int. Conf. on Issues and Challenges in Intelligent Computing Techniques (ICICT), Ghaziabad, India, pp. 210–214, 2014. [Google Scholar]
12. M. J. Aamir and A. Mansoor, “Testing web application from usability perspective,” in 2013 3rd IEEE Int. Conf. on Computer, Control and Communication (IC4), Karachi, Pakistan, pp. 1–7, 2013. [Google Scholar]
13. N. Arthurs, L. Tully, G. O’malley and S. Browne, “Usability and engagement testing of mhealth apps in paediatric obesity: A narrative review of current literature,” International Journal of Environment Resource in Public Health, vol. 19, no. 3, pp. 1453, 2022. [Google Scholar]
14. F. Alshehri and M. Freeman, “Methods of usability evaluations of mobile devices,” in 23rd Australian Conf. on Information Systems, Perth, Australia, pp. 1–10, 2012. [Google Scholar]
15. D. Zhang and B. Adipat, “Challenges, methodologies, and issues in the usability testing of mobile applications,” International Journal of Human and Computer Interactaction, vol. 18, no. 3, pp. 293–308, 2005. [Google Scholar]
16. G. Lindgaard and J. Chattratichart, “Usability testing: What have we overlooked?,” in Proc. of the SIGCHI Conf. on Human Factors in Computing Systems-CHI ’07, 2007, New York, United States, pp. 1415–1424, 2007. [Google Scholar]
17. F. Zahra, A. Hussain and H. Mohd, “Usability factors of mobile health application for chronic diseases,” in AIP Conf. Proc., Gujrat, India, pp. 17–61, 2016. [Google Scholar]
18. P. Uthansakul and A. A. Khan, “Enhancing the energy efficiency of mmWave massive MIMO by modifying the RF circuit configuration,” Energies, vol. 12, no. 22, pp. 4356, 2019. [Google Scholar]
19. M. M. Ali-Shahid and S. Sulaiman, “A case study on reliability and usability testing of a web portal,” in 2015 9th Malaysian Software Engineering Conf. (MySEC), Malaysia, pp. 31–36, 2015. [Google Scholar]
20. T. Takagi and M. Beyazıt, “Optimized test case generation based on operational profiles with fault-proneness information,” Software Engineering Research, Management and Applications, vol. 578, pp. 37–39, 2014. [Google Scholar]
21. T. Takagi, Z. Furukawa and Y. Machida, “Test strategies using operational profiles based on decision tables,” in 2013 IEEE 37th Annual Computer Software Applications Conf., Washington, DC, United States, pp. 722–723, 2013. [Google Scholar]
22. C. Smidts, C. Mutha, M. Rodríguez and M. J. Gerber, “Software testing with an operational profile: OP Definition,” ACM Computer Survey, vol. 46, no. 3, pp. 1–39, 2014. [Google Scholar]
23. J. P. Fu, M. Y. Lu and J. Ai, “TCS: An automation tool for software reliability test data generation,” in 2009 Int. Conf. on Advances in Computational Tools for Engineering Applications, Beirut, Lebanon, pp. 447–450, 2009. [Google Scholar]
24. V. Marinkovic, B. Kordic, M. Popovic and V. Pekovic, “A method for creating the operational profile of TV/STB device to be used for statistical testing,” in Eurocon 2013, Zagreb Croatia, pp. 93–97, 2013. [Google Scholar]
25. H. Fukutake, L. Xu, R. Watanabe, T. Takagi and R. Yaegashi, “The method to create test suite based on operational profiles for combination test of status,” in 2015 IEEE/ACIS 16th Int. Conf. on Software Engineering, Artificial Intelligence, Networking and Parallel/Distributed Computing (SNPD), Takamatsu, Japan, pp. 1–4, 2015. [Google Scholar]
26. J. Ai, F. Zheng and J. Shang, “A scenario modeling method for software reliability testing,” in 2012 Int. Conf. on Systems and Informatics (ICSAI2012), Yantai, China, pp. 2429–2433, 2012. [Google Scholar]
27. J. M. Zurada, “Introduction to artrificial neural network,” Image and Vision Computing, vol. 8, pp. 82–89, 1992. [Google Scholar]
28. J. Ai, H. Pei and L. Yan, “Software reliability virtual testing for reliability assessment,” in 2014 IEEE Eighth Int. Conf. on Software Security and Reliability-Companion, CA, USA, pp. 71–77, 2014. [Google Scholar]
29. D. Dwyer and P. D’Onofrio, “Improvements in estimating software reliability from growth test data,” in 2011 Proc.-Annual Reliability and Maintainability Symp., Florida, USA, pp. 1–5, 2011. [Google Scholar]
30. H. Danielsson, K. Olsson and F. O. Brien, “How to measure reliability in an erlang system,” Ph.D. dissertation, Lunds University, Sweden, 1998. [Google Scholar]
31. P. Uthansakul and A. A. Khan, “On the energy efficiency of millimeter wave massive MIMO based on hybrid architecture,” Energies, vol. 12, no. 11, pp. 2227, 2019. [Google Scholar]
32. A. A. Khan, P. Uthansakul and M. Uthansakul, “Energy efficient design of massive MIMO by incorporating with mutual coupling,” International Journal on Communication Antenna and Propagation, vol. 7, no. 3, pp. 198–207, 2017. [Google Scholar]
33. P. Uthansakul, A. A. Khan, M. Uthansakul and M. Duangmanee, “Energy efficient design of massive MIMO based on closely spaced antennas: Mutual coupling effect,” Energies, vol. 11, no. 8, pp. 2029, 2018. [Google Scholar]
34. A. A. Khan, C. Wechtaisong, F. A. Khan and N. Ahmad, “A cost-efficient environment monitoring robotic vehicle for smart industries,” Computers, Materials & Continua, vol. 71, no. 1, pp. 473–487, 2022. [Google Scholar]
35. A. A. Khan and F. A. Khan, “A cost-efficient radiation monitoring system for nuclear sites: Designing and implementation,” Intelligent Automation & Soft Computing, vol. 32, no. 3, pp. 1357–1367, 2022. [Google Scholar]
36. P. Uthansakul, P. Anchuen, M. Uthansakul and A. A. Khan, “QoE-aware self-tuning of service priority factor for resource allocation optimization in LTE network,” IEEE Transactions on Vehicular Technology, vol. 69, no. 1, pp. 887–900, 2020. [Google Scholar]
37. P. Uthansakul, P. Anchuen, M. Uthansakul and A. A. Khan, “Estimating and synthesizing QoE based on QoS measurement for improving multimedia services on cellular networks using ANN method,” IEEE Transactions on Network and Service Management, vol. 17, no. 1, pp. 389–402, 2020. [Google Scholar]
38. K. Lakshmanna, R. Kaluri, N. Gundluru, Z. S. Alzamil, D. S. Rajput et al., “A review on deep learning techniques for IoT data,” Electronics, vol. 11, no. 10, pp. 1604, 2022. [Google Scholar]
39. S. Vinson Joshua, A. S. M. Priyadharson, R. Kannadasan, A. A. Khan, W. Lawanont et al., “Crop yield prediction using machine learning approaches on a wide spectrum,” Computers, Materials & Continua, vol. 72, no. 3, pp. 5663–5679, 2022. [Google Scholar]
40. M. B. Kamal, A. A. Khan, F. A. Khan, M. M. Ali Shahid, C. Wechtaisong et al., “An innovative approach utilizing binary-view transformer for speech recognition task,” Computers, Materials & Continua, vol. 72, no. 3, pp. 5547–5562, 2022. [Google Scholar]
41. N. Mushtaq, A. A. Khan, F. A. Khan, M. J. Ali, M. M. Ali Shahid et al., “Brain tumor segmentation using multi-view attention based ensemble network,” Computers, Materials & Continua, vol. 72, no. 3, pp. 5793–5806, 2022. [Google Scholar]
42. S. Prajam, C. Wechtaisong and A. A. Khan, “Applying machine learning approaches for network traffic forecasting,” Indian Journal of Computer Science and Engineering, vol. 13, no. 2, pp. 324–335, 2022. [Google Scholar]
Cite This Article
 Copyright © 2023 The Author(s). Published by Tech Science Press.
This work is licensed under a Creative Commons Attribution 4.0 International License , which permits unrestricted use, distribution, and reproduction in any medium, provided the original work is properly cited.
 Downloads
 Citation Tools