
 Submit a Paper
 Propose a Special lssue
 Open Access
ARTICLE

IoT Based Smart Framework Monitoring System for Power Station
1 Department of Financial and Actuarial Mathematics, School of Science, Xi’an Jiaotong-Liverpool University, China
2 Department of Electrical and Electronics Engineering, Sona College of Technology, Salem, 636005, Tamil Nadu, India
3 Department of Computer Science and Engineering, Vel Tech Multi Tech Dr RR Dr SR Engineering College, Chennai, 600062, Tamil Nadu, India
4 Department of Computer Science, College of Computers and Information Technology, Taif University, P.O. Box 11099, Taif, 21944, Saudi Arabia
5 Department of Computer Science and Engineering, PSN College of Engineering and Technology, Tirunelveli, 627152, Tamil Nadu, India
* Corresponding Author: R. Saravanan. Email:
Computers, Materials & Continua 2023, 74(3), 6019-6037. https://doi.org/10.32604/cmc.2023.032791
Received 30 May 2022; Accepted 12 July 2022; Issue published 28 December 2022
 View Full Text
 Download PDF
Abstract
Power Station (PS) monitoring systems are becoming critical, ensuring electrical safety through early warning, and in the event of a PS fault, the power supply is quickly disconnected. Traditional technologies are based on relays and don’t have a way to capture and store user data when there is a problem. The proposed framework is designed with the goal of providing smart environments for protecting electrical types of equipment. This paper proposes an Internet of Things (IoT)-based Smart Framework (SF) for monitoring the Power Devices (PD) which are being used in power substations. A Real-Time Monitoring (RTM) system is proposed, and it uses a state-of-the-art smart IoT-based System on Chip (SoC) sensors, a Hybrid Prediction Model (HPM), and it is being used in Big Data Processing (BDP). The Cloud Server (CS) processes the data and does the data analytics by comparing it with the historical data already stored in the CS. No-Structural Query Language Mongo Data Base (MDB) is used to store Sensor Data (SD) from the PSs. The proposed HPM combines the Density-Based Spatial Clustering of Applications with Noise (DBSCAN)-algorithm for Outlier Detection (OD) and the Random Forest (RF) classification algorithm for removing the outlier SD and providing Fault Detection (FD) when the PD isn’t working. The suggested work is assessed and tested under various fault circumstances that happened in PSs. The simulation outcome proves that the proposed model is effective in monitoring the smooth functioning of the PS. Also, the suggested HPM has a higher Fault Prediction (FP) accuracy. This means that faults can be found earlier, early warning signals can be sent, and the power supply can be turned off quickly to ensure electrical safety. A powerful RTM and event warning system can also be built into the system before faults happen.Keywords
Electric power has become one of the most important, as well as an essential requirement for our day-to-day activities. Providing uninterrupted electrical energy is very much an essential requirement, and it is the basis on which the country’s economic development is built. After the rapid development in IoT technology, i.e., Smart Sensor SoC technology, the environment is well observed by the smart sensors throughout the day, streaming the data to the Centralized Server (CS) through an advanced communication facility for further processing. An innovative home system includes ubiquitous computing technology, connecting all household devices to the Internet. In the background of a smart city, there are also computers, sensors, cameras, and other sensitive equipment.
Similarly, by giving smartness to the Power Stations (PS), like in a Smart Home or Smart City, the proposed work continuously monitors the PS devices through the sensors. The data from various sensors deployed in the Power Transformers (PT), such as temperature, pressure, leakage current, high-voltage/current, and the data from the environment, i.e., humidity, also assist substation engineers in making the right decisions. Closed Circuit Television (CCTV) footage needs to be examined. Advanced Machine Learning (ML) models have been effectively used in various aspects of PS monitoring, including FD, quality prediction of faults [1], defect categorization [2], and visual examination. In the case of Fault Prediction (FP), ML models such as RF classification are pretty successful in detecting anomalous events during the substation’s operation, which helps prevent frequent power failures. Data outliers are problematic for Machine Learning (ML) algorithms, which can lead to reduced classifier accuracy. OD can be used to find and reduce outliers to improve classification model performance [3,4]. DBSCAN has been deployed in various fields of research and has been shown to detect true outliers effectively. For more precise detection of abnormal actions during fault current, DBSCAN-based OD and RF classification must be integrated. The proposed smart algorithm is associated with the historical data to find the inference, leading to the pre-identification of the faults before they occur. This work describes the design, implementation, and testing of an IoT-based SF for monitoring power equipment operation in power substations. The following are the primary distinctiveness of the proposed system:
• If there is a leakage current, an increase in coolant temperature, an electrical arc, overcurrent, or overvoltage in the PSs, the FD and protection are better because they are notified earlier/shut off quickly.
• RTM by streaming data obtained from the sensors, any fault occurrences, and the fault data captured and recorded as events in a CS and considering this information stored as historical data. Smart algorithms are used for data analytics and inferences related to fault occurrences.
• A flexible and scalable communication infrastructure sends early warnings and notifications to the right people in real-time through e-mail and text messages. This utility service can also be set up with the help of protocols, services, and Application Programming Interfaces (API) that run on the web.
The paper is ordered as follows: Section 2 provides a discussion about related work, and Section 3 describes the architecture in terms of software, hardware, and communication networks being used for the implementation of the system. In Section 4, the system is tested in the lab, and in Section 5, the results are summed up, and future research opportunities are discussed.
Protecting the PD and offering an Uninterrupted Power Supply (UPS) system against various fault events [5] not in a traditional way but by monitoring the PD through “Smart Sensors” and giving smartness to the environment in controlling and monitoring aspects is the purpose of this proposal. Circuit breakers are still widely used to safeguard electrical systems from malfunctions. Circuit breakers are used in power systems to protect electrical equipment by isolating malfunctioning devices when a fault or abnormality arises. In 2016, Eaton presented the Arc Fault Detection Device (AFDD), which offers higher security against electric arcs, power dissipation, overload, and tripping [6]—adding intelligence to ecological sustainability. As with the Smart Home, traditional electrical protection devices are increasingly becoming “smart,” allowing for better fault identification and protective measures, as well as remote monitoring and event alerts [7]. For PS protection devices, three essential features are considered: (a) disconnection speed, (b) dependability, and (c) cost. Traditional relay-based security systems lack RTM (storing the fault events data during the faults) and communication capabilities. Current research in this area aims at developing and using cutting-edge protection systems that use a similar device to disconnect load demand when a fault is found in the energy grid. There are few smart circuit breakers with RTM and communication systems for IoT-based smart home automation in the current state-of-the-art.
A recent study [8] described the security suggestions of having a circuit cutoff that can be controlled remotely and emphasized the importance of having a secure communication connection to minimize the possible attacks. If the devices inside the home become smart, it is normal to expect the circuit cutoff system to evolve into a smart system that offers an enhanced protection system for the home. In the case of smart city applications, Information and Communication Technology (ICT)-based technologies are implemented, such as smart public lighting, Graphic Information Systems (GIS)-enabled traffic monitoring systems for real-time traffic analysis and optimization, or Web of Things (WoT)-enabled services like Smart City-Data which are all illustrations of WoT-based services [9]. This model integrates temperature sensors, surveillance cameras, motion detectors, and a municipal-wide Wi-Fi MESH network, all of which are controlled and evaluated via a single interface [10]. Using Apache Kafka (AK), Apache Storm (AS), and MDB, the BDP architecture suggested in work [11] is able to store and process real-time data from the manufacturing method. The project discussed the challenges and implementation aspects of FD and equipment protection in power plants, which can be addressed effectively with the proposed IoT sensors based on the Smart Framework (SF) monitoring system, which uses AK as a message queue and AS a real-time processing engine. SD from the power plant environment. Use MDB to store SD.
This article describes a PS security model that was designed to provide a smart environment for protecting electronic components from failures and abnormalities. The system provides remote access to the quick coupling and decoupling feature and allows data analytics to be performed on past data stored in the CS. To analyze the existing setup available to protect the PD in the substation, we did a case study in the 400/230/11KV substation maintained by PGI. In the substation, PD is connected with a Reyrolle protection device [12] made up of Siemens technology. This relay will protect the power devices, such as PT and other equipment, against fault events like leakage current, increase in coolant temperature, electrical arc, overcurrent, or high-voltage occurring in the PSs. In the event that any of the faults mentioned above occur, the power supply is quickly disconnected, thereby enhancing electrical safety. The 7SR11 and 7SR12 are overcurrent protection relays designed by the Argus family of products with advanced hardware protection for PS types of equipment. Overcurrent and earth fault relays (7SR11 and directional relays 7SR12) are offered in single and four-pole configurations. With consistent logic for inputs and outputs, data classification, and fault reporting, these relays make it possible to protect, monitor, instrument, and measure in a PS environment.
Data Storage and Communication Functions of Reyrolle Protection Device
Reyrolle is equipped with a front USB port and rear RS485 port connectivity to interconnect the PC and other monitoring systems. It supports the communication protocols IEC60870-5-103, DNP3.0/Modbus RTU. Reyrolle stores the events as event records, and it is user-configurable. Up to 1000 event records are stored and time-tagged with 1 millisecond (ms) precision. If a fault is recorded in a fault log, which can be observed on the relay monitor and via a transceiver module, it can be found. This data could be added to the data from the existing system by the proposed system and sent to the CS for analysis [13–15].
3 Proposed System Architecture
With the recent advancement in IoT technology, particularly the development of smart devices, i.e., System-on-Chip (SoC) technology, as described in the below section, there is a scope for giving smartness to the protection of power equipment. This technology enables two things: (a) streaming the SD to the cloud database throughout the day. (b) AK, a message-passing queue, AS, a real-time processing engine, and MDB handle streaming sensor data. They stored this data in a CS as historical data, mainly obtained during the fault condition (storing the parameters before 500 ms of the fault and after 500 ms of the fault occurrence) (c) To eliminate outlier SD and offer FD during PD malfunctioning, data analytics tools and hybrid prediction smart algorithms, i.e., DBSCAN based OD combined with Random Forest (RF) classification, are used. This enables finding the possibility of the fault occurrence well in advance, sending earlier warning notifications, and improves electrical safety by quickly disconnecting the power supply in the event of a fault occurring in the PS. As a starting point, this section summarises the framework, outlining how the three main components integrate (hardware, software, and ML algorithm). This system uses smart devices (sensors) which are deployed in the PS. These smart sensors sense the environment and send the streaming data to the centralized CS through a gateway to the Internet [16–20].
3.1 Hardware Implementation: Smart Devices
A smart device is an IoT device, which is a smart device deployed in the environment and has the following four components: (a) Processing Unit: for acquiring data, processing and interpreting SD, coordinating control signals with actuators and controlling many functions of the smart object, including communicating the data to the Cloud Server. (b) A microcontroller is the most prevalent choice due to its compact size, versatility, programming ease, ubiquity, low power consumption, and low cost. Smart objects use sensors and actuators to interact with the physical world. (c) Communication Device: The communication device connects smart objects to one another and the outside world (via the network). Communication devices can be wired or wireless. For a cost, limited infrastructure availability, and convenience of deployment, most of the IoT network’s smart objects are wirelessly networked. (d) Power Source: The components of smart objects require power. The smart object is powered by batteries, and it is managed so that it uses as little energy as possible by putting it to sleep [21–23].
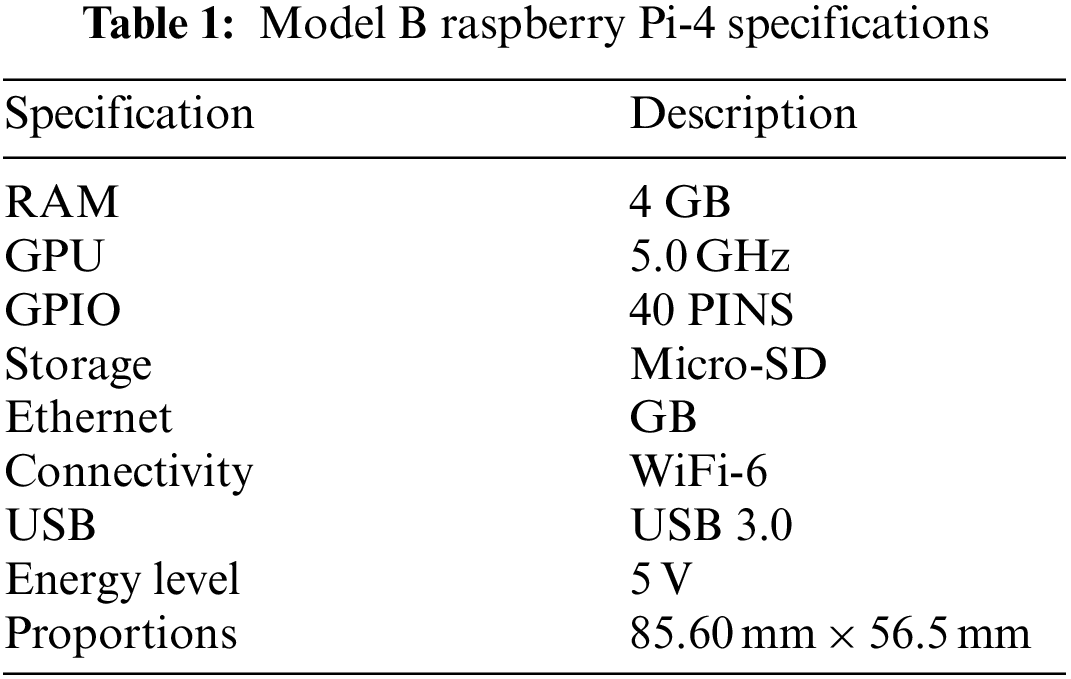
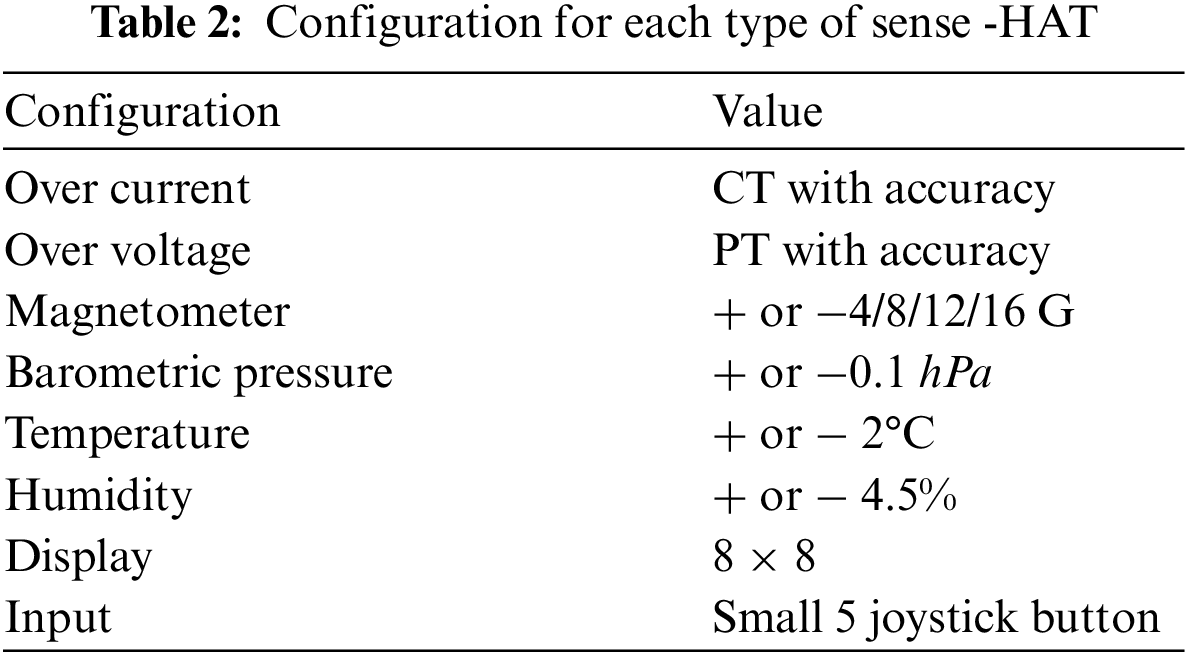
This proposed model was developed to monitor the 400/230/110 VK substation maintained by the Power Grid of India (PGI). The proposed work uses the “Smart Devices,” shown in Fig. 1, for data acquisition from the PS types of equipment installed in the substations. The functional framework of our proposed system is given in Fig. 2. The Raspberry Pi serves as the primary board, and the Sense-HAT serves as an add-on sensor board to add many sensors based on the requirements. General-Purpose Input/Output (GPIO) connectors also allow additional devices or add-on boards, such as sensors, to be attached to the mainboard. Table 1 contains the Raspberry Pi board’s comprehensive specifications. The Sense-HAT board is an add-on sensor board that monitors the temperature, pressure, overcurrent, and overvoltage inside the PT, as well as humidity data and CCTV footage from the substation environment. The Sense-HAT board’s comprehensive specifications can be found in Table 2.
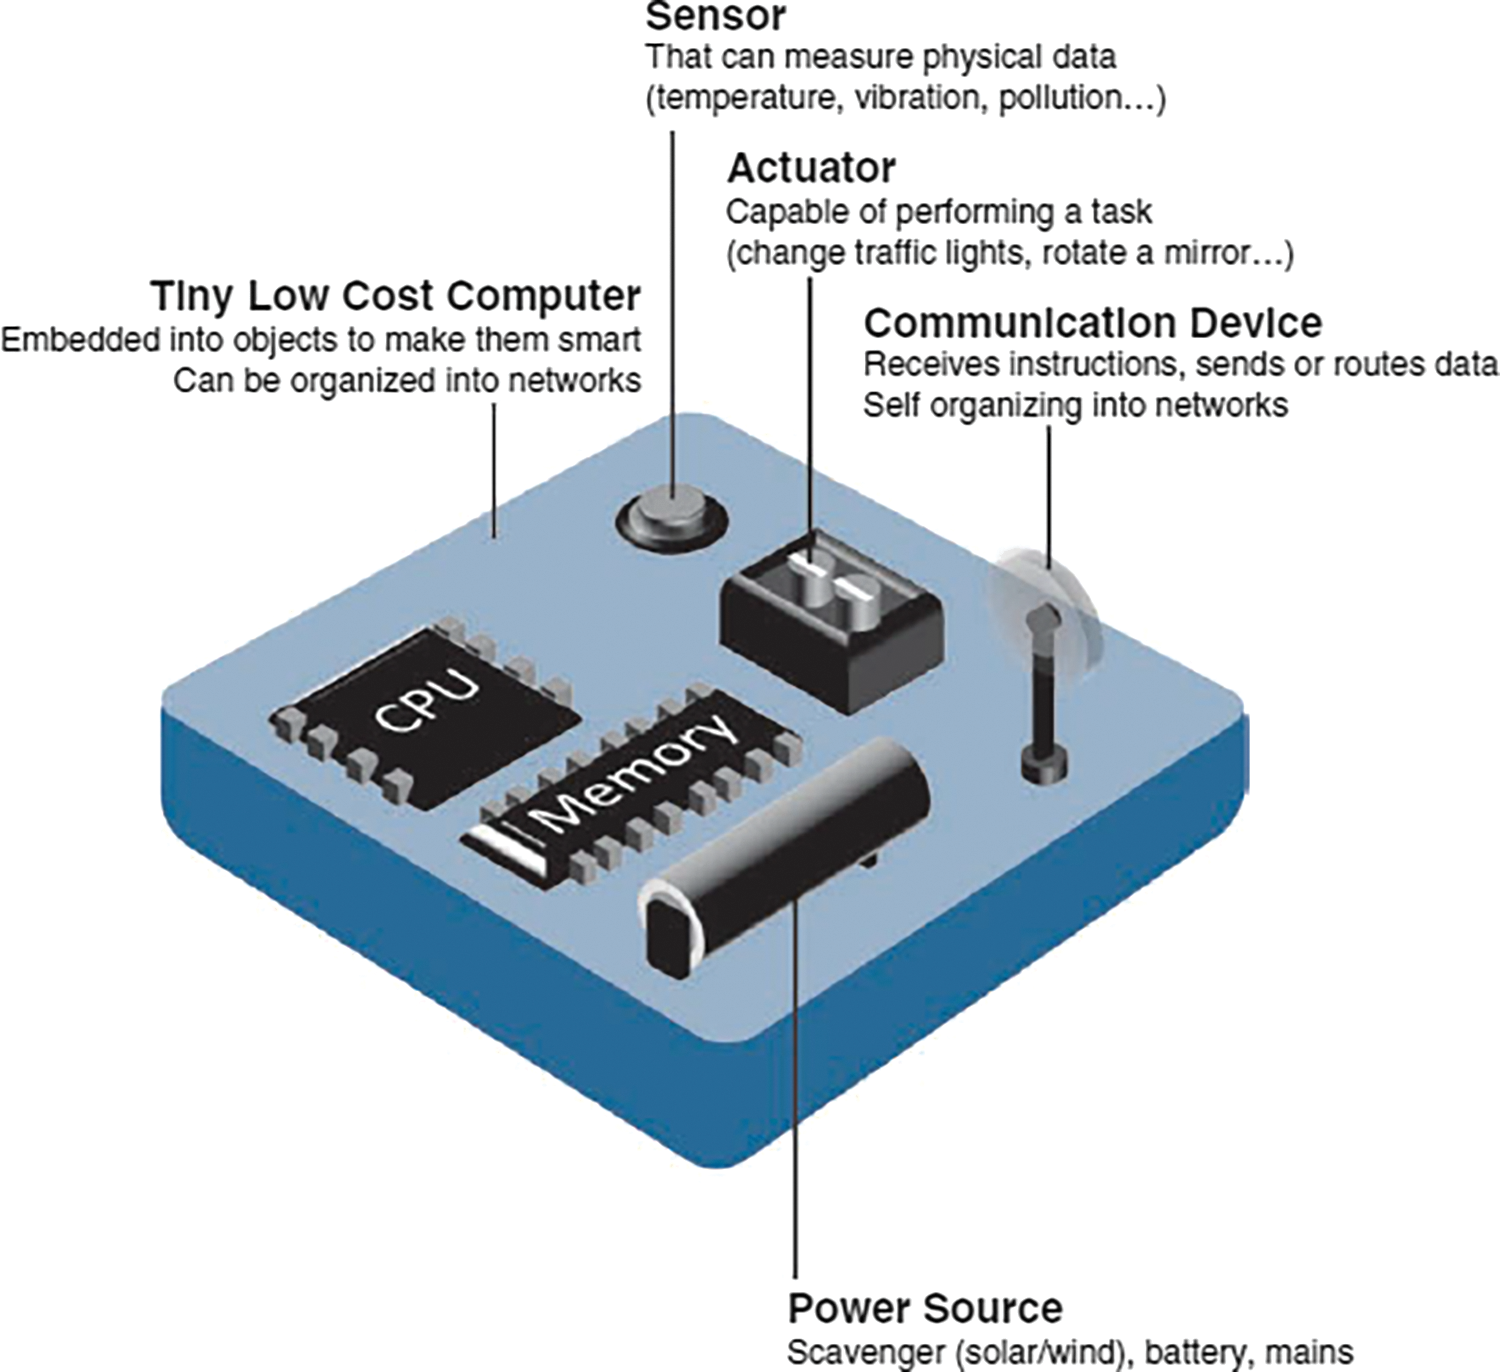
Figure 1: Smart device components
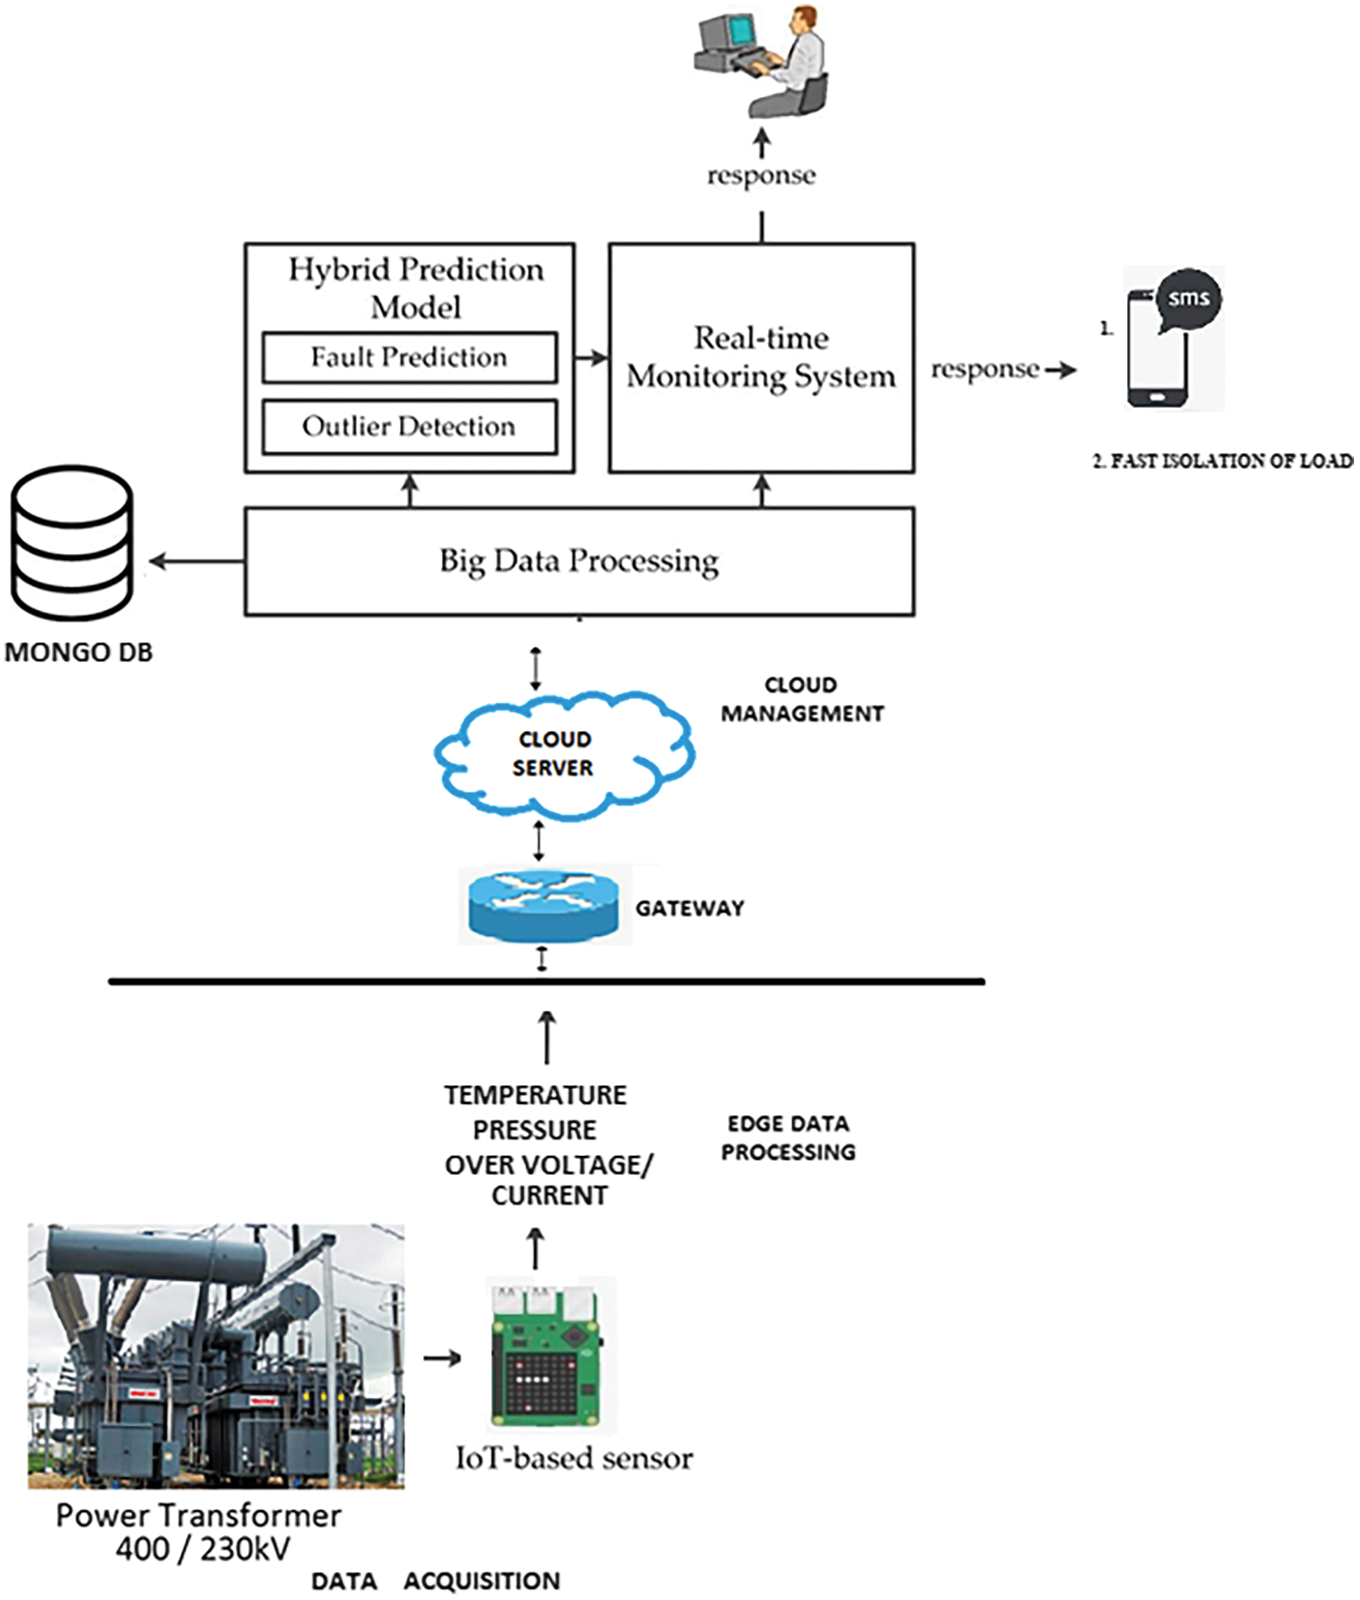
Figure 2: Functional IFW of the proposed system
As a client using the API, researchers created a python programme to collect SD from IoT-based sensors in this investigation. Smart devices are equipped with transceivers for wireless communication, which communicate the data to the gateway of the Internet through a Wi-Fi facility. Every 5 s, the IoT-based sensor detects the state of the environment and transmits the SD to a CS. Using the BDP system, the SD is processed and analyzed in real-time for additional information. The historical SD is kept in MDB and shown on web-based remote monitoring in real-time.
Data from smart devices connected to PS equipment will be analyzed using a distributed publish-subscribe messaging service, AS, a robust heterogeneous database, and MDB. The MDB, which is deployed in the CS, is connected through the AK connector with MDB. It is fault-tolerant, scalable, and data processing is guaranteed. Storm outperforms the other systems in terms of fault tolerance and memory use. AK allows real-time data mobility across services by writing events sequentially into commit logs. MDB is the most widely used modern database designed to handle large amounts of heterogeneous data. MDB, AS, and AK are the three components that make up the heart of many modern data infrastructures today.
Any application that sends data to a cluster of brokers known as a producer is called a broker. When a producer publishes, a broker receives and stores the data. The data is then consumed by a consumer at a given offset or position from a broker. A Topic is a name for a category in which records are saved and published. Fig. 3 shows the architecture of the AK system. It was developed to process data from real-time activity streams (logs, metrics, collections, and social media streams). Using AK Connect, it is possible to integrate AK with external systems like MDB. AK ideas make it possible for users to quickly and easily import data from other systems into AK Ideas and the other way around. MDB and AK are seen functioning together. Data is flowed from a MDB collection to a AK topic using MDB as a source. Data that flows from AK topics to MDB is also sent to MDB as a sink.
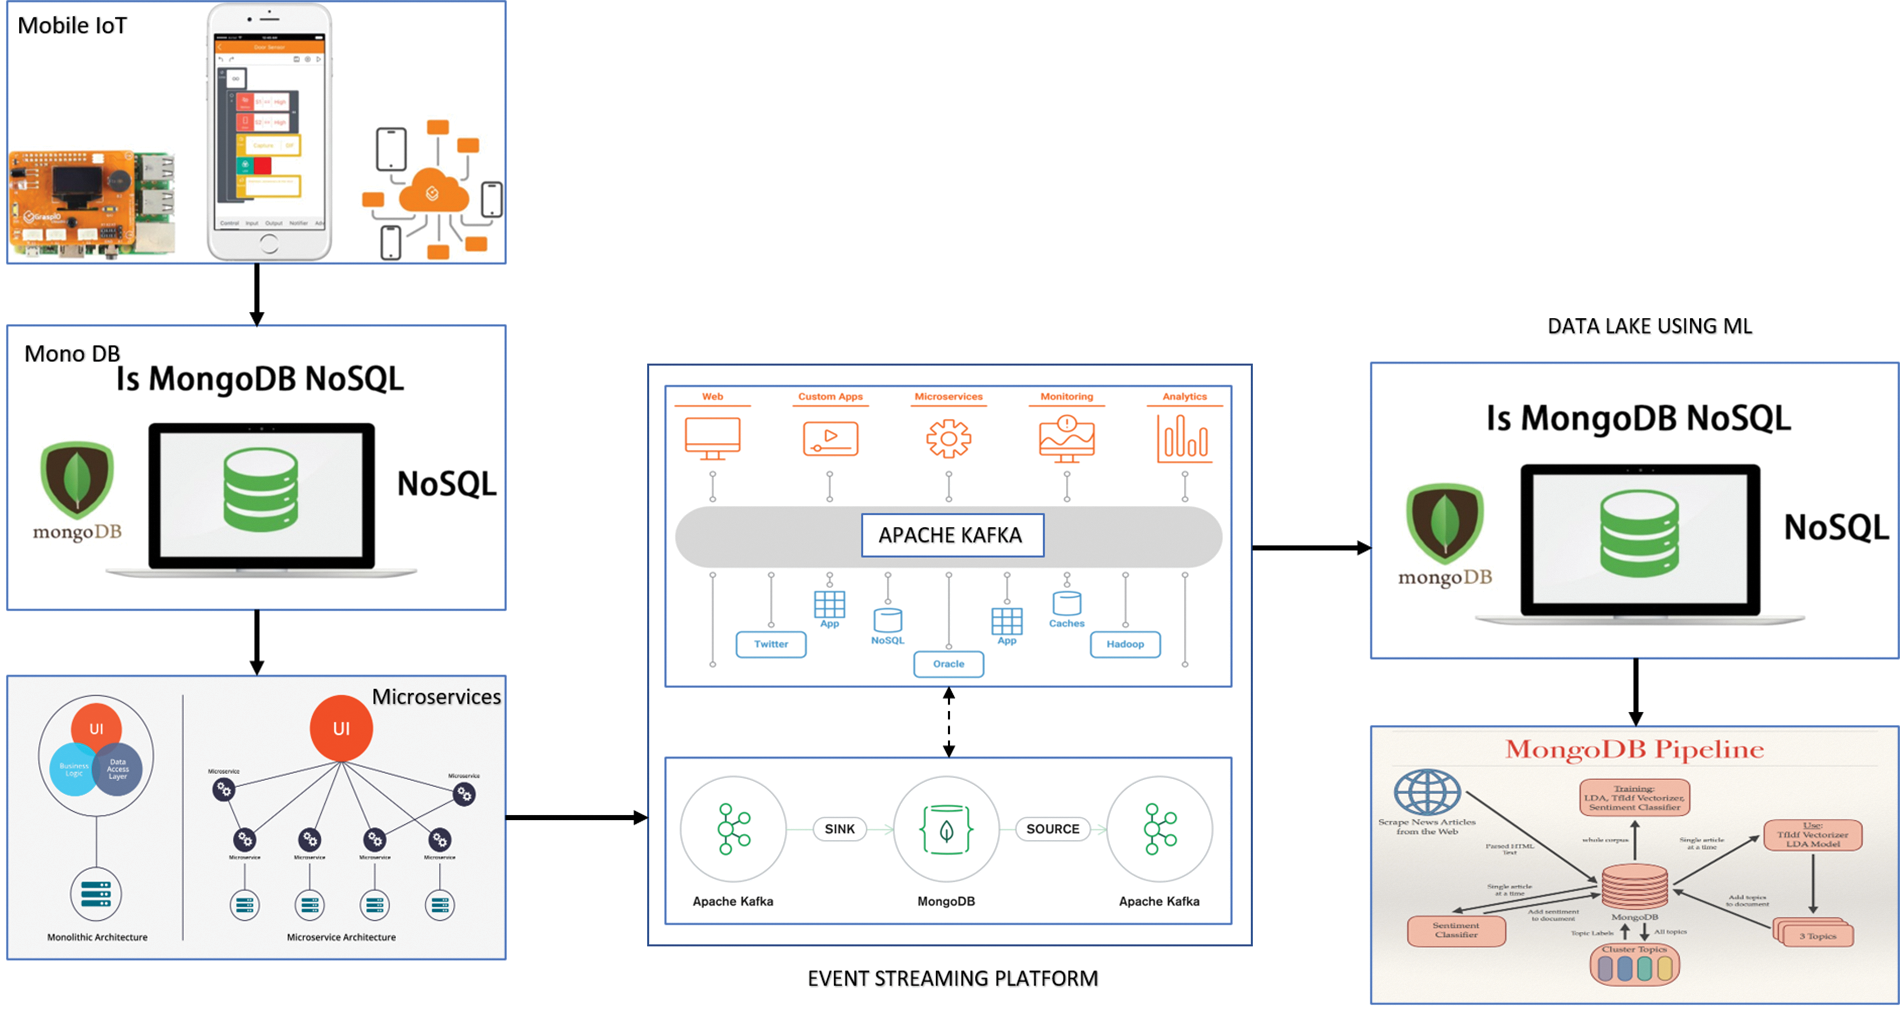
Figure 3: MDB and AK are working together
The MDB Connector for AK can be used with these AK deployments to implement AK. Fig. 4 shows the AK ingestion and historical data stored. The MDB can be acted upon as a “Source” or “Sink” for the AK topic (Fig. 5).
Figure 4: AK Ingestion
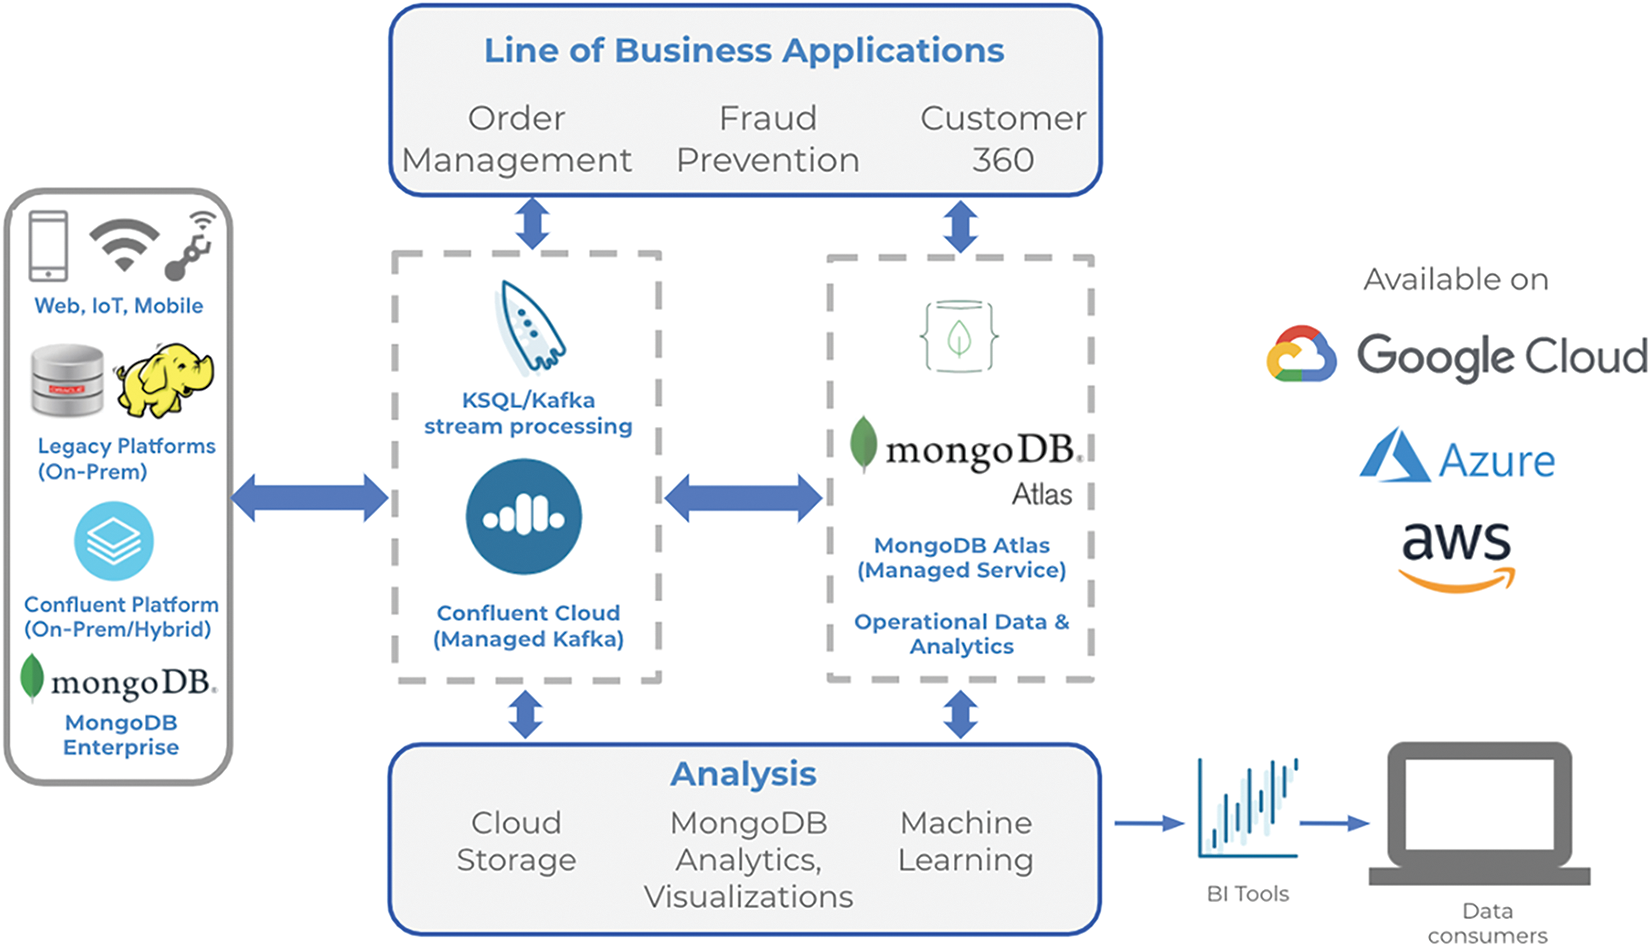
Figure 5: Mongo DB Connector with Apace Kafka
3.2.2 MongoDB as A Source for A Kafka Topic
MDB is used to store inventory data in an e-commerce application, such as Amazon.com. An automatic order for more products is desired whenever an item’s stock falls below a certain level. This ordering is done by other systems outside MDB and uses AS to process the real-time data. When MDB, AS, and AK are working together, it is an excellent example of the powerful processing and storing structure when MDB, AS, and AK are working together. Smart devices are connected to the PD, and it is being monitored continuously. Any abnormality is observed, such as changes in the parameters like an increase in coolant temperature, electrical arc, overcurrent, or overvoltage occurring in the PD, which generates event notifications. The historical data is stored in MDB, and when the current parameters go below or above a certain threshold, the system may take the necessary action by sending earlier warning messages and then quickly disconnecting the PD.
3.2.3 MongoDB as a Kafka Topic’s Data Sink
A new kind of fault is detected, which is placed in a AK topic as “New Fault,” and it would configure MDB as a sink of the AK Topic. These kinds of “peculiar faults” are stored in MDB. An ML technique, i.e., HPM, combines the DBSCAN for OD with RF classification, removing outlier SD and identifying the fault type. If the “Peculiar Fault” happens next time, it initiates the earlier notification messages or the consequent actions to handle this fault. For example, event-driven systems and microservices patterns can use this connector to sink and source data from MDB into AK. The proposed IoT-based IFW uses this modern architecture to keep an eye on PS devices in a good way.
3.3 Model of Hybrid Prediction
3.3.1 Spatial Density Clustering with Noise-Based Outlier Detection
DBSCAN is a data clustering technique that takes relevant points in space and clusters them closely together while identifying outliers isolated in low-density areas. The DBSCAN approach can be beneficial for PS protection. The sensors deployed in various places of the substation sense the parameters continuously and stream data to the centralized server. For any abnormalities in operation, DBSCAN quickly identifies the faults, i.e., an abnormal increase in temperature or pressure is identified as outlier data. RF is a supervised ML algorithm used extensively in classification and regression problems. It quickly sorts out the different kinds of faults.
3.3.2 Model for Fault Detection Using Hybrid Prediction
The HPM was suggested in this study to determine whether the process is operating regularly or abnormally. Detecting normal or abnormal occurrences during power substation operation is shown in Fig. 6. OD is based on the DBSCAN algorithm. It is used to detect and eliminate outliers from SD, and an RF-based classification model is used to forecast normal and abnormal events in the HPM. For the experimental purpose, IoT-based sensors are deployed in a lab, the dataset is collected from sensors, and the performance evaluation of the prediction algorithm is also tested. During the operation of the substations, the gathered dataset consists of 100 events that are classified as normal or abnormal. The dataset consists of eight features: coolant oil temperature (°C), environmental humidity (% relative humidity/RH), the pressure within the PT, leakage current, over-voltage, and CCTV footage, if necessary. 40 data points are labelled “Yes,” and 60 data points are labelled “No.” A “Yes” class means something unusual happened while the substation was running, while a “No” class means something normal happened.
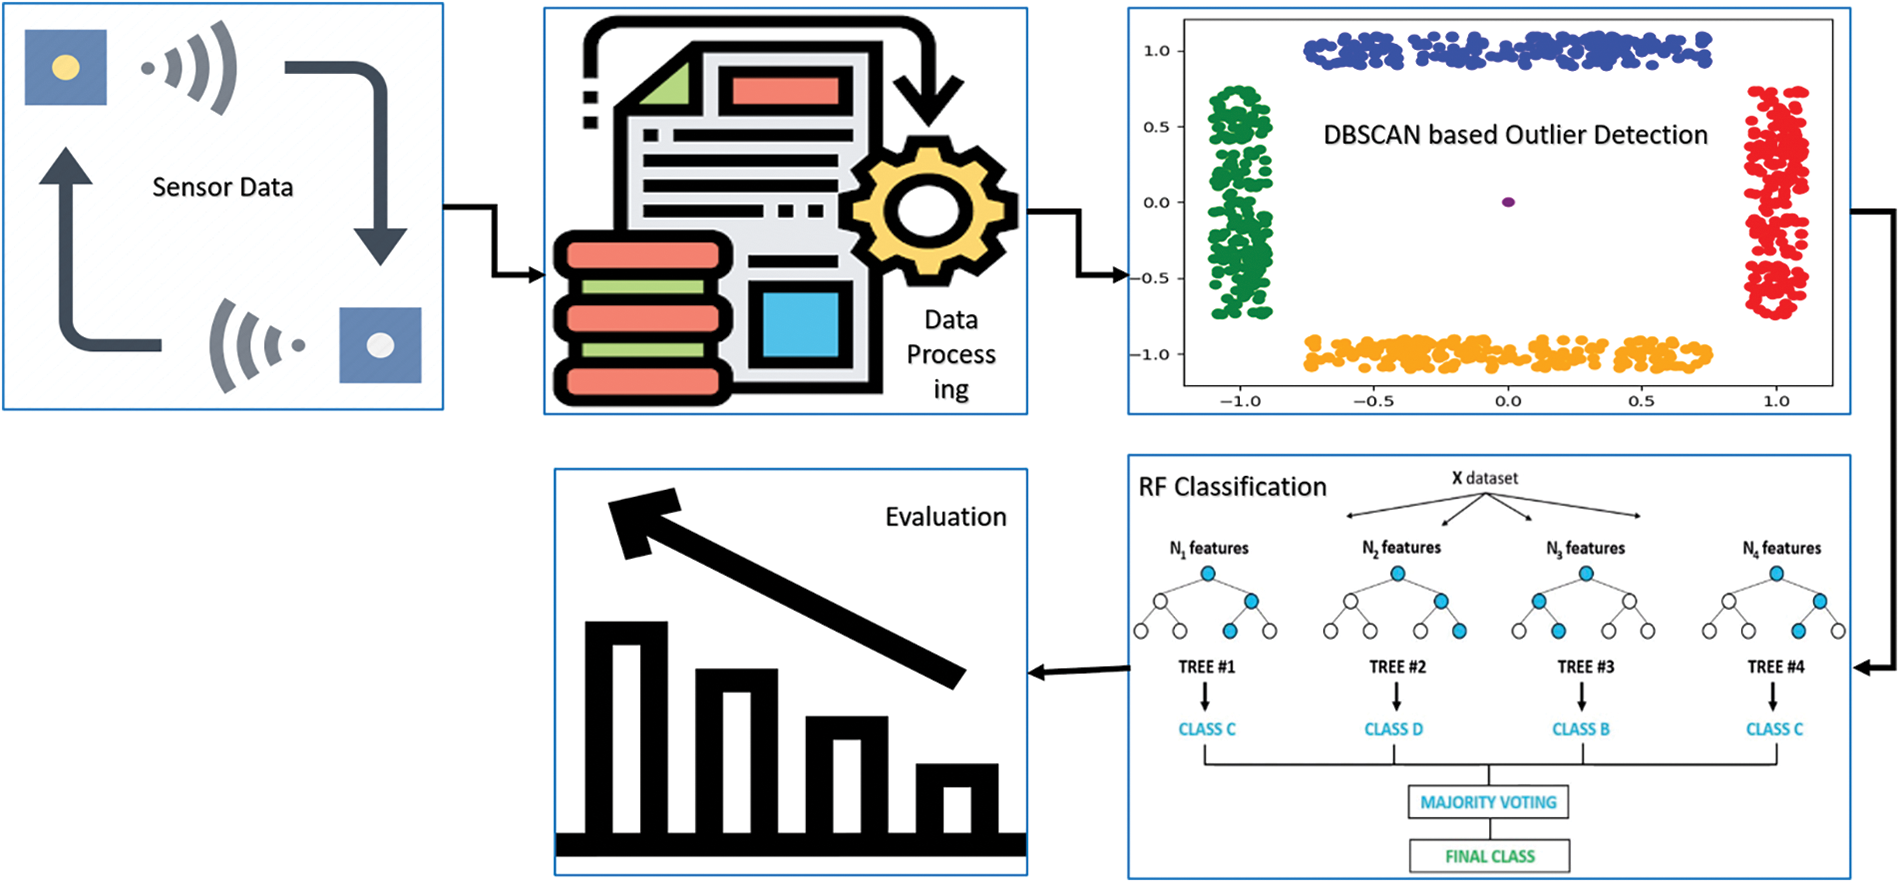
Figure 6: HPM using DBSCAN and RF-based classification
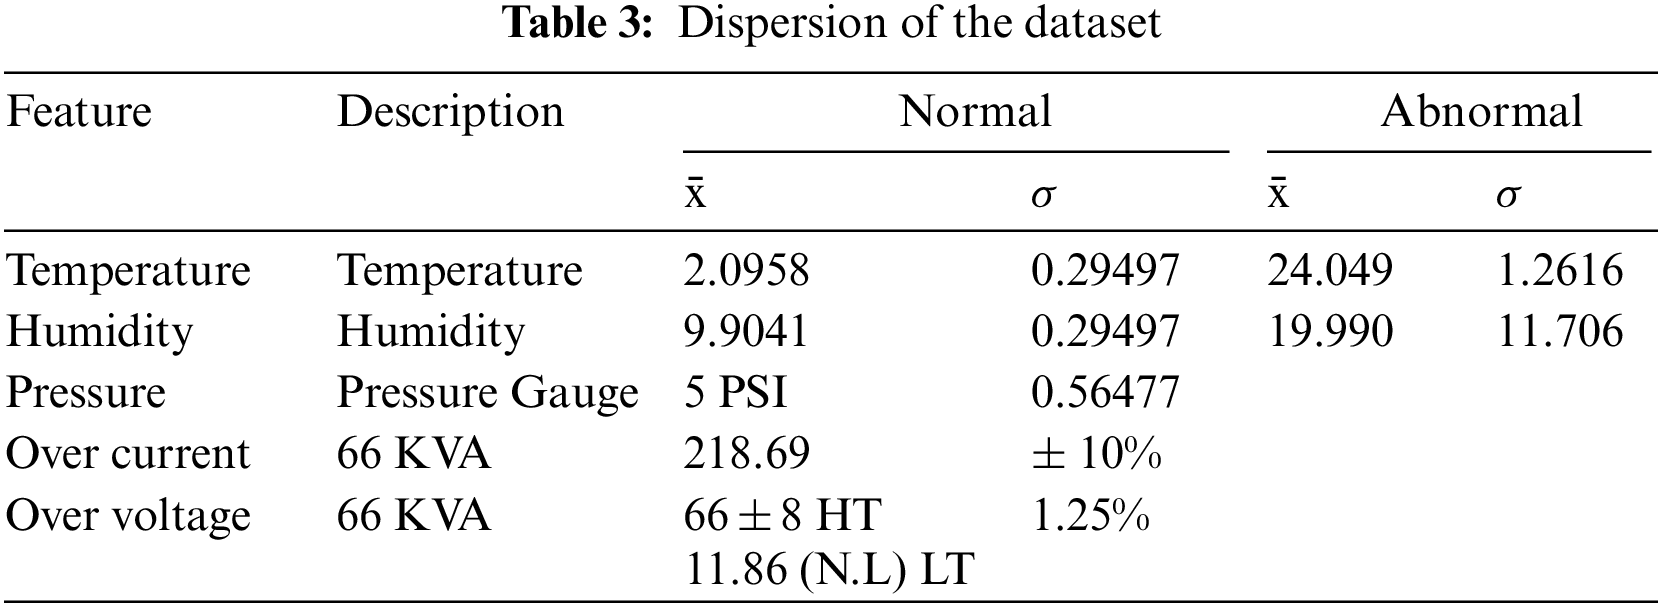
Furthermore, the training dataset (100 events) was labelled based on the potential combination of normal and fault events that could occur during substation operation. From the obtained dataset, ML methods are expected to learn and build a robust model/classifier. The prediction result from real-time IoT-based SD can be produced by the model/classifier placed into the monitoring system (Fig. 7). After the data set was collected, it was preprocessed by removing unsuitable, inconsistent, and missing data (Table 3).
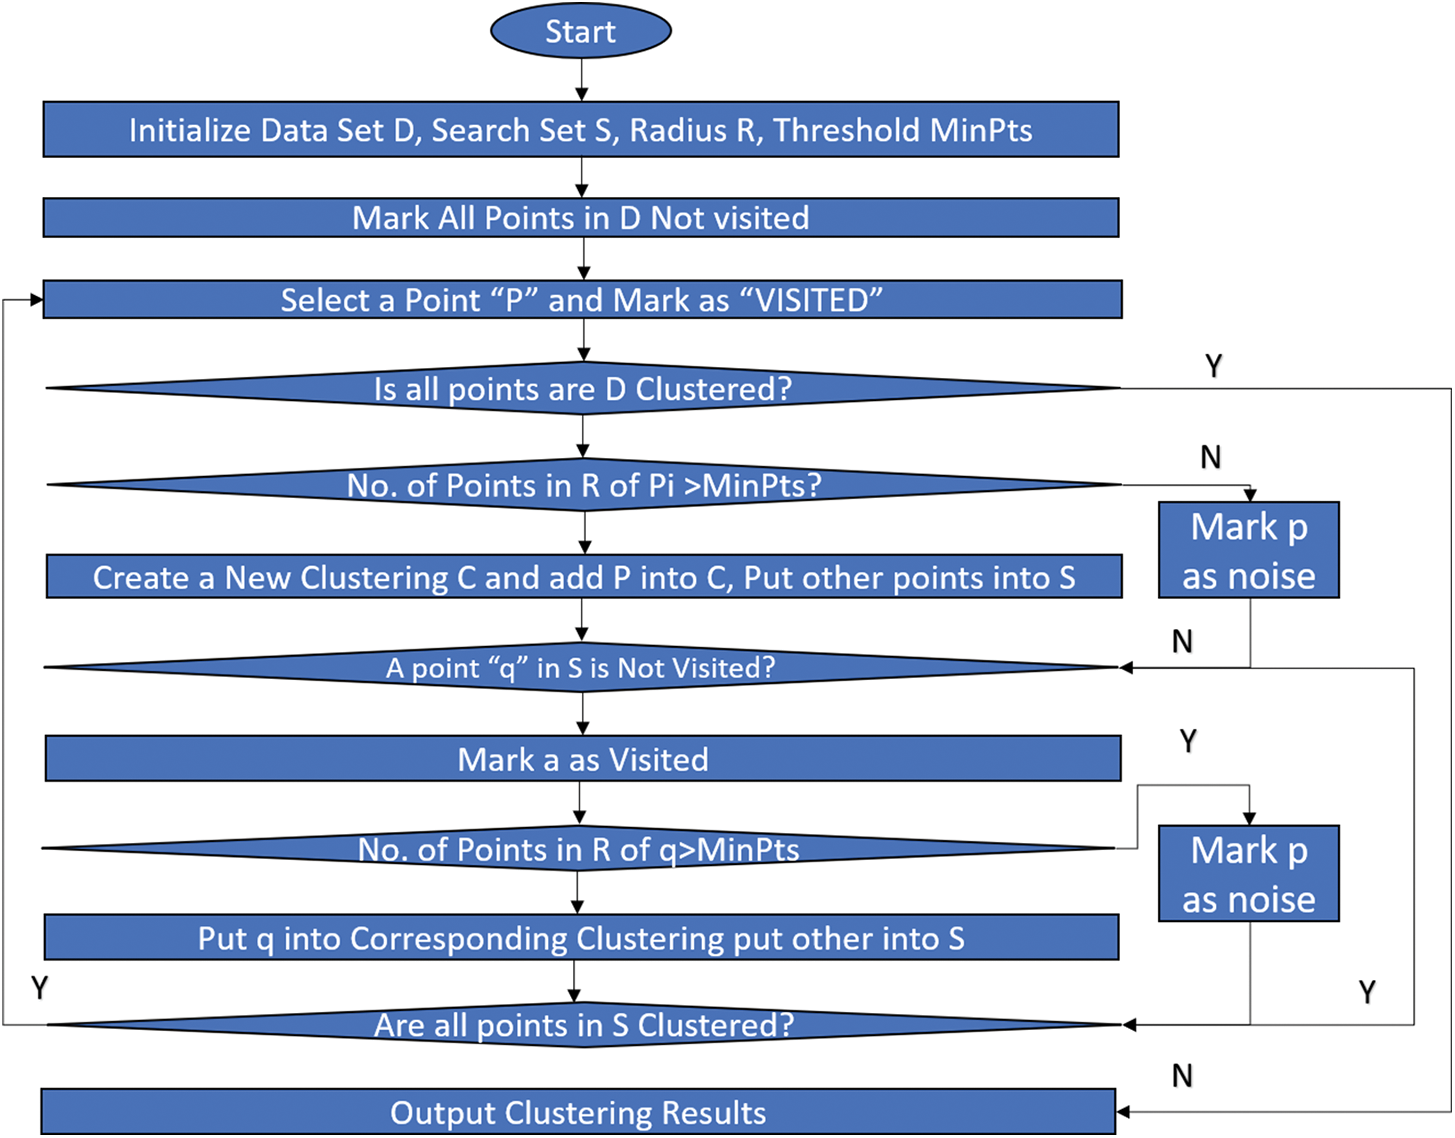
Figure 7: Flow chart of DBSCAN algorithm
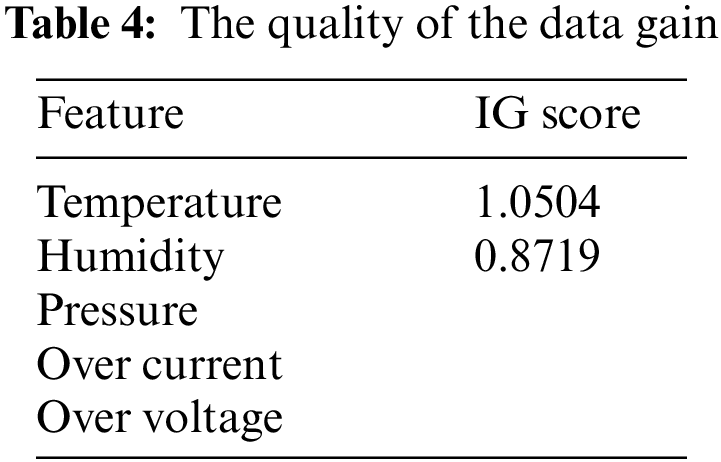
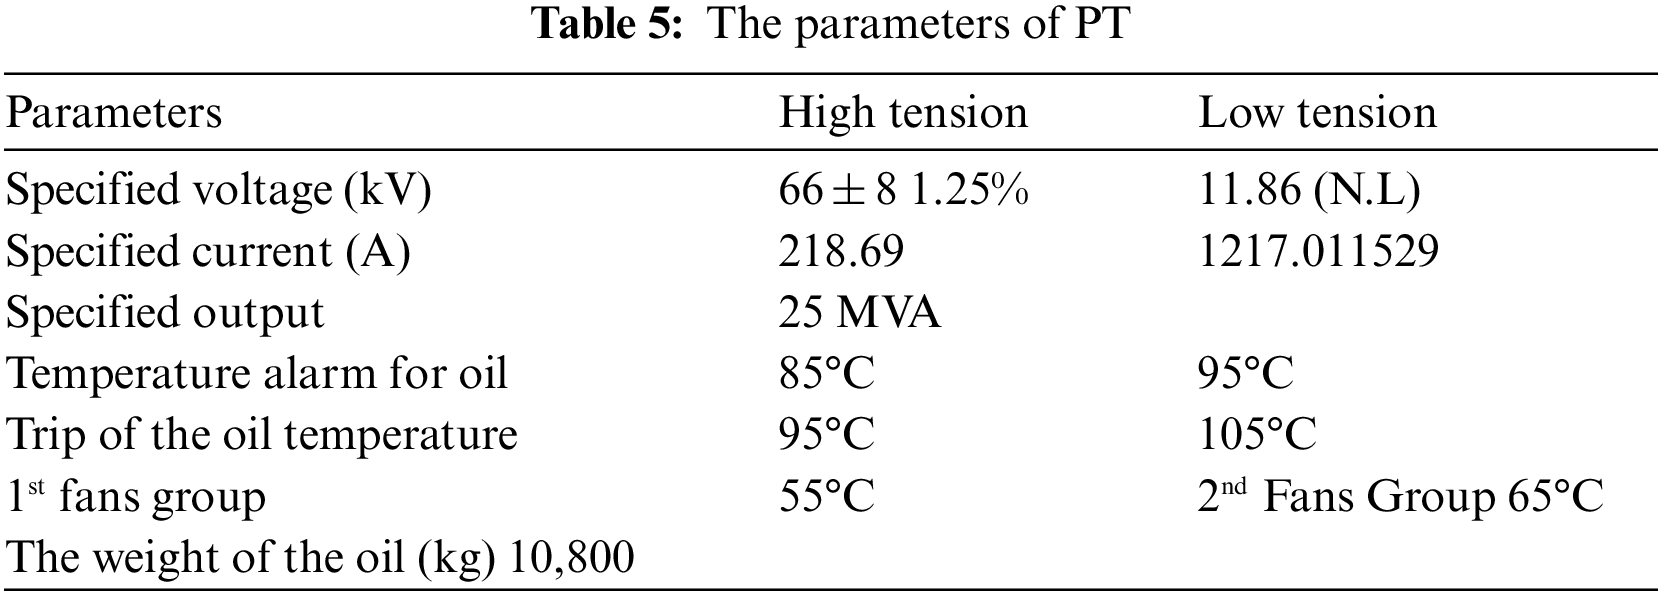
In addition, the Information Gain (IG) technique was used to assess the relevance of the attributes. It is frequently applied in designing decision trees from a training dataset by analyzing the gain ratio for each variable and selecting the variable that provides the maximum information gain, thereby minimizing the entropy and efficiently and successfully separating the dataset into clusters for class prediction. Table 4 lists the dataset attributes as well as associated IG ratings. The results reveal that temperature is the most crucial element influencing abnormal events (fault events) during PT operation. A 66/11 KV transformer is used to simulate test conditions (Table 5).
The temperature settings can be customized based on the requirements. Similarly, due to fault conditions, various parameters are increased, i.e., pressure, current, and voltage are sensed by the IoT sensors. The proposed work used DBSCAN-based outlier identification to remove outlier data from the dataset. Finding things close to a given position was used to build dense zones. The sites outside of the dense zones were identified as outliers. DBSCAN considers two crucial parameters: epsilon (eps) and minimum points (MinPts). The radius distance of the neighbourhood around a point x (e-neighbourhood of x) is determined by eps, and MinPts is the lowest number of neighbour points inside the radius distance specified by eps for dataset D, which is designated as unvisited:
• For every unexplored point ‘xi’ in D, discover the e-neighbourhood that contains at least MinPts points.
• Create a new cluster C for point ‘xi,’ which is not assigned to any cluster that belongs to a candidate set ‘N’; add the points in xi’s e-neighbourhood. To ‘C’, add any points in ‘N’ that aren’t part of a cluster.
• E-neighbourhoods that contain at least the number of points of interest must be found for each point in N.
• Repeat the procedure once all the points in ‘N’ and ‘D’ have been visited.
• Outliers are data points that don’t fit into any of the clusters.
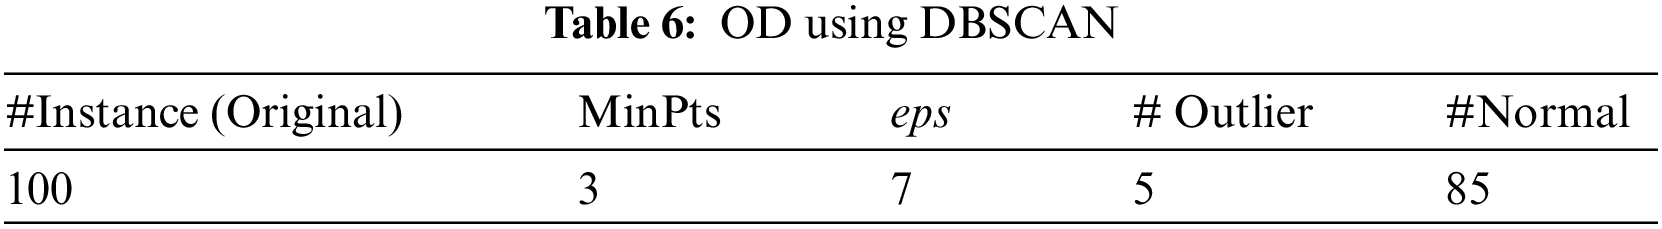
Some of the data acquired by the sensor may be noise created by outlier data due to the sensor’s imperfection and network connection issues. The optimal values of MinPts and eps must be determined prior to execute a DBSCAN-based OD. If eps is set to a low value, more clusters will form, and normal data will be labelled as outliers. However, fewer clusters will be formed if too large, and actual outliers may be labelled as normal data. The optimal MinPts and eps parameters were identified through several experiment setups, and they are 5 and 7. Two-dimensional graphs depict the DBSCAN implementation results for the dataset in Fig. 8. DBSCAN divided the data into three clusters, labelled 1, 2, and 3, and then analyzed each. For the outliers, which were labelled cluster 0, unclustered data was used. Table 6 describes the dataset, recommended settings, and outlier data. We then removed any remaining outlier data to allow us to focus our attention on what was actually in there.
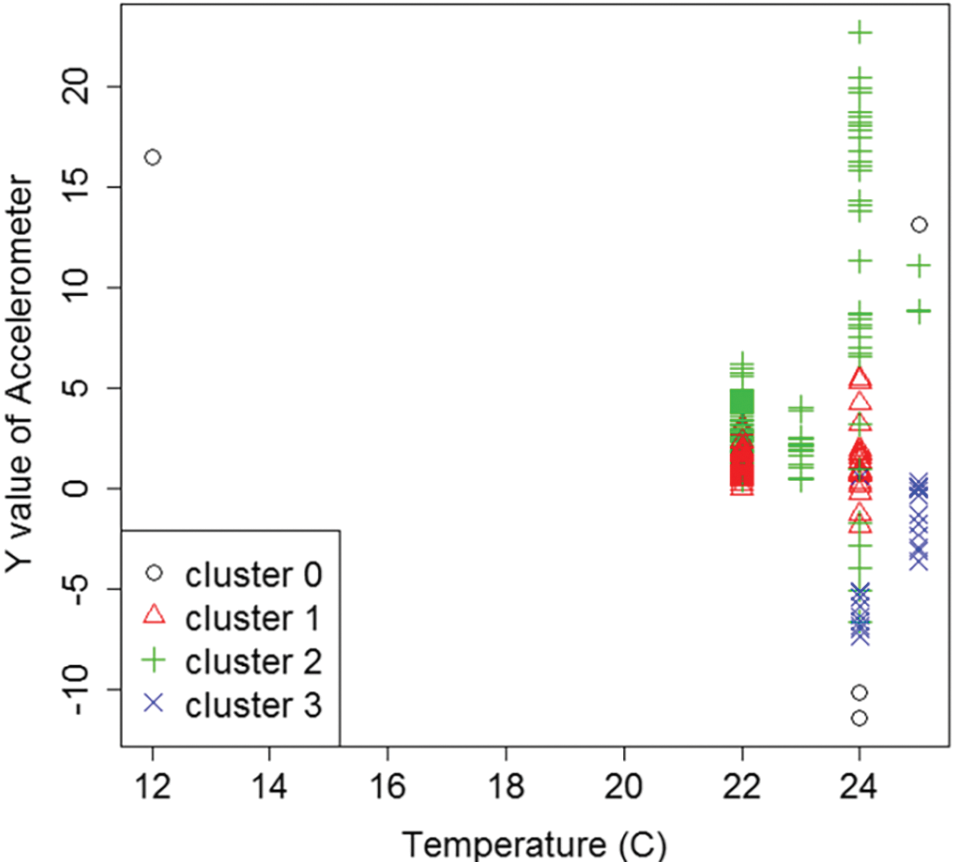
Figure 8: Detection of outliers using DBSCAN
RF is the primary classification method for classification problems in the real world. For more precise and consistent prediction, the RF method is built by integrating numerous decision trees. Each tree within an RF is built independently by picking a random selection of characteristics and bootstrapping the dataset. The tree is then developed to its fullest potential. The final prediction output will be determined by a majority vote. A high rate is a well-known strategy for obtaining a better closing prediction value. When compared to other classification models, the results showed that RF outperformed. In this study, outlier data was removed from the dataset using DBSCAN-based outlier identification, and RF was used to learn from the training set. Lastly, the model’s accuracy was checked by comparing the results of the predictions with those of the testing set.
4 Experimental Validation Systems
4.1 Real-Time Monitoring System
The JavaScript framework is used for real-time monitoring of data through data visualisation and presents the SD lucidly. The substation operator could monitor the condition of all the substation equipment’s operations and receive an alert or early warning message once an abnormal event (fault) is detected through the proposed model. The smart sensor devices send the streaming data to AK, a messaging queue, and then AS processes the data; any abnormality found in the operation of the equipment is compared with the historical data already stored in the Mongo DB; if it matches, FP results occur; and finally, the SD and its prediction results are stored in MDB. The RTM system can be accessed through a web browser on a personal computer, as shown in Fig. 9. In a web browser, the proposed system displays SD data such as temperature, humidity, pressure, earth leakages, and overcurrent/voltage. For each record, the device ID (a sensor device based on IoT) and recorded time are collected and displayed. The HPM is used to predict the fault and send results to a system for maintaining an eye on things. The proposed framework was built and tested on a 400/230/110 KV substation in the PGI near Sriperumbatur in Chennai. Four IoT-based sensor devices were installed in the PT and substation environment, and every five seconds, they transmitted SD data to a remote server. Around 19 million records (3 GB) have been collected during this testing period. Our proposed RTM system consists of the IoT-based sensor, the BDP platform, and HPM. The performance measures for each section are discussed in sections B, C, and D.
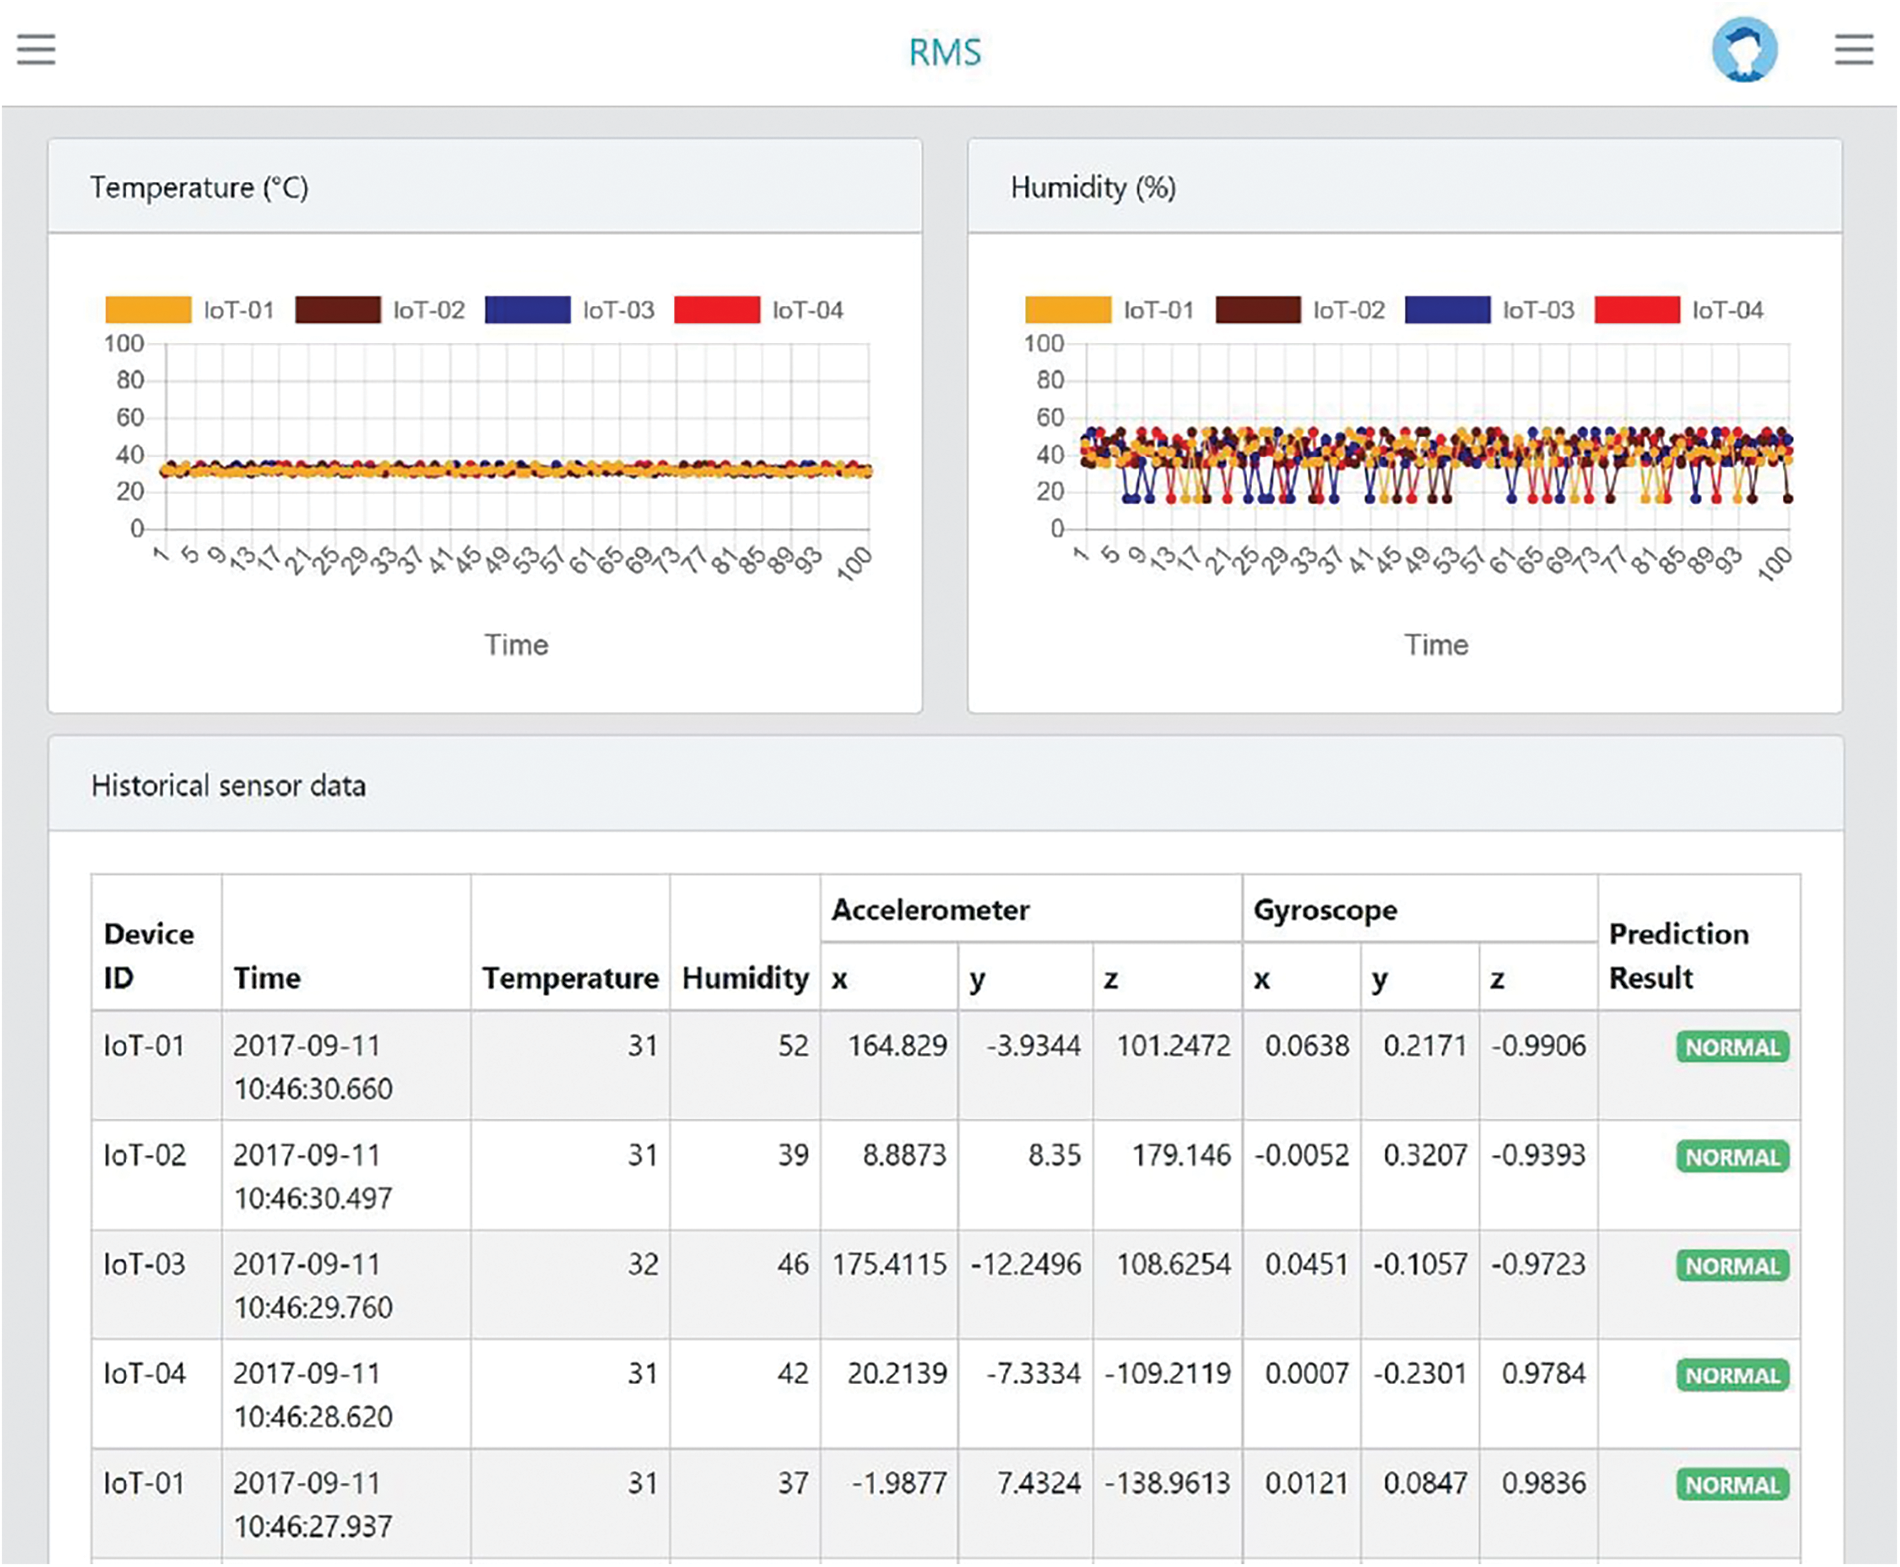
Figure 9: Real-time monitoring system
4.2 Performance of the Smart Devices
A sensor device and a client programme for retrieving SD and sending it to a CS. In this study, performance indicators such as network delay, Central Processing Unit (CPU), and memory utilisation were analyzed, and the results are shown in the graph. As shown in Fig. 10a, network delay is defined as the average time it takes from the source to successfully receive the data from the destination. The average CPU and memory usage of the client application in various scenarios was the second performance metric. As part of this research, a Python-based client programme ran on an IoT sensor device and collected data on SD such as temperature, humidity, pressure, and leakage current. For the experiment, an IoT-based sensor with the Linux Raspbian Operating System Jessie and 4 gigabytes of random access memory was used. CS facilitated communication between the IoT sensor and CS via Wireless Fidelity (Wi-Fi) 6. Different volumes of SD are represented by different delays in this graph. The results demonstrate that the network end-to-end delay increases as the volume of sensor device-sent SD increases. The IoT-based sensor sends 1000 SD points concurrently in approximately 50 s. In a real-world implementation, however, it takes less than 0.02 s to send the SD because we only send one SD point every 5 s. In other words, as the number of sensors decreases, the delay also decreases. Fig. 10b also shows how the client programme uses the CPU and memory. Client programmes were examined at various intervals for reading and sending SD to the CS: 5, 10, 30, and 60 s. The findings revealed that the reading period has a negligible impact on CPU and memory utilization. Regarding the client program’s assessment cost, it should be noted that it used less than 3% CPU and 18 MB for all reading periods.
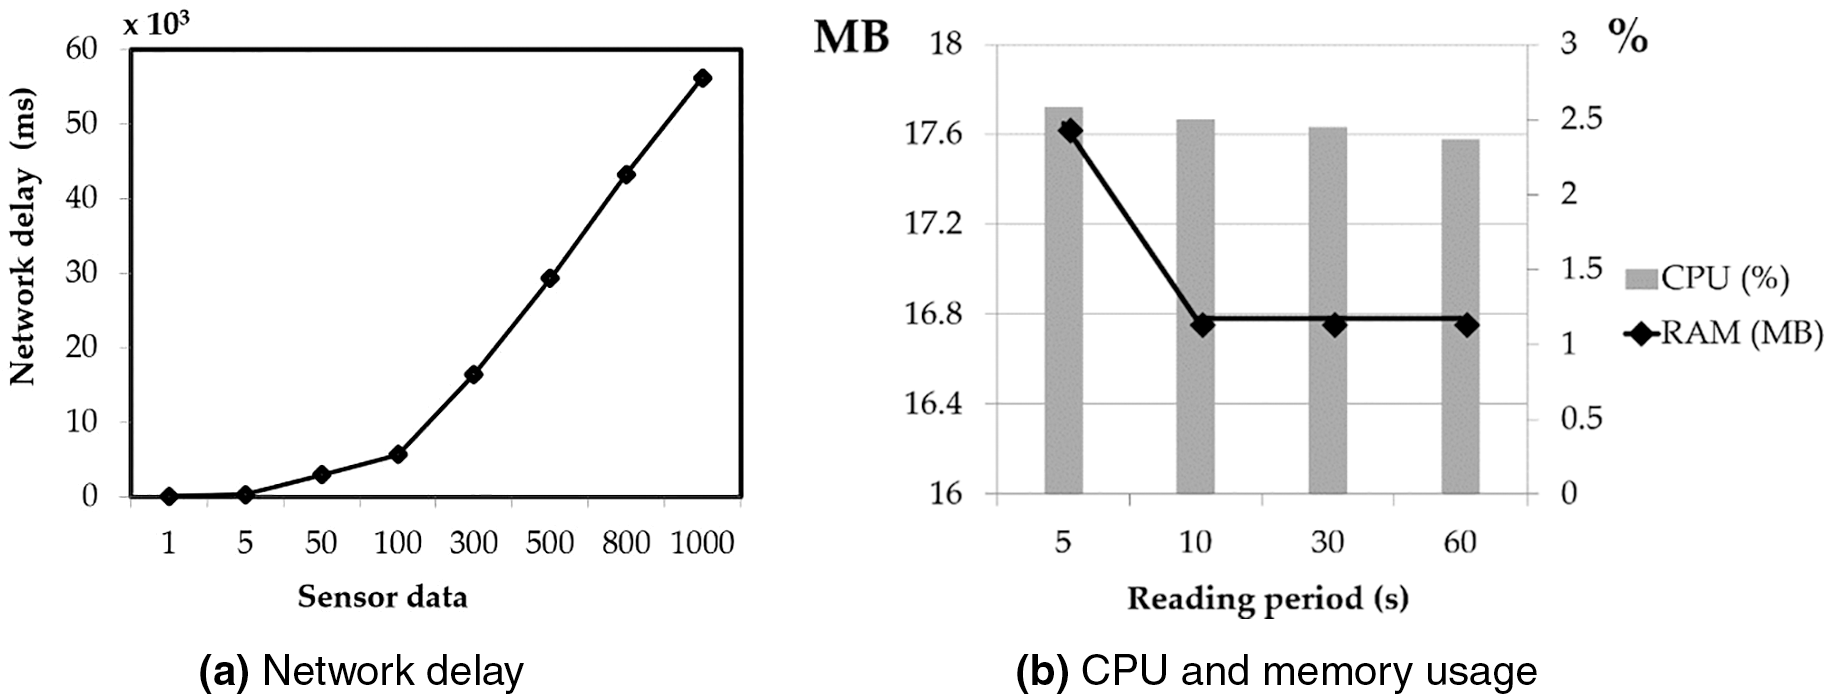
Figure 10: The IoT-based sensor model
4.3 Data Processing in the Big Data Era
The suggested system uses BDP with a combination of AK, AS, and Mongo DB to process the high number of SD acquired from the substation environment. This section examines the performance of BDP in the context of various fault conditions that commonly occur in substations. This study considered performance measures such as system latency, throughput, and concurrency. The author tested the system latency and throughput to evaluate BDP technology’s performance under various processes, while concurrency evaluated BDP technology’s performance under numerous clients. The suggested system’s latency is the amount of time it takes to look at the environment, process SD, and store the information in the database. The total number of sensor data points processed per second is known as throughput. The tests were run on multiple servers, and the response times were recorded for analysis. Each simulated data set is 211 bytes and includes the device ID, date and time the data was produced, and SD (temperature, humidity, pressure, leakage, and excess current/voltage). Fig. 11 shows that as SD volume increased, so did response time. As a result of the increase in clients, we have had to reduce our response time. Many clients caused more time for the proposed model to process and store SD concurrently. As shown in Fig. 11, multiple servers can take advantage of scalability support and help achieve a faster response time than a single server. Performance could be enhanced by increasing the number of servers.
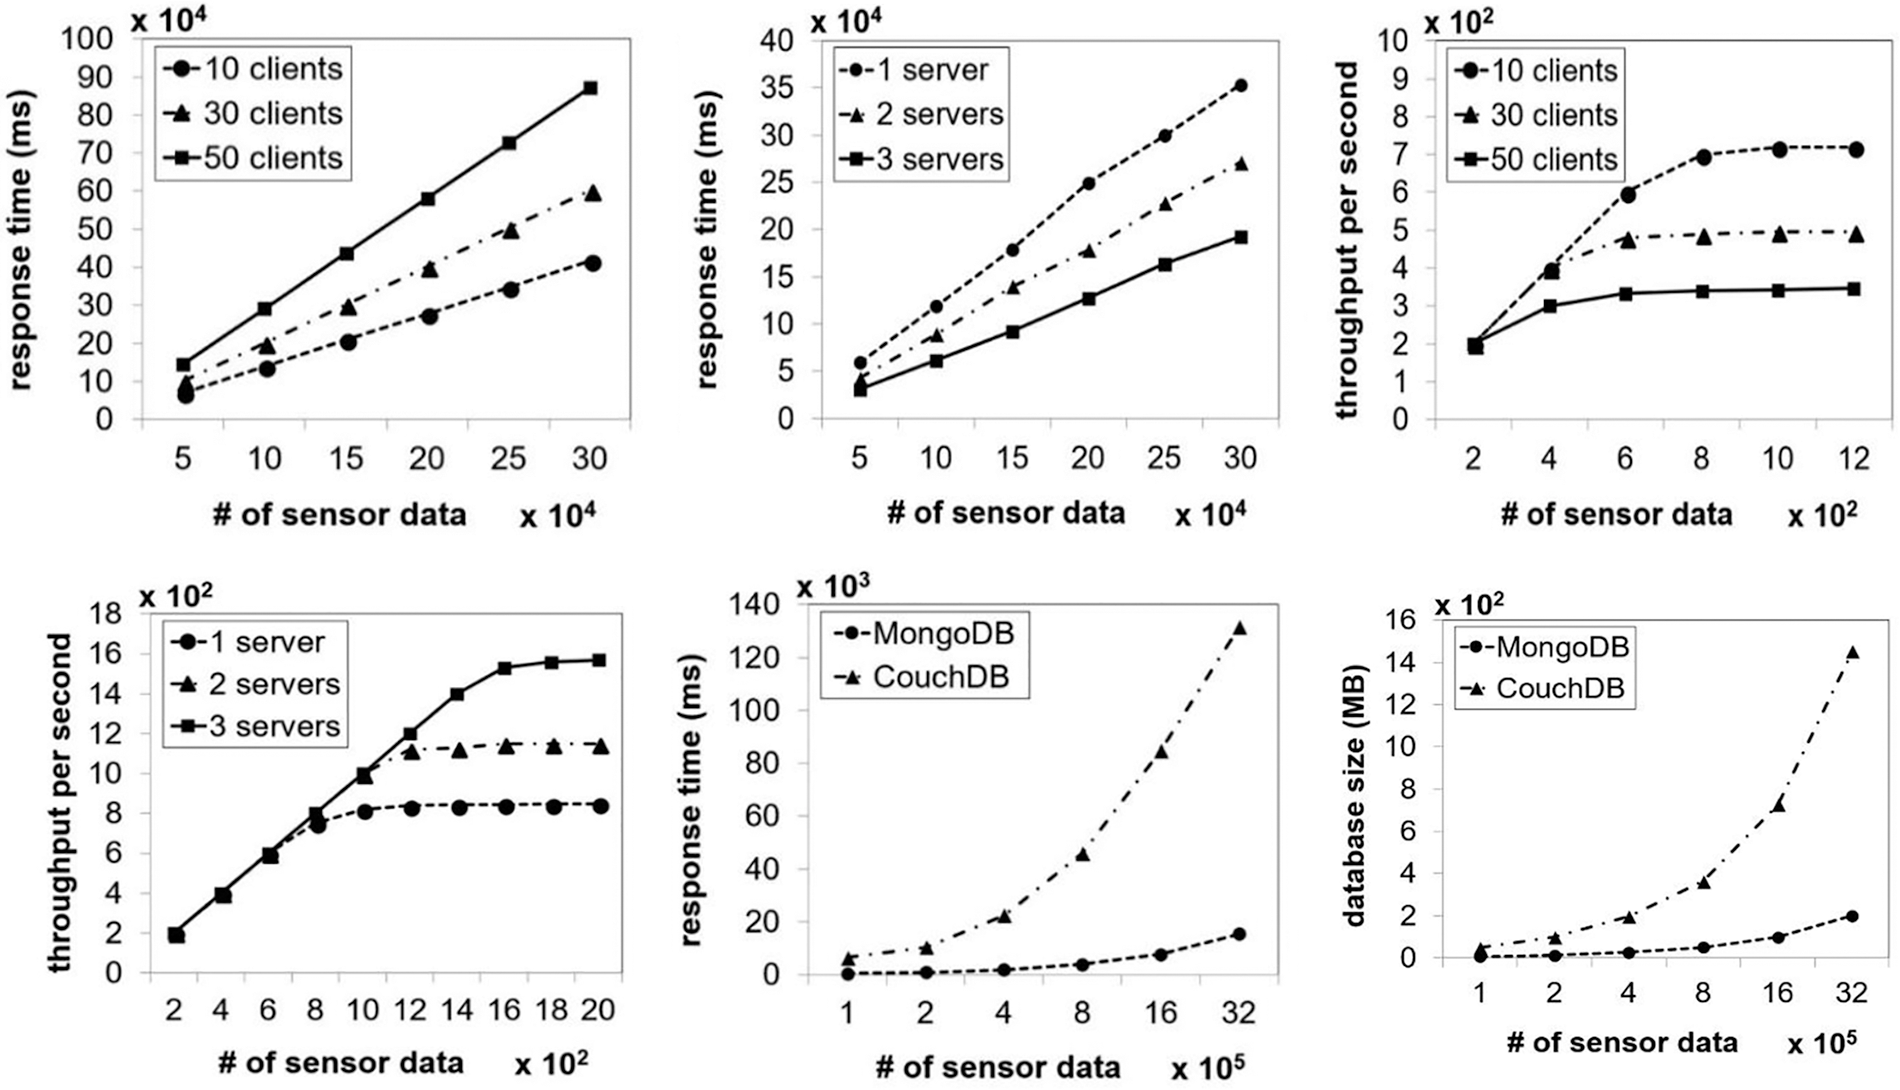
Figure 11: A comparison of the latency of MDB and CDB
Furthermore, MDB can achieve better performance in terms of latency and size of the database compared to Couch Data Base (CDB). In a series of tests to see how well it manages and controls a large volume of data, MDB did better than CDB.
4.4 Hybrid Fault Detection Modeling Approach
The smart sensor devices generate the dataset; the BDP system receives the SD and stores it in NoSQL MDB. It is possible for the smart sensor to collect data on both normal and abnormal events during operations. Using the function status (normal/abnormal) as a guide, the dataset is labelled and saved as historical data based on the SD. Predictions about fault status are also based on the HPM analysis of the dataset. Table 7 compares and contrasts the performances of the diverse classification models. In order to identify and predict abnormal events, multiple conventional classification techniques such as Naive Bayes (NB), Logistic Regression (LR), Multilayer Perceptron (MLP), and RF were evaluated by comparing them with the HPM. In terms of accuracy, the proposed framework significantly outperformed all other frameworks and is the most accurate. The DBSCAN-based OD improved the model’s accuracy slightly. Adding DBSCAN-based OD to the RF model increased the model’s accuracy by 1.462%.
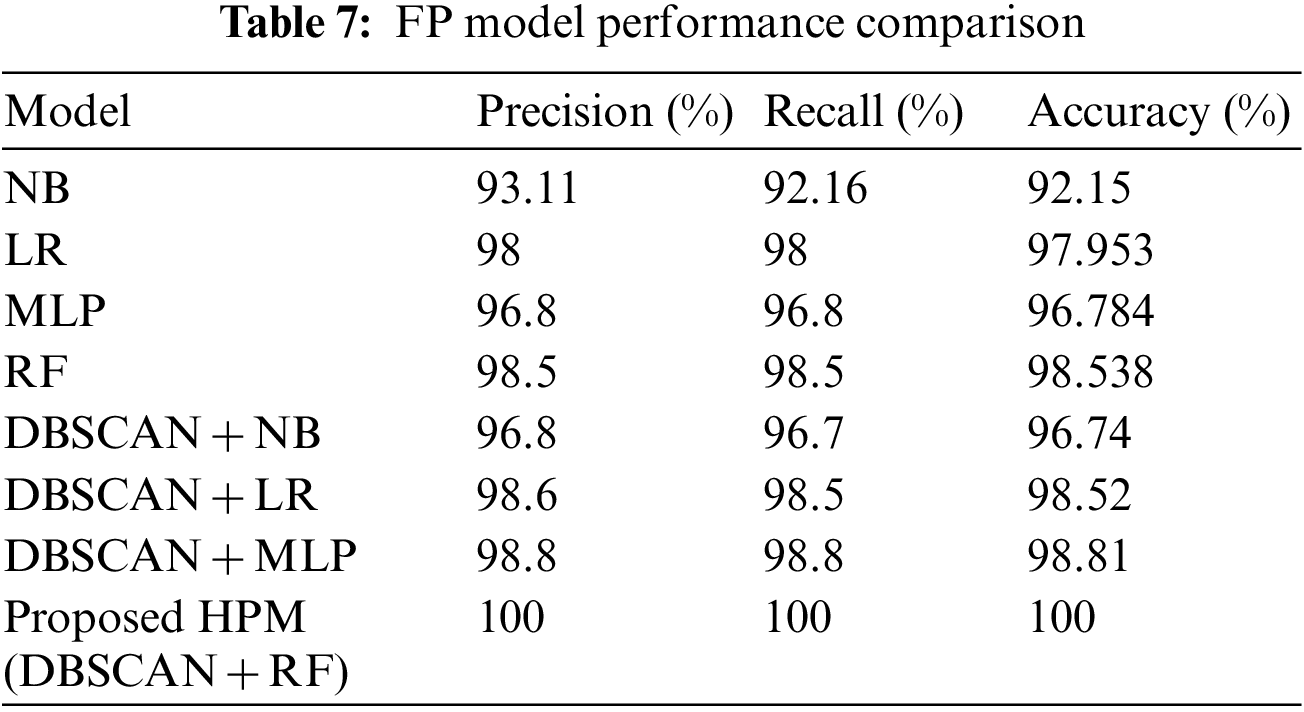
Also, using DBSCAN for OD improved the accuracy of traditional classification models like NB, LR, and MLP by up to 3.173%, 0.567%, and 2.026%, respectively. Data streams from sensors can be managed and predicted in real-time using AK-AS. Real-time prediction is shown in Fig. 11 to determine if the process is operating normally or abnormally based on the input data from the IoT-based sensors (temperature, humidity, and pressure) and leakage current and over-current/voltage. Smart monitoring and hassle-free operation are expected to help the substation operator; avoid adverse breaker trips caused by faults early and improve electrical safety as a result of the findings.
4.5 Implications for Management
An IoT-based smart sensor, a BDP, and an ML model are all part of the system under consideration. To begin with, the IoT-based sensor equipment is built on the Raspberry Pi, a compact, low-cost, and capable single-board computer. The suggested IoT-based sensor equipment is designed to monitor the in-real-time operation of PS equipment. Second, as the number of IoT devices produced and the SD volume increases, BDP is required to manage effectively, process, and store data without sacrificing performance. For implementation and integration, the built-in BDP platform relies on the OSS. Data collection in both normal and abnormal situations can be done using ML. ML provides powerful tools, which are utilized in work to detect faults (abnormal events) in real-time during the functioning of substations. So, it is expected to help maintenance engineers improve substation operation and management by making it easier to make decisions and catch problems early enough to keep the power from going out unexpectedly.
This paper discusses a smart IoT-based smart power system device protection framework, including its design, implementation, and functional validation. It provides a comparatively secure and sophisticated environment for the substation engineers to monitor the entire operation of the PS through a web-based monitoring system. The IFW protects substation devices through fast coupling and decoupling of the PD, thus ensuring the safety of the equipment and providing a UPS to the public. The proposed IFW uses the AK-AS-NoSQL Mongo DB architecture to process a massive amount of real-time data. Storm receives the SD and uses it to create the HPM. The system provides a Web-based system for monitoring the events of the substation PD. If any anomaly happens in the PD, it will send an earlier alert notification through e-mail and Smart Messaging Service. The proposed system relieves the substation engineers from having to manually read the operation of substation types of equipment. In addition to providing security against supplemental faults and a robust design for data processing and storage, the PS provides smart operation, which transcends the traditional features and functionality of a classic circuit breaker. “HPM” and “DBSCAN” are used to find faults in the substation environment. “HPM” and “DBSCAN” are used to find outliers, which improves the accuracy of random classification.
In the future, the proposed “Smart Protection” environment for the PS will be integrated with the smart city infrastructure. As the entire smart city application is connected with the Internet through long-range comprehensive area network communication support, any faults will happen; the system will support fast coupling and decoupling of the power devices, thus ensuring the safety of the equipment and providing a UPS to the public.
Funding Statement: The authors are grateful to the Taif University Researchers Supporting Project Number (TURSP-2020/36), Taif University, Taif, Saudi Arabia.
Conflicts of Interest: The authors declare that they have no conflicts of interest to report regarding the present study.
References
1. M. A. Fabrício, F. H. Behrens and D. Bianchini, “Monitoring of industrial electrical equipment using IoT,” IEEE Latin America Transactions, vol. 18, no. 8, pp. 1425–1432, 2020. [Google Scholar]
2. H. Hadlach, H. Touijer, M. Zahri, M. El alami and M. Habibi, “Modeling of a smart grid monitoring system using power line communication,” in Int. Renewable and Sustainable Energy Conf., Tangier, Morocco, pp. 1–4, 2017. [Google Scholar]
3. M. Lazic, D. Petrovic, B. Plavsic, B. Jovanovic and Z. Kovacevic, “Centralized monitoring of the power electronics devices,” in 18th Int. Symp. Infoteh-Jahorina, East Sarajevo, Bosnia and Herzegovina, pp. 1–5, 2019. [Google Scholar]
4. S. Sudhakar and S. Chenthur Pandian, “An efficient agent-based intrusion detection system for detecting malicious nodes in MANET routing,” International Review on Computers and Software (I.RE.CO.S,), vol. 7, no. 6, pp. 3037–304, 2012. [Google Scholar]
5. S. Sudhakar and S. Chenthur Pandian, “Authorized node detection and accuracy in position-based information for MANET,” European Journal of Scientific Research, vol. 70, no. 2, pp. 253–265, 2012. [Google Scholar]
6. J. Liu, G. M. Huang, Z. Ma and Y. Geng, “A novel smart high-voltage circuit breaker for smart grid applications,” IEEE Transactions on Smart Grid, vol. 2, no. 2, pp. 254–264, 2011. [Google Scholar]
7. V. Sivaraman, H. H. Gharakheili, A. Vishwanath, R. Boreli and O. Mehani, “Network-level security and privacy control for smart-home IoT devices,” in IEEE 11th Int. Conf. on Wireless and Mobile Computing, Networking and Communications, Abu Dhabi, United Arab Emirates, pp. 163–167, 2015. [Google Scholar]
8. Ó. B. Novoa, T. M. F. Caramés, P. F. Lamas and L. Castedo, “An open-source IoT power outlet system for scheduling appliance operation intervals based on real-time electricity cost,” in IEEE Int. Conf. on Internet of Things and IEEE Green Computing and Communications and IEEE Cyber, Physical and Social Computing and IEEE Smart Data, Exeter, UK, pp. 917–924, 2017. [Google Scholar]
9. B. Mrazovac, M. Z. Bjelica, N. Teslic and I. Papp, “Towards ubiquitous smart outlets for safety and energetic efficiency of home electric appliances,” in IEEE Int. Conf. on Consumer Electronics-Berlin, Berlin, Germany, pp. 322–326, 2011. [Google Scholar]
10. S. Sankaranarayanan and A. T. Wan, “ABASH-Android based smart home monitoring using wireless sensors,” in IEEE Conf. on Clean Energy and Technology, Langkawi, Malaysia, pp. 494–499, 2013. [Google Scholar]
11. H. Ikegami, R. V. P. Yerra, P. Rajalakshmi and H. Esaki, “Real-time power capping with smart circuit breaker to maximize power utilization of local generator,” in IEEE 39th Annual Computer Software and Applications Conf., Taichung, Taiwan, pp. 505–510, 2015. [Google Scholar]
12. S. Sudhakar and S. Chenthur Pandian“ “Secure packet encryption and key exchange system in mobile ad hoc network,” Journal of Computer Science, vol. 8, no. 6, pp. 908–912, 2012. https://doi.org/10.3844/jcssp.2012.908.912. [Google Scholar]
13. S. Sudhakar and S. Chenthur Pandian, “Hybrid cluster-based geographical routing protocol to mitigate malicious nodes in mobile ad hoc network,” International Journal of Ad Hoc and Ubiquitous Computing, vol. 21, no. 4, pp. 224–236, 2016. [Google Scholar]
14. A. U. Priyadarshni and S. Sudhakar, “Cluster based certificate revocation by cluster head in mobile ad-hoc network,” International Journal of Applied Engineering Research, vol. 10, no. 20, pp. 16014–16018, 2015. [Google Scholar]
15. H. Radmanesh and A. Kavousi, “Aircraft electrical power distribution system protection using smart circuit breaker,” IEEE Aerospace and Electronic Systems Magazine, vol. 32, no. 1, pp. 30–40, 2017. [Google Scholar]
16. P. Khandare, S. A. Deokar and A. M. Dixit, “Advanced technique in microgrid protection for various fault by using numerical relay,” in 2nd Int. Conf. for Convergence in Technology, Mumbai, India, pp. 803–807, 2017. [Google Scholar]
17. S. Liu, B. Chen, T. Zourntos, D. Kundur and K. B. Purry, “A coordinated multi-switch attack for cascading failures in smart grid,” IEEE Transactions on Smart Grid, vol. 5, no. 3, pp. 1183–1195, 2014. [Google Scholar]
18. S. Sudhakar and S. Chenthur Pandian, “Investigation of attribute aided data aggregation over dynamic routing in wireless sensor,” Journal of Engineering Science and Technology, vol. 10, no. 11, pp. 1465–1476, 2015. [Google Scholar]
19. S. Sudhakar and S. Chenthur Pandian, “Trustworthy position based routing to mitigate against the malicious attacks to signifies secured data packet using geographic routing protocol in MANET,” WSEAS Transactions on Communications, vol. 12, no. 11, pp. 584–603, 2013. [Google Scholar]
20. S. Sudhakar and S. Chenthur Pandian, “A trust and co-operative nodes with affects of malicious attacks and measure the performance degradation on geographic aided routing in mobile ad hoc network,” Life Science Journal, vol. 10, no. 4 s, pp. 158–163, 2013. [Google Scholar]
21. F. Shah, Y. Liu, A. Anwar, Y. Shah and R. Alroobaea, “Machine learning: The backbone of intelligent trade credit-based systems,” Security and Communication Networks, vol. 2022, no. 7149902, pp. 1–10, 2022. [Google Scholar]
22. K. Z. Muhammad, N. Rashid, A. Aamir, H. U. Ijaz, H. Saddam et al., “An enhanced multifactor multi-objective approach for software modularization,” Mathematical Problems in Engineering, vol. 2022, no. 7960610, pp. 1–13, 2022. [Google Scholar]
23. A. Zahid, J. Rashid, N. A. Muhammad, A. Roobaea, A. M. Sabah et al., “Context-based emotion predictor: A decision-making framework for mobile data,” Mobile Information Systems, vol. 2022, no. 6488848, pp. 1–12, 2022. [Google Scholar]
Cite This Article
 Copyright © 2023 The Author(s). Published by Tech Science Press.
This work is licensed under a Creative Commons Attribution 4.0 International License , which permits unrestricted use, distribution, and reproduction in any medium, provided the original work is properly cited.
 Downloads
 Citation Tools