
 Submit a Paper
 Propose a Special lssue
 Open Access
ARTICLE

Non-Contact Physiological Measurement System for Wearing Masks During the Epidemic
Department of Information and Telecommunications Engineering, Ming Chuan University, No. 5 De Ming Rd., Gui Shan District, Taoyuan City, 333, Taiwan
* Corresponding Author: Shu-Yin Chiang. Email:
Computers, Materials & Continua 2023, 75(2), 2509-2526. https://doi.org/10.32604/cmc.2023.036466
Received 30 September 2022; Accepted 29 December 2022; Issue published 31 March 2023
 View Full Text
 Download PDF
Abstract
Physiological signals indicate a person’s physical and mental state at any given time. Accordingly, many studies extract physiological signals from the human body with non-contact methods, and most of them require facial feature points. However, under COVID-19, wearing a mask has become a must in many places, so how non-contact physiological information measurements can still be performed correctly even when a mask covers the facial information has become a focus of research. In this study, RGB and thermal infrared cameras were used to execute non-contact physiological information measurement systems for heart rate, blood pressure, respiratory rate, and forehead temperature for people wearing masks due to the pandemic. Using the green (G) minus red (R) signal in the RGB image, the region of interest (ROI) is established in the forehead and nose bridge regions. The photoplethysmography (PPG) waveforms of the two regions are obtained after the acquired PPG signal is subjected to the optical flow method, baseline drift calibration, normalization, and bandpass filtering. The relevant parameters in Deep Neural Networks (DNN) for the regression model can correctly predict the heartbeat and blood pressure. In addition, the temperature change in the ROI of the mask after thermal image processing and filtering can be used to correctly determine the number of breaths. Meanwhile, the thermal image can be used to read the temperature average of the ROI of the forehead, and the forehead temperature can be obtained smoothly. The experimental results show that the above-mentioned physiological signals of a subject can be obtained in 6-s images with the error for both heart rate and blood pressure within 2%~3% and the error of forehead temperature within ±0.5°C.Keywords
The COVID-19 pandemic has resulted in the tragedy of nearly 600 million people infected and 6.5 million deaths worldwide. With the constant mutation of the virus, how to prevent the pandemic and reduce the burden on the medical system is a topic worth researching. For medical staff, measuring heartrate (HR), blood pressure (BP), and body temperature are some of the primary daily tasks of healthcare workers. However, in this era of artificial intelligence, non-contact methods have gradually evolved for a number of physiological measurements, making use of instruments and equipment more than manpower. Many achievements have been published regarding non-contact physiological information measurement systems. For example, regarding non-contact body temperature measurement, Lin et al. [1] proposed using a thermal infrared camera to achieve a continuous body temperature measurement system through deep learning of face detection and object tracking technology. Chen et al. [2] proposed using Red-Green-Blue (RGB) images combined with thermal images for a dual-image system for temperature measurement or respiration calculation. Their method was to capture the facial interest points (Region of Interest, ROI), namely the nose and mouth, to analyze and calculate the change of the signal, including the breathing rate and the face angle to keep tracking the face. Jiang et al. [3] and Negishi et al. [4] demonstrated that in addition to measuring body temperature, whether or not screened patients are experiencing a respiratory infection or seasonal influenza can be detected through non-contact means. These studies are of great help to the current epidemic prevention work.
In the research on non-contact respiration measurement, Negishi et al. [4] and Sun et al. [5] proposed using a facial RGB image combined with a thermal image to measure human heartbeat, body temperature, and respiration rate at the same time. The primary method for this is to calculate the mouth and nose temperature changes obtained from the thermal image during exhalation and inhalation, and the respiratory signal data can be trained by artificial intelligence. The former study [4] proposed using the bidirectional gated recurrent unit and an attention mechanism (BiGRU-AT) network for training and identification, which can distinguish normal and abnormal breathing to detect respiratory infections.
In terms of non-contact HR measurement, Poh et al. [6] proposed using Independent Component Analysis (ICA) to decompose the facial ROI signal into three independent signals for processing based on RGB color and use the green signal G as the PhotoPlethysmoGraphy (PPG) signal to estimate the HR and use the ICA method to significantly reduce noise in the signal waveform. Lewandowska et al. [7] used Principal Component Analysis (PCA) combined with ICA in images to quickly measure heart rate. Monkaresi et al. [8] used general video images to estimate the heartbeat value by linear regression and K-Nearest Neighbor (KNN) machine learning. Fernandes et al. [9] proposed the introduction of HR measurement using LAB color facial videos. Since blood circulation causes changes in facial complexion, HR can be extracted from these changes.
In the research on non-contact BP measurement, the flow velocity of blood vessels is mainly calculated through PPG, and BP is derived from parameters such as the outer diameter of the blood vessel wall, the thickness of the blood vessel wall, and the blood density. The waveforms are measured at different positions of the same artery while blood flows through. Then, the BP can be obtained by calculating the pulse wave transit time divided by the length of the blood vessel between the two points [10–12]. Lewington [13] proposed to use Moens-Korteweg equation and Hughes equation to express the relationship between pulse wave propagation velocity and BP. Fan et al. [14] and Jeong et al. [15] proposed to use a high-speed camera to measure the imaging photoplethysmography (iPPG) signals of the face and the palm. After obtaining the pulse wave propagation rate, the relative parameters were obtained through the actual tester’s BP and the iPPG linear regression (linear regression). Applying linear regression, BP can be obtained from the image alone. Gonzalez Viejo et al. [16] proposed to measure HR with the PPG technique by using the difference between the luminance changes of three facial regions (forehead and cheeks) on different RGB color channels. They used raw video analysis to build models for predicting HR and BP that were trained by machine learning. Zou et al. [17] proposed using iPPG to obtain the pulse wave signal transit time of the forehead and hand with an ordinary optical camera. Then, the relationship between the actual BP value and the pulse wave transit time is obtained through the neural network fitting to obtain the non-contact BP measurement prediction model. Rong et al. [18] proposed a non-contact BP measurement system based on iPPG. The system captures facial video through a camera under ambient light. It uses iPPG technology to extract pulse wave signals from the video to predict BP by support vector regression (SVR).
The related research of Dharanesh et al. [19] used for mask recognition includes the Local Binary Pattern (LBP), Histogram of Oriented Gradients (HOG), Local Directional Order Pattern (LDOP), support vector machine (SVM) and other methods, and then whether the screened person is wearing a mask can be detected through the deep learning dynamic model. Deng et al. [20] used the key features of the detected face and the covered position for face mask recognition. Nagrath et al. [21] proposed using deep learning, TensorFlow, Keras, and OpenCV to detect masks. Karasugi etal. [22] and Feng et al. [23] proposed a mask-enhanced facial recognition system. Using different loss functions in deep learning, mask recognition and facial recognition under the mask can be achieved.
Under COVID-19 restrictions, wearing a mask has been necessary in many public places. Therefore, the primary purpose of this research is to investigate whether facial information can be measured by the previously proposed non-contact physiological information measurement when the mask hides the facial information and whether the obtained results are correct. This paper provides three main contributions: one is that the method can obtain the physiological measurement when the subject is wearing a face mask; another is that it requires only 6 s of video to predict the subject’s HR and BP; the other is that RR and forehead temperature are also obtained. The remainder of this paper is structured as follows: The materials and methods are described in Section 2, and the experimental results and conclusion are presented in Sections 3 and 4, respectively.
The hardware devices used in this study are the Intel RealSense L515 Lidar depth camera and FLIR Lepton 3.5 thermal infrared camera, as shown in Figs. 1a and 1b. These two cameras are installed on the head of a robot to enable angle adjustment by the motors on the robot’s head, M1 and M2; the front and side views are shown in Figs. 1c and 1d. The Intel RealSense L515 retrieves RGB color images and depth images, both with a resolution of 640 × 480 and a sampling frequency of 30 frames per second. The depth distance of Intel RealSense L515 is from 0.25 to 9 m, and the distance between the subject’s face and the camera can be obtained by using depth information, which is kept within 40–60 cm in this research. The FLIR Lepton 3.5 has a resolution of 160 × 120 and obtains thermal images with a frame rate of 9 Hz via a USB interface.
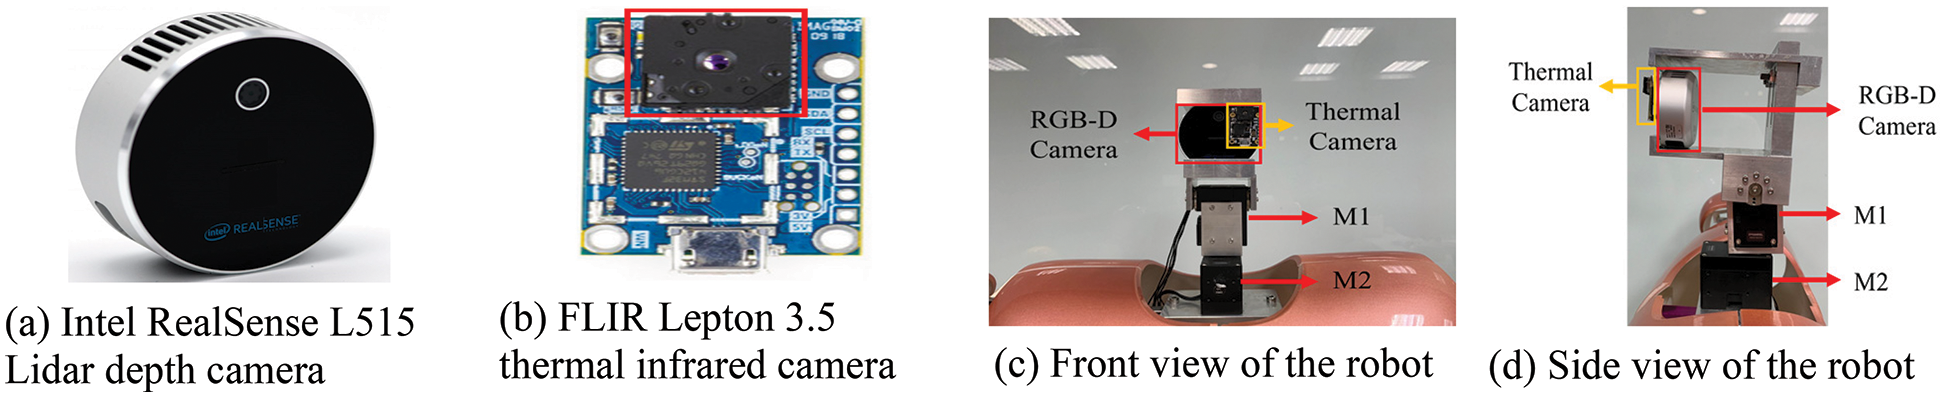
Figure 1: RGB-D camera, thermal infrared camera and their mountings on a robot
The system flow chart is shown in Fig. 2, and it includes the ROI selection, RGB and thermal image matching, PPG signal and thermal signal processing, baseline drift calibration, normalization, bandpass filtering, and finally, calculation of HR, forehead temperature, respiratory rate (RR), and deep neural networks (DNN) prediction of BP.
Figure 2: System flow chart
When the general facial information is sufficient, Dlib facial feature points can be used for identification. However, when a subject is wearing a mask, a part of the face is obscured, and the Dlib facial feature points cannot accurately identify the facial feature points, as shown in Fig. 3a. In order to perform non-contact physiological information measurement, it is necessary to be able to identify the features of the human face. Therefore, this research uses the facial feature points of OpenPose, and it is found that the facial feature points are accurate even with a mask in Fig. 3b.
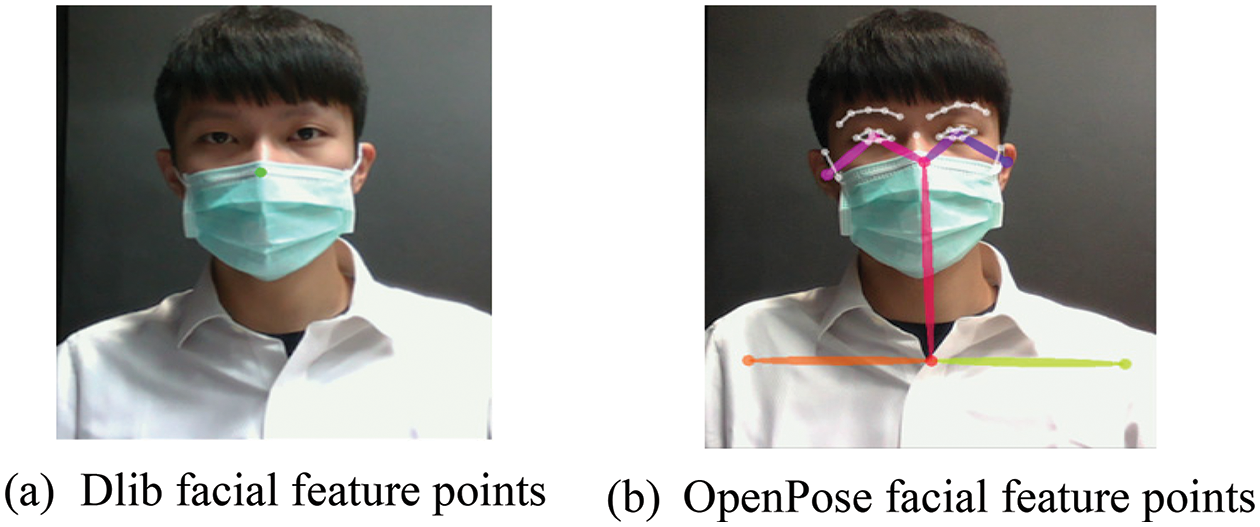
Figure 3: Facial feature points under a mask
Wearing a mask, the subjects only reveal the forehead and the bridge of the nose. Therefore, the feature points of the forehead and the bridge of the nose are used to obtain the points of interest from the image. Define the feature point P(X27, Y27) on the bridge of the nose as the x-coordinate of the forehead, that is, FX = X27 in (1). Take the coordinates of the middle point between the right eyebrow feature point P(X21, Y21) and the left eyebrow feature point P(X22, Y22), calculate the height difference between this coordinate and the feature point 27, and define it as Ydis in (2). Extend Ydis up from the nose bridge point P27 by 1.5 times the height, which is the forehead Y coordinate FY in (3). Then take the forehead coordinates (FX, FY) as the center and take the coordinates (XFT, YFT) to the coordinates (XFD, YFD) as the forehead image sampling range. Fw and Fh represent the width and height of the forehead ROI in (4) and (5), respectively. There are two ROI sizes, 30 × 30 and 40 × 40, respectively. The sampling range of the forehead is shown in Fig. 4.
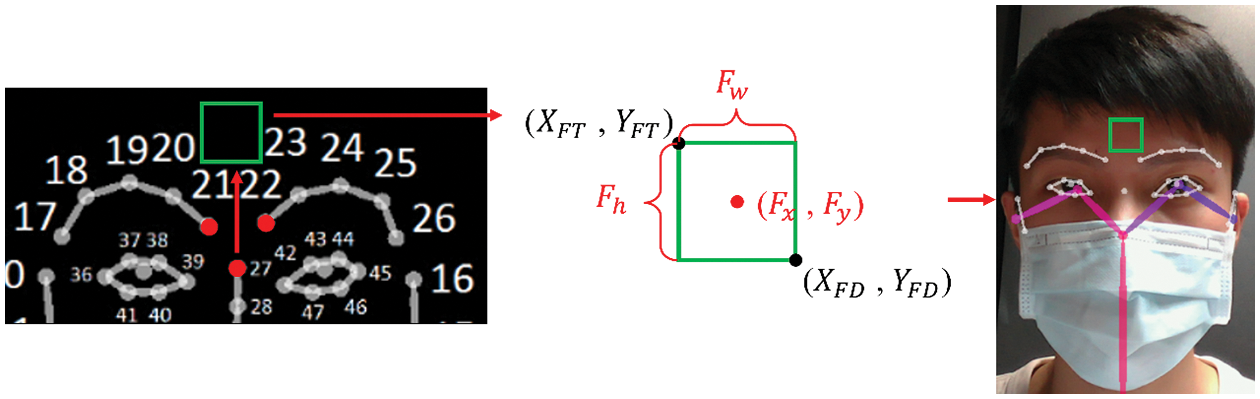
Figure 4: OpenPose-forehead ROI sampling range
Next, the sampling range of the bridge of the nose is shown in Fig. 5. The central coordinates (NX, NY) are obtained directly based on the feature point P(X27, Y27) on the bridge of the nose. Nw in (6) represents the width of the ROI, and Nh in (7) represents the height of the ROI, resulting in 30 × 30 or 40 × 40. Numerical extraction and measurement calculations are performed with ROIs of two sizes.
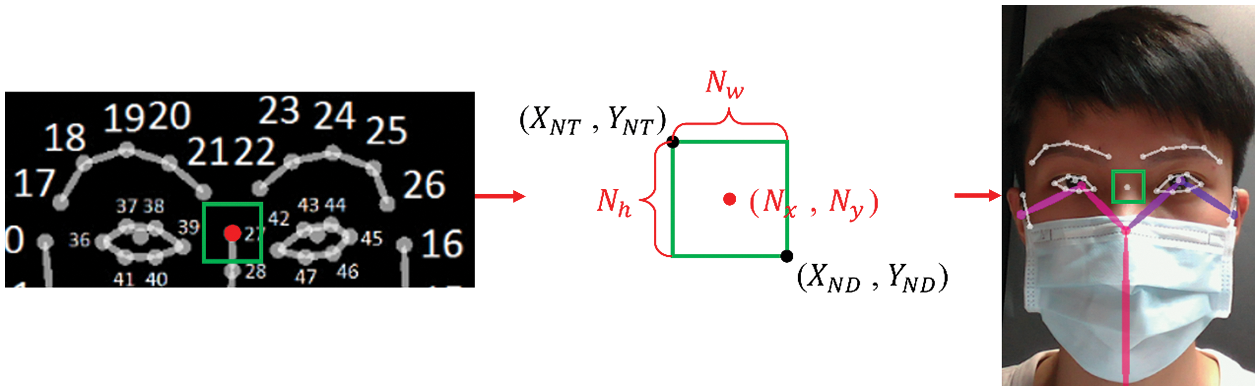
Figure 5: OpenPose-the bridge of the nose ROI sampling range
To measure the number of breaths while wearing a mask, the required mask ROI is shown in Fig. 6. The X distance between the right cheek coordinate P(X0, Y0) and the left cheek coordinate P(X16, Y16) is used as the ROI width, such as Tw in Eq. (8). When taking the height of the ROI, since the mask covers all the feature points below the cheek, the Y distance between P(X0, Y0) and P(X1, Y1) of the right cheek is multiplied by 2.5 times obtained from the experiment to be the height of the ROI, as shown in the formula Th in (9). The pixel changes during the breathing process can be effectively intercepted and combined with the ROI area's size, derived by timing ROI’s length and width; the average gray-scale pixel intensity in the ROI is calculated as the basis for judging the height of the breathing curve.
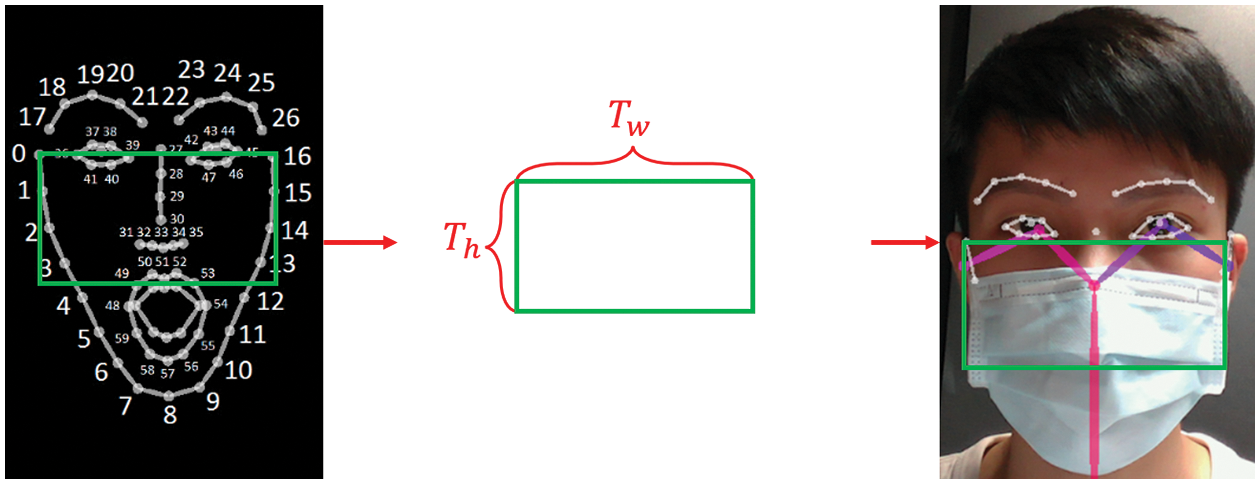
Figure 6: OpenPose-the ROI width and length
2.2 Image Affine Transformation
Due to the spatial deviation of the two cameras for the color image and the thermal image, as shown in Figs. 7a and 7b, the RGB and thermal image positions do not overlap. Therefore, the affine transformation is used to detect the face position in the RGBD depth image, and it is applied to infrared thermal imaging as a reference position benchmark. In Eq. (10), (x, y) are the coordinates of the detected face position in the original image, (x′, y′) are the coordinates of thermal imaging, b0 and b1 are the offset, with b0 along the X coordinate. The direction is translated, and b1 is translated along the coordinate Y direction to generate (x′, y′). Among them, a00 and a11 are 1, a01 and a10 are 0, which are expressed in matrix form, such as Eq. (11). Using the translation variable between the two images to adjust b0 and b1, the color image and thermal image overlap is obtained. The result of the thermal image after the affine transform is shown in Fig. 7c.
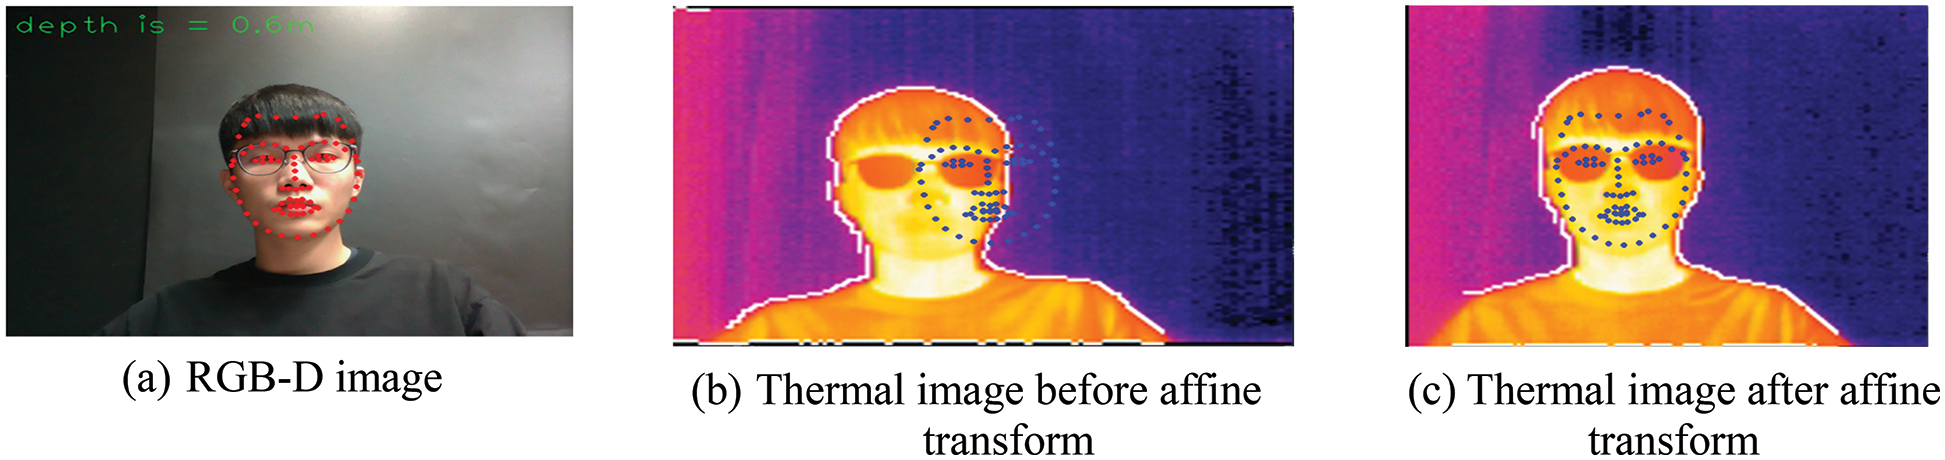
Figure 7: RGB-D depth map and thermal imaging spatial deviation
Before the PPG signal is obtained from the image, a motion artifact is caused by the slight shaking of the human body due to breathing or other physiological reactions during the shooting process. Using the Lucas–Kanade optical flow method [24], the displacement relationship between the position of the subsequent ROI and the first frame is calculated, and a new feature point position is obtained, thereby eliminating motion artifacts caused by shaking and the subsequent PPG signal processing can be performed stably. The non-contact signal measurement method uses the PPG signal, which can be used as a reference index to measure HR and BP through the fluctuation of the signal and the light and shadow changes of the blood volume in the arteries, which can be synchronized with the HR. The ROI image is divided into R, G, and B channels for analysis. According to the better absorption rate of green light by hemoglobin in the skin and blood, PPG is estimated by analyzing the green signal (G method). This method is currently more popular, and the process is relatively simple, so most of the current research uses this method. However, this study uses the difference between green and red signals (G-R). The human body is less likely to absorb red and blue light, so the green signal carries the most significant amount of pulsatile information. In contrast, the red signal contains more motion artifacts, interference, and less blood-related information. Therefore, after subtracting the red signal from the green signal, the better signal is retained, which can better reflect the changes in the vasoconstriction of the human body. Therefore, this study uses the G-R method as our scheme to analyze the continuous variation of the photo volume signal. In Eq. (12), G and R represent the green and red signals of the current pixel, respectively, and k represents the ROI at each frame. The ROI pixels for the signal of the G-R channel are averaged, as shown in Eq. (13), Im. Moreover, according to the time series, a waveform composed of average pixel values is obtained. In this research, the ROI of 6 s and 30 frames per second is sampled, and the ROI of two areas of the forehead and the nose bridge are used under the condition of wearing a mask; the G-R average PPG for the forehead and the nose bridge are shown in Fig. 8.
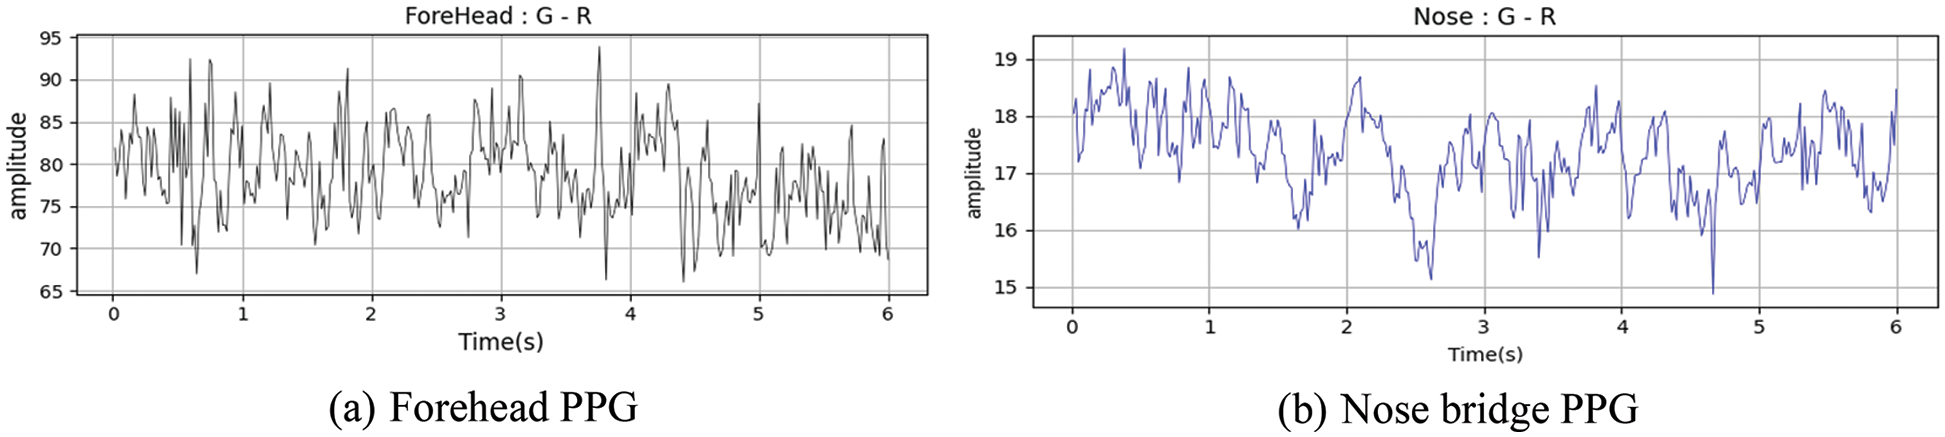
Figure 8: Forehead and nose bridge PPG
In this study, the PPG values of both cheeks and forehead are first taken as a unit of 2 s. A total of 6 s of images are divided into three parts. The values are detrended according to a linear relationship to perform baseline drift, as shown in Fig. 9. Since the signal values of the forehead and the nose bridge are different in magnitude, the data of the G-R method are normalized to keep the two values in a relatively similar range. The normalized results of cheeks and forehead are shown in Fig. 10. The value in the PPG signal also includes various noises. The image is affected by the indoor light source, and the signal of about 60 Hz generated by the light source is also included, as shown in the red box in Fig.11a. Therefore, the frequency band of HR is maintained at about 0.7~5 Hz, and unnecessary signals are filtered out by bandpass filtering. The filtered PPG frequency is shown in Fig.11b, and the bandpass filtering result of the forehead and nose bridge waveforms follows in Fig. 12.
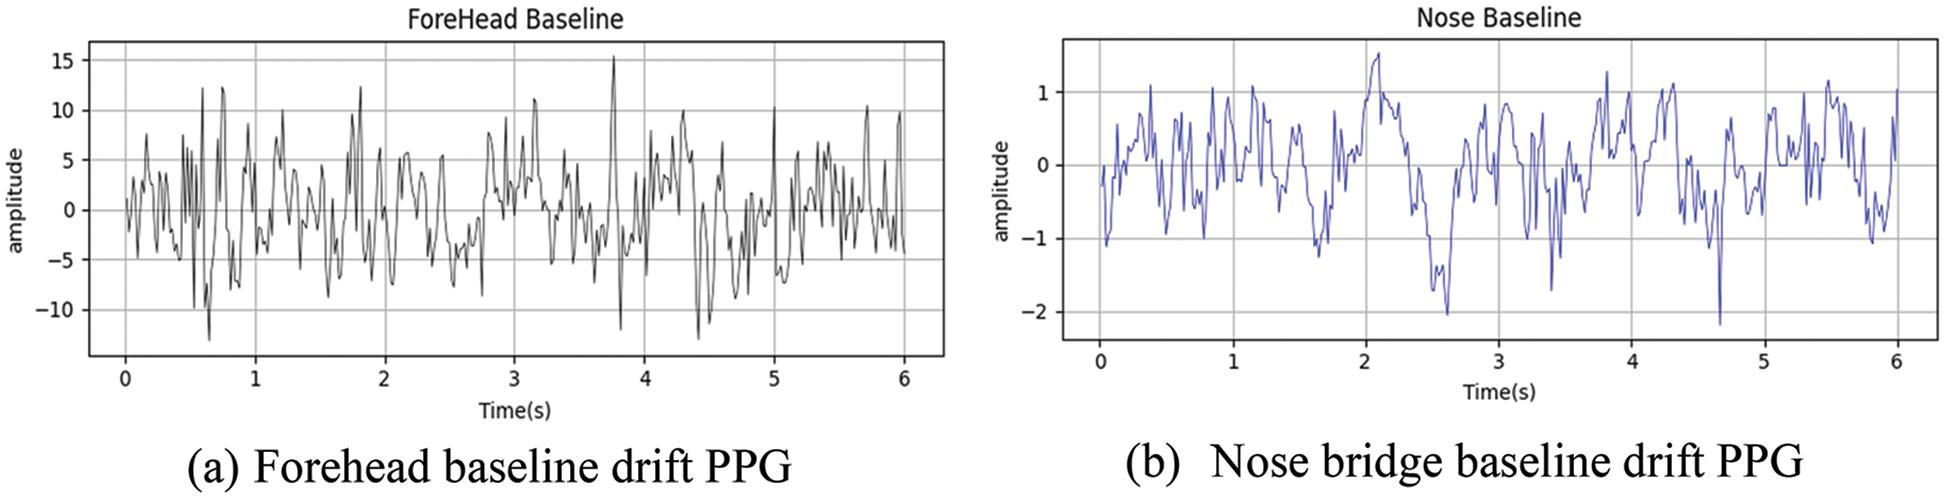
Figure 9: Baseline drift calibration of forehead and nose bridge PPG
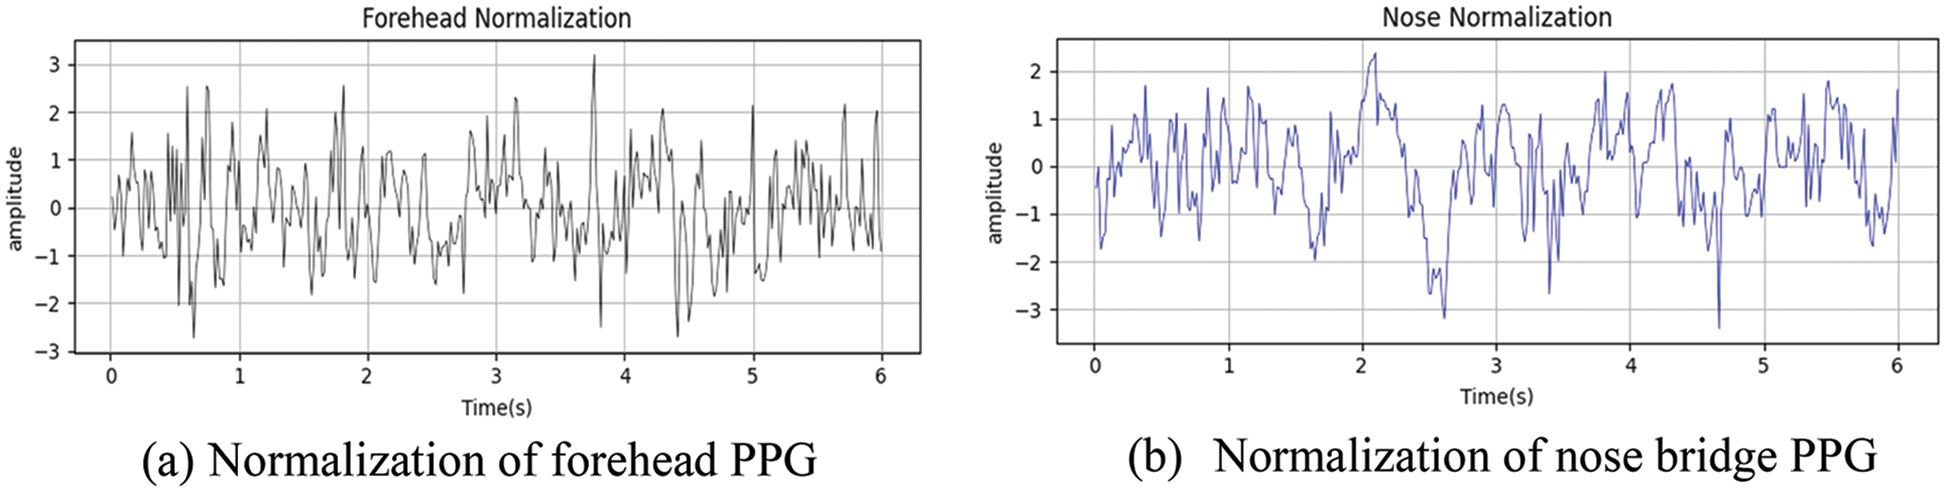
Figure 10: Normalization of forehead and nose bridge PPG
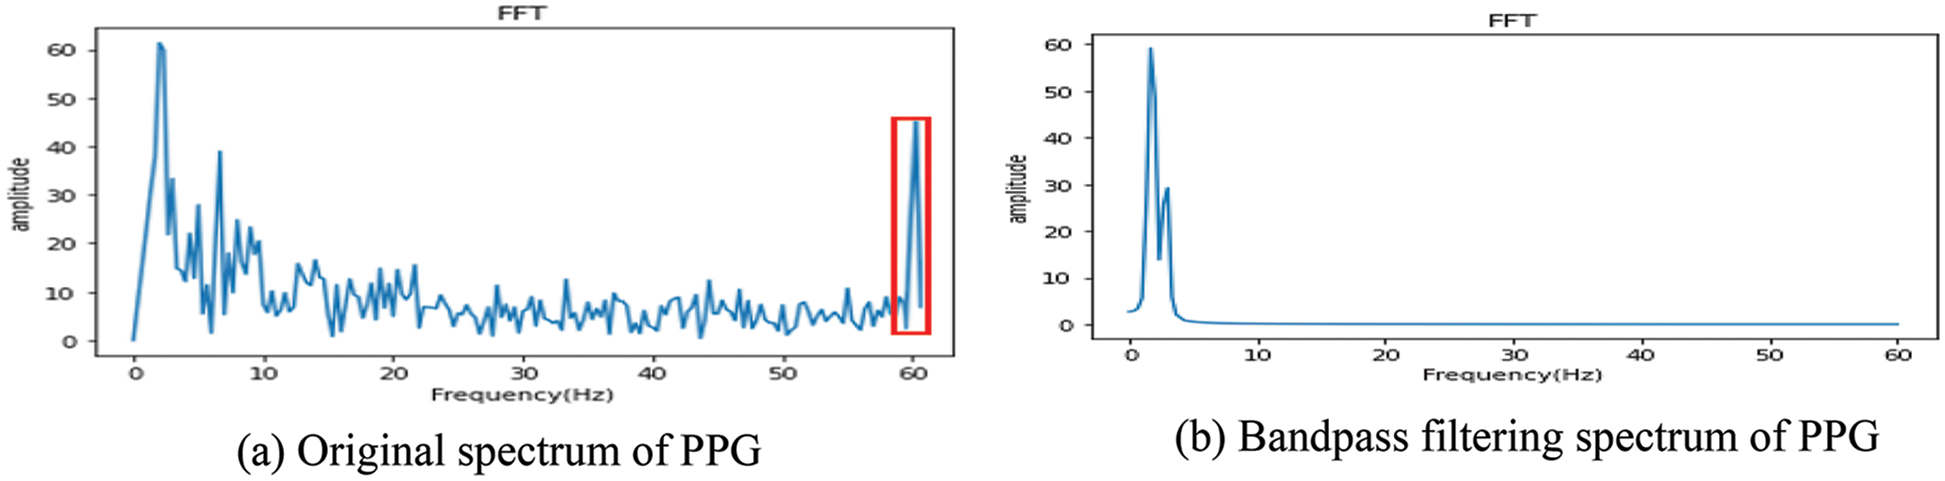
Figure 11: Spectrum of PPG

Figure 12: Bandpass filtering of forehead and nose bridge PPG
To predict HR, the interval between the peaks of the waveform (peak-to-peak interval, PPI), shown in Fig. 13, is used. The average value of PPI, PPIm, is obtained using Eq. (14), and the reciprocal of the average value PPIm multiplied by 60 is used as the HR in Eq. (15).
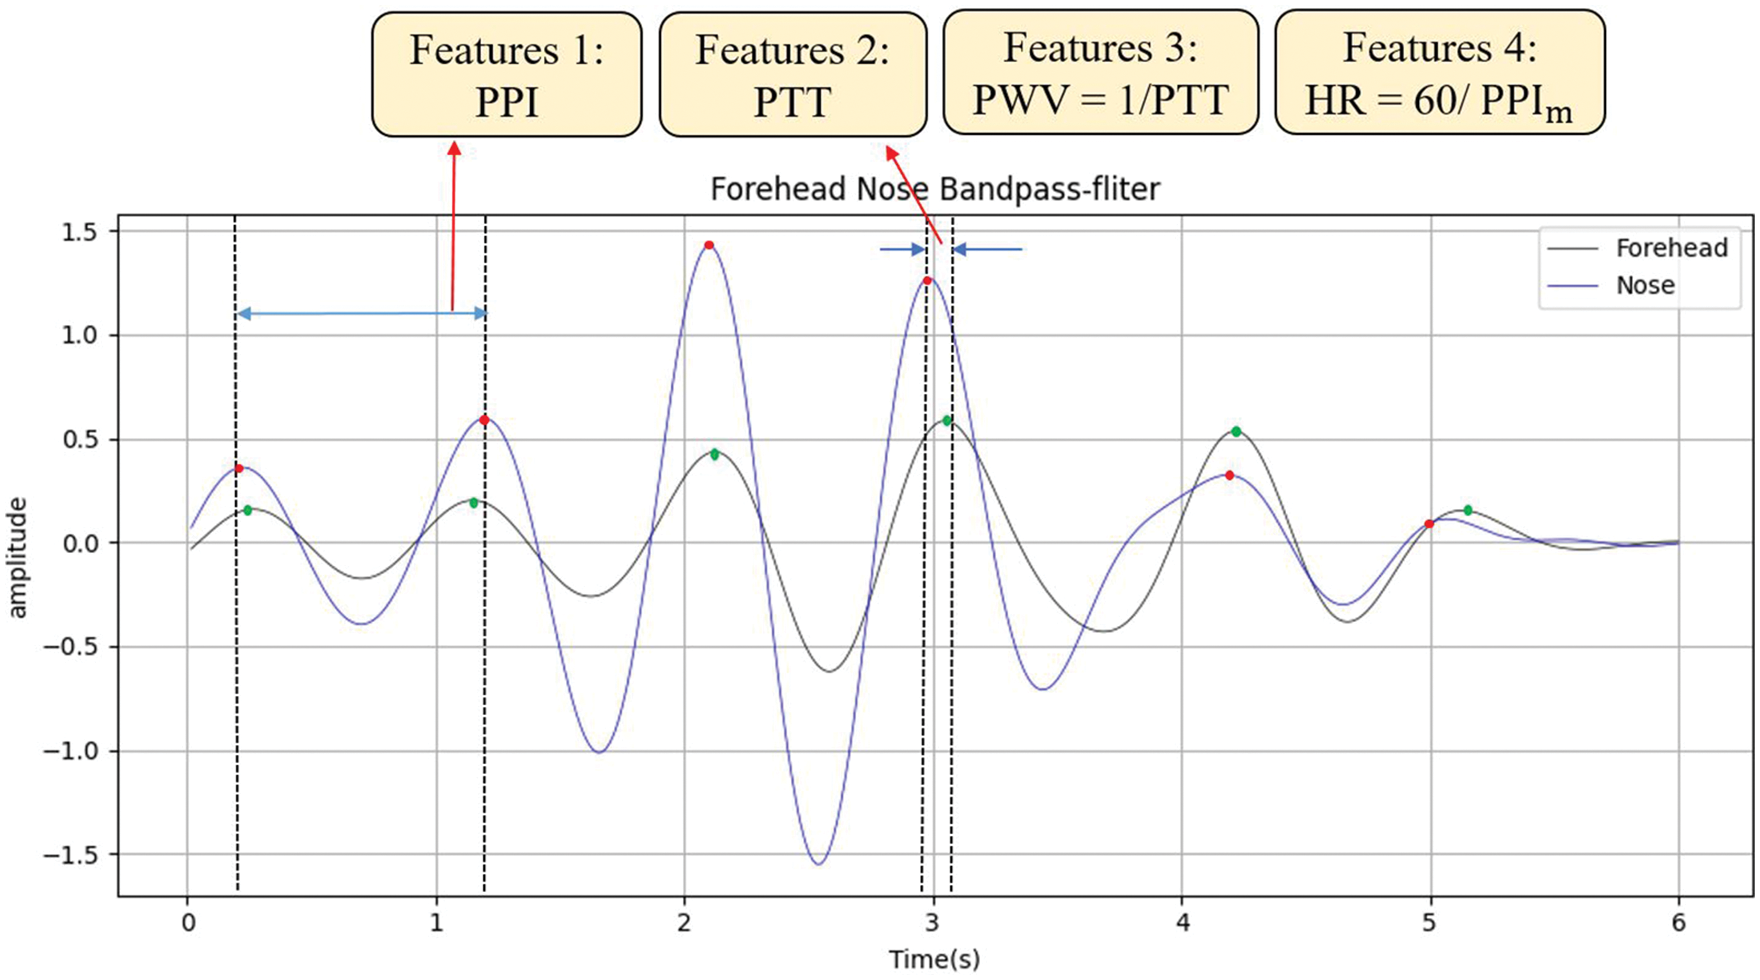
Figure 13: Four features of DNN structure for heart rate prediction
In the 6-s image, the times of all peaks of the forehead and the bridge of the nose after bandpass filtering is recorded first, and PTTpf (i) represents the time of the i-th peak of the forehead (Pulse Transit Time, PTT) and PTTpn (i) is the time of the i-th peak of the nose bridge. In Fig. 13, the red dots represent the forehead, and the green dots represent the nose bridge. Then the nose bridge peak time PTTpn (i) is subtracted from the forehead peak time PTTpf (i) for the same number of times and the absolute value is taken as PTT (i) in Eq. (16). By summing all PTT (i) in 6 s and taking the average value (assuming n peaks in PPG signal), the PTTm average value of PTT (i) in the 6-s image is obtained in Eq. (17), where m indicates the mean.
In this research, the deep neural network (DNN) model is used. Four features, such as PPI, PTT, pulse wave velocity (PWV), which is the reciprocal of PTT, and HR calculated by PPI in Eq. (15), are applied as training parameters in Fig. 13. The systolic and diastolic BP measured by the arm blood pressure machine is marked as the target value. The overall DNN architecture has four neuron input layers, the output is composed of two dense layers, where each layer has 64 neuron outputs, and finally, one neuron is output as the predicted BP value, as shown in Fig. 14. The outputs of the hidden layer nodes that typically go through the training model are equipped with a nonlinear activation function Rectified Linear Units (ReLU; f(x) = max (0, x)), while the output layer tends to be linear. The optimizer is Root Mean Square Prop (RMSprop), and the loss function is Mean-Square Error (MSE).
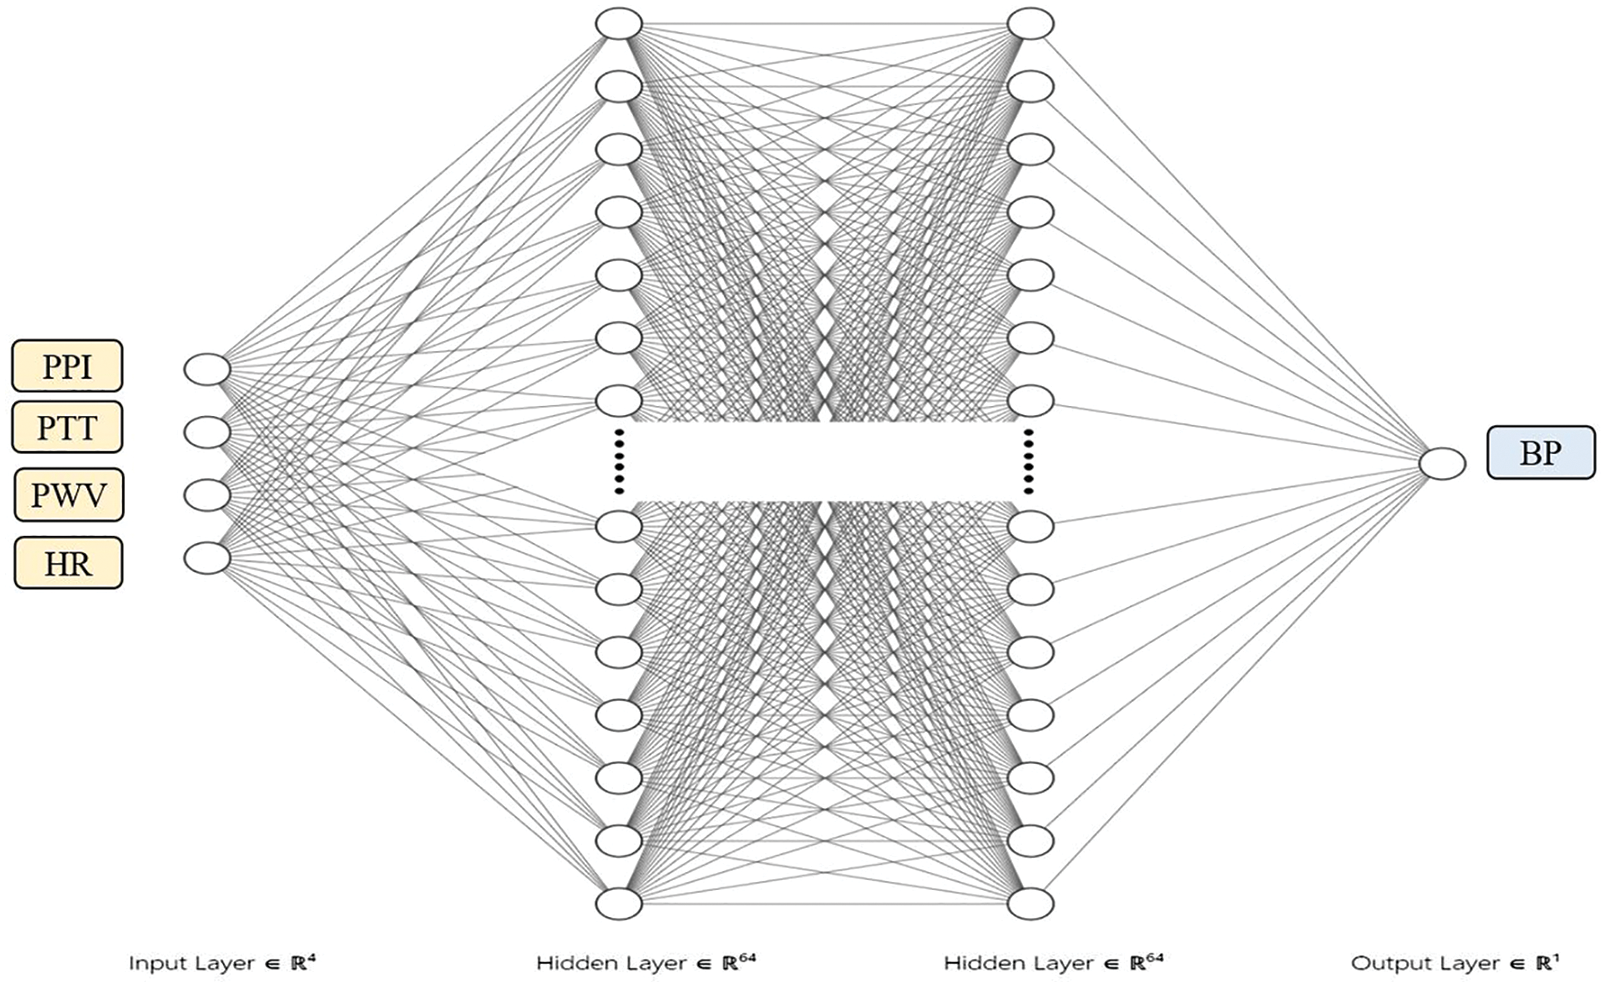
Figure 14: DNN structure for blood pressure prediction
From the thermal image, it can be found that the temperature display of the mask will change with breathing, as shown in Fig. 15. Fig. 15a is an RGB image, and Fig. 15b is an inhalation state. It can be found that while inhaling gas, the temperature inside the mask drops, so the temperature color rendering of the mask position is cool (low temperature). Fig. 15c shows the exhalation state; in contrast, exhaling air raises the mask’s temperature, so the temperature rendering of the mask position is warm (high temperature). Therefore, it is possible to identify the exhalation or inhalation state by detecting the current gray pixel value change and using a waveform diagram. In this study, the forehead temperature measurement used the internal temperature radiation value of the Lepton 3.5 infrared thermal camera as a parameter. K(x, y) is the temperature obtained from the SDK function LEP_GetSysFpa Temperature Kelvin() provided by Lepton; with 100 as the unit; directly dividing by 100 can yield the Kelvin temperature value of the coordinate pixel. Then the Kelvin temperature is converted to Celsius to obtain the value of each pixel as shown in Eq. (18). The temperature values of each interest point are averaged to obtain the temperature of the forehead ROI in Fig. 4 as the measurement position in Eq. (19). In the case of wearing a mask, the waveform generated by the average fluctuation of gray pixels generated by inhalation and exhalation, as shown in Figs. 15b and 15c, is filtered by bandpass filtering to filter out signals higher than 0.6 Hz and lower than0.15 Hz. In conjunction with the thermal image recording, the number of inhalations and exhalations are calculated by the subject pressing a button, and the button time is displayed on the filtered waveform to accurately measure and confirm the measurement of the number of breaths while the subject is wearing a mask.
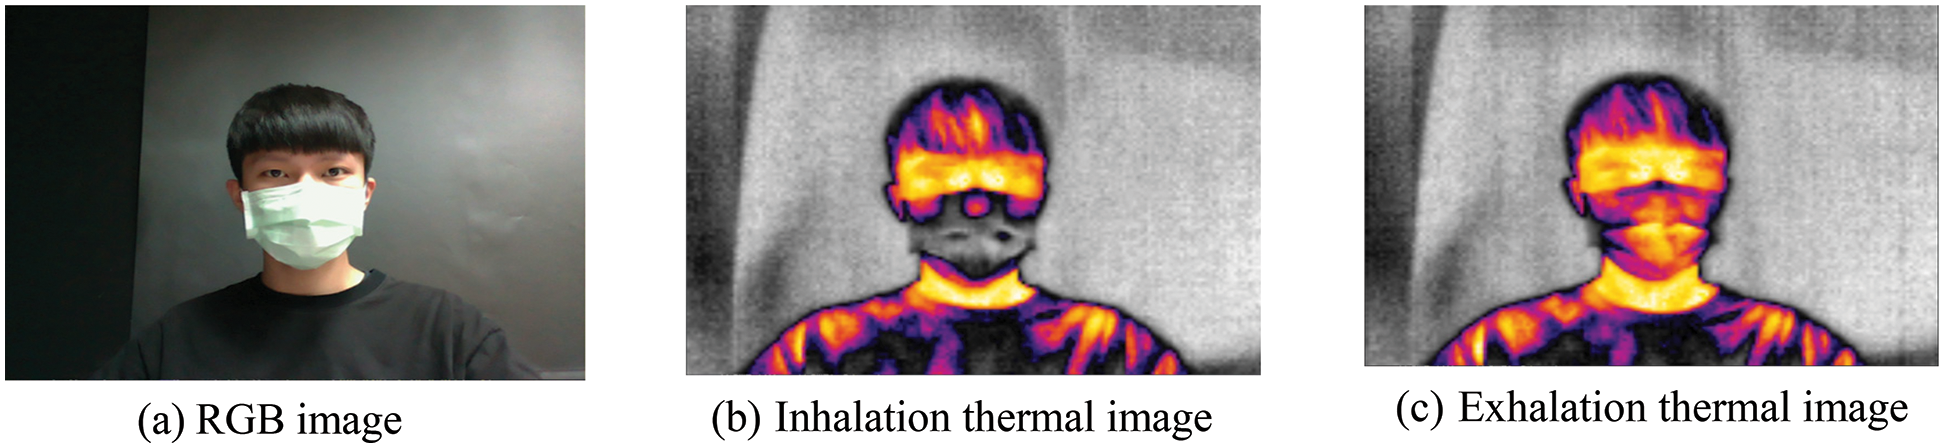
Figure 15: Schematic diagram of wearing a mask and breathing
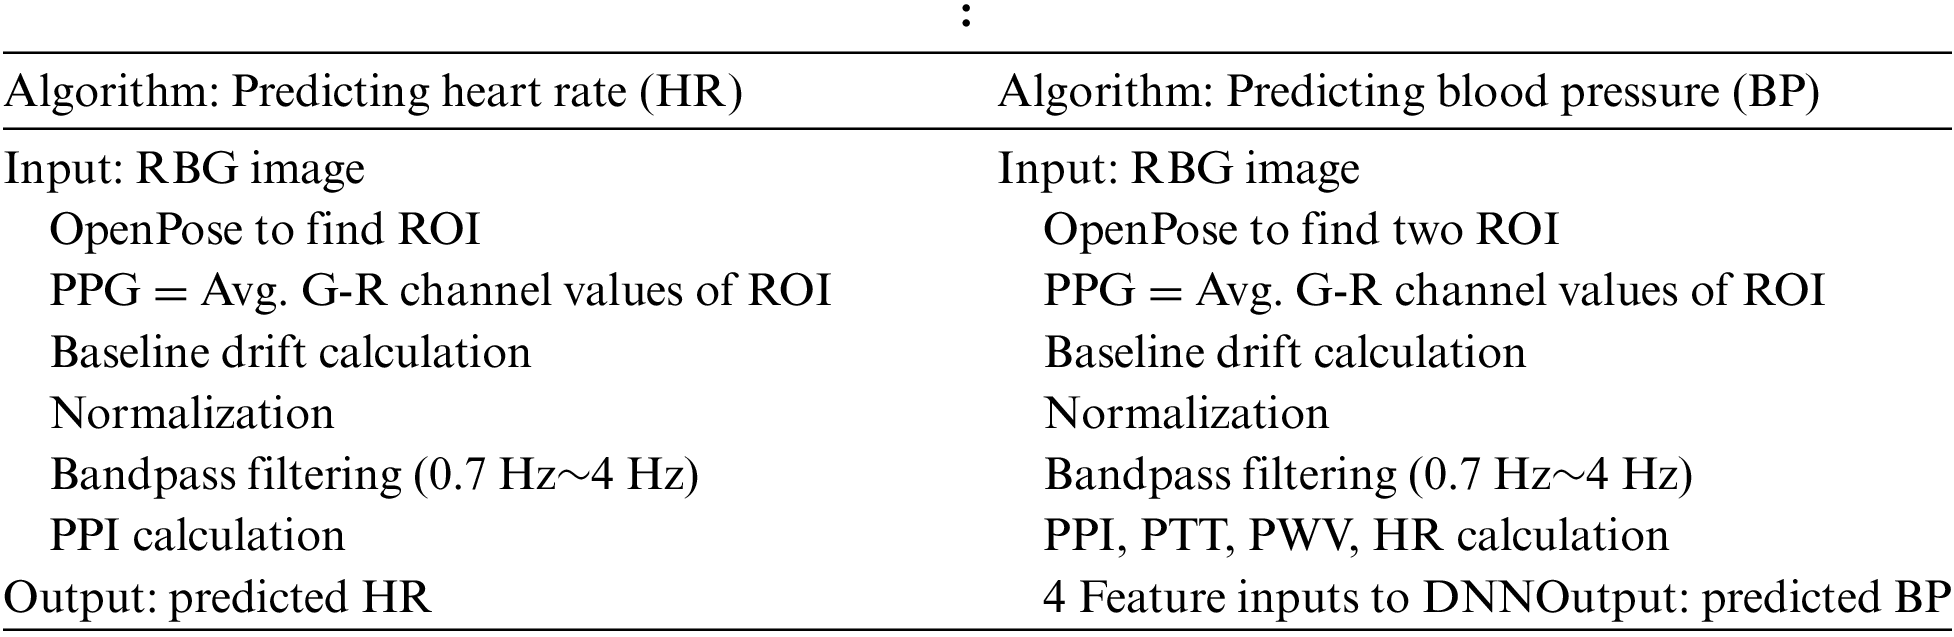
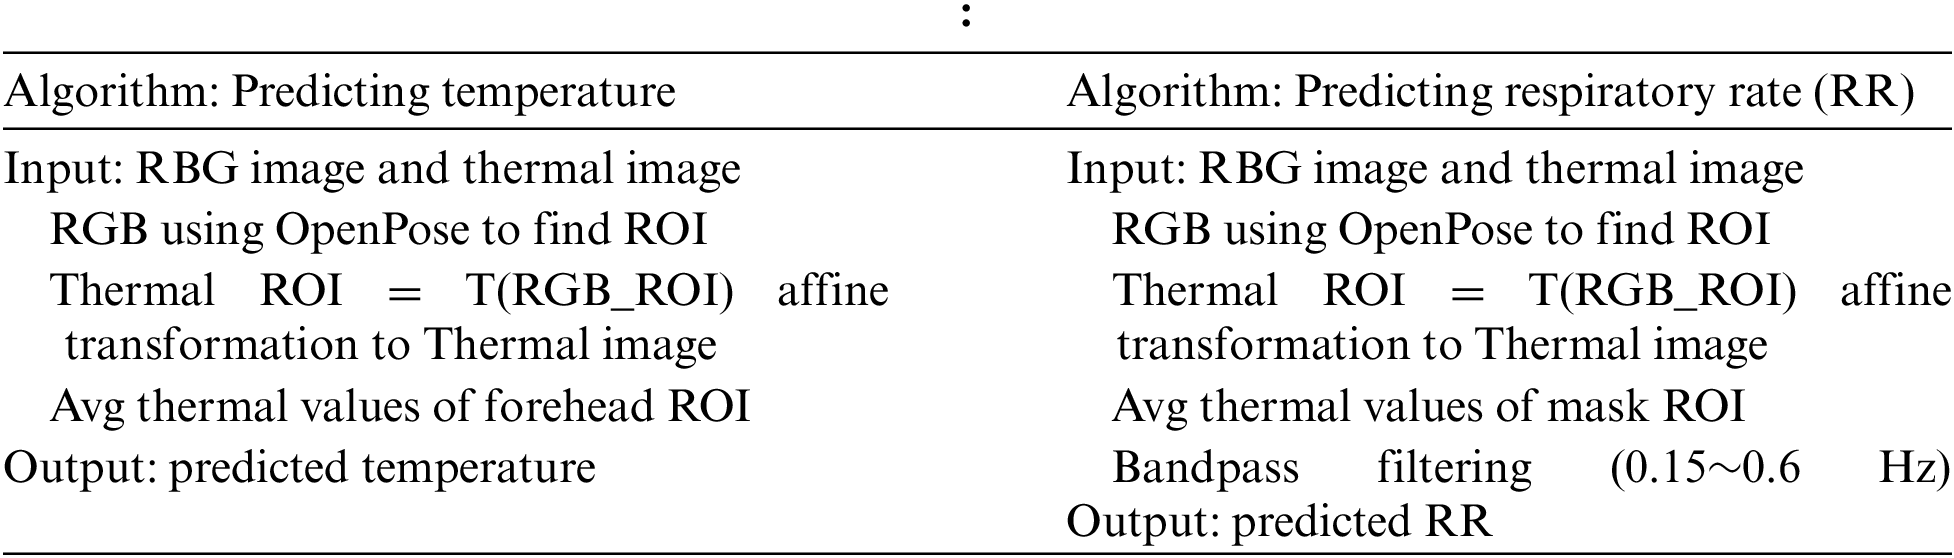
Finally, the algorithms for predicting the HR, BP, forehead temperature, and RR of the subject are summarized as follows:
An arm blood pressure machine is used to measure the actual HR and BP at the same time as imaging is captured in this study. The ROI positions are the forehead and nose bridge determined by OpenPose, the G method and G-R method of PPG are used as a comparison, and the ROI size starts at 30 × 30. The difference from ROI size as 40 × 40 is observed to see if the change in the ROI size affects the numerical results. The measurements are carried out at two different distances: 40 and 60 cm. Finally, the error values are calculated.
The actual BP and HR measurement in the experiment is performed using an OMRON HEM-7121 arm blood pressure monitor, with accuracy of pressure at ±3 mmHg, and ±5% of the pulse reading. First, for ten subjects wearing masks positioned at a distance of about 40 and 60 cm, the image of their forehead and the bridge of the nose are measured respectively as the ROI to calculate the PPG signal by the G-R method. The actual results of measurement are compared with the HR predicted by the PPG in the percentage of error. The HR error statistics of different measurement distances for mask-wearing subjects with different ROI sizes and different PPG signals are listed in Table 1, where Error is the mean of error and STD is the abbreviation of standard deviation. It can be found from Table 1 that the G-R method has a smaller error than G method [25] in both sizes of ROI and different distances. These results prove that including the signal from the difference between G and R channels, which is applied in this research, enhances the prediction ability. In addition, it can be observed that the G-R method has the least error in the ROI 40 x 40 with a distance of40 cm. Therefore, it can be concluded that the closer the distance, the larger the ROI area, or using the forehead instead of the bridge of the nose can provide a better prediction of HR. The error percentage increases slightly when the ROI area becomes smaller or the distance becomes farther. All the STDs show the robustness of each measurement.

In this section, PPI, PTT, PWV, and HR are used to predict BP with different ROI sizes using the G-R method while the subjects were wearing masks and at distances of 40 and 60 cm. The actual systolic blood pressure (SBP) and diastolic blood pressure (DBP) are obtained using the BP machine, and the percentage error and standard deviation are shown in Table 2. When the subject wears a mask, the G-R method is used for different ROI sizes at a distance of 40 cm. The DNN model incorporates four features of PPI, PTT, PWV, and the HR obtained from PPI into the training. The SBP and DPB measured by an arm BP machine are used for labeling training. In this work, 100 data samples are used, and the samples are divided into 90% training samples and 10% test samples. During training, the validation_split function is applied; 10% of the test samples are used as verification data, and the training period is set to 200 epochs; the batch size is five. The accuracy and loss of both training and validation are shown in Figs. 16a and 16b, respectively. The accuracy of validation is about 0.95, and the loss of validation is 0.10. The predicted results of SBP and DBP with different ROI sizes at different distances are shown in Table 2. It can be concluded that the G-R method provides a better prediction ability than the G method [25] and the linear regression method [14] mentioned above. Additionally, the outcomes show that using 4 features instead of 3 or the closer the distance can enhance prediction accuracy.

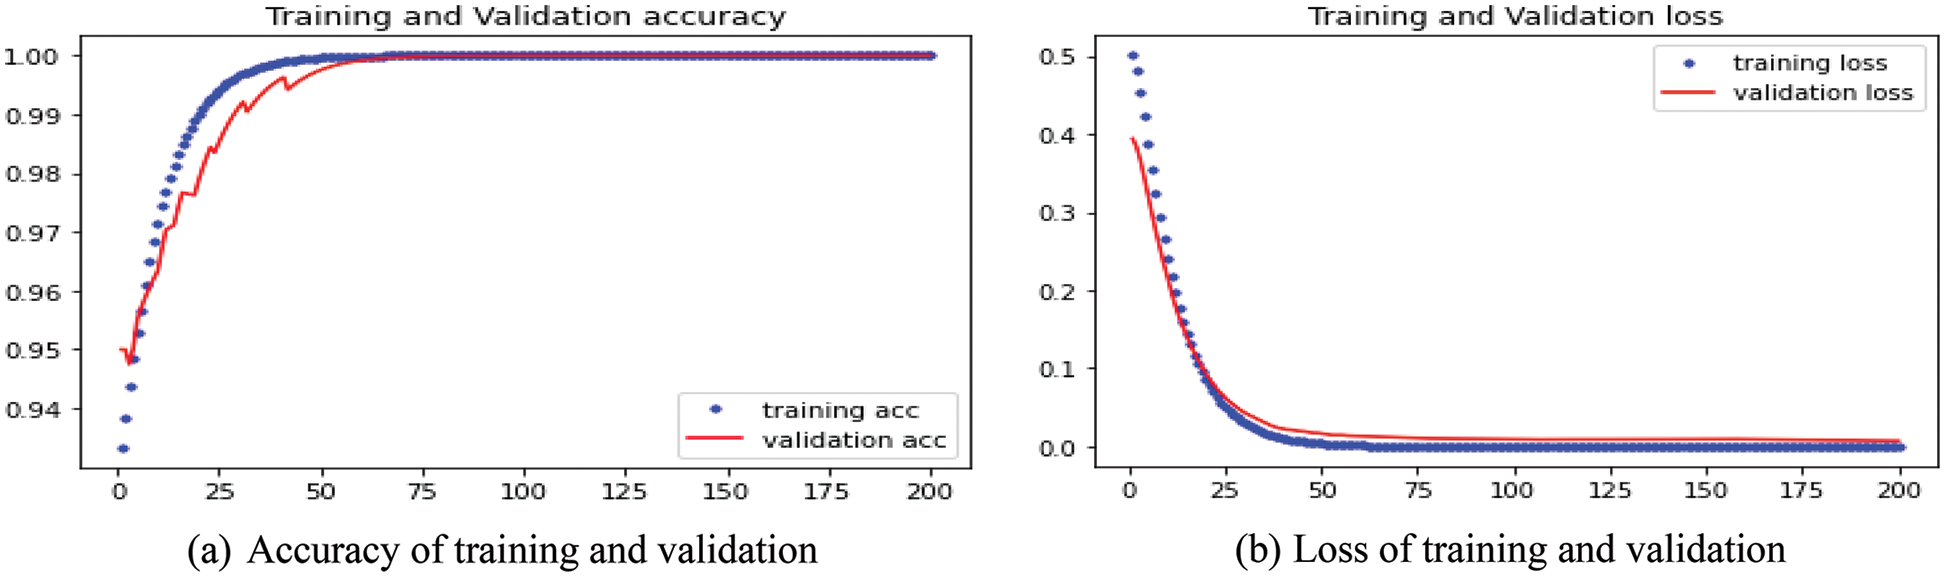
Figure 16: Accuracy and loss of training and validation for DNN BP prediction
3.3 Exhalation and Inhalation Calculation
In this study, the facial feature points are first captured through OpenPose while the subject is wearing a mask. After matching the RGB-D image with the thermal image, the nose ROI is recorded and processed for breathing signals. The forehead ROI is used to calculate the forehead temperature. At the same time, the number of breaths and time of respiration are calculated by the subject pressing the button and displaying the processed waveform, which proves that the number and time point calculated by the waveform can correctly correspond to the actual number of breaths and time of respiration. Thus, this method is proven as an effective non-contact measurement of RR.
In this section, the gray pixel average value of the mask ROI is used to record the waveform results formed by nine frames per second for 60 s. The waveform downward indicates an inhalation state, where the air is inhaled into the nasal cavity, decreasing the mask’s temperature and reducing the average pixel value. On the contrary, the upward waveform indicates the exhalation state, where air exhaled out of the nasal cavity raises the temperature in the mask and the average pixel value increases. Through this rule, the waveform in the 60 s is analyzed, and it is determined that a breath is completed when the waveform finishes a complete peak and trough after bandpass filtering.
An original signal is shown in Fig. 17a, and that after bandpass filtering is shown in Fig. 17b. The actual execution result and the number of key calculations are shown in Fig. 18. After bandpass filtering, there are 13 complete waves calculated, which means that 13 breaths are taken in 60 s. Through the number and time points calculated by the press of the button, it can be found that the time points triggered by the button are all before the peaks or troughs of the waves, which proves that the measurement of RR by image corresponds to the manual measurement done by pressing the button. Finally, after the statistics of inhalation (red dot) and exhalation (green dot), the number of completed breaths is also 13 times. Meanwhile, forehead temperature was measured by the forehead ROI measurement in the thermal image, which is 36.4°C.

Figure 17: Respiratory signal waveform when wearing a mask at a distance of 40 cm
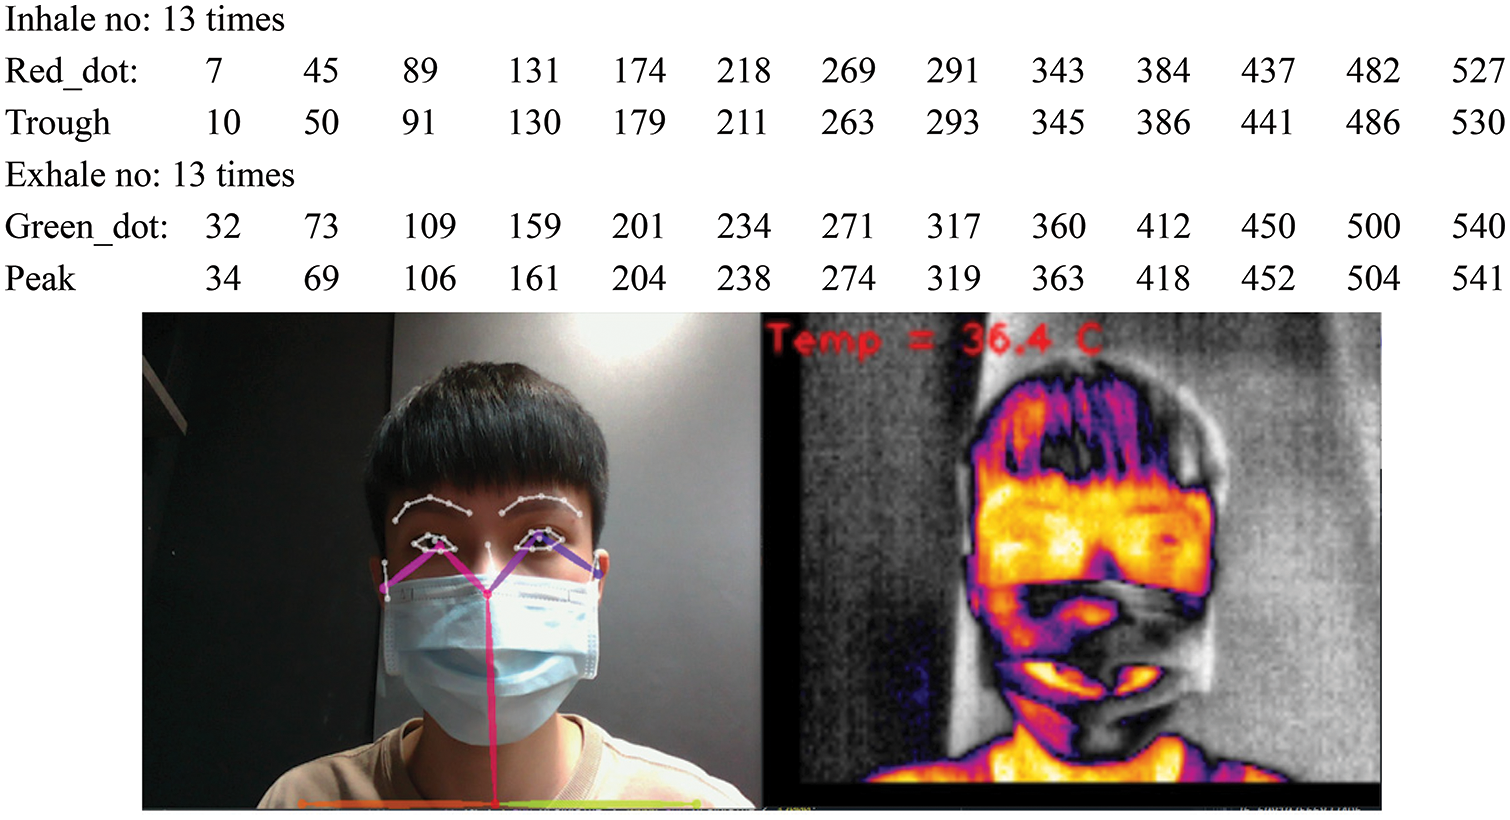
Figure 18: Actual execution results when wearing a mask at a distance of 40 cm
In this subsection, the measurement distance is increased to 60 cm while applying the same method as described in the previous subsection to measure the RR. The original signal waveform is shown in Fig. 19a, and the bandpass filtering and button-press time points are shown in Fig. 19b. The execution results are shown in Fig. 20. It can be found that when the distance increases in the case of wearing a mask, the original signal does not decrease significantly. This is because the measured ROI position is a mask, and the surface temperature of the mask is highly distinguishable from the ambient temperature, so the decrease in the signal value is relatively insignificant. After bandpass filtering, there are 11 complete waves calculated, which represent 11 breaths in 60 s. After the statistics of inhalation (red dot) and exhalation (green dot), the number of completed breaths is also 11. This proves that this method of using the respiratory signal extracted by the mask ROI can effectively measure the breathing frequency, and the accuracy is not affected when the distance is increased up to 60 cm. The forehead temperature measured by the forehead ROI measurement at the same time is 36.0°C.

Figure 19: Respiratory signal waveform when wearing a mask at a distance of 60 cm
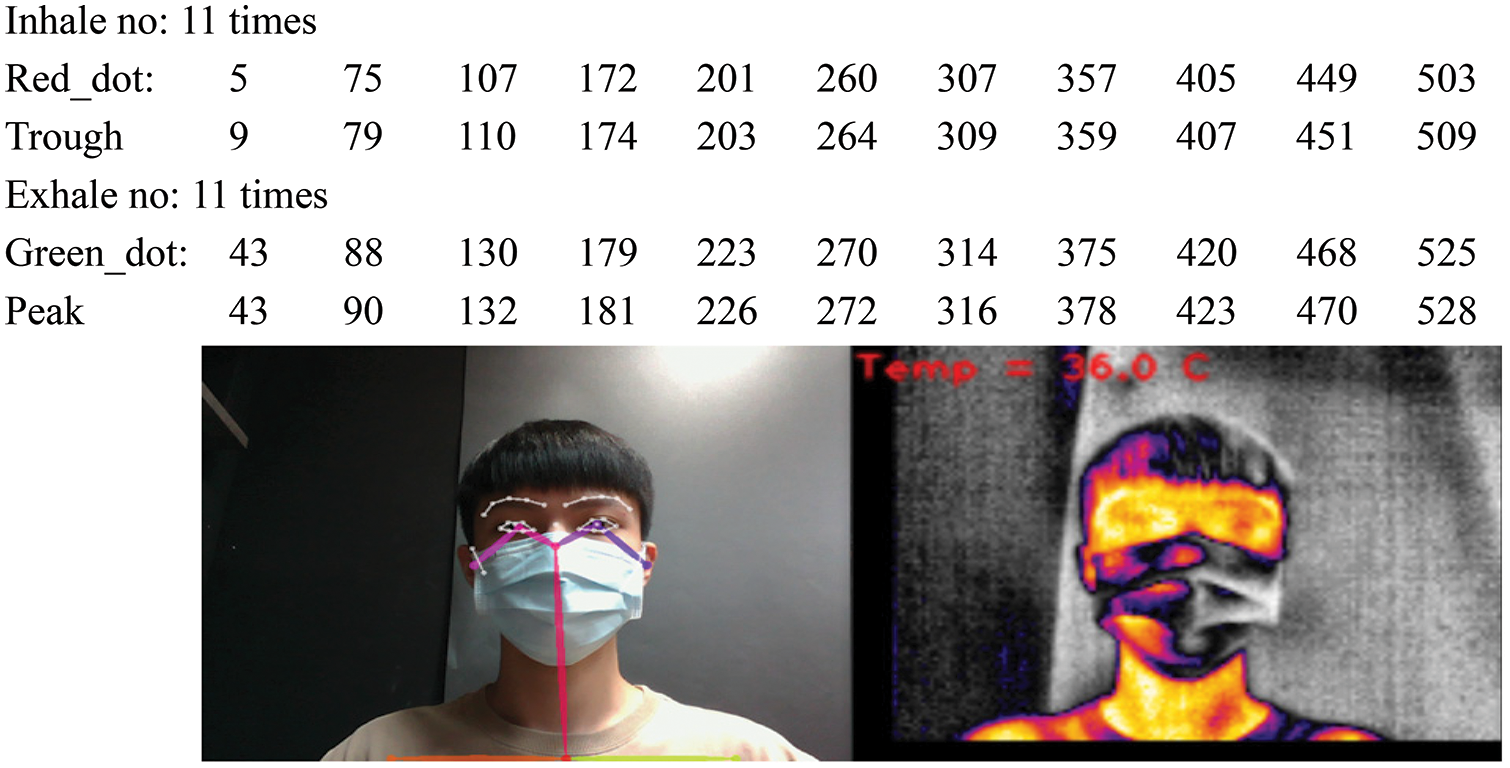
Figure 20: Actual execution results while wearing a mask at a distance of 60 cm
This study analyzes a non-contact physiological measurement system when subjects are wearing masks, applying different ROI areas using the green minus red average (G-R method, with two ROI sizes of 30 × 30 and 40 × 40, and at two distances of 40 and 60 cm). After the PPG signal is generated, the waveform is pre-processed. HR is measured according to the PPI in the waveform. The PTT and PWV, and other related parameters generated in the PPG waveform are used along with deep learning to predict BP.
According to the experimental results, in the case of wearing a mask, the G-R method with a 40 × 40 ROI measurement has the lowest HR and BP errors. In this study, the average gray pixel value in the thermal camera is also used to measure the RR and forehead temperature. The RR is a numerical count of the pixel high and low values generated by inhalation and exhalation in the ROI. Based on the filtered waveform, a wave number calculation is carried out, and button presses are used to count the number of breaths according to inhalation or exhalation during measurement; these are displayed on the waveform to verify the time points. From the experimental results, it can be confirmed that the RR and the number of keystrokes calculated by the waveform are the same, and measurement at distances of 40 and 60 cm, respectively, does not affect the results. The temperature measured by the infrared forehead temperature gun is almost identical; the error is kept within ±0.5°C, which proves the feasibility and accuracy of the measurement of RR and forehead temperature using a thermal camera.
Physiological information such as HR, BP, forehead temperature, and RR are vital signs of a subject’s health, so easy and fast detection and high accuracy are two crucial requirements. The advantage of this work is achieving both goals even when the subject is wearing a mask. When a mask blocks most facial features, the proposed non-contact physiological measurement system can still detect the subject’s HR, BP, and forehead temperature in 6 s. Meanwhile, the RR can be obtained in one minute. Most important is that the measurement system provides high accuracy, with the error for both HR and BP within 2%~3%, and that of forehead temperature within ±0.5°C. Hence, the results can be considered supplementary information for a subject’s physiological health status. Future work will study the proposed method under environmental variation, including different light sources and room temperatures, to adjust our methods to fit these situations.
Funding Statement: This research was supported by the National Science and Technology Council of Taiwan under Grant MOST 109-2221-E-130-014 and MOST 111-2221-E-130-011.
Conflicts of Interest: The authors declare they have no conflicts of interest to report regarding the present study.
References
1. J. -W. Lin, M. -H. Lu and Y. -H. Lin, “A thermal camera based continuous body temperature measurement system,” in Proc. of 2019 IEEE/CVF Int. Conf. on Computer Vision Workshop, Seoul, Korea, pp. 1681–1687, 2019. [Google Scholar]
2. L. Chen, M. Hu, N. Liu, G. Zhai and S. X. Yang, “Collaborative use of RGB and thermal imaging for remote breathing rate measurement under realistic conditions,” Infrared Physics and Technology, vol. 111, no. 103504, pp. 1–8, 2020. [Google Scholar]
3. Z. Jiang, M. Hu, Z. Gao, L. Fan, R. Dai et al., “Detection of respiratory infections using RGB-infrared sensors on portable device,” IEEE Sensors Journal, vol. 20, no. 22, pp. 13674–13685, 2020. [Google Scholar]
4. T. Negishi, S. Abe, T. Matsui, H. Liu, M. Kurosawa et al., “Contactless vital signs measurement system using RGB-thermal image sensors and its clinical screening test on patients with seasonal influenza,” Sensors, vol. 20, no. 2171, pp. 1–16, 2020. [Google Scholar]
5. G. Sun, Y. Nakayama, S. Dagdanpurev, S. Abe, H. Nishimura et al., “Remote sensing of multiple vital signs using a CMOS camera-equipped infrared thermography system and its clinical application in rapidly screening patients with suspected infectious diseases,” International Journal of Infectious Diseases, vol. 55, pp. 113–117, 2017. [Google Scholar] [PubMed]
6. M. Z. Poh, D. J. Mcduff and R. W. Picard, “Advancements in non-contact, multiparameter physiological measurements using a webcam,” IEEE Transactions on Biomedical Engineering, vol. 58, no. 1, pp. 7–11, 2011. [Google Scholar] [PubMed]
7. M. Lewandowska, J. Ruminski, T. Kocejko and J. Nowak, “Measuring pulse rate with a webcam—a non-contact method for evaluating cardiac activity,” in Proc. of 2011 Federated Conf. on Computer Science and Information Systems, Szczecin, Poland, pp. 405–410, 2011. [Google Scholar]
8. H. Monkaresi, R. A. Calvo and H. Yan, “A machine learning approach to improve contactless heart rate monitoring using a webcam,” IEEE Journal of Biomedical and Health Informatics, vol. 18, no. 4, pp. 1153–1160, 2014. [Google Scholar] [PubMed]
9. S. L. Fernandes, V. P. Gurupur, N. R. Sunder, N. Arunkumar and S. Kadry, “A novel nonintrusive decision support approach for heart rate measurement,” Pattern Recognition Letters, vol. 139, pp. 148–156, 2020. [Google Scholar]
10. Y. Ma, J. Choi, A. Hourlier-Fargette, Y. Xue, H. U. Chung et al., “Relation between blood pressure and pulse wave velocity for human arteries,” Proc. of The National Academy of Sciences of the United States of America, vol. 115, no. 44, pp. 11144–11149, 2018. [Google Scholar]
11. K. Oiwa, S. Bando and A. Nozawa, “Contactless blood pressure sensing using facial visible and thermal images,” Artificial Life and Robotics, vol. 23, no. 3, pp. 387–394, 2018. [Google Scholar]
12. S. Shimazaki, H. Kawanaka, H. Ishikawa, K. Inoue and K. Oguri, “Cuffless blood pressure estimation from only the waveform of photoplethysmography using CNN,” in Proc. of 2019 41st Annual International Conf. of the IEEE Engineering in Medicine and Biology Society, Berlin, Germany, pp. 5042–5045, 2019. [Google Scholar]
13. S. Lewington, “Prospective studies collaboration. Age-specific relevance of usual blood pressure to vascular mortality: A meta-analysis of individual data for one million adults in 61 prospective studies,” Lancet, vol. 360, pp. 1903–1913, 2003. [Google Scholar]
14. X. Fan, Q. Ye, X. Yang and S. D. Choudhury, “Robust blood pressure estimation using an RGB camera,” Journal of Ambient Intelligence and Humanized Computing, vol. 11, pp. 1–8, 2018. [Google Scholar]
15. I. C. Jeong and J. Finkelstein, “Introducing contactless blood pressure assessment using a high speed video camera,” Journal of Medical Systems, vol. 40, no. 4, pp. 1–10, 2016. [Google Scholar]
16. C. Gonzalez Viejo, S. Fuentes, D. D. Torrico and F. R. Dunshea, “Noncontact heart rate and blood pressure estimations from video analysis and machine learning modelling applied to food sensory responses: A case study for chocolate,” Sensors, vol. 18, no. 1802, pp. 1–18, 2018. [Google Scholar]
17. J. Zou, S. Zhou, B. Ge and X. Yang, “Non-contact blood pressure measurement based on IPPG,” Journal of New Media, vol. 3, no. 2, pp. 41–51, 2021. [Google Scholar]
18. M. Rong and K. Li, “A blood pressure prediction method based on imaging photoplethysmography in combination with machine learning,” Biomedical Signal Processing and Control, vol. 64, no. 102328, pp. 1–11, 2021. [Google Scholar]
19. S. Dharanesh and A. Rattani, “Post-COVID-19 mask-aware face recognition system,” in Proc. of IEEE Int. Symp. on Technologies for Homeland Security, Boston, MA, USA, pp. 1–7, 2021. [Google Scholar]
20. H. Deng, Z. Feng, G. Qian, X. Lv, H. Li et al., “MFCosface: A masked-face recognition algorithm based on large margin cosine loss,” Applied Sciences, vol. 11, no. 7310, pp. 1–17, 2021. [Google Scholar]
21. P. Nagrath, R. Jain, A. Madan, R. Arora, P. Kataria et al., “SSDMNV2: A real time DNN-based face mask detection system using single shot multibox detector and MobileNetV2,” Sustainable Cities and Society, vol. 66, no. 102692, pp. 1–13, 2021. [Google Scholar]
22. I. P. A. Karasugi and Williem, “Face mask invariant end-to-end face recognition,” in Proc. of European Conf. on Computer Vision, Glasgow, UK, pp. 261–276, 2020. [Google Scholar]
23. T. Feng, L. Xu, H. Yuan, Y. Zhao, M. Tang et al., “Towards mask-robust face recognition,” in Proc. of the IEEE/CVF Int. Conf. on Computer Vision, Montreal, Canada, pp. 1492–1496, 2021. [Google Scholar]
24. N. Sharmin and R. Brad, “Optimal filter estimation for Lucas-Kanade optical flow,” Sensors, vol. 12, no. 9, pp. 12694–12709, 2012. [Google Scholar]
25. Y. -F. Chen, “Research on non-contact imaging measurement of heartbeat and blood pressure based on deep learning with arrhythmi,” Master Thesis, Ming Chuan University, Taiwan, 2021. [Google Scholar]
Cite This Article
 Copyright © 2023 The Author(s). Published by Tech Science Press.
This work is licensed under a Creative Commons Attribution 4.0 International License , which permits unrestricted use, distribution, and reproduction in any medium, provided the original work is properly cited.
 Downloads
 Citation Tools