
 Submit a Paper
 Propose a Special lssue
 Open Access
ARTICLE

Probability Based Regression Analysis for the Prediction of Cardiovascular Diseases
1 Department of Computer Science, NFC Institute of Engineering and Technology, Multan, Pakistan
2 Faculty of Computer Science & Information Technology, University of Malaya, Kuala Lumpur, Malaysia
3 Department of Computer Science and Information Technology, The Islamia University of Bahawalpur, Rahim Yar Khan Campus, Punjab, Pakistan
4 Faculty of Computers and Information Technology, University of Tabuk, Tabuk, 47512, Saudi Arabia
5 Department of Information Sciences, Division of Science and Technology, University of Education, Lahore, Pakistan
6 Sensor Networks and Cellular Systems (SNCS) research center, University of Tabuk, Tabuk, 47512, Saudi Arabia
* Corresponding Author: Qaisar Shaheen. Email:
Computers, Materials & Continua 2023, 75(3), 6269-6286. https://doi.org/10.32604/cmc.2023.036141
Received 18 September 2022; Accepted 29 January 2023; Issue published 29 April 2023
 View Full Text
 Download PDF
Abstract
Machine Learning (ML) has changed clinical diagnostic procedures drastically. Especially in Cardiovascular Diseases (CVD), the use of ML is indispensable to reducing human errors. Enormous studies focused on disease prediction but depending on multiple parameters, further investigations are required to upgrade the clinical procedures. Multi-layered implementation of ML also called Deep Learning (DL) has unfolded new horizons in the field of clinical diagnostics. DL formulates reliable accuracy with big datasets but the reverse is the case with small datasets. This paper proposed a novel method that deals with the issue of less data dimensionality. Inspired by the regression analysis, the proposed method classifies the data by going through three different stages. In the first stage, feature representation is converted into probabilities using multiple regression techniques, the second stage grasps the probability conclusions from the previous stage and the third stage fabricates the final classifications. Extensive experiments were carried out on the Cleveland heart disease dataset. The results show significant improvement in classification accuracy. It is evident from the comparative results of the paper that the prevailing statistical ML methods are no more stagnant disease prediction techniques in demand in the future.Keywords
Nowadays, the use of the angiography method is not uncommon for Coronary Artery Disease (CAD) diagnosis [1–4]. Angiography is an effective method of diagnosing CAD, but it also has some major side effects and a high cost. The changeable and non-changeable factors help the physician in diagnosing the patients’ disease [5]. It should be noted that diagnosing a heart disease is not easy and requires years of hands-on experience to diagnose such diseases. Above all, human intervention in diagnosing such diseases has a large room for error. The conventional methods of diagnosing Cardiovascular Disease (CVD) are based on the patient’s medical history, symptoms analysis, and a comprehensive medical examination performed by a clinical practitioner. These conventional methods sometimes do not yield an accurate diagnosis, mostly because of the misinterpretation of facts by clinical practitioners [6]. To prevent misinterpretation or false diagnosis, intelligent systems are required. Such intelligent systems must have the same level of expertise as a professional clinical practitioner while reducing the margin of error in diagnosing coronary disease.
With the wide use of Artificial Intelligence in machines and computers, researchers aim to build intelligent systems [7–9] that not only assist a clinical practitioner in the diagnosis of diseases but help the common person to keep track of health and history [10,11]. Moreover, many researchers have employed Machine Learning (ML) techniques for diagnosing diseases based on historical data [12–15]. As machines do not share the human factors of clinical practitioners such as lack of concentration, fatigue, recollection of critical facts, etc [16,17]. Whereas, if designed carefully, machines can be comparatively more reliable for diagnosing CVD. For building such machines, researchers have explored a lot of ML methods and most recently Deep Learning (DL) methods [18–23]. The results of such research have proved that heart diseases can be effectively diagnosed using ML techniques.
Despite many kinds of research conducted regarding the prediction of heart diseases, there is still room for improvement [18,19]. Techniques proposed in the previous studies consider classical ML techniques. Although these classical techniques perform well for a small-scale dataset but having a high error rate. Over the past few years, DL has gained a lot of attention for solving machine-learning problems. Problems such as the prediction of heart diseases with a small dataset do not perform well with DL frameworks because of the small number of features and training trials. Only a few researchers such as P. Ramani et al. [24] based their work on Deep Neural Networks (DNN). The researchers have employed and tested basic statistical ML methods to their limits and there seems to be no more room for improvement. As DL has proven to work well with any classification problem, its performance in sense of precision is limited by the amount of training data and the number of structures in the training data. Datasets having a smaller number of training data and features are used in this study to examine the proposed model. The paper takes heart disease prediction as a case study to validate the proposed model. The proposed model works in three main stages, the first stage converts the actual features to probabilities using various regression techniques, these probabilities are then converted to a vector form. Further, these probability vectors are passed on to the second stage where a Support Vector Machine (SVM) or Artificial Neural Networks (ANN) is trained on these probabilities. Next, in the third stage classification process was carried out. The projected method works related to a DL model, but the proposed method does not require a large volume of training data. The main contributions of the paper are as follows:
1) This paper proposes a novel and robust method for the accurate classification of datasets having a small number of samples and features. Extensive experiments were performed on the Cleveland heart disease dataset. The results of the experiments show the superiority of the method.
2) This paper identifies and investigates possible enhancements to the proposed model. Moreover, this paper explores the outcomes of these possible enhancements along with a comparative study of different combinations of layers.
The remainder of the paper is organized as follows. In Section 2, an overview of previous work is shown. The proposed model and component are explained in Section 3 followed by the description of the dataset, evolution metrics, experimental results, and comparisons in Section 4, and the conclusion is drawn in Section 5.
In the last few years, different heart disease diagnostic methods have been proposed [25–27]. Most of these methods are based on machine-statistical learning or a hybrid of the methods of ML methods. These methods have improved the quality of the decision-making process. With the introduction of DL, ML can now be categorized into two main streams such as classical ML is also known as shallow learning, includes all legacy ML and DL methods which make use of one or more classical ML techniques referred as classical ML techniques.
2.1 Classical Machine Learning
Ali et al. [28] aim to implement the best ML techniques to predict heart disease. In addition, research has shown that the method of selecting relief and the linear kernel-based SVM goes beyond feature selection and ML algorithms. Javeed et al. [29] suggest that the K Nearest Neighbor (KNN) classifies heart disease at level 6 using electrocardiograph (ECG) signal ripples. Takci [30] propose a ML based risk management approach using plaque derived from coronary computed tomography angiography (CCTA) to support the cardiac management Are vascular infections. The paper also shows that the claim of C numbers in a ML-based approach has greatly improved segregation. Saini et al. [31] were used for the early detection of heart disease using a classification and regression tree decision table iterative dichotomy. We also looked at different classes to find one that is suitable for the accurate prediction of coronary heart disease. The authors, relatively speaking, see this as the best algorithm for classification. Rosendael et al. [32] propose a simple Bayesian prediction method. Chaurasia et al. [33] suggested a method for predicting heart disease based on linear discriminant analysis. For the prediction of heart disease, Cheung [34] introduce kernel functionality with an Artificial Immune System (AIS).
2.1.1 Fuzzy Logic-Based Methods
Šter et al. [35] introduced a weighting scheme using KNN along with an Artificial Immune Recognition System (AIRS) with a fuzzy resource allocation mechanism as our used classifier. Another prediction system was introduced by Ozsen et al. [36] based on Fuzzy-AIS-KNN based system. Polat et al. [37] proposed a method for diagnosis of the heart diseases.
2.1.2 Support Vector Machine Methods
Previous researchers such as Kumar [38] recommended different ML techniques such as SVM, logistic regression (LR), and KNN, along with ANN to diagnose cardiac diseases. Moreover, the evaluation showed that Logistic Regression has the best performance. Recently, Moein [39] proposed a system for the diagnosis of heart diseases based on various types of SVM [40].
Ali et al. [41] proposed a productive coronary disease predicting system based on Data Mining (DM). The proposed system assists clinical practitioners in making accurate decisions based on specific parameters. Rehman et al. [42] recommended a multi-infection prediction system based on data mining, as data mining techniques help in the diagnosis of various diseases. Moreover, their method focused on predicting coronary diseases, diabetes, bosom disease, etc. Saxena et al. [43] proposed heart a disease detection algorithm based on ANN and data mining. Keeping the cost of diagnosing heart disease in view, a framework for diagnosing heart disease was proposed. Further, a prediction model was employed to estimate the state of the patient based on different parameters such as heartbeat rate, circulatory strain, cholesterol level, etc. Anwar et al. [44] proposed a prediction system that detects coronary illness from a patient’s therapeutic dataset. Moreover, the system considers thirteen hazard features. Reddy et al. [45] proposed a framework based on data mining and artificial intelligence methods to predict heart diseases. Naseem et al. [46] proposed various data mining strategies for predicting heart disease. Moreover, they evaluated methods like J48, decision tree, K-nearest neighbors, sequential minimal optimization, and naïve Bayes. Patel et al. [47] proposed an ANN-based system for coronary disease prediction. Moreover, feed-forward backpropagation learning calculations were used to test the model. To predict heart disease, a decision tree based neural fuzzy system is proposed by Bahrami et al. [48], and Ajam [49] utilized k-means and naïve Bayes to predict heart disease. They used thirteen features with an aggregate of 300 samples from the Cleveland heart disease dataset were used. Prabhavathi et al. [50] proposed a method for predicting CVD based on a data mining system. Mujawar et al. [51] proposed a method for classifying brain Magnetic Resonance Imaging (MRI) images. Marimuthu et al. [52] proposed C45 standards and a fractional tree method to predict coronary disease. Siddiqui et al. [53] proposed a framework predicting CVD based on big data technology.
2.3 Deep Learning and Neural Network-Based Methods
Not many researchers based their work on DL [54] and ANN-related methodologies [55,56]. Khan et al. [57] proposed a hybrid neural network-based system. Similarly, Majid et al. [58] proposed IncNet architecture for the prediction of heart diseases. Kahramanli et al. [59] proposed a decision support system based on methods such as ANN, Fuzzy Analytic Hierarchy Process (F-AHP) for estimating the risk of heart failure. Recently, Ramani et al. [24] proposed a system based on the Statistical Model and ANN for the prediction of heart disease.
In this section, the details about the dataset are provided followed by an overview of the proposed method. Finally, the proposed architecture is explained in detail.
3.1 Cleveland Heart Disease Dataset
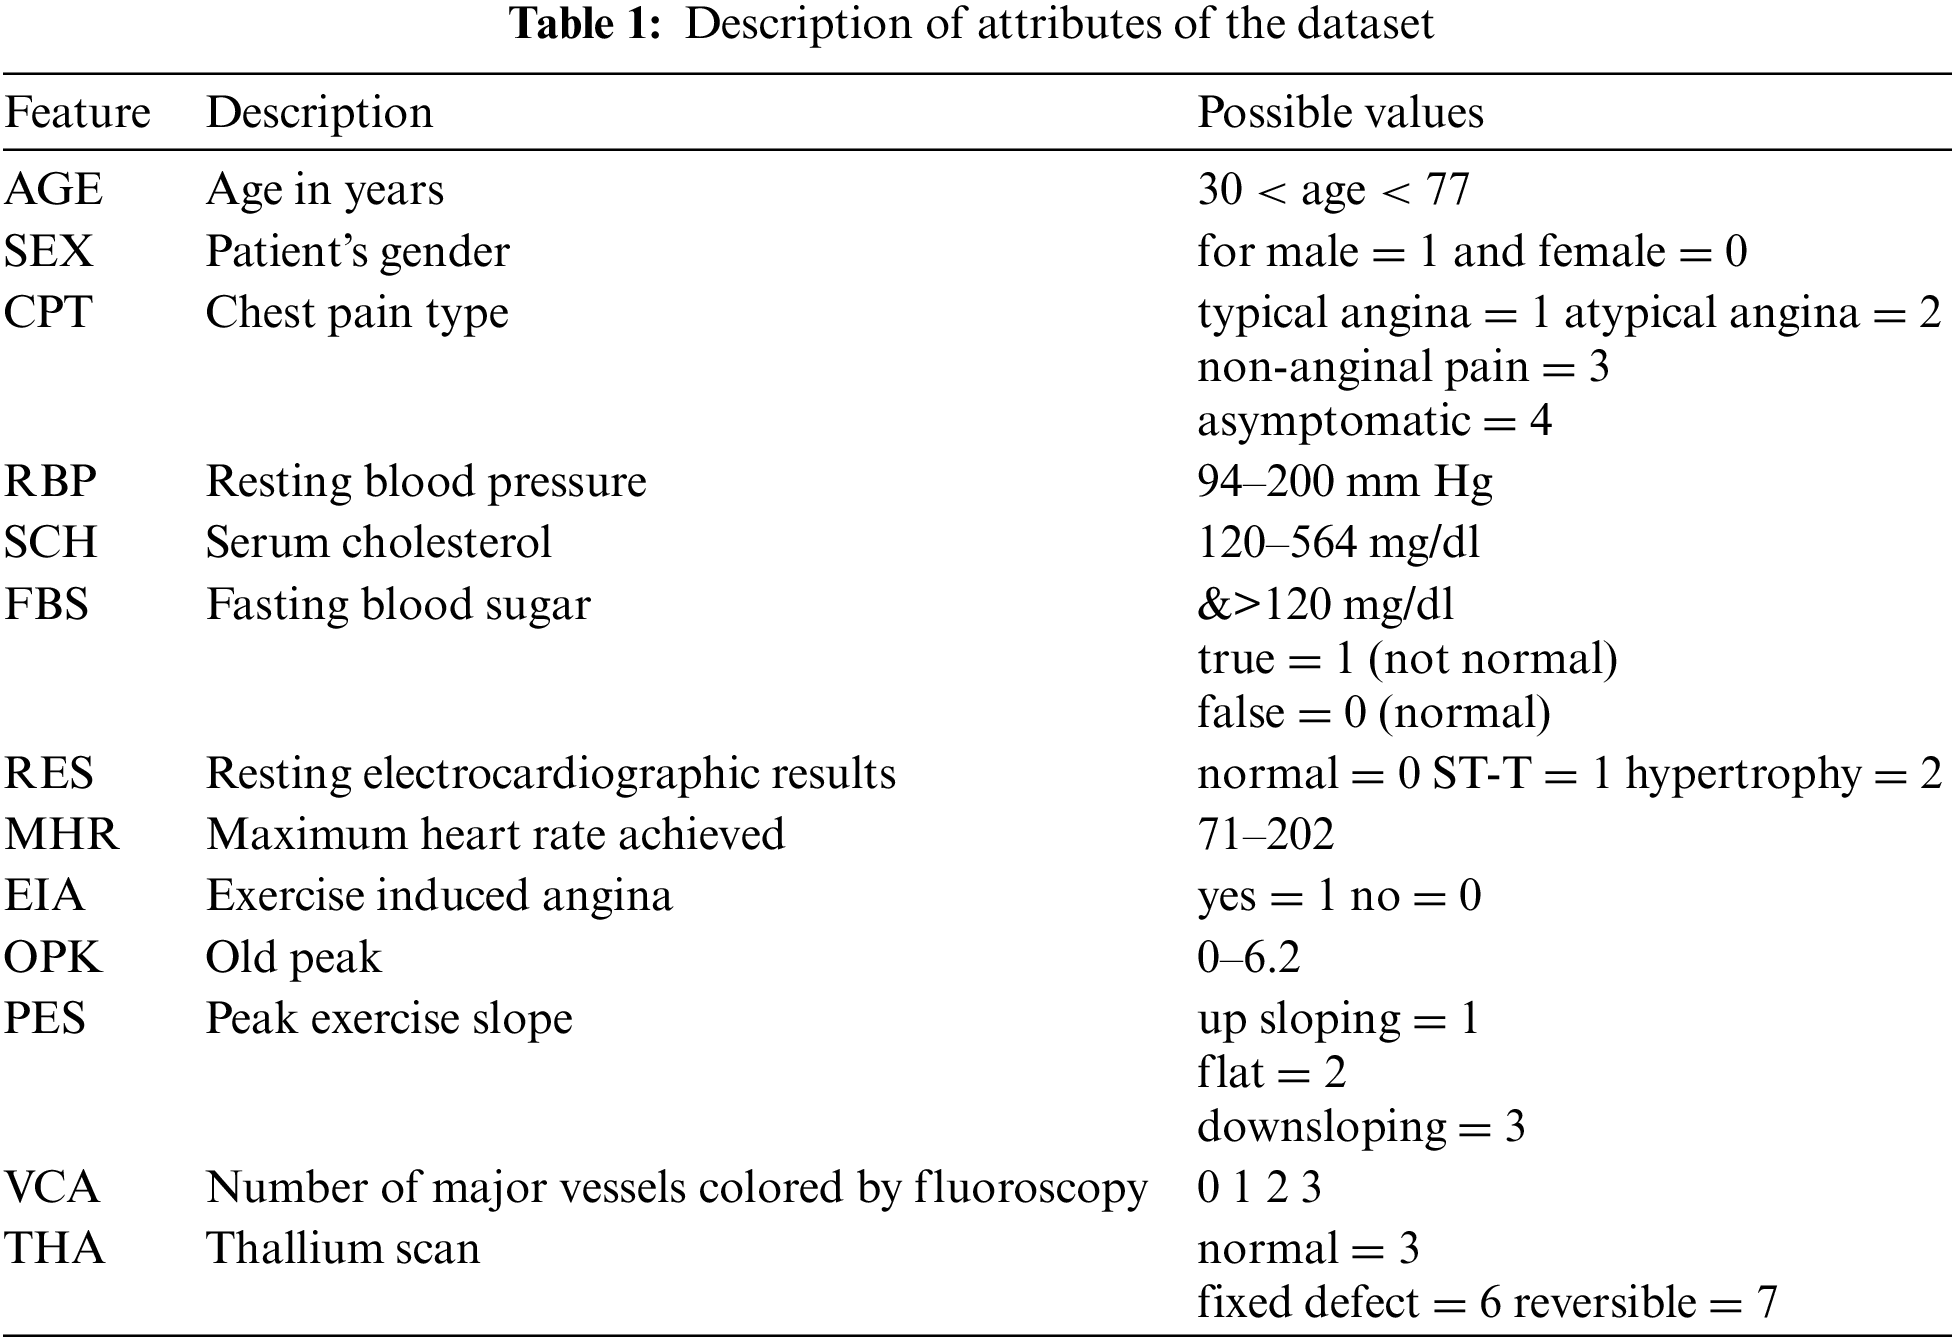
To validate the proposed method, we employed a renowned dataset named Cleveland heart disease dataset. This dataset was collected by Robert Detrano (MD) and was obtained from V.A. Medical Center, Long Beach, and Cleveland Clinic Foundation. The Cleveland heart disease dataset is available on the University of California, Irvine (UCI) ML repository. There are 303 instances in the dataset, out of which 297 instances do not contain missing values, and six have some missing attribute values. Also, the dataset has 76 raw features as per instances. But most of the previous studies used only 13 features in the prediction of heart disease. For the experiments, we have also used these 13 features. Table 1 gives complete information and descriptions of the selected features of the dataset.
An overview of the regression layers used in stage one is provided in this section. To provide a comprehensive comparative study, we incorporate ANN and SVM as stage two.
3.2.1 Support Vector Machine Methods
SVM classification is performed by finding a hyperplane that maximizes the margin between the two categories. It uses a maximum margin approach which can be transformed into complex programming problems. The vector that defines the hyperplane is called the support vector. Due to the high performance of the vector support machines in classification, they have been used in many types of research related to classification. The binary classification problem example is eliminated by hyperplane ATx + b = 0. Where A and b are dimensional coefficients vertically on the surface of the hyperplane, b is the offset from the source, and x is the original value of the data set. SVM provides results for A and b. Using a Lagrangian multiplier in the linear case makes it easy to solve A. Boundary data boundaries are called support vectors For details, see [60]. The solution of A can be expressed as:
where n = Number of support vectors and yi = Target label to x
Eq. (1) gives the value of A. Moreover, Eq. (2) gives the linear discriminant function, which is defined as:
kernel trick and decision function for a non-linear case can be found as:
A positive semi-definite function that conforms to the Mercer condition is represented as a kernel function (for example, a polynomial kernel) by Eq. (4)
For binary classification problems in logistic regression [61], if the predictor value y [0, 1] is 0, treat it as a negative number. If the predictor value is 1, it is classified. However, to classify the two classes (0 and 1), the designation of the hypothesis hΘ = ΘTx according to the threshold classifier out is hΘ(x) at 0.5. Any value of hypothesis hΘ(x) > 0.5 is considered predictive variable y as 1. However, in the case when the value for hΘ(x) < 0.5 predictive variable y will get an as 0 and the person is considered as healthy. Therefore, in this condition, the logistic regression predicted change was 0 ≤ hΘ(x) ≥ 1. The logistic regression sigmoid function can be represented by Eq. (5):
Similarly, the cost function for logistic regression can be expressed as:
This method resembles with least square of the linear model. Segmentation was chosen to minimize the sum of the square errors between the observed and average values per node. Minimum deviation which minimizes the mean absolute deviation from the median of the node. The advantage of the least square method is that it provides a more stable model that is more susceptible to outsiders. Suppose that we have a scalar Y as a result and a p-vector of variable X, then assume that
Linear regression [62] standard model function methods are adopted. We are interested in guessing the value of the new input x* of y. The output is assumed to be a linear input function with added noise:
The term noise εt follows a normal distribution. That is, εt ~ N (Θ,
Entering the Bayesian framework, we perform this task with a post-distribution of weights when using Gaussian priority. If we utilize a prior Gaussian upon the weights p (w) = N (0, Σ) and the Gaussian likelihood p (y| Xt ,w) p (w) = N(xtw, σε2I), then this subsequent distribution is:
3.2.5 Gaussian Process Regression
In the Gaussian process [63], If you select two or more points of a function i.e., (different output and input pairs) to define the distribution of the output function, this point is combined into a multiple Gaussian Sharing. More formally, the Gaussian process has a random finite number of random variable combinations Gaussian distributions defined by a series of random variables. The Gaussian process convergence assumes that the output y of the function f of the input x can be described as:
Note that it is the same as the assumption of linear regression because the observations assume a Gaussian regression independent signal term
A process of Gaussian
3.2.6 Artificial Neural Networks
The proposed method uses ANN and SVM as the second stage as we intend to provide a comparative study of both robust models [64,65]. ANN is a feed-forward network that can have more than one layer of hidden units between the layers of output and input. For the hidden unit, j, the logistic function is used for mapping its total input from the layer below xj to the scalar state, yj, which is sent to the layer as presented in Eq. (16)
where, bj = unit j deviation, i = least significant index, wi, j = weight of cell j concatenation in the next layer cell I, The total input xj is converted into probability pj by the output j using softmax nonlinearity shown in the Eq. (18):
where k is the class index. The DNN can be well trained by propagating the cost functioning hypothesis in the opposite direction to measure the difference between the target output and the actual output generated by each case study. Using the softmax output function, the natural function of C is the cross entropy between the target probability d and the output of softmax p, which can be expressed as:
The target probability (usually 1 or 0) is the monitoring information provided to train the DNN classification.
The proposed method relies on the probabilities calculated by the regression techniques. Although, researchers use many basic statistical ML methods for the prediction of heart diseases. But, the improvement in accuracy seemed to be stagnant on a single point for a long time. Previous researches show that basic statistical ML method have already reached their limits and it is not possible to improve the performance conventionally. The proposed method utilizes several basic statistical ML methods. Some methods can act as strong classifiers and some methods as weak classifiers (also referred as strong or weak-learners). The proposed method is robust in predicting heart diseases. This robustness is achieved by using several weak and strong learners.
The method is inspired by DL [66], as it converts the representation of an input sample to some arbitrary feature space [67,68]. But, some DL requires a large number of features and training data [69]. In our case, the number of features is far less than required for a DL model to work efficiently. To overcome these issues, this paper proposes a method that converts actual feature space into a grid of probabilities using basic regression techniques. Further, SVM and ANN are used to classify the grid of probabilities. The proposed method can be reconfigured in infinitely many ways with a combination of different statistical regression techniques. The number of layers can be adjusted accordingly. The general layout of the proposed method is shown in Fig. 1.
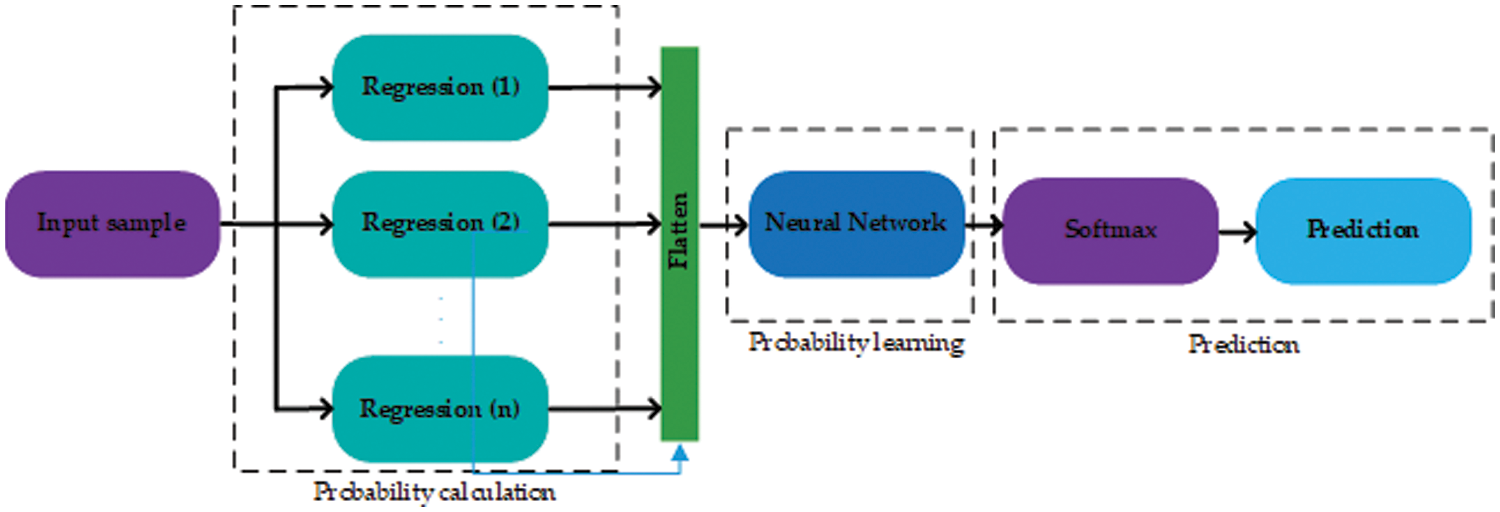
Figure 1: The general layout of the proposed technique. The proposed method works in three stages shown by dashed rectangles
The proposed method works in three stages, the first stage includes several regression layers. Moreover, several regression layers can be added to the first stage. Each regression layer is trained using the training data with actual labels. These layers may employ any type of regression model with a different configuration of hyperparameters. For example, suppose a statistical regression technique has a single tuning hyperparameter σ, and the values of σ lie between 0 and 1. Then, a layer can be a regression model with different configurations i.e. (with different values of σ). All the probabilities obtained by the first stage are first flattened and then forwarded to the second stage. For an input sample of heart disease to the first stage, the input sample is first converted to a vector of probabilities then these probabilities are passed on to the second stage. The second stage is another regression layer that learns using all the probabilities yielded by the regression layers in the first stage and the actual labels. The second stage yields the probability of being a heart disease or not. This probability is then forwarded to the third and last stage, which predicts according to the SoftMax threshold level [70].
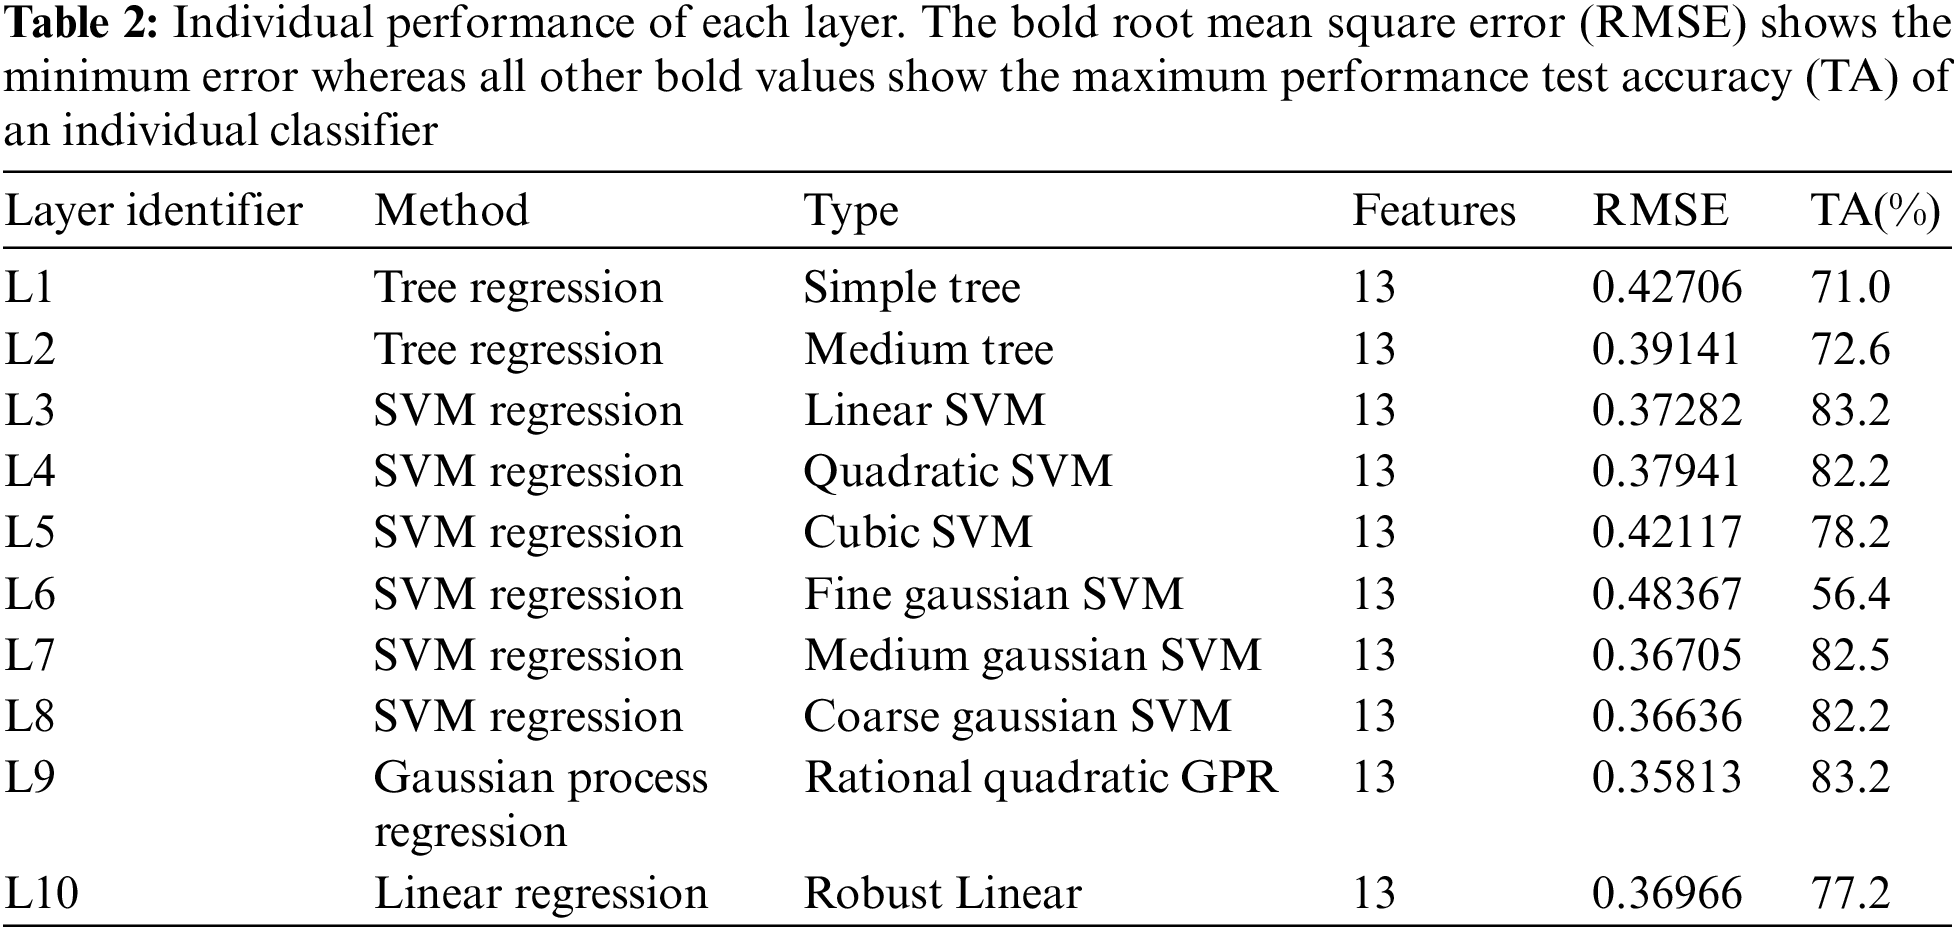
As there are many possible combinations regarding the proposed method, the stage one layers include statistical regression learners such as a tree, linear SVM, medium tree, cubic SVM, quadratic SVM, medium Gaussian SVM, fine Gaussian SVM, relational quadratic, Gaussian Process Regression (GPR) coarse Gaussian SVM, and linear regression referred as L1, L2, L3, L4, L5, L6, L7, L8, L9, and L10 respectively. Further details about the regression layers and the individual performance of each layer can be found in Table 2. These layers were chosen randomly and all layers have different classification capabilities. Among all the layers, L9 has the maximum classification rate and the minimal Root Mean Square Error (RMSE) (root mean square error). Whereas, L6 is the worst-performing layer with the maximum RMSE and the lowest classification rate.
This paper presents two possible solutions that can be used as stage two. The first solution utilizes ANN as a stage two probability learner and as a second solution, this paper utilizes an SVM. The reasons for using ANN are flexible learning, the ability to process small amounts of data, the exposure to complex nonlinear relationships between dependent and independent variables, and the ability to predict. The reason for using SVM is that it performs well in establishing a support vector hyperplane that distinguishes between classes. Fig. 2 shows the proposed architecture that uses ANN as a stage two probability learner and Fig. 3 shows the architecture that uses SVM for second stage probability learning.
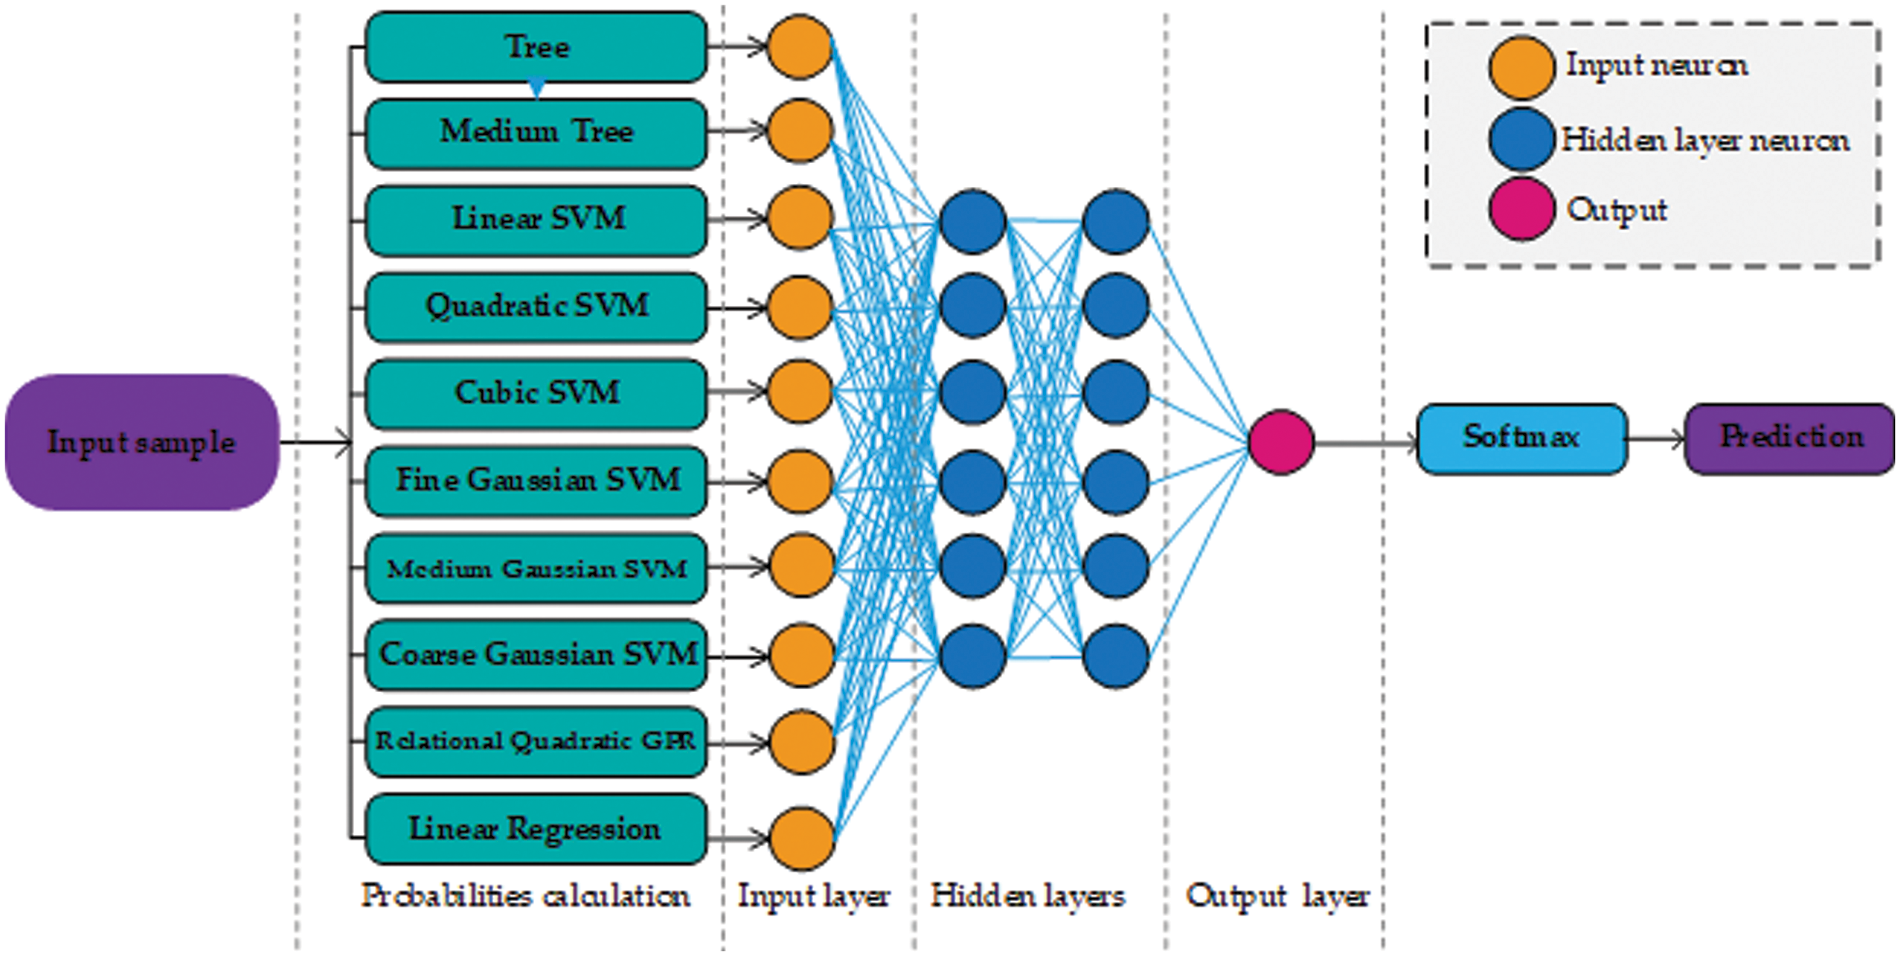
Figure 2: Architecture design of our approach using neural networks. For the sake of simplicity, only a few neurons are shown in the hidden layer section
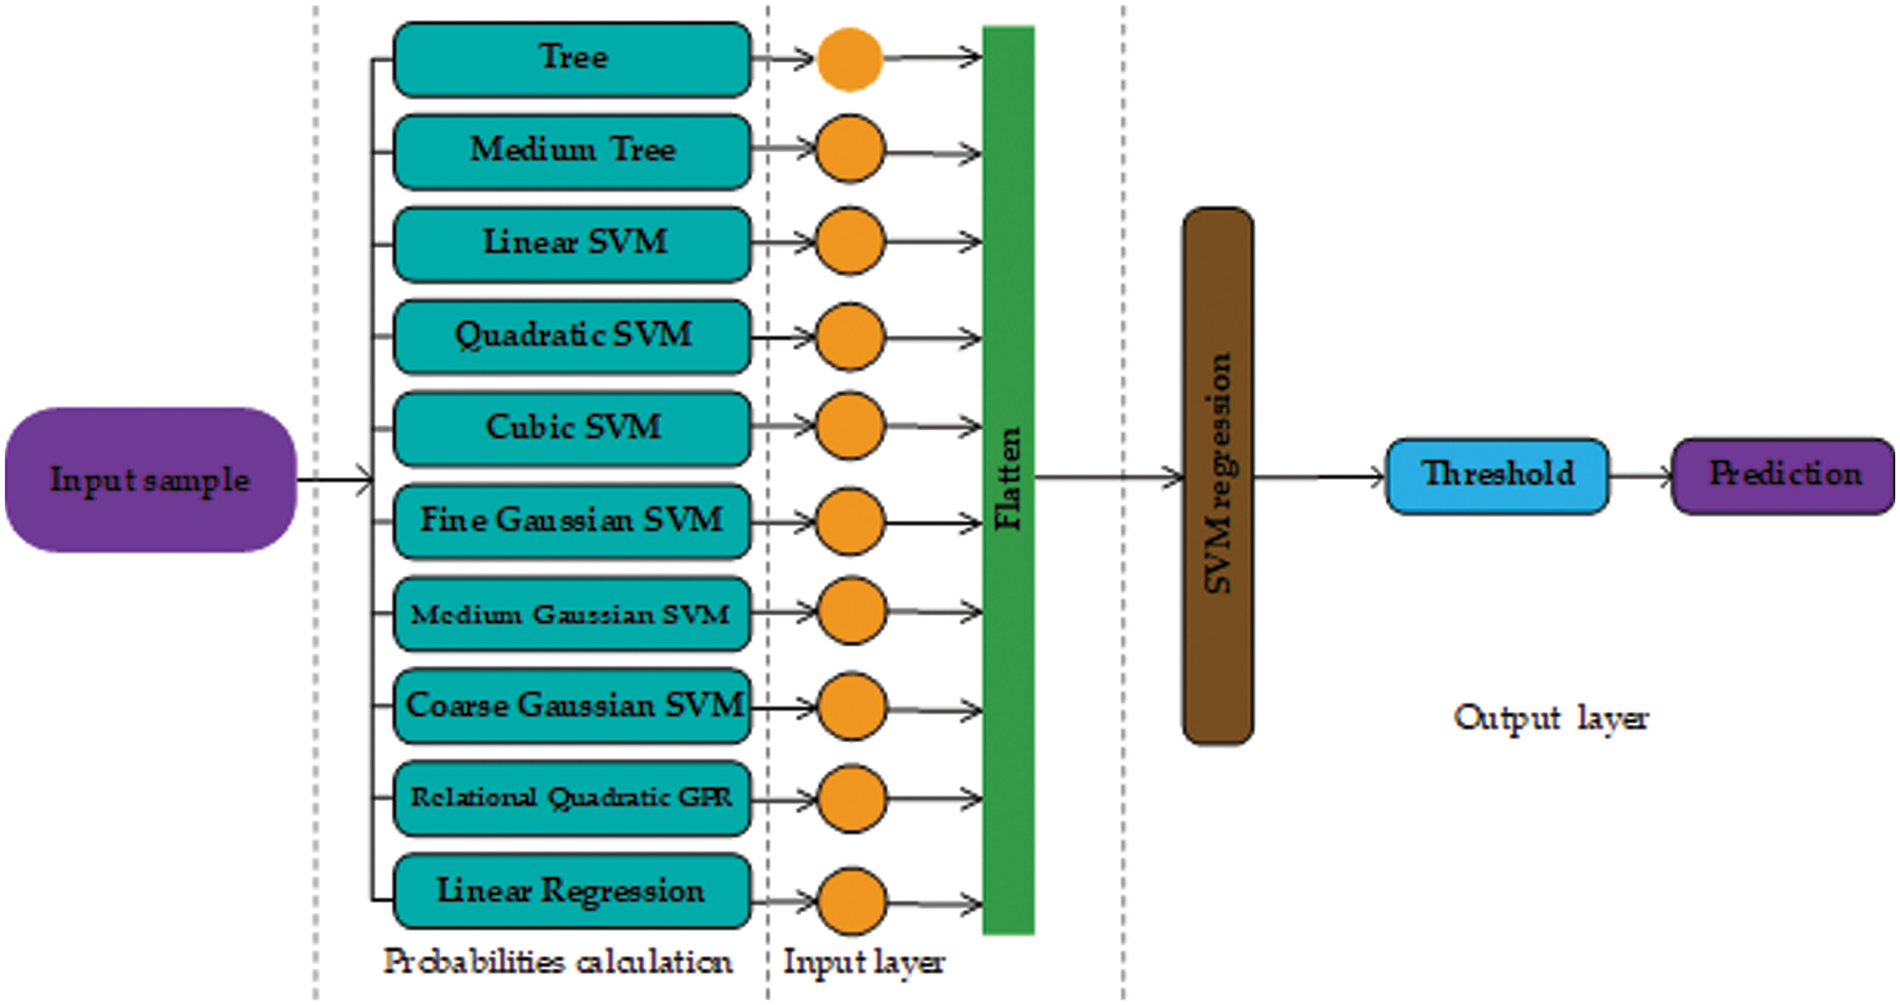
Figure 3: Architecture design of our approach using support vector machine as the second stage (probability learning)
We perform comprehensive experiments on the Cleveland dataset. We use the features for training and testing in their original form and ignore the samples with missing attributes. We split the dataset into random 213 testing and 90 training samples and create three such groups to validate the generalizability of the proposed technique. Each regression layer of the first stage is trained on the training samples with actual labels. For both cases, the second stage ANN and SVM are trained on the probabilities obtained by the first stage using the actual labels. For training the ANN, the data division parameter is randomized, a scaled conjugate gradient was used during training along with cross-entropy as a measure of performance.
The model is assessed based on accuracy, sensitivity, specificity, and Matthew’s Correlation Coefficient (MCC). Accuracy is the percentage of un-quasifield items in the test data set. Sensitivity provides information about the correct classification of patient dimensions, but especially about the correct classification of healthy subjects [71–73]. Sensitivity and specificity are represented by Eqs. (20) and (21) respectively. The formula for these indicators is:
While FP, TP, FN, and TN present the number of false positives, true positives, false negatives, and true negatives respectively.
MCC is generally employed for statistical analysis of binary classification. It is a metric that measures the testing accuracy of a classification model. Moreover, MCC returns a value between −1 and 1 where 1 indicates perfect predictions, and −1 is regarded as the worst prediction. MCC can be represented as:
The receiver operator characteristics (ROC) curve describes the sensitivity of the classifier in terms of true positives and false positives. The better the Area Under the Curve (AUC) measure, the better the model. The curve is based on the predicted outcome and true outcome.
The AUCs for the test datasets were calculated and used to compare the discriminative powers of the models.
4.1 Individual Performance of Layers
The proposed method relies on several weak learners, Table 2 shows the performance of all the individual regression and classification layers. In Table 2, RMSE represents the root mean square error for each regression layer. We tested the performance (shown by the ‘Test accuracy’ column) of each layer using a suitable cutoff level determined by the ROC as shown in Fig. 4. From the individual performance results (RMSE and Test accuracy), it is quite clear that each layer has a low performance and is hence deemed as a weak learner. As mentioned earlier, Gaussian process regression has the lowest RMSE value and the highest test classification accuracy, while Fine Gaussian SVM has the highest RMSE value and the lowest test classification accuracy.
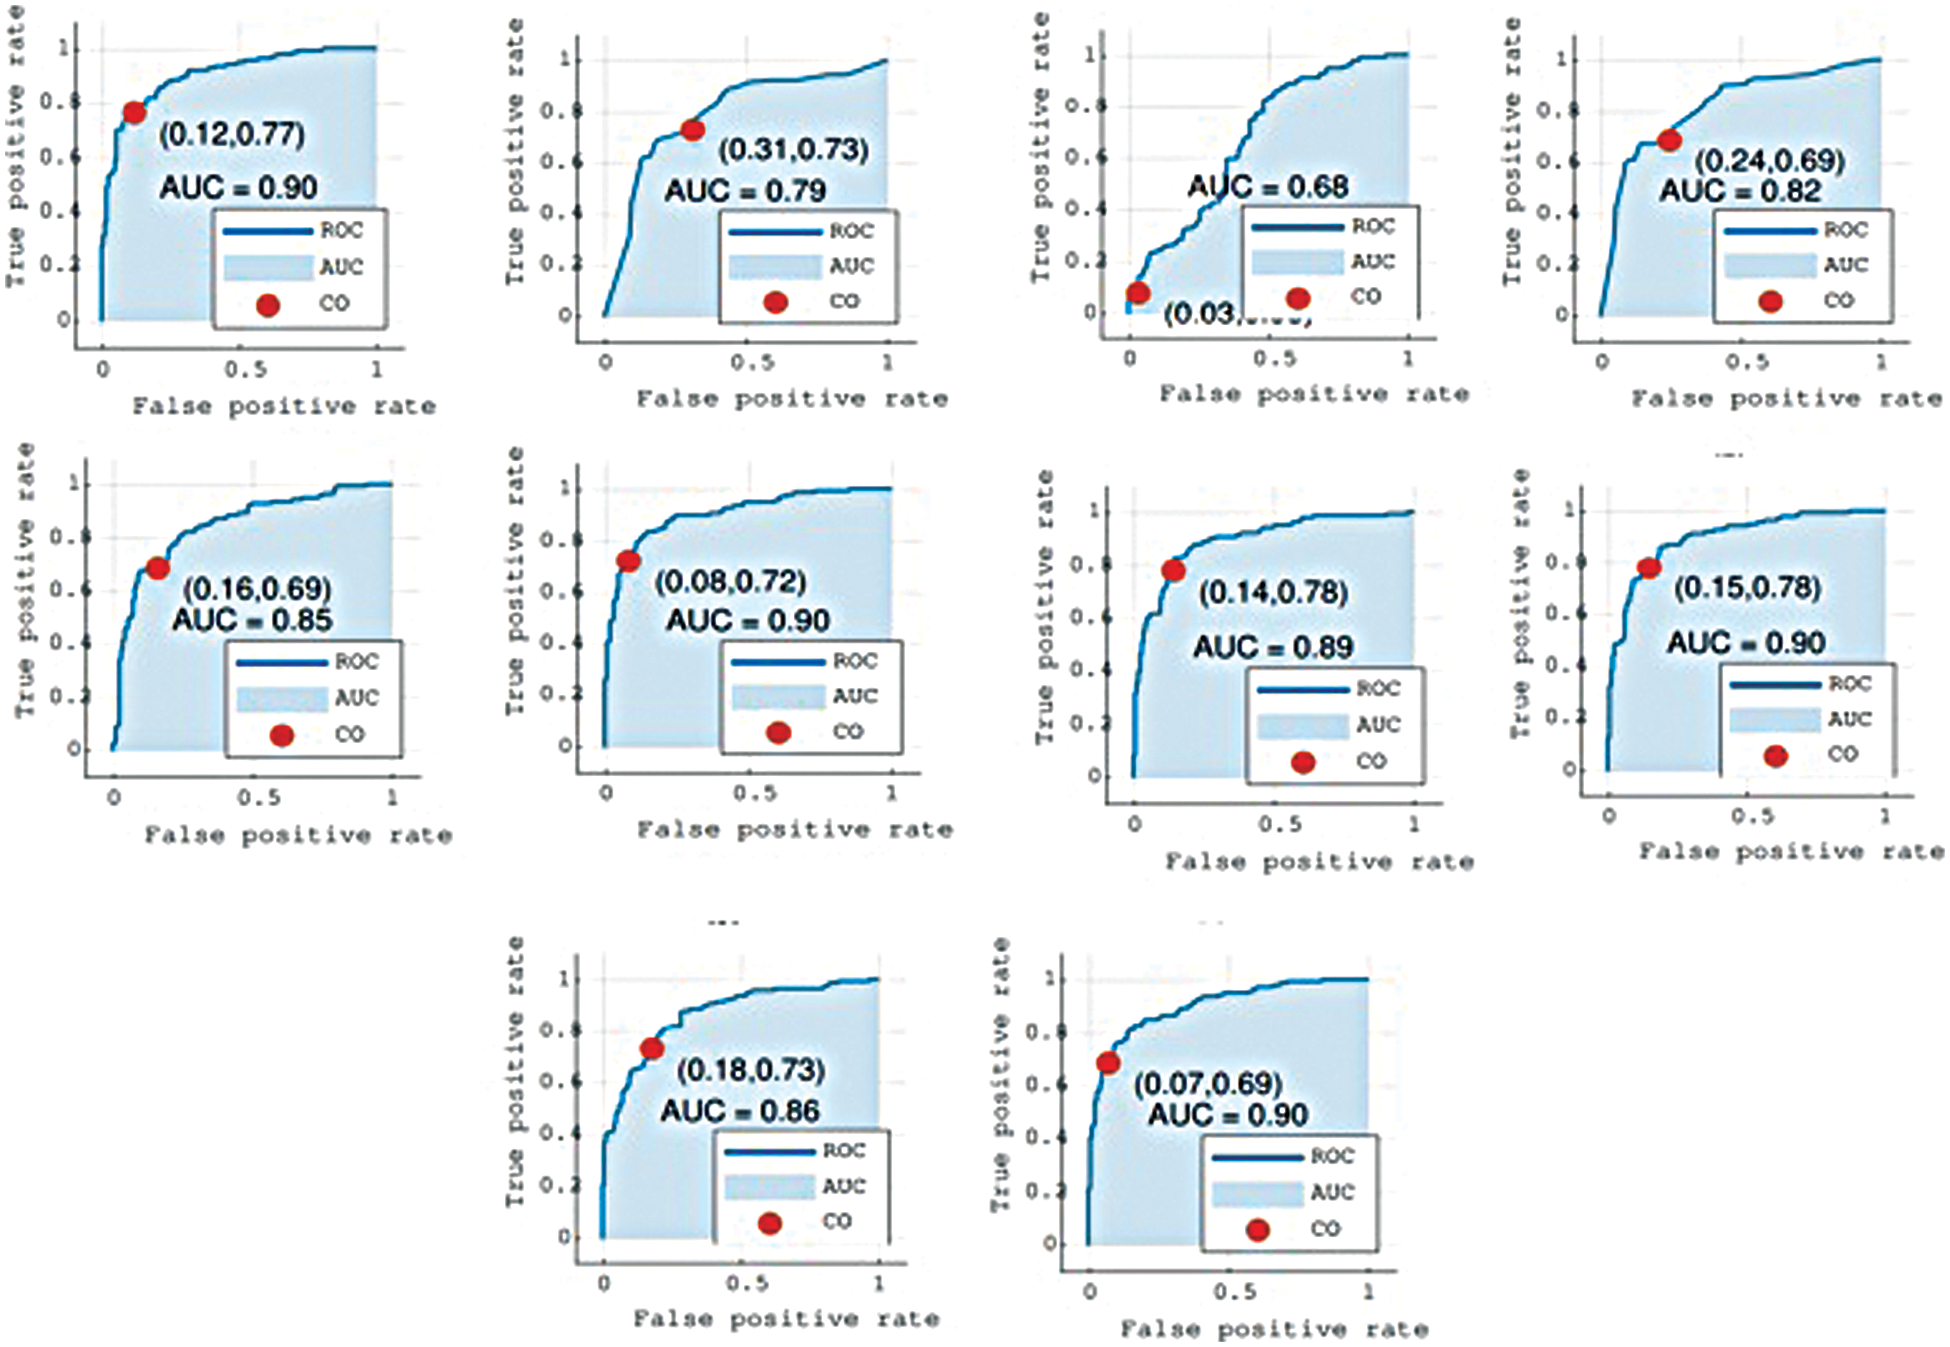
Figure 4: Graphs show the Receiver Operator Characteristics (ROC) curves for all layers L1 to L10. Cutoff (CO) represents the suitable threshold for regression-based classification and Area Under the Curve (AUC)
4.2 Effect of the Number-of-Layers
The proposed system is flexible and the number, order, and type of layers in the first stage can be changed accordingly. We experimented to study the effects of altering the sequence and number of layers in the first stage. Experiments revealed that in our case the performance of the proposed method using SVM and ANN was drastically affected when the number of layers was reduced. We tested the proposed system using layers between 7 and 10 for both models. The detailed results are shown in Table 3 for further details see Fig. 4.
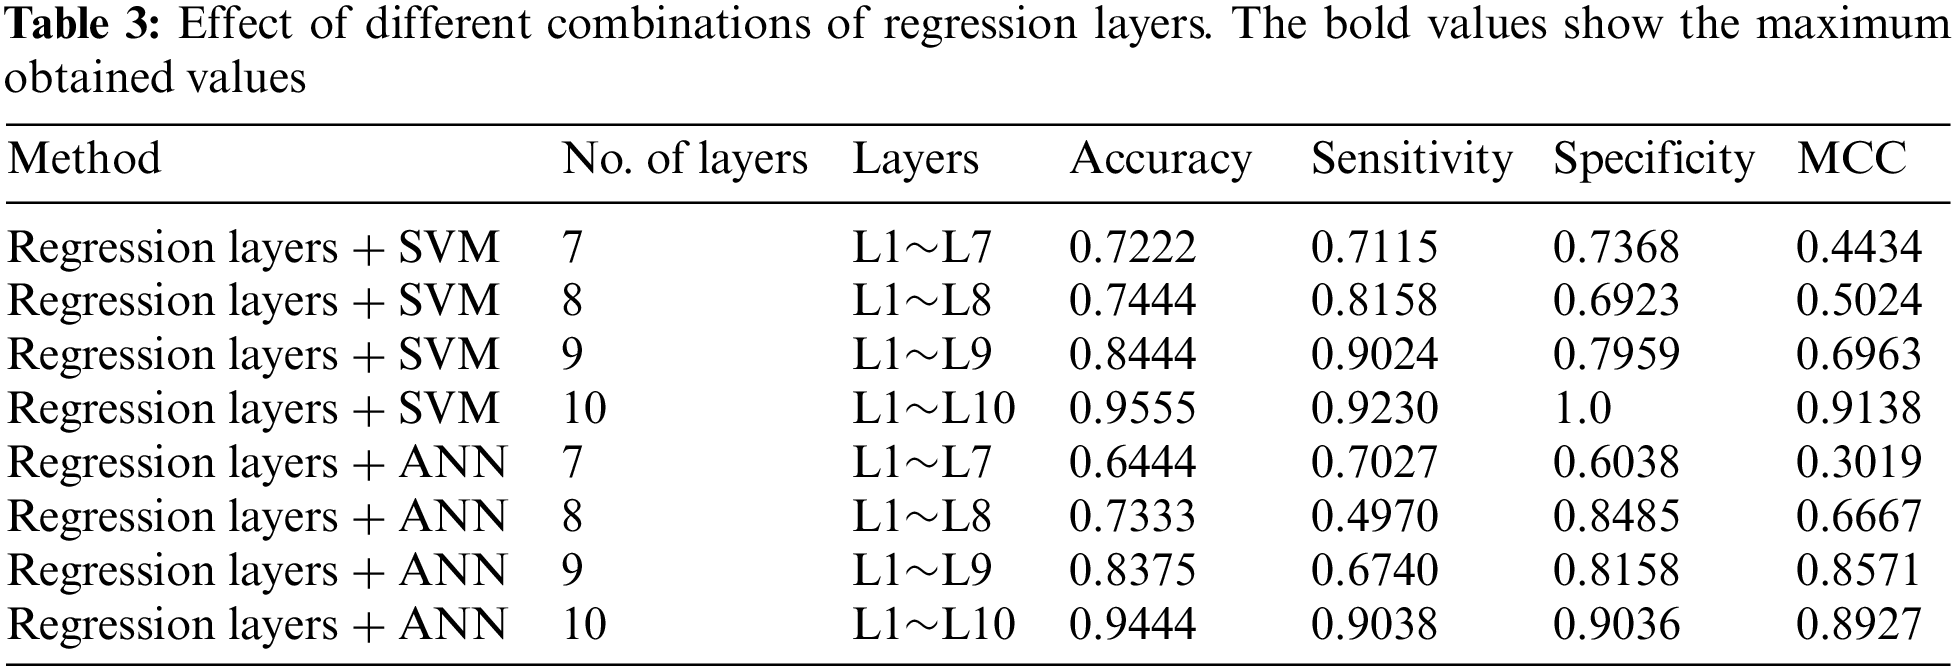
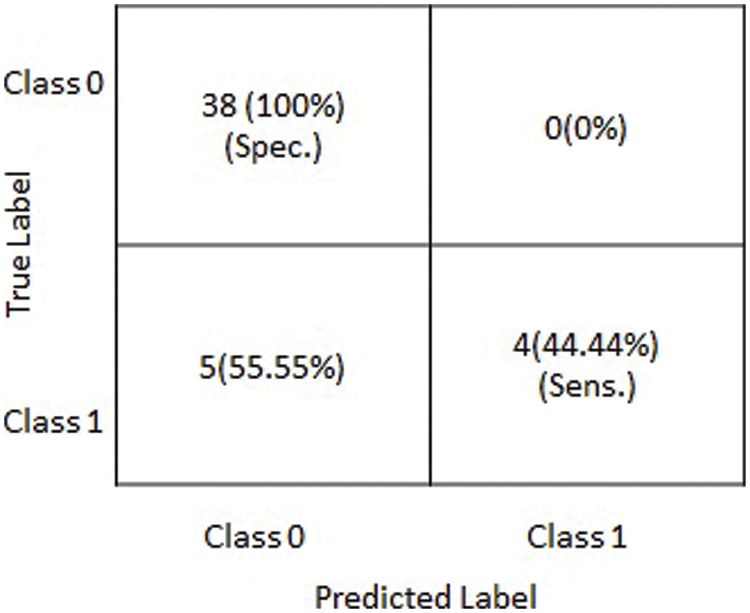
Figure 5: Graphical depiction of statistics of the obtained results on testing dataset in terms of a confusion matrix
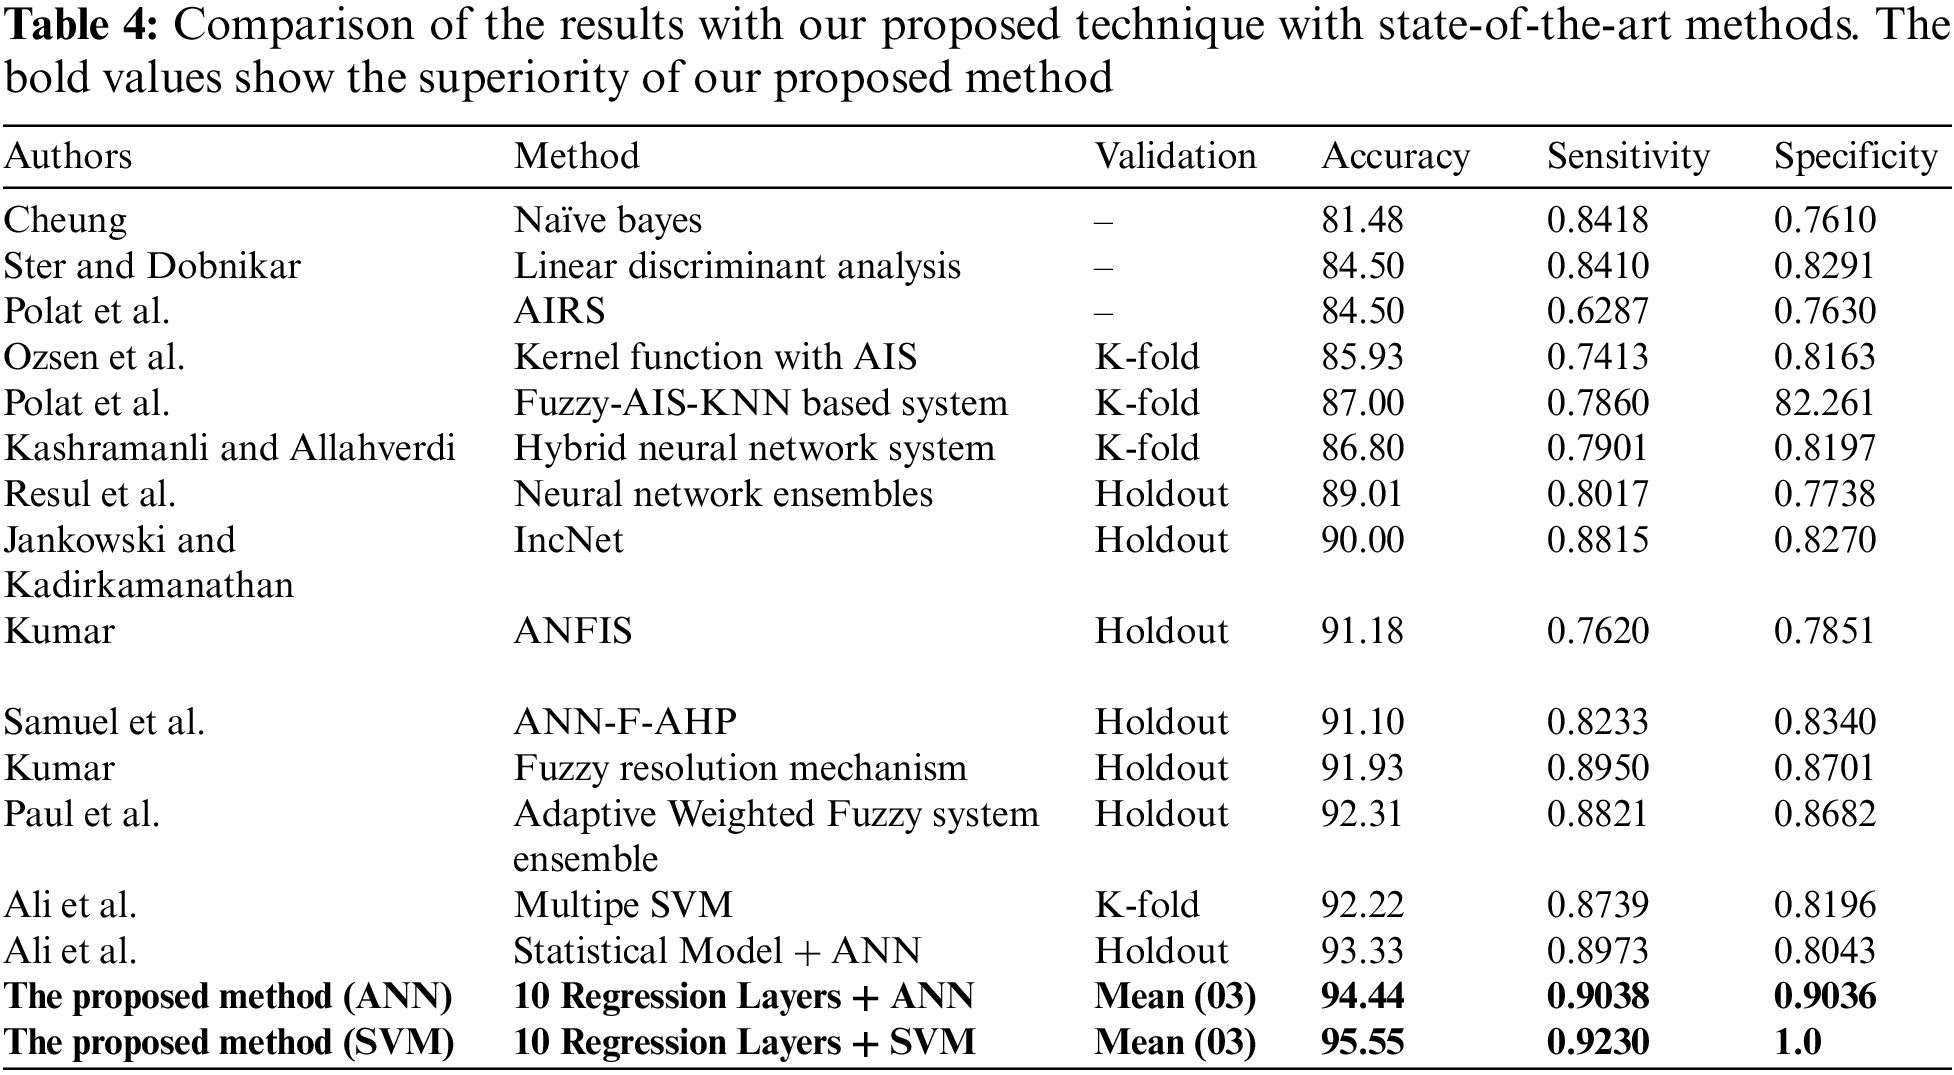
In this section, the comparison of the proposed model has been shown with the previous methods. A detailed comparison of the performance is presented in Table 4. The bold values in Table 4 show the superiority of our proposed method. Moreover, experiments revealed that there was a slight difference in performance with the first stage having 10 layers combined with SVM and ANN in the second stage. Although the difference in performance is very small, the results show that the proposed method with SVM has the best performance in terms of accuracy. Moreover, the results of the experiments show that basic statistical ML algorithms have already reached their maximum performance. New methods are required to improve the performance of smaller datasets. For further details see Table 4 given below.
Over the past decades, ML has gained a lot of importance in the field of clinical medicine and disease predictions. For complex problems and bigger datasets, researchers are now focusing more on DL-based approaches. Although DL approaches have high performance, for datasets having a small number of features and training samples DL is not feasible and some cases not applicable at all. In this paper, we proposed a method, inspired by regression analysis, which specially focuses on small but complex problems. The proposed method converts the representation of the data into probabilities. The proposed model consists of three main stages, the first stage converts the data into probabilities, the second stage can utilize SVM regression or ANN, and the third stage consists of a SoftMax and prediction section. We performed extensive experiments to validate the proposed method using heart disease detection as a case study. The experiments are performed on the Cleveland dataset. The results of the experiments show that the performance of basic statistical ML algorithms has reached stagnancy. The results obtained show higher accuracy. The proposed method’s application is not limited to heart disease detection.
The limitation of the proposed method is the difficulty of extending these findings on heart disease due to the small sample size. For future developments, we plan to apply this method to a larger dataset and perform the analysis of some other diseases with different feature selection techniques.
Funding Statement: The authors received no specific funding for this study.
Author Contributions: All authors contributed equally to this work. All authors have read and agreed to the published version of the manuscript.
Conflicts of Interest: The authors declare that they have no conflicts of interest to report regarding the present study.
References
1. J. Domingo, E. Dura and E. Göçeri, “Iteratively learning a liver segmentation using probabilistic atlases: Preliminary results,” in Proc. 15th IEEE Int. Conf. on Machine Learning and Applications (ICMLA), Anaheim, USA, pp. 593–598, 2016. [Google Scholar]
2. N. Goceri and E. Goceri, “A neural network based kidney segmentation from MR images,” in Proc. 14th IEEE Int. Conf. on Machine Learning and Applications (ICMLA), Miami, USA, pp. 1195–1198, 2015. [Google Scholar]
3. Z. Arabasadi, R. Alizadehsani, M. Roshanzamir, H. Moosaei and A. A. Yarifard, “Computer-aided decision making for heart disease detection using a hybrid neural network-genetic algorithm,” Computer Methods and Programs in Biomedicine, vol. 141, pp. 19–26, 2017. [Google Scholar] [PubMed]
4. R. Das, I. Turkoglu and A. Sengur, “Effective diagnosis of heart disease through neural networks ensembles,” Expert Systems with Applications, vol. 36, no. 4, pp. 7675–7680, 2009. [Google Scholar]
5. S. Das, A. Das, B. Mondal, N. Dey, D. Bhattacharya et al., “Genome sequence comparison under a new form of tri-nucleotide representation based on biochemical properties of nucleotides,” Gene, vol. 730, no. 1–3, pp. 144257, 2020. [Google Scholar] [PubMed]
6. H. Yan, J. Zheng, Y. Jiang, C. Peng and Q. Li, “Development of a decision support system for heart disease diagnosis using multilayer perceptron,” in Proc. IEEE Int. Symp. on Circuits and Systems (ISCAS), Bangkok, Thailand, vol. 5, pp. 15–25, 2003. [Google Scholar]
7. D. Wang, Z. Li, N. Dey, A. S. Ashour, L. Moraru et al., “Deep-segmentation of plantar pressure images incorporating fully convolutional neural networks,” Biocybernetics and Biomedical Engineering, vol. 40, no. 1, pp. 546–558, 2020. [Google Scholar]
8. J. Li, S. Fong, L. -s Liu, N. Dey, A. S. Ashour et al., “Dual feature selection and rebalancing strategy using metaheuristic optimization algorithms in x-ray image datasets,” Multimedia Tools and Applications, vol. 78, no. 15, pp. 20913–20933, 2019. [Google Scholar]
9. M. Bilal, G. Ali, M. W. Iqbal, M. Anwar, M. S. A. Malik et al., “Auto-Prep: Efficient and Robust Automated Data Preprocessing Pipeline,” IEEE Access, vol. 10, pp. 107764–107784, 2022. [Google Scholar]
10. M. Sharif, U. Tanvir, E. U. Munir, M. A. Khan and M. Yasmin, “Brain tumor segmentation and classification by improved binomial thresholding and multi-features selection,” Journal of Ambient Intelligence and Humanized Computing, vol. 15, pp. 1–20, 2018. [Google Scholar]
11. J. Yao, R. Li, S. Shen, W. Zhang, Y. Peng et al., “Combining rhythm information between heartbeats and BiLSTM-Treg algorithm for intelligent beat classification of arrhythmia,” Journal of Healthcare Engineering, vol. 2021, pp. 1–16, 2021. [Google Scholar]
12. M. A. Khan, T. Akram, M. Sharif, T. Saba, K. Javed et al., “Construction of saliency map and hybrid set of features for efficient segmentation and classification of skin lesion,” Microscopy Research and Technique, vol. 82, no. 6, pp. 741–763, 2019. [Google Scholar] [PubMed]
13. L. Cao, “Association between negative life events on mental health and college student adjustment: A mediated moderating effect,” Journal of Healthcare Engineering, vol. 2021, pp. 7, 2021. [Google Scholar]
14. T. Saba, M. A. Khan, A. Rehman and S. L. Marie-Sainte, “Region extraction and classification of skin cancer: A heterogeneous framework of deep CNN features fusion and reduction,” Journal of Medical Systems, vol. 43, no. 9, pp. 1–19, 2019. [Google Scholar]
15. M. A. Khan, M. Y. Javed, M. Sharif, T. Saba and A. Rehman, “Multi-model deep neural network based features extraction and optimal selection approach for skin lesion classification,” in Proc. 2019 Int. Conf. on Computer and Information Sciences (ICCIS), Sakaka, Saudi Arabia, IEEE, pp. 1–7, 2019. [Google Scholar]
16. F. Shi, G. Chen, Y. Wang, N. Yang, Y. Chen et al., “Texture features based microscopic image classification of liver cellular granuloma using artificial neural networks,” in 2019 IEEE 8th Joint Int. Information Technology and Artificial Intelligence Conf. (ITAIC), Chongqing, China, IEEE, pp. 432–439, 2019. [Google Scholar]
17. S. Borra, R. Thanki, N. Dey and K. Borisagar, “Secure transmission and integrity verification of color radiological images using fast discrete curvelet transform and compressive sensing,” Smart Health, vol. 12, no. 3, pp. 35–48, 2019. [Google Scholar]
18. S. Amjad, M. Younas, M. Anwar, Q. Shaheen, M. Shiraz et al., “Data mining techniques to analyze the impact of social media on the academic performance of high school students,” Wireless Communications and Mobile Computing, vol. 2022, no. 2, pp. 1–11, 2022. [Google Scholar]
19. E. Goceri, “Skin disease diagnosis from photographs using deep learning,” in Proc. ECCOMAS Thematic Conf. on Computational Vision and Medical Image Processing, Porto, Portugal, pp. 239–246, 2019. [Google Scholar]
20. E. Goceri, “Challenges and recent solutions for image segmentation in the era of deep learning,” in Proc. 2019 Ninth Int. Conf. on Image Processing Theory, Tools, and Applications (IPTA), Istanbul, Turkey, IEEE, pp. 1–6, 2019. [Google Scholar]
21. E. Goceri, “Analysis of deep networks with residual blocks and different activation functions: Classification of skin diseases,” in Proc. 2019 Ninth Int. Conf. on Image Processing Theory, Tools, and Applications (IPTA), Istanbul, Turkey, pp. 1–6, 2019. [Google Scholar]
22. E. Goceri, “Formulas behind deep learning success,” in Proc. Int. Conf. on Applied Analysis and Mathematical Modeling (ICAAMM2018), Istanbul, Turkey, pp. 34–41, 2018. [Google Scholar]
23. E. Goceri and A. Gooya, “On the importance of batch size for deep learning,” in Proc. Int. Conf. on Mathematics (ICOMATH2018An Istanbul Meeting for World Mathematicians, Istanbul, Turkey, pp. 430–435, 2018. [Google Scholar]
24. P. Ramani, N. Pradhan and A. K. Sharma, “Classification algorithms to predict heart diseases—A survey,” in Computer Vision and Machine Intelligence in Medical Image Analysis, in Proc. IEEE International Symposium on Circuits and Systems, Singapore, pp. 65–71, 2020. [Google Scholar]
25. S. Ghodake, S. Ghumbre and S. Deshmukh, “Electrocardiogram signal denoising using hybrid filtering for cardiovascular diseases prediction,” in Techno-Societal 2018. Cham: Springer, pp. 271–278, 2020. [Google Scholar]
26. H. Qiu and W. Du, “Evaluation of the effect of PDCA in hospital health management,” Journal of Healthcare Engineering, vol. 2021, pp. 7, 2020. [Google Scholar]
27. M. A. Khan, “An IoT framework for heart disease prediction based on MDCNN classifier,” IEEE Access, vol. 8, pp. 34717–34727, 2020. [Google Scholar]
28. L. Ali, S. U. Khan and M. Asif, “Early detection of heart failure by reducing the time complexity of the machine learning based predictive model,” in Proc. 2019 Int. Conf. on Electrical, Communication, and Computer Engineering (ICECCE), Swat, Pakistan, pp. 1–5, 2019. [Google Scholar]
29. A. Javeed, S. Zhou, L. Yongjian, I. Qasim, A. Noor et al., “An intelligent learning system based on random search algorithm and optimized random forest model for improved heart disease detection,” IEEE Access, vol. 7, pp. 180235–180243, 2019. [Google Scholar]
30. H. Takci, “Improvement of heart attack prediction by the feature selection methods,” Turkish Journal of Electrical Engineering and Computer Sciences, vol. 26, no. 1, pp. 1–10, 2018. [Google Scholar]
31. R. Saini, N. Bindal and P. Bansal, “Classification of heart diseases from ECG signals using wavelet transform and kNN classifier,” in Proc. Int. Conf. on Computing, Communication & Automation, Greater Noida, India, IEEE, pp. 1208–1215, 2015. [Google Scholar]
32. A. R. V. Rosendael, G. Maliakal, K. K. Kolli, A. Beecy, S. J. AlAref et al., “Maximization of the usage of coronary CTA derived plaque information using a machine learning based algorithm to improve risk stratification; insights from the CONFIRM registry,” Journal of Cardiovascular Computed Tomography, vol. 12, no. 3, pp. 204–209, 2018. [Google Scholar] [PubMed]
33. V. Chaurasia and S. Pal, “Early prediction of heart diseases using data mining techniques,” Caribbean Journal of Science and Technology, vol. 1, pp. 208–217, 2013. [Google Scholar]
34. N. Cheung, “Machine learning techniques for medical analysis,” Ph.D dissertation School of Information Technology and Electrical Engineering, China, 2001. [Google Scholar]
35. B. Šter and A. Dobnikar, “Neural networks in medical diagnosis: Comparison with other methods,” in Proc. Int. Conf. on Engineering Applications of Neural Networks, London, United Kingdom, pp. 427–430, 2009. [Google Scholar]
36. S. Ozsen, S. Gunes, S. Kara and F. Latifoglu, “Use of kernel functions in artificial immune systems for the nonlinear classification problems,” IEEE Transactions on Information Technology in Biomedicine, vol. 13, no. 4, pp. 621–628, 2009. [Google Scholar] [PubMed]
37. K. Polat, S. Şahan and S. Güneş, “Automatic detection of heart disease using an artificial immune recognition system (AIRS) with fuzzy resource allocation mechanism and K-NN (nearest neighbour) based weighting preprocessing,” Expert Systems with Applications, vol. 32, no. 2, pp. 625–631, 2007. [Google Scholar]
38. A. Kumar, “Diagnosis of heart disease using fuzzy resolution mechanism,” Journal of Artificial Intelligence (Faisalabad), vol. 5, no. 1, pp. 47–55, 2012. [Google Scholar]
39. S. Moein, “Multi-model deep neural network based features extraction and optimal selection approach for skin lesion classification,” Medical Diagnosis using Artificial Neural Networks: IGI Global, vol. 12, no. 5, pp. 421–428, 2014. [Google Scholar]
40. A. K. Dwivedi, “Performance evaluation of different machine learning techniques for prediction of heart disease,” Neural Computing and Applications, vol. 29, no. 10, pp. 685–693, 2018. [Google Scholar]
41. L. Ali, A. Niamat, J. A. Khan, N. A. Golilarz, X. Xingzhong et al., “An optimized stacked support vector machines based expert system for the effective prediction of heart failure,” IEEE Access, vol. 7, pp. 54007–54014, 2019. [Google Scholar]
42. A. Rehman, M. A. Khan, Z. Mehmood, T. Saba, M. Sardaraz et al., “Microscopic melanoma detection and classification: A framework of pixel-based fusion and multilevel features reduction,” Microscopy Research and Technique, vol. 83, no. 4, pp. 410–423, 2020. [Google Scholar] [PubMed]
43. K. Saxena and R. Sharma, “Efficient heart disease prediction system,” Procedia Computer Science, vol. 85, no. 10, pp. 962–969, 2016. [Google Scholar]
44. M. Anwar, F. Masud, R. A. Butt, S. M. Idrus, M. N. Ahmad et al., “Traffic priority-aware medical data dissemination scheme for IoT based WBASN healthcare applications,” Computers Materials & Continua, vol. 71, no. 3, pp. 4443–4456, 2022. [Google Scholar]
45. M. P. S. C. Reddy, M. P. Palagi and S. Jaya, “Heart disease prediction using ANN algorithm in data mining,” International Journal of Computer Science and Mobile Computing, vol. 6, no. 4, pp. 168–172, 2017. [Google Scholar]
46. S. Naseem, A. Alhudhaif, M. Anwar, K. N. Qureshi and G. Jeon, “Artificial general intelligence based rational behavior detection using cognitive correlates for tracking online harms,” Personal and Ubiquitous Computing, vol. 2022, pp. 1–19, 2022. [Google Scholar]
47. J. Patel, D. T. Upadhyay and S. Patel, “Heart disease prediction using machine learning and data mining technique,” Heart Disease, vol. 7, no. 1, pp. 129–137, 2015. [Google Scholar]
48. B. Bahrami and M. H. Shirvani, “Prediction and diagnosis of heart disease by data mining techniques,” Journal of Multidisciplinary Engineering Science and Technology (JMEST), vol. 2, no. 2, pp. 164–168, 2015. [Google Scholar]
49. N. Ajam, “Heart diseases diagnoses using artificial neural network,” IISTE Network and Complex Systems, vol. 5, no. 4, pp. 120–131, 2015. [Google Scholar]
50. S. Prabhavathi and D. Chitra, “Analysis and prediction of various heart diseases using DNFS techniques,” International Journal of Innovations in Scientific and Engineering Research, vol. 2, no. 1, pp. 1–7, 2016. [Google Scholar]
51. S. H. Mujawar and P. Devale, “Prediction of heart disease using modified k-means and by using Naive Bayes,” International Journal of Innovative Research in Computer and Communication Engineering (An ISO 3297: 2007 Certified Organization), vol. 3, no. 10, pp. 10265–10273, 2015. [Google Scholar]
52. M. Marimuthu, M. Abinaya, K. Hariesh, K. Madhankumar and V. Pavithra, “A review on heart disease prediction using machine learning and data analytics approach,” International Journal of Computer Applications, vol. 181, no. 18, pp. 20–25, 2018. [Google Scholar]
53. M. F. Siddiqui, G. Mujtaba, A. W. Reza and L. Shuib, “Multi-class disease classification in brain MRIs using a computer-aided diagnostic system,” Symmetry, vol. 9, no. 3, pp. 37–46, 2019. [Google Scholar]
54. W. Wiharto, H. Kusnanto and H. Herianto, “Interpretation of clinical data based on C4. 5 algorithms for the diagnosis of coronary heart disease,” Healthcare Informatics Research, vol. 22, no. 3, pp. 186–195, 2016. [Google Scholar] [PubMed]
55. S. H. Han, K. O. Kim, E. J. Cha, K. A. Kim and S. H. Shon, “System framework for cardiovascular disease prediction based on big data technology,” Symmetry, vol. 9, no. 12, pp. 293, 2017. [Google Scholar]
56. M. A. Khan, M. I. Sharif, M. Raza, A. Anjum and T. Saba, “Skin lesion segmentation and classification: A unified framework of deep neural network features fusion and selection,” Expert Systems, vol. 39, no. 7, pp. e12497, 2019. [Google Scholar]
57. M. A. Khan, M. Sharif, T. Akram, S. A. C. Bukhari and R. S. Nayak, “Developed newton-raphson based deep features selection framework for skin lesion recognition,” Pattern Recognition Letters, vol. 129, no. 4/5, pp. 293–303, 2020. [Google Scholar]
58. A. Majid, M. A. Khan, M. Yasmin, A. Rehman, A. Yousafzai et al., “Classification of stomach infections: A paradigm of convolutional neural network along with classical features fusion and selection,” Microscopy Research and Technique, vol. 83, no. 5, pp. 562–576, 2020. [Google Scholar] [PubMed]
59. H. Kahramanli and N. Allahverdi, “Design of a hybrid system for diabetes and heart diseases,” Expert Systems with Applications, vol. 35, no. 1–2, pp. 82–89, 2008. [Google Scholar]
60. N. Jankowski and V. Kadirkamanathan, “Statistical control of RBF-like networks for classification,” in Int. Conf. on Artificial Neural Networks, Berlin, Heidelberg, Springer, pp. 385–390, 1997. [Google Scholar]
61. P. Spurek, “General split gaussian cross-entropy clustering,” Expert Systems with Applications, vol. 68, no. 4, pp. 58–68, 2017. [Google Scholar]
62. M. Anwar, A. H. Abdullah, A. Altameem, K. N. Qureshi, F. Masud et al., “Green communication for wireless body area networks: Energy aware link efficient routing approach,” Sensors, vol. 18, no. 10, pp. 3237, 2018. [Google Scholar] [PubMed]
63. B. C. Kwon, V. Anand, K. A. Severson, S. Ghosh, Z. Sun et al., “DPVis: Visual analytics with hidden Markov models for disease progression pathways,” IEEE Transactions On Visualization and Computer Graphics, vol. 27, no. 9, pp. 3685–3700, 2020. [Google Scholar]
64. M. J. Gacto, J. M. Soto-Hidalgo, J. Alcalá-Fdez and R. Alcalá, “Experimental study on 164 algorithms available in software tools for solving standard non-linear regression problems,” IEEE Access, vol. 7, pp. 108916–108939, 2019. [Google Scholar]
65. H. Cai, X. Jia, J. Feng, W. Li, Y. -M. Hsu et al., “Gaussian process regression for numerical wind speed prediction enhancement,” Renewable Energy, vol. 146, pp. 2112–2123, 2020. [Google Scholar]
66. M. A. Khan, M. Rashid, M. Sharif, K. Javed and T. Akram, “Classification of gastrointestinal diseases of the stomach from WCE using improved saliency-based method and discriminant features selection,” Multimedia Tools and Applications, vol. 78, no. 19, pp. 27743–27770, 2019. [Google Scholar]
67. M. Nazir, M. A. Khan, T. Saba and A. Rehman, “Brain tumor detection from MRI images using multi-level wavelets,” in Proc. 2019 Int. Conf. On Computer and Information Sciences (ICCIS), Sakaka, Saudi Arabia, pp. 1–5, 2019. [Google Scholar]
68. M. A. Khan, T. Akram, M. Sharif, K. Javed, M. Rashid et al., “An integrated framework of skin lesion detection and recognition through saliency method and optimal deep neural network features selection,” Neural Computing and Applications, vol. 32, no. 20, pp. 15929–15948, 2020. [Google Scholar]
69. M. Sharif, M. Attique Khan, M. Rashid, M. Yasmin, F. Afzal et al., “Deep CNN and geometric features-based gastrointestinal tract diseases detection and classification from wireless capsule endoscopy images,” Journal of Experimental & Theoretical Artificial Intelligence, vol. 33, no. 4, pp. 577–599, 2021. [Google Scholar]
70. M. A. Khan, M. Sharif, T. Akram, M. Yasmin and R. S. Nayak, “Stomach deformities recognition using rank-based deep features selection,” Journal of Medical Systems, vol. 43, no. 12, pp. 1–15, 2019. [Google Scholar]
71. M. I. Sharif, J. P. Li, M. A. Khan and M. A. Saleem, “Active deep neural network features selection for segmentation and recognition of brain tumors using MRI images,” Pattern Recognition Letters, vol. 129, no. 10, pp. 181–189, 2020. [Google Scholar]
72. M. A. Khan, M. A. Khan, F. Ahmed, M. Mittal, L. M. Goyal et al., “Gastrointestinal diseases segmentation and classification based on duo-deep architectures,” Pattern Recognition Letters, vol. 13, pp. 193–204, 2020. [Google Scholar]
73. M. A. Khan, S. Rubab, A. Kashif, M. I. Sharif, N. Muhammad et al., “Lungs cancer classification from CT images: An integrated design of contrast based classical features fusion and selection,” Pattern Recognition Letters, vol. 129, pp. 77–85, 2020. [Google Scholar]
Cite This Article
 Copyright © 2023 The Author(s). Published by Tech Science Press.
This work is licensed under a Creative Commons Attribution 4.0 International License , which permits unrestricted use, distribution, and reproduction in any medium, provided the original work is properly cited.
 Downloads
 Citation Tools