
 Submit a Paper
 Propose a Special lssue
 Open Access
ARTICLE

Enhanced Water Quality Control Based on Predictive Optimization for Smart Fish Farming
1 Department of Applied Informatics, Kimyo International University in Tashkent, Tashkent, 100121, Uzbekistan
2 Department of Computer Science, Virtual University of Pakistan, Lahore, 54000, Pakistan
3 Department of Computer Engineering, Jeju National University, Jeju, 63243, Korea
* Corresponding Author: DoHyeun Kim. Email:
Computers, Materials & Continua 2023, 75(3), 5471-5499. https://doi.org/10.32604/cmc.2023.036898
Received 15 October 2022; Accepted 23 December 2022; Issue published 29 April 2023
 View Full Text
 Download PDF
Abstract
The requirement for high-quality seafood is a global challenge in today’s world due to climate change and natural resource limitations. Internet of Things (IoT) based Modern fish farming systems can significantly optimize seafood production by minimizing resource utilization and improving healthy fish production. This objective requires intensive monitoring, prediction, and control by optimizing leading factors that impact fish growth, including temperature, the potential of hydrogen (pH), water level, and feeding rate. This paper proposes the IoT based predictive optimization approach for efficient control and energy utilization in smart fish farming. The proposed fish farm control mechanism has a predictive optimization to deal with water quality control and efficient energy consumption problems. Fish farm indoor and outdoor values are applied to predict the water quality parameters, whereas a novel objective function is proposed to achieve an optimal fish growth environment based on predicted parameters. Fuzzy logic control is utilized to calculate control parameters for IoT actuators based on predictive optimal water quality parameters by minimizing energy consumption. To evaluate the efficiency of the proposed system, the overall approach has been deployed to the fish tank as a case study, and a number of experiments have been carried out. The results show that the predictive optimization module allowed the water quality parameters to be maintained at the optimal level with nearly 30% of energy efficiency at the maximum actuator control rate compared with other control levels.Keywords
Fish farming is one of the world’s largest and fastest-growing food production sectors and it is expected to play the predominant role in overcoming the requirement for seafood in the future [1]. Fish farming is the raising, breeding, and harvesting of various fish types in fish tanks and ponds in a fully or partly controlled environment to produce fish products during the year [2]. It is a widely suggested field for investing money because it supports the year-round production of fresh fish resources, with around a 40% increased production rate compared to natural fish hunting [3]. Water quality is vital to achieving optimal productivity and enlarging healthy fish. Water quality parameters include temperature, pH, dissolved oxygen, conductivity, and just a number of a few substances [4,5]. Misbalancing the required water parameters leads to high water pollution and resource wastage, resulting in several diseases for fish and unexpected costs, respectively [6]. Therefore, optimizing water quality and resource control plays a crucial role in balancing the overall operational cost and estimating the fish’s condition in tanks. The fish farming systems’ optimal control and efficient resource utilization approaches were proposed by considering economic features with various optimization algorithms [7]. Most of these solutions pay attention to increasing the management and financial aspects of fish farming systems by considering the harvesting period, market type, and customer behavior [8–10]. However, these studies mainly focus on building a general financial framework and do not propose the environmental features of fish tanks. Other studies have examined the impacts of various factors, including the fish price and mortality rate, to compute the optimal fish feeding scheme [11,12]. Thus, there are pressing requirements for the development of enhanced aquaculture techniques that advance fish farm management by optimizing environmental parameters [13]. Furthermore, optimal control techniques that can be deployed in practice are essential to overcome several challenges in implementing real-life solutions of fish farming systems due to various indoor and outdoor environmental parameters.
Modern fish farming systems can take advantage of integrating new technological advancements and algorithms, such as IoT, machine learning, optimization, and optimal control theory. However, conventional control solutions are unsuitable due to various biological constraints of the fish farm environment and its essential components [14]. Hence, optimal fish farming control is generally obtained as an optimization problem to ensure the desired growth and healthy fish production, resource utilization, and optimal environment determined by various constraints, water quality, environmental values, control parameters, and user-desired factors, as depicted in Fig. 1 below.

Figure 1: The predictive optimization-based control framework
Integrating state-of-the-art technological advancements and policies can promote sustainable fish farm production with optimal resource utilization and control. However, a limited number of optimal fish farming systems consider the various parameters of fish farming for optimal decision-making without any human intervention [15].
Predictive analytics utilizes data mining, statistical techniques, predictive modeling, artificial intelligence (AI), and machine learning to identify the likelihood of unknown events based on historical data. Predictive analytics is widely used in industries such as business, healthcare, medicine, pharmaceuticals, aerospace engineering, manufacturing, and just a few to forecast future outcomes by applying various historical parameters [16–18]. Mathematical optimization aims to minimize or maximize existing solutions by systematically applying the input values within the allowed set of options and is mainly used in mathematics, engineering, economics, and computer science [19,20]. In other words, optimization is the scientific and mathematical field for detecting optimal solutions under pre-defined constraints and assumptions over the set of available alternatives [21]. Modern optimization algorithms, such as genetic algorithms, particle swarm optimization (PSO), and whale optimizations, have emerged to solve complex engineering problems in resource allocation [22], network routing optimization [23], greenhouse [24], and other areas. Optimal control and efficient utilization of resources in fish farming has magnificent importance in fish farming. In the design and installation process, accurate prediction of fish farm environmental parameters can produce enhanced results for future decision-making in fish farm environment control with efficient resource utilization. Integrating the optimization algorithm with the prediction module (predictive optimization) allows for achieving the most optimum results compared with traditional methods.
In this paper, we propose a novel predictive optimization-assisted smart fish farm control mechanism for solving water quality prediction and optimization problems with efficient energy consumption. Our proposed mechanism can predict water quality parameters in advance, and according to the predicted parameters an objective function computes the optimum water quality parameters for fish growth. Afterward, those optimal water quality parameters are applied to a fuzzy logic control module to automatically compute and set the activation period and operational level for actuators. The contribution of this paper involves the following four phases:
• Firstly, the development of embedded hardware by installing sensors and actuators to the fish tank environment for real-time water temperature, pH, conductivity and water level data gathering.
• Secondly, the development of fish farm software environment using predictive optimization mechanism to predict and calculate the most optimal water quality parameters for fish growth.
• Thirdly, the development of the fuzzy logic-based control module to compute and set control values for actuators with energy efficiency using the predicted and optimal water quality parameters.
• Lastly and most importantly, the deployment of the overall mechanism to the fish tank.
The outline of the rest of the paper is structured as follows. Section 2 highlights water quality optimization and control solutions for smart fish farming. Section 3 represents the proposed system architecture, detailed predictive optimization formulation, and control modules. Section 5 illustrates the experimental setup and the obtained result analysis. Finally, Section 6 includes the conclusion and future work directions.
Water quality control and efficient resource utilization are essential for improving fish farming effectiveness [25,26]. This section of the paper discusses a literature review of essential fish farm water quality control and optimal resource utilization solutions. Some of the research focuses on automatically controlling the fish farm environment by developing user-friendly IoT applications without optimization and predictive analytics. Other related studies propose the fish farm environment prediction and optimization without control methods.
IoT-based applications in aquaculture are used to increase fish production and quality and decrease costs. These applications have been helping fish farmers make clearer and better decisions [27,28]. South Korea’s largest telecommunications operator South Korean (SK) Telecom introduced an IoT-based fish farm management concept in North Jeolla Province [29]. Their proposed system increases the fish farm management process by connecting wireless embedded devices, and it helps to enable farmers to monitor their fish tanks remotely through their smartphones in real-time. Fishpond sensors continuously check water temperature, oxygen, and pH to detect minor water changes. SK Telecom’s open IoT platform controls the data flow through the IoT Gateway and then analyzes the data, and the current environment results of the fish tank are sent automatically in real-time.
One of the widely used IoT-based applications in the aquaculture field is Indian Eruvaka technology [30]. Their platform continuously monitors the water temperature and oxygen condition, and the user can check the fish farm environment and fish feeding processes through the mobile application. This system helps to maximize profit by minimizing the monitoring cost. Shareef et al. [31] presented the real-time aquaculture environment monitoring framework based on IoT, with developing sensor nodes, actuator nodes, stations, and decision-making units. In that study, the measurement of the chemical parameters of the water was collected in the database, and notifications were sent to the user to analyze the current condition of the fish farm. Based on decision-making rules, actuator nodes were activated to improve the water quality.
Wu et al. [32] proposed an aquaculture multi-parameter monitoring system that included accurate data collection, real-time data analysis, process control, and notification services. Their proposed system structure was based on the master-slave concept of the network, fish tanks’ temperature, salinity, and dissolved oxygen (DO) sensors collected data from the environment as a slave, and the collected sensing parameters were sent to the Master unit. A Wireless sensors-based aquaculture monitoring system was introduced in this study [33]. Their proposed system had sensors to monitor the fish tank’s pH, oxygen, water level, and temperature values via the various IoT sensors, and the ZigBee protocol was used to forward the collected sensing data to the server. Moreover, they developed a rule-based control module to activate or deactivate the water pump actuator based on sensing values. The rule-based control module included IF-THEN rules for activating the actuators. For example, if the current water level is below the user’s assigned threshold, the water pump is activated to increase the water level to the user’s preferred level. If the sensor detects the overflow from the tank, then it automatically activates the overflow system to decrease the water level.
Lafont et al. [34] presented the real-time monitoring of water parameters and algorithmic prediction for the aquaculture industry. That approach was divided into two phases: in the first phase, the Agile IoT module, water quality sensors, LoRaWan module, electronic card, and antenna were employed to collect real-time water quality data. Then, the collected data utilized the optimal autoregressive integrated moving average (ARIMA) model to forecast the dissolved oxygen and water temperature.
Liu et al. [35] discussed a support vector regression (SVR) based prediction model to address the aquaculture water quality prediction problem. The proposed hybrid approach could select the optimal parameters of SVR using real-valued genetic algorithms. After that, those optimal parameters were used to build the SVR models. The authors’ proposed approach outperformed predicting water quality but had not focused on controlling water quality parameters in real-time.
An optimization-assisted water pump control approach was proposed in [36] to achieve the minimum energy consumption in smart fish farming. The proposed optimization scheme can achieve a trade-off pumping duration and flow rate to reach the optimal water level. Whereas the Kalman filter algorithm was formulated to predict the water level. The proposed system was accurate enough to provide the optimal water level to the fish tank and could be extended with other water quality parameters.
Table 1 summarizes comparisons between the proposed approach and a number of well-known fish farm environment monitoring and control solutions. Existing studies are summarized based on features, including the approach’s goal, used IoT sensors, availability of water quality prediction with type of the prediction method, water quality optimization and its type, and control methods of parameters, and energy efficiency of given studies.

To the best of the authors’ knowledge, predictive optimization based on fish farm water quality and efficient resource utilization control mechanisms has not been thoroughly investigated in smart fish farming. Most existing approaches aim to control fish farm water quality parameters based on current sensing values. If the sensor-detected water quality parameters exceed the desired threshold, fish farmers receive alarms and notifications, and then fish farmers must turn on/off actuators manually or remotely. However, we improved traditional methods with more advanced functionalities; predictive optimization has been proposed to predict future water quality parameters, and those predictive parameters are applied to the optimization module to compute the most acceptable values for fish growth based on fish farmer requirements. Furthermore, the fuzzy logic-assisted control module allows to compute and set operational time and rate for actuators with energy efficiency. Control module automatically sets required control values without human intervention. However, this work has several limitations; on the one hand, the correlation between water quality parameters and their impacts changes each other. On the other hand, as the number of IoT devices and water quality parameters increases, the computation of prediction, optimization and control modules influence the overall operational process.
3 Proposed Predictive Optimization-Based Smart Fish Farm Mechanism
This section of the paper encompasses applied methods for implementing the proposed predictive optimization-assisted smart fish farm control mechanism. The overall scenario has been described briefly in the following subsections.
The detailed horizontal layered view of the proposed system design is illustrated in Fig. 2. The layered view comprises three layers: environment of interest, IoT-based hardware environment, and software environment. The IoT hardware environment is employed with a number of sensors to gather contextual information from the environment of interest. The software environment is responsible for analyzing, predicting, and computing the optimal water quality parameters for healthy fish growth based on collected and real-time data. In the software’s control section, the predicted and optimal water quality parameters are used to calculate the actuator nodes’ operational level and activation period. Actuators are controlled based on a set of rules provided by the software’s control module.

Figure 2: Horizontal layered view of the smart fish farm control mechanism
The detailed conceptual design of the proposed system is presented in Fig. 3. We have implemented and deployed an integrated system comprising four main modules: IoT data collection, context awareness, predictive optimization, and control. The implementation of the proposed system includes four main phases:
• The first phase is implementing an IoT hardware environment that comprises two nodes: sensor nodes and actuators. Sensor nodes’ responsibility is to collect temperature, pH, water, and conductivity levels from the fish tank to measure the actual water quality accurately. While actuator nodes (heater, cooler, water pump, pH, and conductivity actuators) are used to control the water quality parameters based on control values provided by the fuzzy logic control module. More precisely, the control module assigns the required on/off time to the actuators with minimum energy consumption.
• The second phase is implementing the context-awareness module, which analyzes several essential parameters of the proposed system. This module allows the analysis of sensing values; the fish farmer preferred minimum and maximum water quality parameters, outdoor environmental parameters, and actuator control parameters. This module is considered a pre-processing data module.
• Afterward, the pre-processed data is applied to the predictive optimization module. This module is divided into two sub-modules: prediction and optimization. Recurrent Neural Network-Long Short Term Memory (RNN-LSTM)-based prediction module accurately predicts future water quality parameters based on indoor water quality and outdoor environmental parameters. While the objective function-based optimization approach computes the optimum water quality based on predicted water quality.
• In the fourth phase, a Fuzzy logic-based control module is implemented to compute optimal control values to the actuators using predicted and optimal water quality parameters. The control module aims to assign the required operational level and activation period to the actuators without human intervention.
• Furthermore, we also implemented the communication layer that comprises an IoT server, IoT gateway, and communication protocols such as Hypertext Transfer Protocol (HTTP). An Arduino equipped with an Open aquarium fish tank monitoring toolkit, manufactured by Libelium, has been used as an IoT gateway. The gateway forwards the collected water quality parameters data to the Apache HTTP server.

Figure 3: The detailed conceptual architecture of predictive optimization-based optimal fish farm control mechanism
3.2 Long Short-Term Memory Prediction Module
Long Short-Term Memory Networks (LSTM) is one of the particular types of artificial intelligence recurrent neural networks (RNN) that have the capability of learning more extended periods of data compared with convolutional RNNs [40]. Initially developed and presented by Hochreiter and Schmidhuber in 1997 [41]. LSTM networks are highly applicable for predicting, classifying, and processing problems based on time series data. The LSTM network provides higher outperformance than other RNN branches in gradient disappearance, lack of long-term memory, and gradient explosions of RNNs. Furthermore, controlling the hidden state of the gates allows for overcoming the vanishing gradient problem. Before moving to the detailed design of the proposed LSTM-based prediction module, we prefer to provide the basic structure of the LSTM. Fig. 4 presents the detailed architecture of the RNN-LSTM-based water quality prediction model, which comprises the input layer, two LSTM layers, and the network training and output layers. Input parameters of the network are fish tank indoor and outdoor time series data. Indoor values are time-series temperature, water, pH, and conductivity levels collected using sensors from IoT-based smart fish tanks. Whereas the outdoor environmental parameters are time-series temperature, humidity, and solar radiation values. The predicted temperature, pH level, water level, and conductivity parameters are outputs of the prediction model.

Figure 4: RNN-LSTM-based water quality prediction architecture
Each block of the LSTM applied in this paper comprises an input gate, a forget gate, an internal state, and an output gate. In each time, t, the gates of the LSTM compute the gate parameters by employing the input, x(ti), the previous cell value, c(ti−1), and the previously hidden state value, h(ti−1), according to the below given Eqs. (1)–(3):
where the input, forget, and output gate parameters are denoted by a(ti), f(ti), and o(ti), respectively, at time ti. The logistic sigmoid ranges from 0 to 1, and hyperbolic tangent activation functions are denoted by σ and tan h, respectively. Bias values, {ba, bf, bo}, are added to each gate to adjust to the desired fit of the data space based on the training data, while weight matrixes, {wa, wf, wo}, are applied to calculate the gate values.
The LSTM cell’s responsibility is to decide whether to ignore new input values or the entire previous memory according to the input block by employing a hyperbolic tangent function. The cell value for the given time, ti, is calculated by Eqs. (1) and (2):
where bias for the cell is denoted by bc, consequently, the result of the multiplication of the forget gate, ft, the previous cell value, ti−1, and the partial amount of the input gate, at, values are retained in the LSTM memory. In the next step, the cell value, c(ti), is employed to compute the hidden state value, h(ti), by applying the hyperbolic tangent function, tan h, to the h(ti).
The performance comparison has been observed by computing the mean square error (MSE), the mean absolute error (MAE), and mean absolute percentage error (MAPE) between the previously observed water quality parameters, Ot, and predicted water quality parameters, Pt, at a time, t, that are presented with the following Eqs. (6)–(8):
where N presents the total number of times for the performance evaluation.
3.3 An Objective Function for Water Quality Optimization
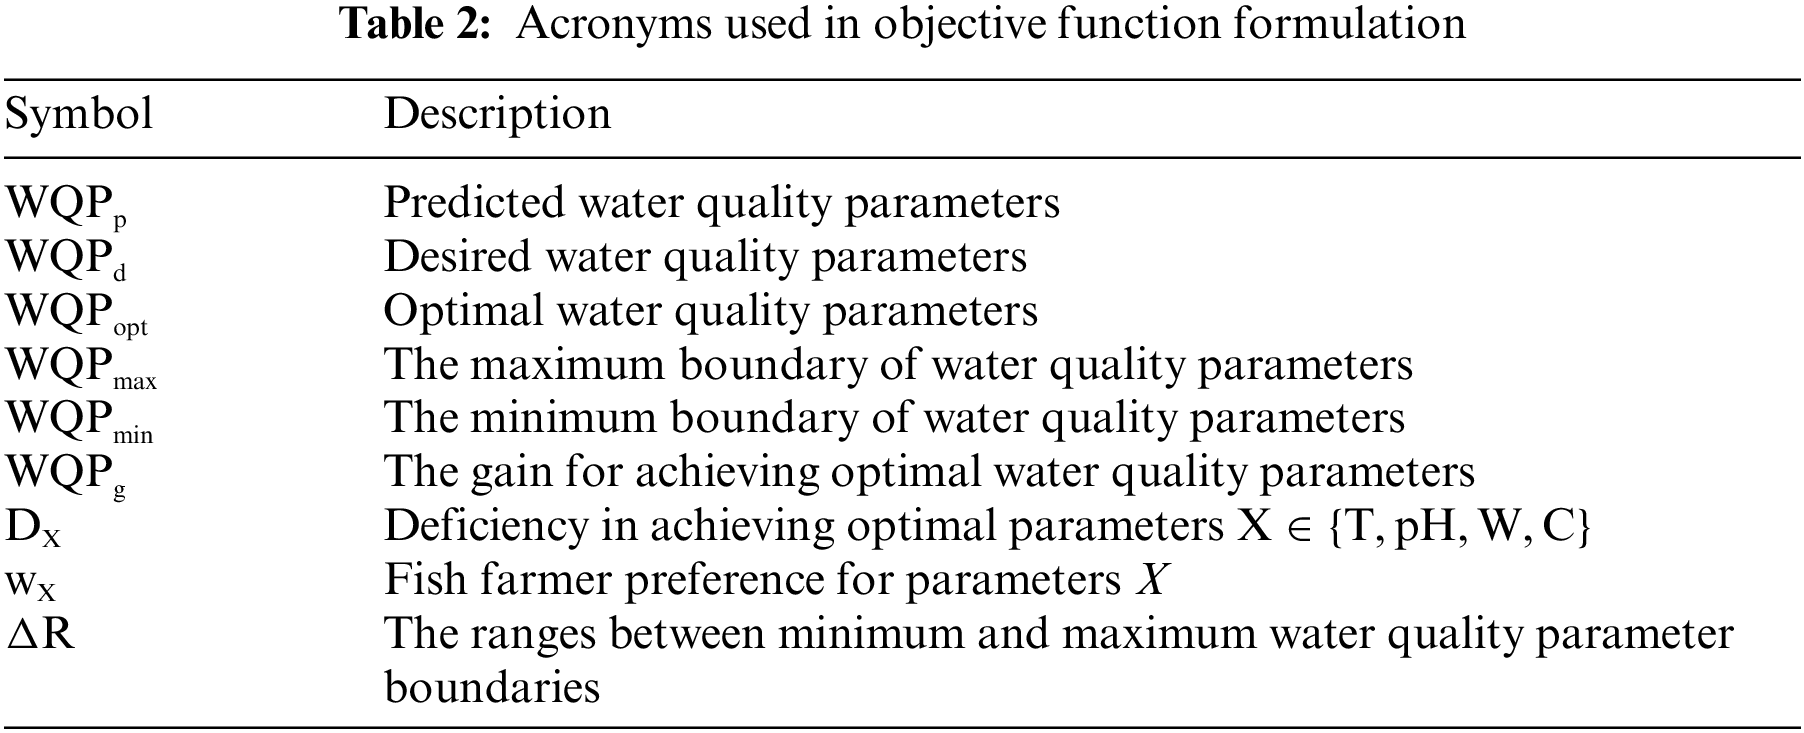
This subsection presents the proposed water quality optimization module in detail. We developed and implemented an objective function to maximize the fish farm’s environmental comfort based on predicted water quality parameters, user-preferred settings, and system constraints. The objective function automatically retains water quality parameters at an optimal level in the fish tank. Table 2 presents the used acronyms in objective function formulation.
Let Tp, pHp, Wp, and Cp be LSTM-based predicted water quality parameters (WQPp) for temperature, pH, water, and conductivity levels. Fish farm users/farmers can select the range of highly desirable water quality parameters according to the type of fish, and the preferred settings are denoted as following Eq. (9)
where Td, pHd, Wd, and Cd are the highly desirable user-preferred water quality temperature, pH, water, and conductivity levels. Farmer-desired water quality parameters are the most acceptable ranges for fish growth, which can be set according to the type of fish, and fish farmers can insert these ranges into the system. According to the desired values, the proposed objective function computes the most optimal water quality parameters to fulfill the farmer’s requirement. Farmer-preferred setup parameters are allowed between the minimum and maximum values for each water quality parameter such that (Eq. (10)),
where Tmin, pHmin, Wmin, and Cmin are employed to denote the minimum fish farmer-preferred settings for the water quality parameters. Tmax, pHmin, Wmin, and Cmax represent the maximum preferred settings. Based on the farmer’s preferred ranges, the minimum and maximum preferred settings are the least acceptable and most desirable values for the water quality parameters.
Furthermore, the desired setting ranges present the boundaries for the proposed objective function. More precisely, if the predicted pH level, pHp, is between the minimum, pHmin, and the maximum, pHmax, pH level boundaries, then no optimization and actuator control values are needed for the pH level because the farmer-preferred pH parameter satisfies the optimal water quality for fish growth. On the other hand, if the predicted pH level is outside of the farmer’s preferred boundaries, then we need to activate the responsible actuators to increase or decrease the pH levels till reaches between the minimum and maximum boundaries of the pH level. Setting up maximum water quality parameters for the fish tank indeed boosts production; however, the maximum configuration for the actuator control requires high resource utilization, i.e., energy consumption.
Let us assume the optimal water quality parameters can achieve the preferred water quality settings denoted by Eq. (11):
where WQPopt presents the optimal water quality of the fish tank, and Topt, pHopt, Wopt, and Copt represent the optimal temperature, pH level, conductivity, and water levels, respectively. Optimal water quality parameters must be between the minimum and maximum farmer-preferred ranges, as represented in below Eq. (12)
Our main goal is to optimize fish tank water parameters for an optimal water quality environment for fish growth. The gain in achieving optimal water quality settings, WQPg, can be calculated using the following Eq. (13)
Thus, the final objective function for optimization of the predicted water quality parameters will be Eq. (15)
The constraint for achieving optimal water quality is optimal water quality should be between the minimum and maximum user-preferred water quality boundaries (Eq. (16)),
3.4 Proposed Fuzzy Logic-Based Control Mechanism
The responsibility of the control module is to increase or decrease the predicted water quality parameters to the optimal level before any danger happens to fish health. We used five actuators in this work: a heater, a cooler, pH controller, a water pump, pH, and conductivity actuators to control water quality parameters based on predicted and optimal parameters. Optimal water quality depends on the actuators’ operational level and activation period. Currently, most actuators can be operated at a variable speed and rate according to the user requirements, which allows for controlling resource utilization, i.e., energy. To control employed actuators, we developed a fuzzy logic control-based control mechanism for setting the actuators’ operational level and activation period according to the predicted and optimized water quality parameters.
Fuzzy logic control comprises three essential phases (see Fig. 5 below): fuzzification, fuzzy inference mechanism, and defuzzification.

Figure 5: Fuzzy logic-based control mechanism for water quality control
In the fuzzification and defuzzification phases, actual crisp values are converted to linguistic values, and the linguistic values are converted to metric values, respectively. The fuzzy inference mechanism is the central phase of the fuzzy logic module for decision-making using “IF-THEN” rules. Human experiences and preferences can be represented in fuzzy logic via membership functions and fuzzy rules. Every linguistic variable is linked with its confidence values, and it is applied to depict membership function graphs.
The fuzzification phase’s responsibility is to employ predicted and optimized temperature, pH, conductivity, and water levels for the linguistic variables. Predicted input values are labelled as very low, low, normal, high, and very high, whereas input of the optimized crisp values is labelled as optimized. In the fuzzy inference mechanism, IF-THEN conditional statements are applied to compute the operational level and activation period. Afterwards, the defuzzification submodule sets the control rule with the actuators’ exact operational level and activation period.
Fuzzification is a process that converts crisp input values to linguistic variables. The below-given parameters depict the input and output parameters for the proposed fuzzy logic control mechanism to control the actuators for optimizing the water quality parameters.
• Input: Predicted water quality parameters {very low, low, normal, high, and very high}
• Input: Optimal water quality parameters {optimal}
• Output: Actuators’ operational level {minimum, medium, maximum}
• Output: Actuators’ activation period {offtime, very little, little, much, very much}
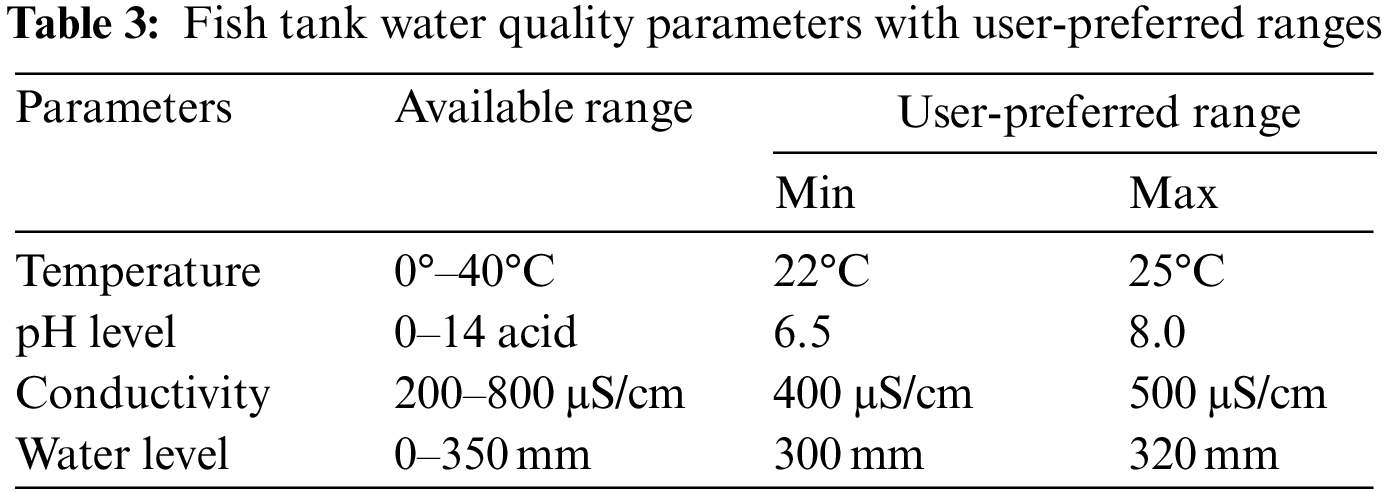
Input parameters present that the predicted water quality parameters are labelled in five levels based on their specific range. The other input parameter of the fuzzy logic is optimal water quality parameters computed using the objective function. To increase the efficiency of the proposed system, we consider available and optimal ranges for water quality parameters, as shown in Table 3. The available ranges present the overall water quality cases for each parameter in general, whereas the user-preferred values are the most acceptable water quality parameters for healthy fish production. Fish water quality-related studies illustrate that the available ranges for temperature, pH, and conductivity levels are 0–40°C, 0–14 acid, and 0–800 μS/cm in a fish tank environment, while optimal user-preferred ranges are 22–25°C, 6.5–8.0 acid, and 400–500 μS/cm, respectively. The water level observation is based on the fish tank’s height (350 mm), and we assumed that a 300–320 mm water level is the optimum water level.
Considering the available ranges, we converted the crisp predicted input values to the linguistic variables, as represented in Table 4. If we take the fish tank water level as an example, the predicted temperature is between 0–10°C, and then the fuzzy set for temperature is labeled as Very Low. If the predicted temperature is between 15°C and 30°C, it is labeled as Normal. Above mentioned considerations are set to other water quality parameters’ labels too. 0 to x10 ranges present the range points of membership function graphs for the predicted water quality parameters, as illustrated in Fig. 7a.

Water quality parameters are needed to compute between the minimum and maximum boundaries to achieve the most acceptable optimal water quality parameters. An objective function-based optimization scheme calculates the optimal water quality parameters between the user’s desired ranges. These optimal values are labelled as optimized in the membership function, as presented in Fig. 6b. The available range of the water quality parameters is described between a1 and a4. Whereas a2 and a3 present the minimum and maximum user-preferred water quality ranges, respectively.
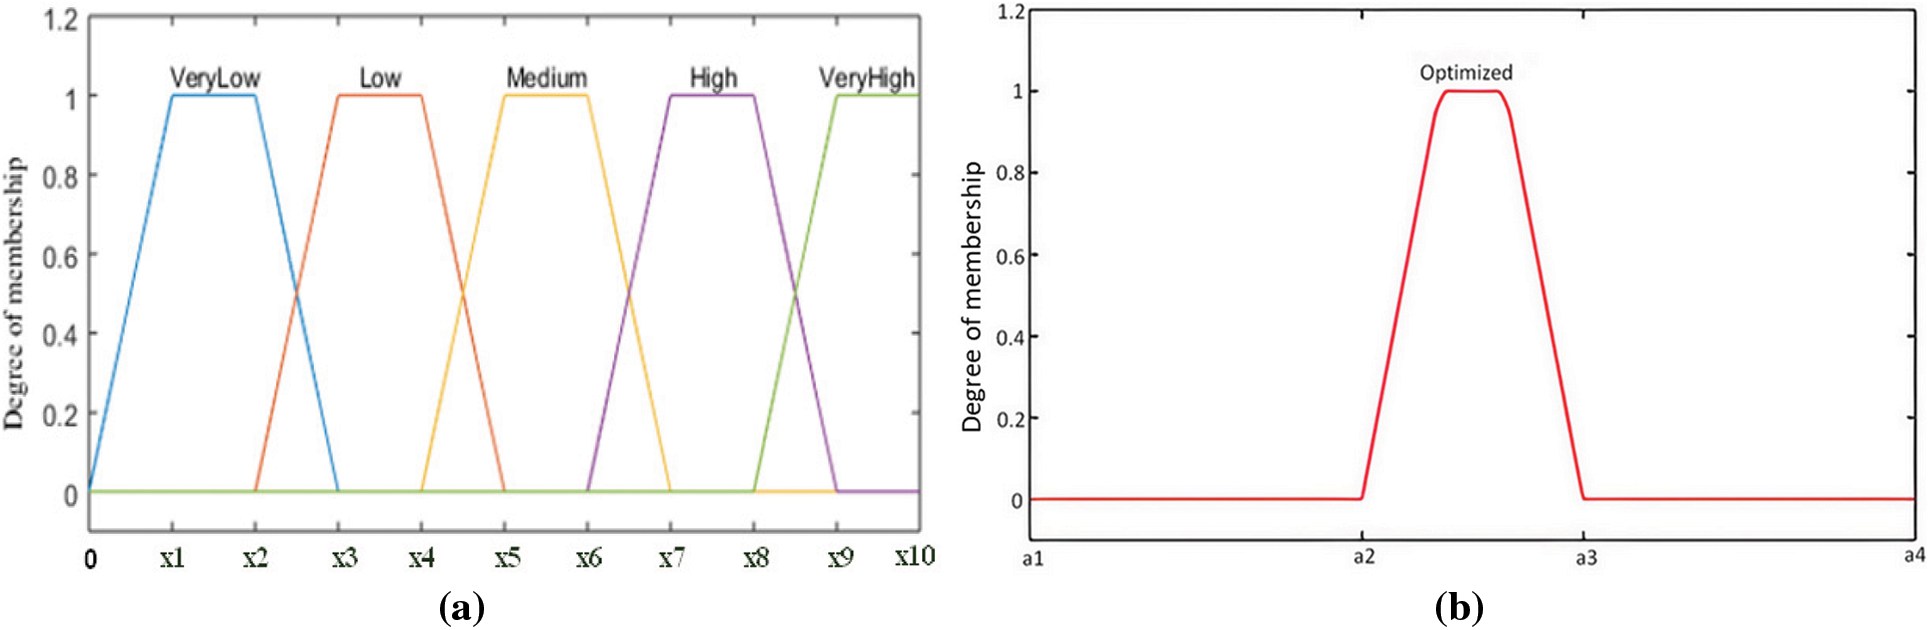
Figure 6: Membership function graphs for the input parameters (a) predicted water quality parameters; (b) optimized water quality parameters
Defuzzification is a process that produces a set of output values from the crisp logic based on fuzzy sets and membership function graphs. The fuzzy inference rules compute and set the actuators’ required operational level and activation period based on predicted and optimized input water quality parameters. According to the actuators’ operational level, the actuators also spend various periods providing optimal water quality resources. For instance, when the heater operates with maximum operational level, it spends little time increasing the water temperature. Conversely, when the heater is activated with the minimum operational level, a very much activation period is needed to achieve the optimal temperature.
Fig. 7 depicts the membership function graphs for the outputs of the FLC module. Six membership function parameters are assigned to the output parameters, namely actuator off, very little, little, normal, much, and very much activation periods for the actuators labelled and abbreviated as OFF, VLT, LT, NT, MT, and VMT, respectively. The given operational level and activation period membership function are acceptable for all actuators’ activation periods. However, if the predicted water quality parameters are low compared to the optimized water quality parameters, actuators must be activated for much time (9–12 min) to achieve optimal water quality.
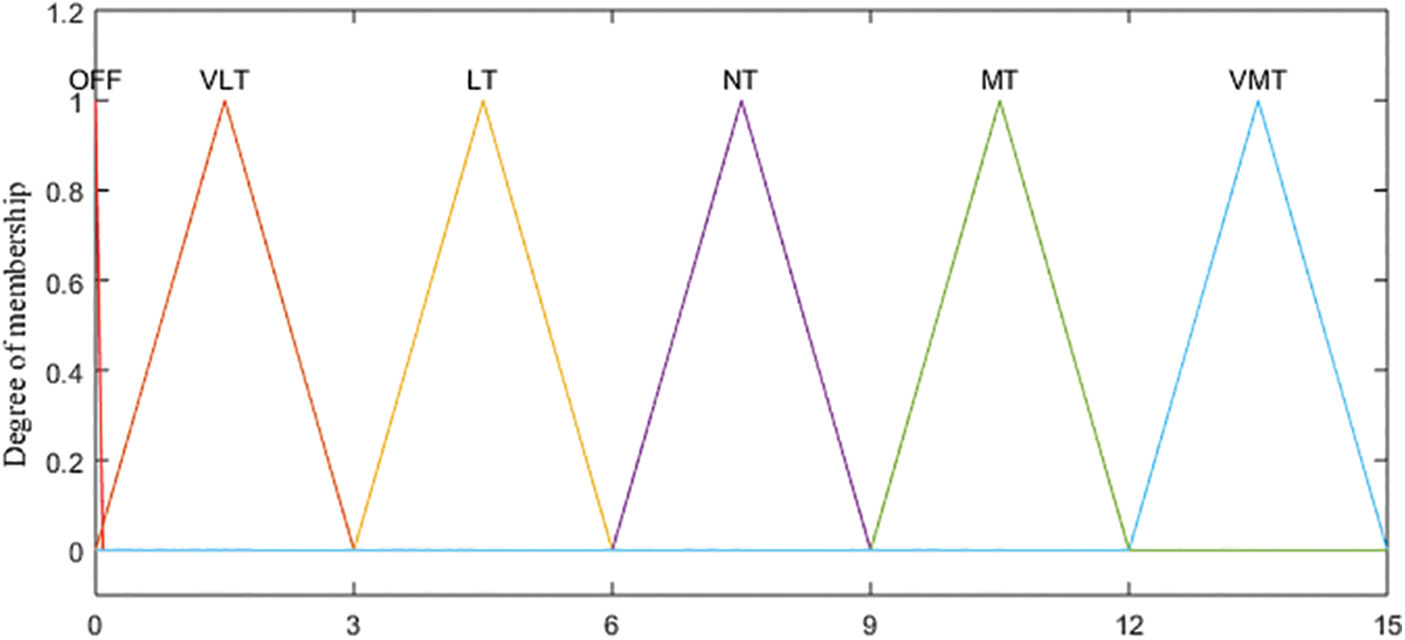
Figure 7: Membership function graph for actuators’ operational period (min)
The fuzzy inference mechanism combines inference and knowledge conditions to solve a wide range of engineering problems. Fuzzy inference is the computation process where the input parameters are analyzed and evaluated using conditional statements. The fuzzy associate matrix (FAM) table is vital in efficiently evaluating the fuzzy rules for presenting all possible outputs based on all possible outputs. For example, the FAM table of the temperature control mechanism is presented in Table 5. As can be seen, the inputs of the FAM table are predicted temperature and optimized temperature. The outputs of the temperature control mechanism are the temperature control actuators’ operational level and activation duration. The heater and cooler actuators are activated dependently when the predicted temperature is below than optimal temperature and out of the user-preferred boundaries. Then, the heater actuator is activated till reaches the optimal degree. Oppositely, if the predicted temperature is higher than the optimal temperature level, the cooler actuator is activated to decrease the temperature.
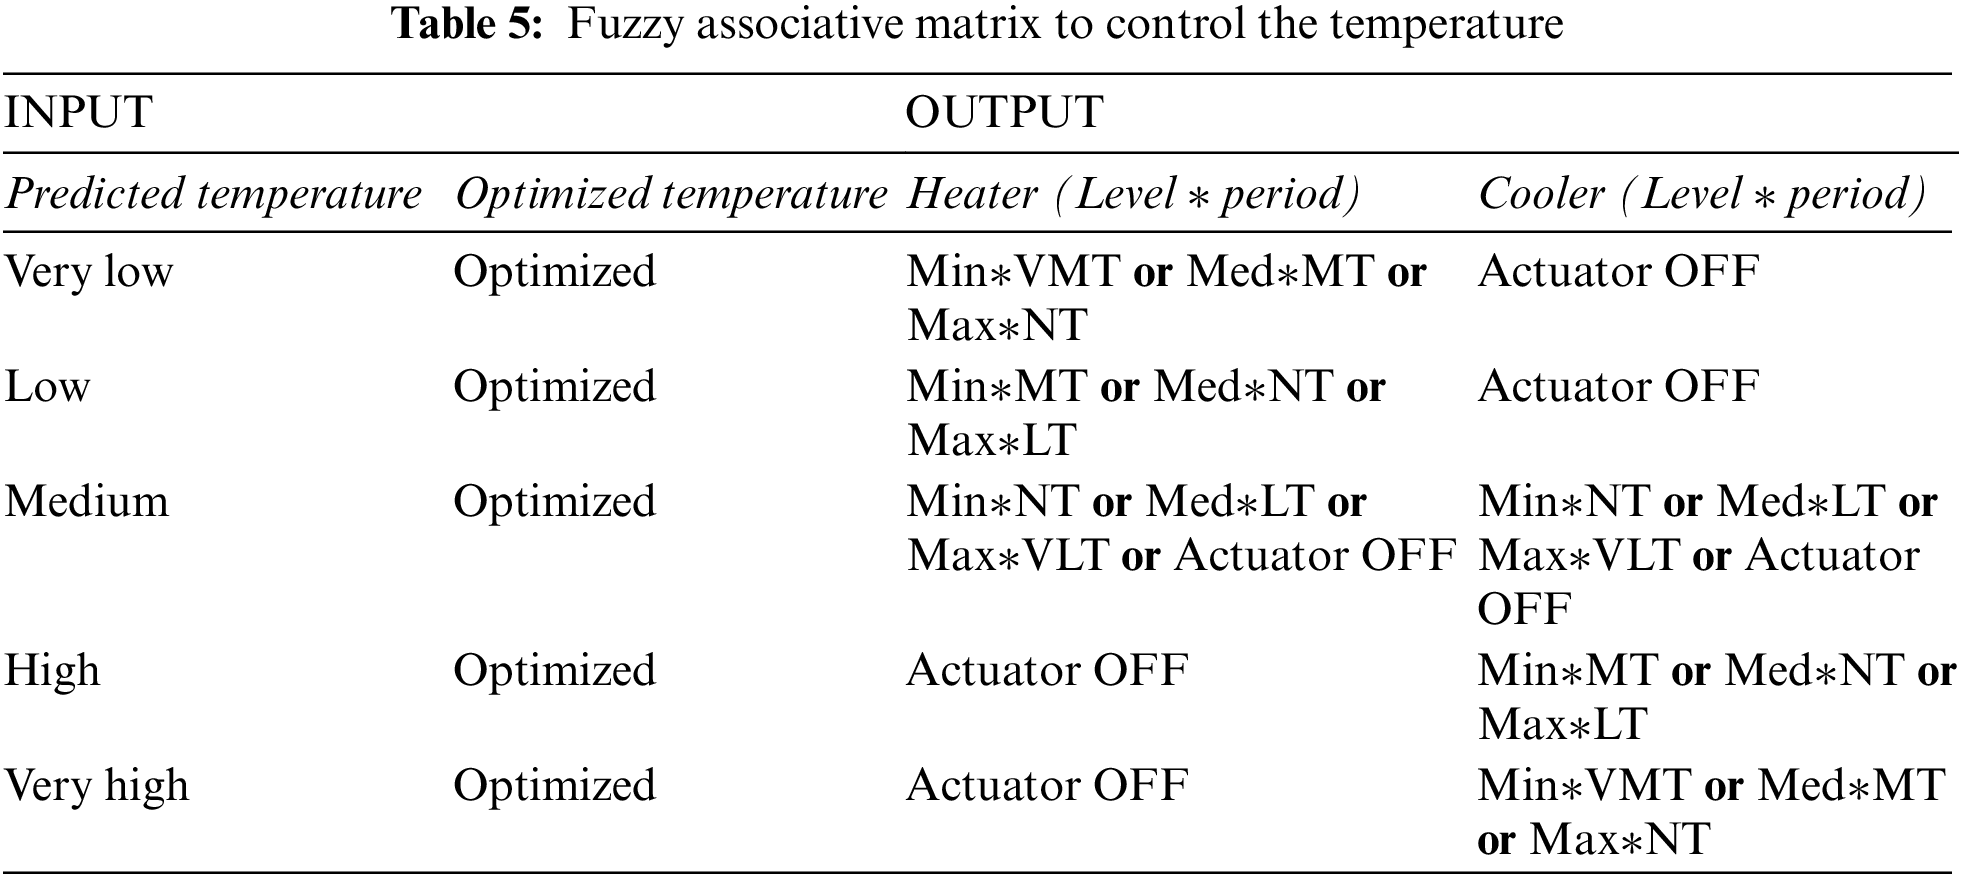
The programmable actuators were configured with the minimum, medium, and maximum operational levels. Based on operational levels, actuators spend various time optimizing water quality for healthy fish production. If the predicted water temperature is very low compared with the optimized temperature, then (Tp < Topt), then the heater spends very much time with a minimum working level, or much time with a medium working level or normal time with a maximum operational level. On the other hand, if the predicted water temperature status is high then and higher than the optimal temperature boundary (Tp > Topt), then the cooler can operate very much time with a minimum operational level or much time with a medium operational level or normal time with maximum working level to decrease the water temperature. Similar rules and logic for the water pump, pH, and conductivity controllers were implemented to control other water quality parameters.
This section of the paper presents the experimental environment and implementation technologies of the proposed optimal water quality control mechanism in detail. Fig. 8 represents the fish tank environment we designed as a case study. In our experimental fish tank environment, Open Aquarium monitoring tools manufactured by Libelium were employed to collect and control water quality parameters. Open Aquarium is fabricated for managing fishponds and tanks’ environment without human interference. Open Aquarium comprises four sensors to collect temperature, pH, conductivity, and water level parameters. In addition, several actuators, namely, heater, cooler, pH, conductivity controllers, water pump, and feeders, are provided to control the water quality parameters.
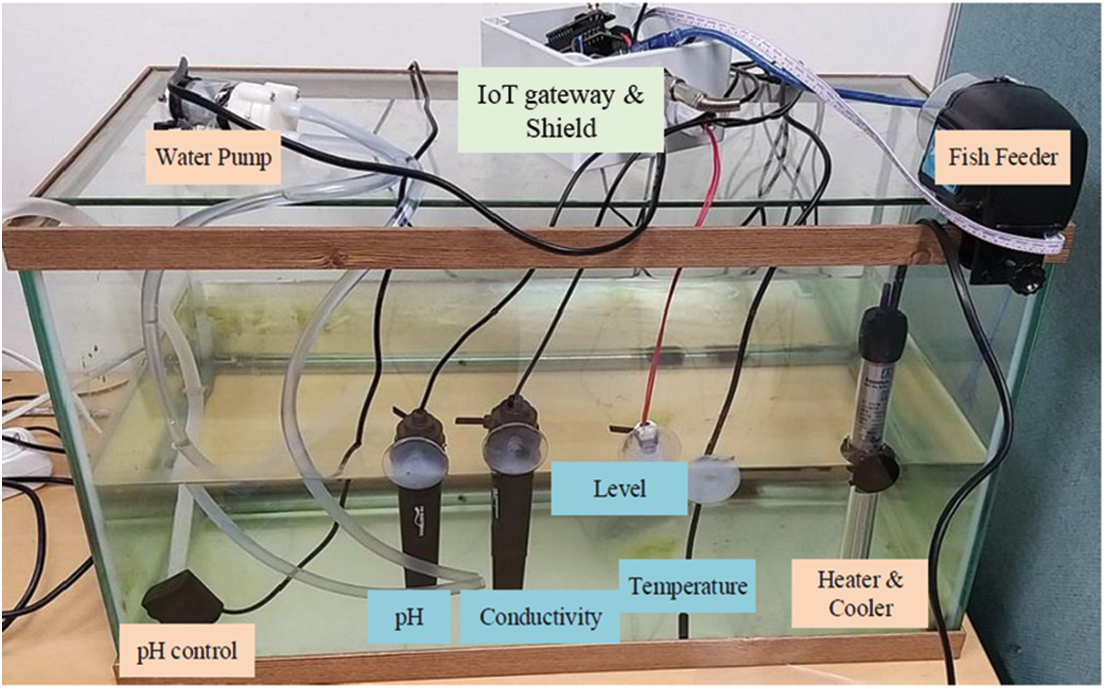
Figure 8: Experimental IoT-based fish tank environment
The Open Aquarium shield supports the connectivity of all sensors and actuators to the single board. This shield is attached to the Arduino board, which is the IoT gateway between IoT devices and the server. HTTP is a communication protocol between IoT devices and the Apache HTTP server. Real-time water quality parameters data is collected using sensors and forwarded to the Apache HTTP server using the HTTP POST method. Afterward, the collected data is used for the predictive optimization module to compute the most optimal parameters for water quality. Then, the predicted and optimized water quality parameters are inputted into the fuzzy logic control module to compute the actuators’ operational level and activation period. Based on control parameters, the fuzzy logic control module sends ON and OFF commands separately for each actuator in the required time using the HTTP POST method.
Table 6 presents IoT devices which were used to conduct the experimental fish farm environment.

Table 7 represents the technologies employed to develop the proposed predictive optimization-based optimal water quality control system. The RNN-LSTM-based prediction model is developed using the Keras library based on internal water quality and external environmental data. The prediction model is trained, tested, and deployed to predict the water quality parameters based on each sensing time series data. Outputs of the prediction module are inputted to the optimization module to compute the most optimal water quality parameters. The fuzzy logic-based control mechanism is implemented in MATLAB and integrated into the C# based desktop application.

The fish tank graphical user interface (GUI) is represented in Fig. 9. Using a user-friendly GUI, users can easily monitor the overall process of the proposed water quality optimization system. As can be seen, the sensors and actuators can be activated by selecting and clicking the connect buttons. A fish farmer can assign the user-preferred minimum and maximum boundaries for the temperature, pH, water, and conductivity levels separately for each parameter. This function increases the flexibility of the proposed system; according to the type of fish, the fish farmer can update the preferred parameters for the water quality parameters by clicking apply changes buttons. The objective function computes the most optimal parameters based on updated user-preferred water quality boundaries to satisfy user requirements. The prediction module’s responsibility is to control the prediction process using start, pause, and cancel buttons, whereas the optimization module allows controlling the optimization of water quality parameters.
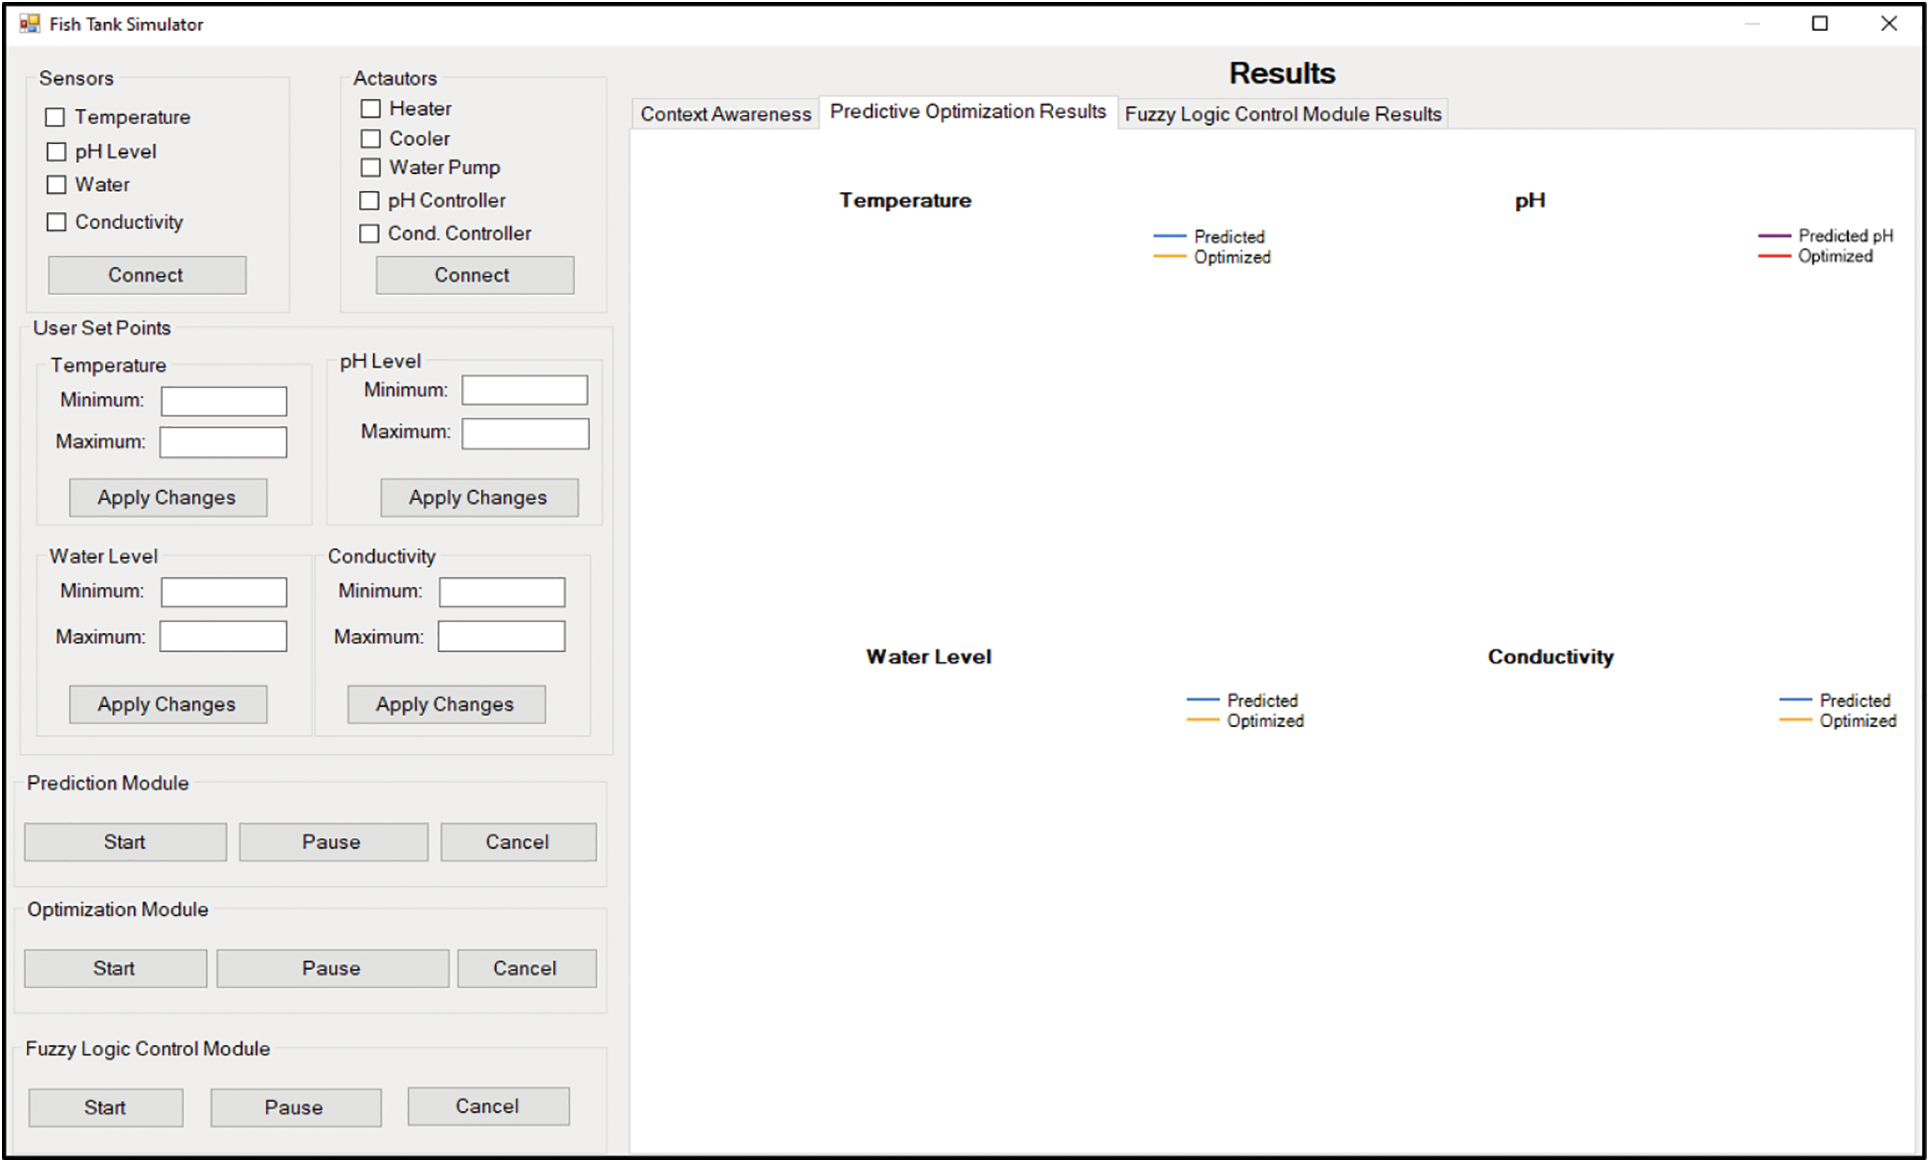
Figure 9: The fish tank simulator interface
The results tab provides visualized results to analyze water quality parameters in detail. The context-awareness subtab allows checking actual sensing water quality parameters between user-preferred boundaries or not. The predictive optimization subtab represents the results of the predicted and optimized water quality parameters. Finally, the fuzzy logic control module illustrates the actuators’ activation status (ON or OFF) with their operational level and activation period.
The used dataset contains 3000 rows and nine columns: date, time, temperature, pH, conductivity, water level, outdoor temperature, humidity, and solar radiation parameters. The first and second columns of the dataset present the date and time, respectively. The next four water quality parameters are collected using the installed sensors, while the latter are outdoor environmental parameters. For the RNN-LSTM-based prediction approach, 70% of available data was used for the training, and 30% of data was applied for testing. To prove the efficiency, water parameters are frequently increased and decreased to check how responsive and accurate.
This section of the paper presents the performance evaluation results in four subsections. The first subsection comprises the predictive analysis of the proposed prediction model. The predictive optimization results are presented in the second subsection, while the third subsection illustrates the fuzzy logic-based actuator control results. Finally, the actuators’ energy consumption results are analyzed in the last subsection.
Predictive analysis is essential in investigating hidden patterns and implicit behavior of the data and utilizing those findings to conceive efficient solutions. RNN-LSTM is applied to predict water quality parameters based on internal and external water quality and environmental parameters. Fig. 10 represents the differences between the actual and predicted outcomes for the mentioned temperature, pH, conductivity, and water level parameters. Red lines represent the boundary between the training and testing results. The prediction results were obtained using MSE. Tanh optimizer was employed to compute the accuracy and weights in terms of each epoch. It can be seen that the predicted water temperature values are slightly higher than the actual values. In contrast, the predicted outcomes of the water level are marginally less than the actual water level parameters. It can be observed that there is a significant similarity between the actual and predicted pH and conductivity levels; both maintained the same level and remained around central pH and conductivity parameters over a period of 3000 h.

Figure 10: RNN-LSTM-based predictive analysis for water quality parameters: (a), (b), (c), and (d) represent the actual and predicted temperature, pH, conductivity, and water level parameters, respectively
To further compare of prediction effect for water quality parameters, Table 8 indicates the actual sensing value at different times, the predictive value of water quality parameters in one day, and the absolute percentage error (APE) of the prediction results. where the predicted and actual values are denoted by

In hourly water quality prediction, the absolute percentage error range [0%, 3%] is considered as a practical error bound. Values above the error range are marked in bold in the table below.
As can be seen that the accuracy of the temperature and water level predicted values is significantly accurate and fits closer to actual data. In contrast, several error points are greater than the maximum error bound for pH and conductivity levels. For example, the maximum error bounds for pH and conductivity values are 3.42% and 4.25% at 22:00 and 12:00, respectively.
To test the forecasting capability of the proposed prediction model, three different statistical metrics, namely mean absolute percentage error (MAPE), mean absolute error (MAE), and mean square error (MSE), were applied to evaluate the prediction accuracy. The statistical metric results are depicted in Fig. 11.
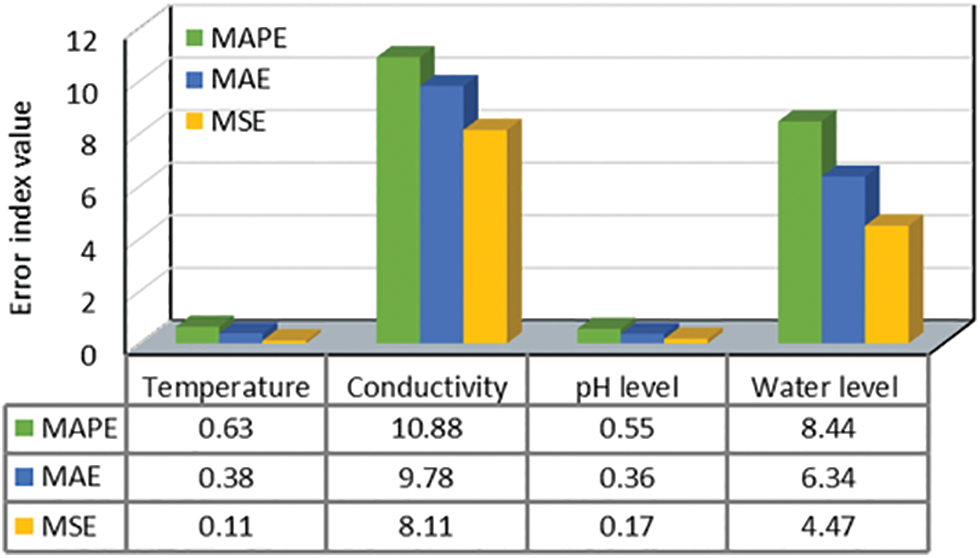
Figure 11: Error index of prediction results
As expected, the conductivity and water level parameters’ error-index values are substantially greater than the temperature and pH levels. The MAPE values are 0.63, 10.88, 0.55, and 8.44 for the temperature, conductivity, pH, and water level parameters, respectively, and these error-index values are remarkably greater compared to the MAE and MSE results. As can be seen that the MSE-based error metric tends to fit closer to the actual water quality parameters and has a minor prediction error. Overall, the value of MSE signifies the accurate forecasting behavior that can positively influence the water quality parameter-oriented prediction models and fish tank environments to achieve effective decision-making.
This section of the paper encompasses the outcomes attained by implementing the optimization of water quality parameters based on the objective function. Fig. 12 outlines the objective function-based water quality optimization results in three aspects: (1) actual water quality parameters gathered from the fish tank using multiple sensors in a timely manner. (2) RNN-LSTM based on predicted water quality parameters. (3) Objective function employed optimized water quality parameters according to the user desired minimum and maximum water quality parameters. X-axes represent the timestamp information for 200 h, and y-axes show the level of the water quality parameters. The red and green lines illustrate the user desired minimum and maximum ranges, respectively.

Figure 12: An objective function assisted water quality optimization analysis with user desired ranges. (a), (b), (c), and (d) represent the actual, predicted, and optimized temperature, pH, conductivity, and water level parameters, respectively
The actual and predicted temperature and water level parameters are less than the user-preferred parameters for 200 h. Predicted temperature and water level values are optimized by considering the user-preferred minimum and maximum ranges. The objective function computes the optimal temperature and water level for each predicted water quality value. On the other hand, the predicted pH and conductivity levels are mostly higher or lower than the user-desired ranges.
If predicted pH and conductivity parameters are higher than the preferred maximum range, the actuators are activated to decrease the pH and conductivity levels. Whenever predicted pH and conductivity values are less than the user’s preferred minimum range, actuators increase the parameters to fulfil the user’s requirement to achieve optimal fish growth. If the predicted values are between user-preferred ranges, then there is no need to activate the actuators. In terms of the temperature and water level parameters, heater and water pump actuators must be activated each hour for some time to increase the temperature and water level parameters. However, the pH and conductivity controllers have a number of inactive slots since the several predicted pH and conductivity parameters are between user-preferred ranges.
It is evaluated from the analysis that the proposed objective function finds the optimal real-time water quality parameters in between the minimum and maximum user-preferred ranges. The user-preferred range can be selected based on the experience of the fish farmer, the type of fish, and different environmental factors. It can be inferred that the optimized water quality parameters can be applied to the control module to assign operational level automatically and activation period to the actuators with minimum energy consumption to achieve optimal water quality for healthy fish growth.
In general, fixed, and variable operational level actuators are utilized in real-life fish tank management solutions. The fixed operational level actuators operate at a specific speed, so the energy consumption remains static. In contrast, the variable operational level actuators can operate at various working levels and speeds to provide various water levels, temperature, pH levels, or conductivity levels according to the user’s requirements.
Fig. 13 shows the fuzzy logic-based actuator control mechanism performance evaluation results. X-axes illustrate the time stamp information for 200 h, and y-axes represent actuators’ activation period in three operational levels: minimum, medium, and maximum. Based on three different operational levels, actuators spend various time and power to increase or decrease the predicted water quality parameters to the optimal. As expected, the heater and water pump actuators are activated each hour because the predicted temperature and water level parameters were below than user’s desired ranges. The heater actuator spent 1–2, 3–5, and 4 to 7 min to increase the predicted temperature value to the optimal with maximum, medium, and minimum operational levels, respectively. However, as mentioned earlier, the cooler actuators remained off during the period. Increasing the predicted water level to the optimal water pump actuator required 3–6, 6–9, and 9–12 min with maximum, medium, and minimum operational levels, respectively.
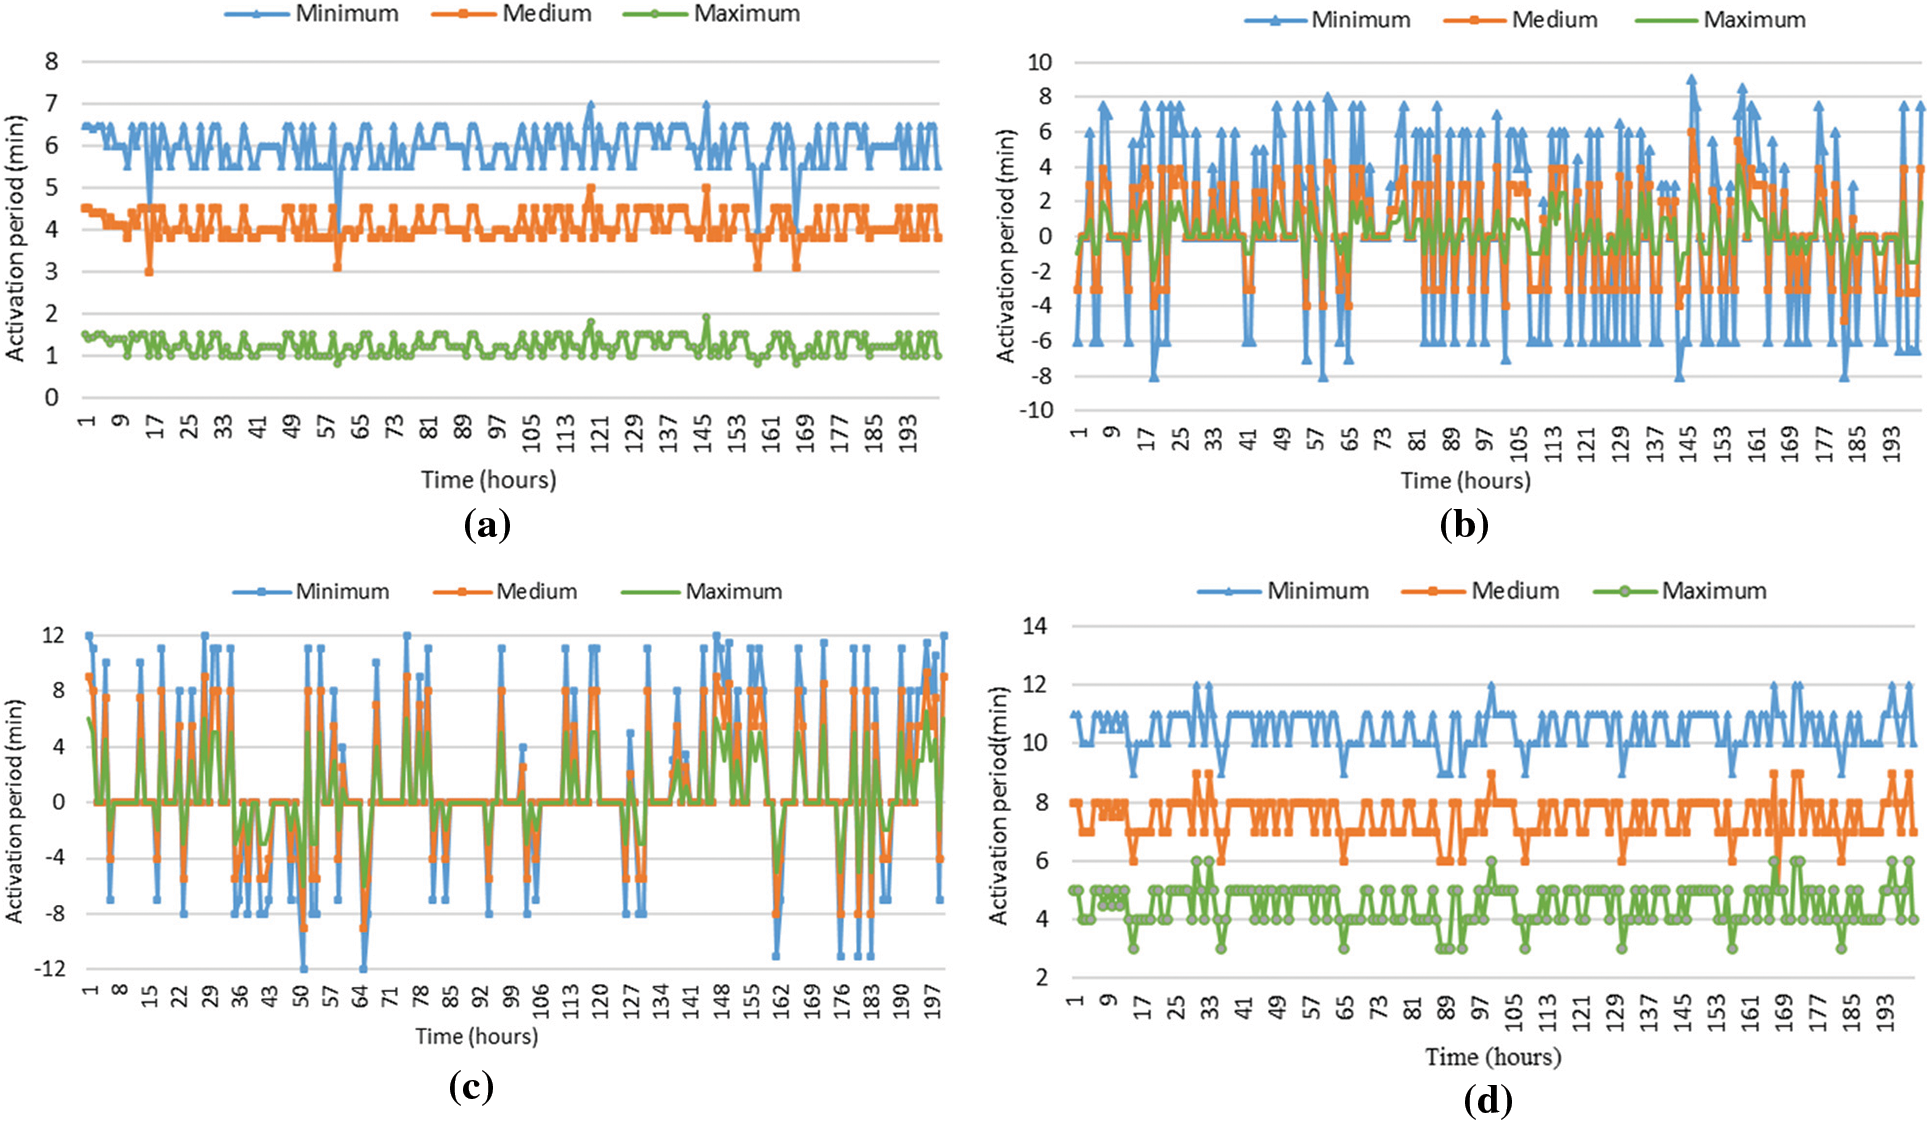
Figure 13: Fuzzy logic-based actuator control analysis: (a), (b), (c), and (d) present heater, pH controller, conductivity, and water pump actuators’ operational level and activation period based on predictive and optimized water quality parameters
Proposed actuators have double-side functionality, which means actuators can decrease or increase the water quality parameters based on predicted values. For example, in the negative activation period, the pH controller is activated to decrease the pH level if the predicted pH values are higher than the user-desired maximum values. In the positive activation period, the pH controller aimed at increasing the pH level. If the activation period remained at 0, then actuators were not activated during those hours. To calculate the overall activation period for the actuators, we used the absolute values of the actuators’ activation period. The same logic applies to the activation of the conductivity controller.
Fig. 14 represents the overall activation period of each actuator for 200 h based on minimum, medium, and maximum operational levels. Activation of the actuators at various working levels required different activation periods. For example, the heater actuator spent overall 1196.4, 819.4, and 248.2 min with the minimum, medium, and maximum operational levels to increase the predicted water temperature to the optimal in 200 h of data instances. However, the predicted water temperature was lower than the user’s desired parameters. Therefore, the cooler actuator was not activated during the mentioned period.
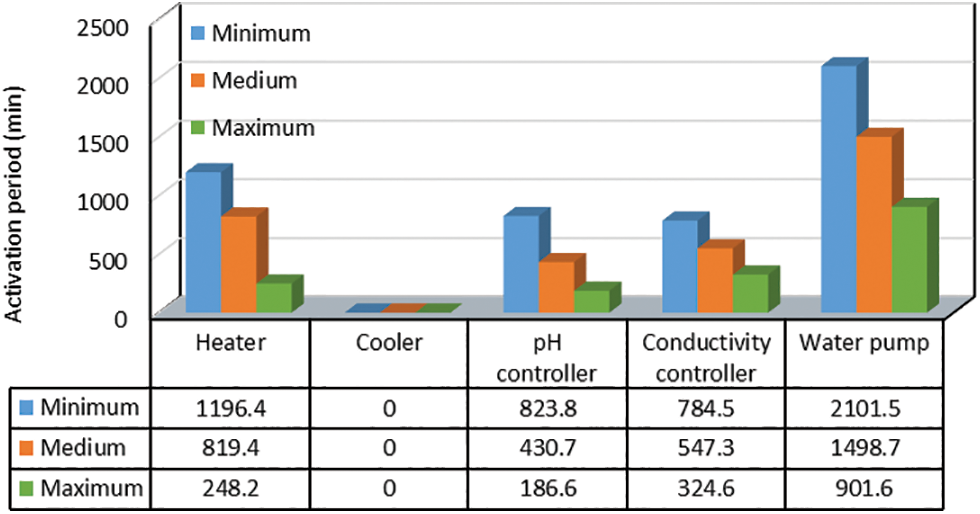
Figure 14: Actuators’ overall activation period is based on different operational levels
The actuators’ activation at variable operational levels provides different temperature, water, pH, and conductivity levels to the fish tank at various speeds. The fish farmer wants to provide the optimal water quality parameters to the fish tank in the shortest period. However, a maximum operational level can consume more energy than a minimum operational level. In fish farming, actuators’ power consumption can be minimized by decreasing the operational level, but lower operational levels require more activation periods. The most optimal operational level can be computed based on actuators’ power ratings at various operational levels. In the following subsection, we present the overall energy consumption of the actuators based on different operational levels to outline the optimal operational level for fish tank actuators. However, the proposed fuzzy logic control module chooses the actuators’ optimal operational level and activation period according to the predicted and optimized water quality parameters.
5.4 Energy Consumption Analysis
Power ratings have been assigned to the fish tank actuators to conduct power consumption analysis as represented in Table 9. We assume that each actuator consumes different power based on various operational levels. For example, if the heater is activated with a minimum operational level, 40 watts −100 watts of energy is needed with more activation periods. When the pH controller is activated at a medium operational level, then the controller consumes 500 watts–600 watts of energy. To simplify the module, we considered the average point of the power ratings of the operational levels. For example, with the maximum, medium, and minimum operational levels, the pH controller consumes 650, 550, and 450 watts per minute, respectively. The overall energy consumption can be computed according to the activation period.

Fig. 15 describes the actuators’ energy consumption results in kWh based on various working levels. Increasing the predicted water quality parameters to the optimal level is the aim of our proposed approach. Actuators require a continuous operation that leads to power consumption to achieve optimal levels. Therefore, we proposed a fuzzy logic-based control mechanism to achieve optimal energy consumption. In this mechanism, optimizing the predicted water quality parameters is the main goal, and the fuzzy logic-based control module computes at the most optimal operational level with less energy consumption. As can be seen, with maximum operational levels, all actuators spent less energy than the other operation levels. For instance, the heater, pH controller, conductivity controller, and water pump consumed 49.6, 121.3, 194.8, and 1442.6 kWh of energy, respectively. Whereas the same actuators spent 106.5, 236.9, 262.7, and 1798.4 kWh of energy at the medium operational level. It can be evaluated from the energy consumption analysis that the energy consumption of the water pump dominates compared with the remaining actuators. The water pump spent 1681.2, 1798.4, and 1442.6 kWh of energy, activating minimum, medium, and maximum operational levels, respectively.
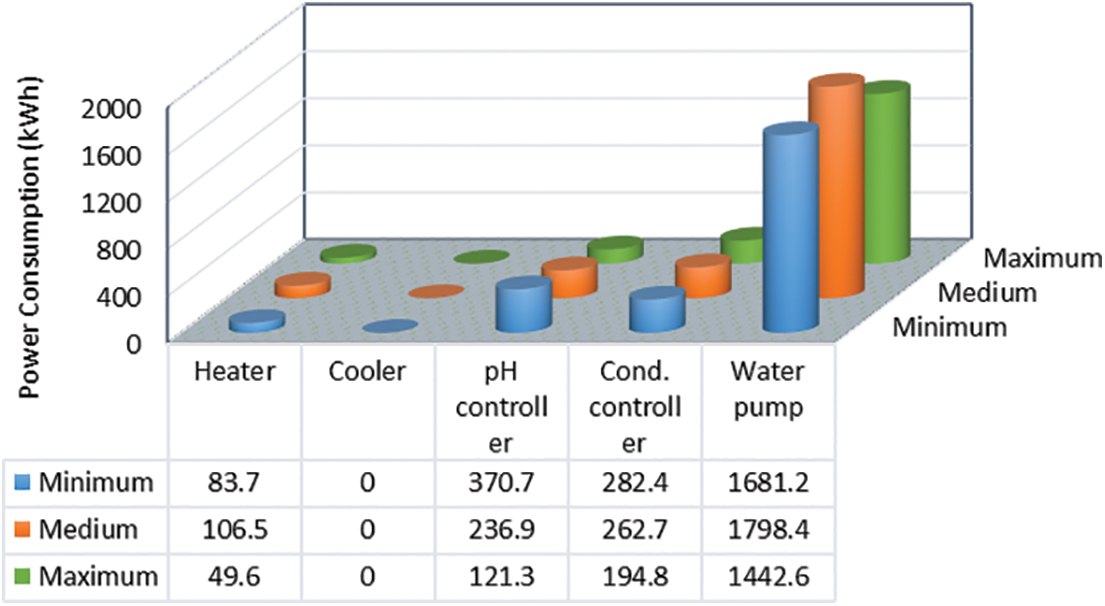
Figure 15: Overall energy consumption analysis based on various operational levels
In the last decades, smart fish farming has proven to be one of the fastest-growing food production industries. However, providing optimal water quality for fish growth with efficient resource utilization in fish tanks is a challenging task due to several internal and external factors. To maintain intensive monitoring and control of both water quality and energy consumption, this paper proposed a hybrid “prediction-optimization-control” mechanism, which combined the RNN-LSTM, the objective function, and fuzzy logic control to achieve optimal water quality in the fish tank with minimum energy consumption. First, RNN-LSTM was allowed to predict future water quality parameters with high accuracy based on internal and external environmental factors. Then, the predicted water quality parameters were applied to compute the most optimal water quality parameters based on user preference and system constraints. Finally, predictive optimal water quality values were input into the fuzzy logic-based control module to control actuators with minimum energy consumption.
The simulation results showed that the predictive optimal temperature, conductivity, pH, and water level parameters were provided to the fish tank in between the user-preferred minimum and maximum ranges to maintain enhanced water quality. The actuator control mechanism with the maximum operational level achieved an overall 30% energy consumption reduction in all actuators compared to the medium and minimum operational levels.
In conclusion, we found that the water quality parameters were mostly outside of optimal ranges in the fish production process. However, our proposed approach was capable of computing and providing the optimal values by considering the user requirement and various influential factors. In future studies, deep learning techniques will be applied to predict energy consumption and compute control parameters based on other factors, including weather and season factors. Furthermore, finding the correlation between water quality parameters and their impact to each other will be one of the interesting topics of our future work.
Funding Statement: We are thankful to the Energy Cloud R&D Program which supported this research through the National Research Foundation of Korea (NRF) funded by the Ministry of Science, ICT CMC, 2023 27 (2019M3F2A1073387), and this work was supported by the Institute for Information & communications Technology Promotion (IITP) (NO. 2022-0-00980, Cooperative Intelligence Framework of Scene Perception for Autonomous IoT Device). Any correspondence related to this paper should be addressed to Dohyeun Kim.
Conflicts of Interest: The authors declare that they have no conflicts of interest to report regarding the present study.
References
1. T. Garlock, F. Asche, J. Anderson, T. Bjorndal, G. Kumar et al., “A global blue revolution: Aquaculture growth across regions, species, and countries,” Reviews in Fisheries Science & Aquaculture, vol. 28, no. 1, pp. 107–116, 2020. [Google Scholar]
2. W. C. Valenti, H. P. Barros, P. Moraes-Valenti, G. W. Bueno and R. O. Cavalli, “Aquaculture in Brazil: Past, present and future,” Aquaculture Reports, vol. 19, pp. 100611, 2021. https://doi.org/10.1016/j.aqrep.2021.100611 [Google Scholar] [CrossRef]
3. D. M. K. S. Hemathilake and D. M. C. C. Gunathilake, “Agricultural productivity and food supply to meet increased demands, in future foods,” Academic Press, vol. 1, pp. 539–553, 2022. https://doi.org/10.1016/B978-0-323-91001-9.00016-5 [Google Scholar] [CrossRef]
4. F. Akhter, H. R. Siddiquei, M. E. E. Alahi and S. C. Mukhopadhyay, “Recent advancement of the sensors for monitoring the water quality parameters in smart fisheries farming,” Computers, vol. 10, no. 3, pp. 26, 2021. [Google Scholar]
5. M. Zavareh and V. Maggioni, “Application of rough set theory to water quality analysis: A case study,” Data, vol. 3, no. 4, pp. 50, 2018. [Google Scholar]
6. H. Amqam, D. Thalib, D. Anwar, S. Sirajuddin and A. Mallongi, “Human health risk assessment of heavy metals via consumption of fish from Kao Bay,” Reviews on Environmental Health, vol. 35, no. 3, pp. 257–263, 2018. [Google Scholar]
7. U. F. Mustapha, A. W. Alhassan, D. N. Jiang and G. L. Li, “Sustainable aquaculture development: A review on the roles of cloud computing, internet of things and artificial intelligence (CIA),” Reviews in Aquaculture, vol. 13, no. 4, pp. 2076–2091, 2018. [Google Scholar]
8. M. Føre, K. Frank, T. Norton, E. Svendsen, J. A. Alfredsen et al., “Precision fish farming: A new framework to improve production in aquaculture,” Biosystems Engineering, vol. 173, pp. 176–193, 2018. https://doi.org/10.1016/j.biosystemseng.2017.10.014 [Google Scholar] [CrossRef]
9. T. Fonseca, W. C. Valenti, B. F. Giannetti, F. H. Gonçalves and F. Agostinho, “Environmental accounting of the yellow-tail lambari aquaculture: Sustainability of rural freshwater pond systems,” Sustainability, vol. 14, no. 4, pp. 2090, 2022. [Google Scholar]
10. R. Kumar, R. R. Kumar, P. J. Stauvermann and P. Arora, “Effect of fisheries subsidies negotiations on fish production and interest rate,” Journal of Risk and Financial Management, vol. 13, no. 12, pp. 297, 2020. [Google Scholar]
11. S. E. Ali, M. D. Jansen, C. V. Mohan, J. Delamare-Deboutteville and H. Charo-Karisa, “Key risk factors, farming practices and economic losses associated with tilapia mortality in Egypt,” Aquaculture, vol. 527, pp. 735438, 2020. https://doi.org/10.1016/j.aquaculture.2020.735438 [Google Scholar] [CrossRef]
12. Y. Zhang, W. Wang, L. Yan, B. Glamuzina and X. Zhang, “Development and evaluation of an intelligent traceability system for waterless live fish transportation,” Food Control, vol. 95, pp. 283–297, 2019. https://doi.org/10.1016/j.foodcont.2018.08.018 [Google Scholar] [CrossRef]
13. X. Yang, S. Zhang, J. Liu, Q. Gao, S. Dong et al., “Deep learning for smart fish farming: applications, opportunities and challenges,” Reviews in Aquaculture, vol. 13, no. 1, pp. 66–90, 2021. [Google Scholar]
14. C. E. Boyd, L. R. D’Abramo, B. D. Glencross, D. C. Huyben, L. M. Juarez et al., “Achieving sustainable aquaculture: Historical and current perspectives and future needs and challenges,” Journal of the World Aquaculture Society, vol. 51, no. 3, pp. 578–633, 2020. [Google Scholar]
15. A. Ahmad, S. R. S. Abdullah, H. A. Hasan, A. R. Othman and N. I. Ismail, “Aquaculture industry: Supply and demand, best practices, effluent and its current issues and treatment technology,” Journal of Environmental Management, vol. 287, pp. 112271, 2021. https://doi.org/10.1016/j.jenvman.2021.112271 [Google Scholar] [PubMed] [CrossRef]
16. K. L. M. Ang, F. L. Ge and K. P. Seng, “Big educational data & analytics: Survey, architecture and challenges,” IEEE Access, vol. 8, pp. 116392–116414, 2020. https://doi.org/10.1109/ACCESS.2020.2994561 [Google Scholar] [CrossRef]
17. T. Kuchkorov, N. Atadjanova and N. Sayfullaeva, “Big data analysis for soil monitoring in smart farming,” in 2019 Int. Conf. on Information Science and Communications Technologies (ICISCT), Tashkent, Uzbekistan, pp. 1–4, 2019. [Google Scholar]
18. M. S. Islam, M. M. Hasan, X. Wang, H. D. Germack and M. Noor-E-Alam, “A systematic review on healthcare analytics: Application and theoretical perspective of data mining,” in Healthcare, vol. 6, no. 2, pp. 54, 2018. [Google Scholar]
19. S. Ahmad, A. Khudoyberdiev and D. Kim, “Towards the task-level optimal orchestration mechanism in multi-device multi-task architecture for mission-critical IoT applications,” IEEE Access, vol. 7, pp. 140922–140935, 2019. https://doi.org/10.1109/ACCESS.2019.2942611 [Google Scholar] [CrossRef]
20. C. N. Wang, N. L. Nhieu and T. T. T. Tran, “Stochastic chebyshev goal programming mixed integer linear model for sustainable global production planning,” Mathematics, vol. 9, no. 5, pp. 483, 2021. [Google Scholar]
21. N. Gunantara, “A review of multi-objective optimization: Methods and its applications,” Cogent Engineering, vol. 5, no. 1, pp. 1502242, 2018. [Google Scholar]
22. S. Goyal, S. Bhushan, Y. Kumar, A. U. H. S. Rana, M. R. Bhutta et al., “An optimized framework for energy-resource allocation in a cloud environment based on the whale optimization algorithm,” Sensors, vol. 21, no. 5, pp. 1583, 2021. [Google Scholar] [PubMed]
23. S. Rani, D. Koundal, M. F. Ijaz, M. Elhoseny and M. I. Alghamdi, “An Optimized Framework for WSN Routing in the Context of Industry 4.0,” Sensors, vol. 21, no. 19, pp. 6474, 2021. [Google Scholar] [PubMed]
24. A. Khudoyberdiev, I. Ullah and D. Kim, “Optimization-assisted water supplement mechanism with energy efficiency in IoT based greenhouse,” Journal of Intelligent & Fuzzy Systems, vol. 40, no. 5, pp. 10163–10182, 2021. [Google Scholar]
25. E. Fathi, R. Zamani-Ahmadmahmoodi and R. Zare-Bidaki, “Water quality evaluation using water quality index and multivariate methods, Beheshtabad river, Iran,” Applied Water Science, vol. 8, no. 7, pp. 1–6, 2018. [Google Scholar]
26. A. B. Dauda, A. Ajadi, A. S. Tola-Fabunmi and A. O. Akinwole, “Waste production in aquaculture: Sources, components and managements in different culture systems,” Aquaculture and Fisheries, vol. 4, no. 3, pp. 81–88, 2019. [Google Scholar]
27. J. H. Chen, W. T. Sung and G. Y. Lin, “Automated monitoring system for the fish farm aquaculture environment,” in 2015 IEEE Int. Conf. on Systems, Man, and Cybernetics, Hong Kong, China, pp. 1161–1166, 2015. [Google Scholar]
28. K. R. S. R. Raju and G. H. K. Varma, “Knowledge based real time monitoring system for aquaculture using IoT,” in 2017 IEEE 7th Int. Advance Computing Conf. (IACC), Hyderabad, India, pp. 318–321, 2017. [Google Scholar]
29. P. Kirankumar, G. Keertana, S. A. Sivarao, B. Vijaykumar and S. C. Shah, “Smart monitoring and water quality management in aquaculture using IOT and ML,” in 2021 IEEE Int. Conf. on Intelligent Systems, Smart and Green Technologies (ICISSGT), Visakhapatnam, India, pp. 32–36, 2021. [Google Scholar]
30. K. Dhenuvakonda and A. Sharma, “Mobile apps and internet of things (IoTA promising future for Indian fisheries and aquaculture sector,” Journal of Entomology and Zoology Studies, vol. 8, no. 1, pp. 1659–1669, 2019. [Google Scholar]
31. Z. Shareef and S. R. N. Reddy, “Design and development of IoT-based framework for indian aquaculture. In Intelligent Communication,” Control and Devices, Springer: Singapore, pp. 195–201, 2020. [Google Scholar]
32. M. Wu, X. Zhang and T. Wu, “Research on the aquaculture multi-parameter monitoring system,” in 2010 2nd Int. Asia Conf. on Informatics in Control, Automation and Robotics (CAR 2010), Wuhan, China, vol. 1, pp. 76–79, 2010. [Google Scholar]
33. D. S. Simbeye, J. Zhao and S. Yang, “Design and deployment of wireless sensor networks for aquaculture monitoring and control based on virtual instruments,” Computers and Electronics in Agriculture, vol. 102, pp. 31–42, 2014. https://doi.org/10.1016/j.compag.2014.01.004 [Google Scholar] [CrossRef]
34. M. Lafont, S. Dupont, P. Cousin, A. Vallauri and C. Dupont, “Back to the future: IoT to improve aquaculture: Real-time monitoring and algorithmic prediction of water parameters for aquaculture needs,” in 2019 Global IoT Summit (GIoTS), Aarhus, Denmark, pp. 1–6, 2019. [Google Scholar]
35. S. Liu, H. Tai, Q. Ding, D. Li, L. Xu et al., “A hybrid approach of support vector regression with genetic algorithm optimization for aquaculture water quality prediction,” Mathematical and Computer Modelling, vol. 58, no. 3–4, pp. 458–465, 2013. [Google Scholar]
36. I. Ullah and D. Kim, “An optimization scheme for water pump control in smart fish farm with efficient energy consumption,” Processes, vol. 6, no. 6, pp. 65, 2018. [Google Scholar]
37. X. Ta and Y. Wei, “Research on a dissolved oxygen prediction method for recirculating aquaculture systems based on a convolution neural network,” Computers and Electronics in Agriculture, vol. 145, pp. 302–310, 2018. https://doi.org/10.1016/j.compag.2017.12.037 [Google Scholar] [CrossRef]
38. G. Gao, K. Xiao and M. Chen, “An intelligent IoT-based control and traceability system to forecast and maintain water quality in freshwater fish farms,” Computers and Electronics in Agriculture, vol. 166, pp. 105013, 2019. https://doi.org/10.1016/j.compag.2019.105013 [Google Scholar] [CrossRef]
39. M. Ahmed, M. O. Rahaman, M. Rahman and M. A. Kashem, “Analyzing the quality of water and predicting the suitability for fish farming based on IoT in the context of Bangladesh,” in 2019 Int. Conf. on Sustainable Technologies for Industry 4.0 (STI), Dhaka, Bangladesh, pp. 1–5, 2019. [Google Scholar]
40. W. Jin, A. Khudoyberdiev and D. Kim, “Risk assessment inference approach based on geographical danger points using student survey data for safe routes to school,” IEEE Access, vol. 8, pp. 180955–180966, 2020. https://doi.org/10.1109/ACCESS.2020.3028852 [Google Scholar] [CrossRef]
41. S. Hochreiter and J. Schmidhuber, “Long short-term memory,” Neural Computation, vol. 9, no. 8, pp. 1735–1780, 1997. [Google Scholar] [PubMed]
Cite This Article
 Copyright © 2023 The Author(s). Published by Tech Science Press.
This work is licensed under a Creative Commons Attribution 4.0 International License , which permits unrestricted use, distribution, and reproduction in any medium, provided the original work is properly cited.
 Downloads
 Citation Tools