
 Submit a Paper
 Propose a Special lssue
 Open Access
REVIEW

A Systematic Literature Review of Deep Learning Algorithms for Segmentation of the COVID-19 Infection
Department of Computer Science, College of Computer and Information Sciences, Umm AlQura University, Makkah, 24231, Saudi Arabia
* Corresponding Author: Shroog Alshomrani. Email:
Computers, Materials & Continua 2023, 75(3), 5717-5742. https://doi.org/10.32604/cmc.2023.038059
Received 25 November 2022; Accepted 28 February 2023; Issue published 29 April 2023
 View Full Text
 Download PDF
Abstract
Coronavirus has infected more than 753 million people, ranging in severity from one person to another, where more than six million infected people died worldwide. Computer-aided diagnostic (CAD) with artificial intelligence (AI) showed outstanding performance in effectively diagnosing this virus in real-time. Computed tomography is a complementary diagnostic tool to clarify the damage of COVID-19 in the lungs even before symptoms appear in patients. This paper conducts a systematic literature review of deep learning methods for classifying the segmentation of COVID-19 infection in the lungs. We used the methodology of systematic reviews and meta-analyses (PRISMA) flow method. This research aims to systematically analyze the supervised deep learning methods, open resource datasets, data augmentation methods, and loss functions used for various segment shapes of COVID-19 infection from computerized tomography (CT) chest images. We have selected 56 primary studies relevant to the topic of the paper. We have compared different aspects of the algorithms used to segment infected areas in the CT images. Limitations to deep learning in the segmentation of infected areas still need to be developed to predict smaller regions of infection at the beginning of their appearance.Keywords
Coronavirus is a severe acute respiratory syndrome, an acronym called (SARS-CoV-2), and the world health organization (WHO) termed it COVID-19 in February 2020 [1]. Due to the ongoing spread of COVID-19 despite strict preventive efforts, WHO declared Coronavirus as a global pandemic at the International Health meeting held in March 2020 [2]. Furthermore, the WHO announced a global emergency on 30th January 2020 after the quick spread of Coronavirus within 1 month worldwide from the first case recorded on 8 December 2019 in Wuhan, China [3]. COVID-19 is a highly contagious beta-coronavirus; until now, the confirmed cases are about 753,001,888 and 6,807,572 deaths, and the right source of this virus is unknown [4]. The lung infection is called pneumonia and causes inflammation of the tiny air sacs, filling with a lot of fluid and pus, making breathing difficult. These sacs are where the inhaled oxygen is processed and delivered to the blood. This damage causes tissue to rupture and block the lungs. In addition, the walls of these sacs can thicken, making breathing very hard. Pneumonia strikes people as a complication of viral illnesses like COVID-19, the flu, or the common cold, but bacteria, fungi, and other microorganisms can also generate it [5,6]. This infection does diagnose by reverse transcription-polymerase chain reaction (RT-PCR) as a standard examination. The test takes an oropharyngeal or nasopharyngeal swab, bronchial lavage, or tracheal aspirate. The RT-PCR test has a high error rate that is considered low sensitivity at 60%–71% for detecting COVID-19 and needs to be repeated until the existence of the virus is confirmed. Blood tests, X-Ray images, and computed tomography can also use as complementary tools to the RT-PCR test. A computed tomography scan of the chest area can complement the diagnosis even before symptoms appear in patients, where it clarifies the damages of COVID-19 on the lungs [7]. Computerized tomography (CT) can visualize almost all body parts, diagnose disease or injury, and plan medical, surgical, or radiological treatment. CT computer processing creates cross-sectional images (slices) of the bones, blood vessels, and soft tissues to provide better-detailed information. For example, CT scans of people with COVID-19 infection contain ground-glass opacity (GGO), consolidation (CON), and pleural effusion [8].
Computer-aided diagnosis (CAD) based on artificial intelligence (AI) has recently played an effective and influential role in medical imaging and effective diagnoses. Machine learning and deep learning algorithms help assign a class to every pixel location of the image to extract the regions of interest (ROI), called segmentation [9]. Segmentation is the primary field of medical image processing to help radiology specialists make decisions about diagnosing diseases such as infections, cancer, and many others by taking images of the lung, heart, liver, or even the whole body. In addition, the medical images, two-dimensional (2D) or three-dimensional (3D), are used as complementary tools with other tests to give a doctor an overview of the patient, which shows the organ parts, and facilitates decision-making, especially in the early stages [10]. Many deep learning algorithms are widely used in medical image segmentation. For example, a fully convolutional network (FCN) [11] was suggested as a pixels-to-pixels network for image segmentation, and U-Net [12] was presented for biomedical image segmentation. After the emergence of the Coronavirus and the presence of datasets in open resources that helps identify damaged areas of infection, researchers worked to find a solution for the segmentation of the infected areas in the lung. This paper aims to show the 2D and 3D supervised methods and solutions to the image segmentation problem to find the area of lung inflammation COVID-19 from computed tomography images. A systematic literature review composes of searching papers related to certain keywords, selecting the papers according to well-defined inclusion and exclusion criteria, and managing the selected research in a meaningful way. This systematic literature review is undertaken to answer the following questions:
RQ1: What are the existing deep learning methods applied to detect and segment the
COVID-19 infection area in CT images?
RQ2: What are data augmentation methods for the datasets used in the deep learning methods?
RQ3: What are the loss functions to optimize the free parameters in the deep learning methods?
Different two-dimensional and three-dimensional deep learning methods are compared with emphasis on their usefulness and performance to answer the question RQ1. Moreover, due to smaller datasets and deep learning demands larger datasets, different augmentation methods are compared in the paper (RQ2). Loss functions are also essential in the training of learning algorithms. Hence different loss functions are discussed in the paper (RQ3).
Remainder of this paper includes the following sections; Section 2 defines the methodology of systematic reviews and meta-analyses (PRISMA) flow to provide an abstraction layer for searching the papers on COVID-19 image segmentation. Section 3 summarizes methods to segment the infection areas in 2D and 3D images. In the next section, different data augmentation methods are listed and explained. Loss functions used to optimize the free parameters are compared in Section 5. Section 6 compares the published methods and discusses their application in the segmentation of COVID-19 infection. Finally, the Conclusion and future work are presented in the last section.
2 Literature Review Methodology
We have done this systematic review using systematic reviews and meta-analyses (PRISMA) flow with metadata analysis [13]. We initially identified the published research to segment COVID-19 infection from computed tomography by deep learning methods. The research on segmentation on CT images started in 2020 when the first open-source COVID-19 segmentation dataset was published by the European Institute for Biomedical Imaging Research (EIBIR). We have used Google scholar, IEEE Xplore, and ScienceDirect databases to find all the papers related to COVID-19 segmentation in the CT scan images. As shown in Fig. 1, in the PRISMA flow identification stage, we used the following keywords for search about studies: COVID-19 segmentation, COVID-19 pneumonia, CT-images segmentation, and COVID-19 deep learning with a limitation for the years from 2020 to 2022. As a result, we found 991 studies in Google scholar, 37 in IEEE Xplore, and 551 in ScienceDirect.
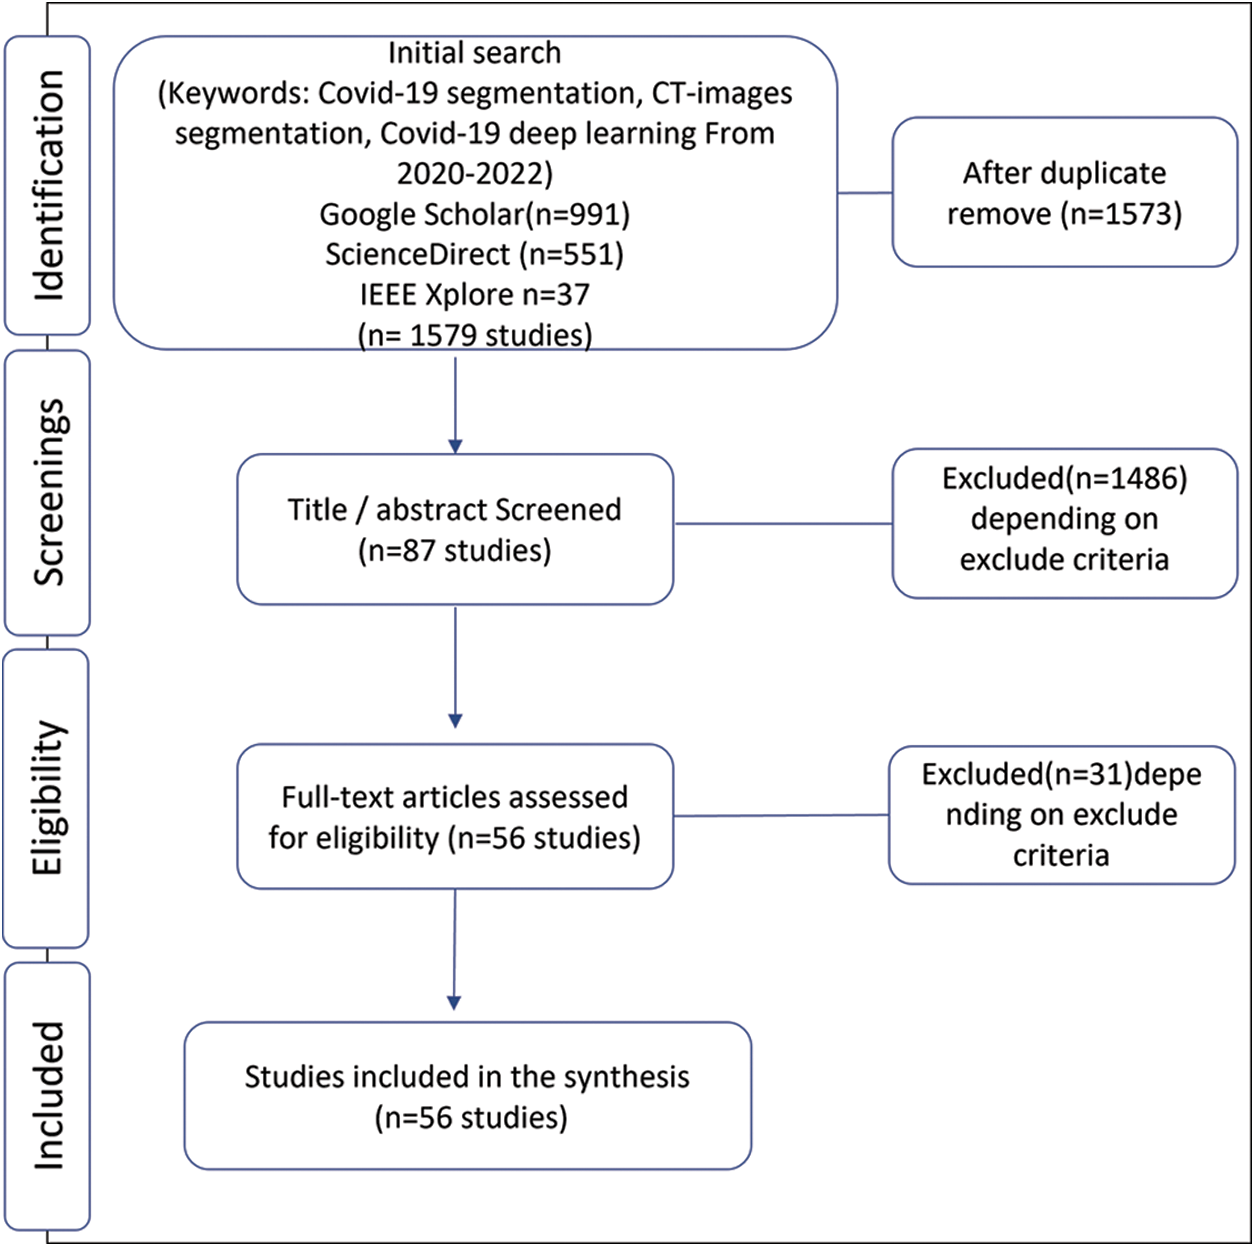
Figure 1: Selection of papers for the systematic literature review
Subsequently, the second stage of PRISMA flow is screening; we excluded some papers reading the title and abstract using the exclusion criteria explained below,
Exclusion criteria in the first and second steps include:
EC1. Studies must be peer-reviewed articles published in the English language.
EC2. This review does not include books, notes, theses, letters, and patents.
EC3. Papers focusing on methods or application areas other than applying deep learning methods to the problem of COVID-19 infection area segmentation in CT images are excluded.
EC4. A unique contribution is considered for inclusion, and repeated studies are not included.
EC5. Those articles which do not describe the methodology and result sufficiently are excluded.
EC6. Those articles that do not address the research questions mentioned above are not included.
Since this paper focuses on the problem of segmentation using deep learning, so any task other than segmentation is excluded. Also, papers that contain lung segmentation only and do not segment infections are also excluded. So, our focus is on segmentation infections caused by COVID-19. In addition, this paper includes only one type of medical image, computed tomography, and we excluded any other type used to solve this problem. Depending on excluded criteria, we checked the paper’s eligibility by analyzing the literature review and excluding those who did not achieve it. The basis for this review is the deep learning algorithms used in supervised hashing to solve the infection hashing problem. Finally, we selected 56 papers related to COVID-19 segmentation in CT scan images.
3 Methods Used for COVID-19 Infection Segmentation
Several algorithms have already performed very well in medical image segmentation to help clinicians support decision-making. However, the segmentation model performance depends on the kind of disease, dataset quality, and type of medical image device. Since the computed tomography scan is three-dimensional, each scan has several two-dimension cross-sectional images (slices) from each angle. Therefore, the segmentation task to segment the COVID-19 infection can be designed in 2D based on slice level or it can also be done on CT images at the 3D level.
Fig. 2 shows the framework of the medical image analysis for COVID-19 lung infection segmentation. The workflow begins with preparing the chest CT COVID-19 dataset by preprocessing methods. After that, the data augmentation method increases datasets for better generalization. Then, the dataset is split into training, validation, and testing sets. Afterward, the training and validation set is fed to deep learning segmentation models for the training process. Finally, the model is tested on the testing set and predicts the segmentation mask of infection, different shapes of infection, and lung regions.
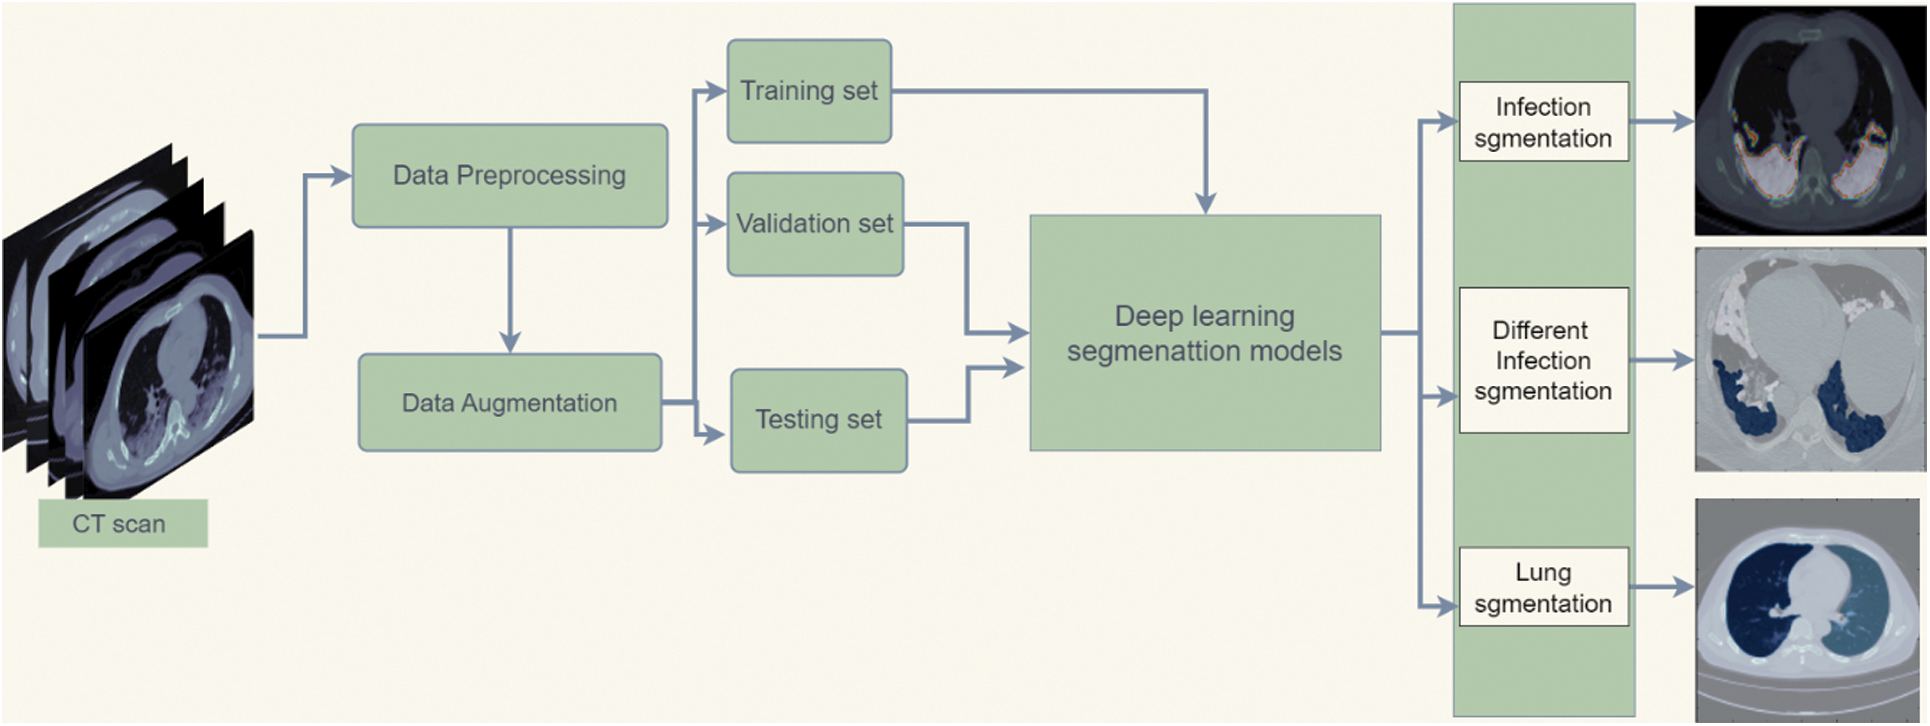
Figure 2: Flowchart diagram of the implemented COVID-19 infection segmentation
This section explains different two-dimensional and three-dimensional models developed to deal with computed tomography images of COVID-19 pneumonia.
Computed tomography images are three-dimensional images taken from different angles of organs. The slices of CT-scan for each patient were extracted and fed as two-dimensional images to the 2D models. These models then segment the infection area on the 2D images. 2D deep learning segmentation algorithms use 2D functions can capture context maps for one slice across the height and width. The 2D model is robust against changes in CT images, have low computational costs, and has better results in diagnosing diseases [14].
3.1.1 Fully Convolutional Network (FCN)
The COVID-19 infection was segmented from a CT scan by an FCN-8 comprising of convolution, pooling, and up-sampling layers [11,15]. An FCN network does not contain a dense layer like classic convolutional neural network (CNN); instead, it includes 1 × 1 convolution that achieves the task of fully connected layers and decreases the number of parameters and computation time. FCN architecture contains two parts: the down-sampling (encoder) path, which is responsible for capturing contextual information, and the upsampling (decoder) path, which retrieves spatial information.
U-Net [12] is an artificial neural network (ANN) built upon the FCN with incredible accomplishments in medical image segmentation. It has been used for segmenting COVID-19 infection from CT images [16]. The U-Net has a symmetric structure with four stages. The encoder is organized to extract the features from input images by convolutional layers. The decoder outputs the segmentation mask. The encoder and decoder are connected using a bottleneck. Moreover, U-Net is characterized by a Skip-Connections connection between encoder stages and corresponding decoder stages by a concatenation operator rather than a sum. It allows the decoder to use feature information from the deeper layers and the spatial information from before layers to generate high-resolution output masks. The light U-Net was proposed with three stages of encoder and decoder [15]. This U-Net model required less than 3 MB of storage space.
An adjusted version of the U-Net model was proposed with a block change to deal with a small COVID-19 CT image dataset [17]. It has four encoder blocks and four decoders as the U-Net model. Each block consists of two convolutional, rectified linear activation function (ReLU), then batch normalization and max-pooling layers. In the decoder part, an up-sampling operation aims to recover spatial information. For each decoder, the block consists of an upsampling layer followed by the concatenate layer to join the previous layer. The last layer is a convolutional layer containing a single neuron to illustrate the single-segmented result with a sigmoid function. ResNeXt-Attention U-Net proposed based on U-Net with ResNeXt blocks [18] with better training costs in encoder-decoder and attention mechanism in the decoder to segment COVID-19 lesion. An increase in cardinality is more helpful than an increase in layers in ResNet.
The Attention R2 U-Net proposed to extract the pixel information of COVID-19 segmentation [19]. This model integrates a recurrent residual convolutional neural network based on U-Net (R2U-Net) [20] and Attention U-Net [21] to deal with this issue. In Attention R2U-Net uses recurrent convolutional blocks with the residual unit in the encoder and decoder parts where the attention gate is used in the decoder. The ensemble learning of two U-Net models is proposed to segment COVID-19 infection [22]. The first U-Net model segment the lung regions from CT images. The lung mask extracted by the first model is fed as input for the second U-Net model to extract infection or shapes of lesions (GGO and CON).
The Deformable Attention Net (DDANet) model [23] is proposed based on U-Net, and criss-cross attention (CCNet) [24]. The proposed model has the same structure as Oktay et al. [21], with three stages of the U-Net model structure with criss-cross attention module inserts in the bottleneck to capture non-local interactions. A Feature Fusional U-Net (FDA-UNet) with deep supervision and attention mechanism with feature fusion technology and attention blocker is proposed to segment different infection shapes [25]. It combines several levels of features to generate global information that helps extract features in a balanced way to deal with various regions of COVID-19 infections.
Residual Dilated U-net is proposed based on U-Net with replaced encoder and decoder blocks with repetitive residual blocks [26]. The output of residual blocks is fed to the Squeeze Excitation (SE) unit to remove repetitious features. Afterward, squeeze excitation output is provided to the Dilated Convolution (DC) module to increase the receptive field and capture multiscale context. As an improvement of the U-NET model, the total variation U-Net (TV-Unet) is proposed, which is U-Net architecture with Total Variation (TV) addition that enhances computationally backward pass gradient update [27]. TV work to penalize the generated images has considerable dissimilarities between neighboring pixels. They suggested adding a 2D-TV regularization term to the loss function to improve the connectivity for the predicted segmentation areas [28]. Multi-point Supervised Network (MPS-Net) is suggested on U-Net to extract multiscale features for COVID-19 areas from CT images [29]. MPS-Net model replaced the U-Net’s convolution operation by Inception structure with various kernel sizes (1 × 1, 3 × 3, 5 × 5) to improve generalization. Moreover, the skip connection in U-Net is replaced with a sieve connection module (SCM) that reduces the channels to half. The multi-point supervision (MPS) was used by doubling the decoder. After each up-sample, they applied the attention gate (AG) in the second decoder path to focus on more important features.
Channel Attention U-Net architecture proposed based on U-Net encoder-decoder to deal with different areas of COVID-19 infection [30]. The encoder contains a convolutional block 3 × 3 with stride 2 to replace the pooling layers, res_dil block, heeded with skip connection to get feature representations. The decoder consists up-sampling layer followed by a convolution, then concatenation with corresponding encoder features. The res_dil block is a residual block with dilated convolutions that are useful in getting multiple scale features. The spatial and channel SE blocks (scSE) attention mechanism is proposed in the encoder and decoder to obtain features representation channel-wise and spatial-wise. Chest-Net (CHS-Net) is a model developed based on a U-Net with two residual attention inception U-Net (RAIU-Net) networks in a sequence of encoder-decoder [31]. The first model produces lung shape maps, and the second identifies the infected regions from the first output image. The architecture of RAIU-Net replaces each convolution in U-Net with inception blocks. The inception block contains linked 1 × 1, 3 × 3, and 5 × 5 depth-wise separable convolution and hybrid pooling heeded by batch normalization and ReLU. After the inception block, the residual learning approach and the output features from each residual inception block (RIB) connect with the corresponding decoder by skip connection. The skip connection also contains spectral-spatial, and depth attention (SSD) holds the essential feature maps. Attention gate-dense network-improved dilation convolution U-Net (ADID-UNET) is proposed based on U-Net with an encoder-decoder structure [32]. They add a dense network proposed by [33], improved dilation convolution (IDC), and the attention gate (AG). IDC increases the receptive field and collects exact edge features from the little lesion areas used between the encoder and decoder. The decoder skips the encoder and replaces the first two up-sampling operations with two dense networks to avoid losing features. The decoder final layer feature map is given to the Sigmoid function to predict the COVID-19 infection mask. The model D2AU-Net is proposed and established on the U-Net structure with add gate attention module (GAM) and a decoder attention module (DAM) to obtain better feature representation [34]. The ResNeXt-50 (32 × 4d) model [35] pre-trained on the ImageNet dataset used in the encoder can offer a better parameter initialization and improve generalization ability. A gated attention mechanism with channel and spatial attention is added inside skip connections to use high and low feature representations. Furthermore, they used another fused attention mechanism in the decoder to refine feature maps after up-sampling. This hybrid dilated convolution module [36] was employed in a decoder’s residual attention block (RAB) to improve the receptive field.
COVSeg-Net model is based on the architecture of U-Net [37]. The model combines convolutional layers in the encoder with the corresponding decoder to increase contextual information. Each encoder block of COVSeg-NET has convolution layers with 3 × 3 kernels and a max-pooling layer. A max pooling layer with an exponential linear unit (ELU) activation function is used to decrease the dimension of features. The decoder block consists of an upsampling layer of 2 × 2 kernel, a convolution layer, and a dropout layer. In the last layer, the convolutional layer of the 1 × 1 kernel with the Sigmoid function predicts the COVID-19 segmentation mask. O-Net is a light model proposed based on U-Net consisting of two convolutional auto-encoders with up-sampling and down-sampling channels and two bottlenecks [38]. Each up-sampling and down-sampling channel contains a stage with two convolution layers, each layer followed by batch normalization and a ReLU. The skip connections are applied between the channels.
The MultiResU-Net model is proposed to analyze entities at various scales [39]. It uses some modifications to segment COVID-19 infection [40]. MultiResU-Net contains an encoder and decoder, where the encoder has five residual blocks and four MultiRes blocks in a decoder. Change the convolution structure by using a skip connection with LeakyReLu and Batch Normalization in the encoder inside Residual Block. HADCNet model is proposed based on U-Net and contains hybrid attention modules in five stages of encoder and decoder [41]. It helps balance the semantic differences between various levels of features that refine the feature information. The hybrid attention modules are used in the encoder with densely connected features, and hybrid dilated convolutions to extract contextual information and increase the receptive domain.
A residual guided U-Net (RGU-Net) model is proposed based on an encoder and decoder to alleviate the vanishing gradient problem by replacing direct convolutional with residual guided blocks [42]. The encoder extracts spatial and contextual information by initializer-Block, four U-Block, and five Skip-Connection blocks. Residual-Block consists of a skip-connection block that joinsthe initializer block and each U-Block to localize the minor infection regions. In the bridge, after the encoder part, the spatial feature map is fed to the Connector-Block and then to the decoder. The decoder has the same structure as the encoder, with add 2D-Upsample layer after each U-Block and skip-connection block.
3.1.3 Three-Encoder, Three-Decoder Model
The architecture has two parts: encoder and decoder proposed to deal with limited datasets problem [43]. The encoder has three stages of extracting features; each consists of one from the convolutional 3 × 3, ReLU, and max-pooling layers. In the decoder, an up-sampling operation aims to recover spatial information. The decoder is the opposite of the encoder function within three stages. The decoder part consists of three deconvolutional 4 × 4 layers. The SoftMax’s last decoder layer, followed by the pixel classification layer, generates a mask of COVID-19.
3.1.4 Ensemble Models in the Encoder
The end-to-end framework includes different pre-trained encoder segmentation models on the ImageNet dataset, including Inception-V3, Xception, InceptionResNet-V2, and DenseNet-121, with some improvements to aggregate their advantages to overcome the complexity of covid-19 infection [44]. The fully connected of each model is replaced by the decoder that contains four decoding blocks per decoder consisting of a 2 × 2 up-sampling layer, a convolution layer with a kernel size of 3 × 3, the ReLU activation function, and the Batch-Normalization layer. Finally, the SoftMax function is used to predict each pixel class. Finally, aggregate the results of multiple models by soft voting for each image pixel. The proposed model used the pixel-level majority vote to aggregate outcomes to get the last class probabilities for each image pixel.
A dual multiscale dilated fusion network (DMDF-Net) is proposed with two same DMDF-Net networks architecture, one for extracting lung masks and the other for infection [45]. DMDF-Net is contained from pre-trained MobileNetV2 as an encoder with four multiscale dilated convolutional to enhance segmentation. The decoder includes two transposed convolutional layers with four dilated convolutional.
The Miniseg model is proposed to extract multiscale features and deal with limited datasets with 83 K parameters [46]. It is an encoder-decoder structure and consists of four stages. The encoder is a sub-network that focuses on learning multiscale representations. The encoder contains two paths connected by a series of nested skip pathways. After that, an encoder connects with a decoder by nested skip connections in each stage. The decoder’s first stage contains Parametric ReLU (PReLU) activation function, and the other two stages have Feature Fusion Module (FFM) for aggregation features. The last stage includes just FFM.
The proposed network used the first four stages of resnet101 as the backbone [47,48]. After that, the pyramid attention module (PAM) takes two feature maps of current and deeper stages as inputs. PAM contains merges of atrous spatial pyramid pooling module [49] and channel attention module [50] that help extract multiscale features by concentrating on the background. Second, the feature obtained from PAM is fed to a residual convolution module (RCM) which can improve the segmentation accuracy of the network. Next, the output is provided to RCM, which enhances segmentation by describing features. The output of RCM blocks is upsampled to previous PAM modules.
CogSeg is proposed to enhance segmentation focus on spatial dimension [51]. The network contains two parts: segmentation as the primary task and super-resolution (SR) as an extra task. SR is reconstruction supervision optimization, which uses boundary information to improve segmentation performance. This network used the U-Net encoder-decoder architectures as SR and segmentation backbone. CogSeg contains two common-weight encoders and two decoders that aim to learn task-independent representations of SR and segmentation.
Quadruple Augmented Pyramid Network (QAP-Net) is proposed based on encoder-decoder architecture [52]. This network backbone used four proposed augmented pyramid network modules. First, Atrous spatial convolutional replaced the traditional convolutional to increase the receptive field. The CNN-based augmented pyramid consists of two parallel atrous modules that act as a skip connection from an encoder to the decoder.
The SegNet is a network consisting of encoder-decoder pairs to learn various resolutions [53]. Each block in the encoder applies the Convolution, Batch-Normalization, and ReLu activation functions. After that, the max-pooling operation is applied to the obtained result and fed as input for the following encoder and corresponding decoder. The decoder inputs have been received upstream using the features of an encoder. The last of SegNet output is fed to the SoftMax layer from the previous decoder. A-SegNet model combines attention gates (AG) with the traditional SegNet model [54]. The hybrid deep learning method is proposed both Visual Geometry Group (VGG) and ResNet as an encoder for standard SegNet and U-Net to deal with infection segmentation [55].
3.1.11 PSGR Module with U-NET and
The pixel-wise sparse graph reasoning (PSGR) module is proposed to use an inside segmentation model, which enhances the feature extraction process, mainly unsure pixels, and prevents the spread of noise [56]. PSGR is a graph generated by displaying each pixel on a node based on the features generated by the segmentation backbone model. It contains sparse graph construction and long-range information reasoning with a higher-order graph neural network (HO-GNN) [57] to capture the complex structure. The PSGR module was tested and added to the decoder of standard U-Net [12] and
3.1.12 Focal Attention Module (FAM)
A focal attention module (FAM) is inspired by a residual attention network that contains channel and spatial attention, a residual branch into the feature map [59]. Channel attention helps extract meaningful features. The residual branch works as a feature chooser; if the input slice is negative, it gives fewer feature values. At the same time, spatial attention focuses on this feature by using a convolutional block attention module (CBAM) [60] to capture features at different scales.
A multi-level atrous spatial convolution network (MASC-Net) was proposed on anencoder-decoder structure [61]. The encoder part extract features by taking the CT scan and the histogram-equalized version of it because some areas of the lesion have low contrast compared to most infection-annotated regions. The two feature maps input is generated by passing through a receptive field block (RFB).
The multi-Level Context Attentional Feature Fusion (MLCA2F) framework is proposed to concentrate on the lesion regions and capture contextual information [62]. It contains three multiscale context-attention networks (MSCA-Net) blocks. Each MSCA-Net block has six integrating Multiscale Contextual Feature Fusion (MC2F) and multi-context attentional feature (MCAF) modules to extract the COVID-19 infection sufficiently.
Anamorphic depth embedding-based lightweight CNN called (Anam-Net) was developed for COVID-19 infection segmentation from computed tomography images [63]. It is light with 4,47M parameters that make inferences in mobile or resource control point-of-care platforms. Anam-Net combines UNet’s and ENet’s models, which take from U-Net encoder-decoder architecture and ENet fewer parameters. This model uses the lung mask, segmented before by pre-trained U-Net as input, and predicts with SoftMax the mask with three-pixel classes background, abnormal (infection), and normal (lung pixels).
The double U-shaped dilated attention network (DUDA-Net) is proposed to enhance segmentation [64]. The DUDA-Net contains a coarse-to-fine network with a coarse network for lung segmentation and a fine network for infection segmentation. First, the CT image is input to a coarse segmentation network. The small-sized segment infection is more complex than lung segmentation, so a fine segmentation network is added. The fine network takes the lung region segmented by the coarse network as input. Fine segmentation uses a dilated convolutional attention (DCA) block channel attention mechanism to focus on regions and obtain multiscale receptive fields.
Covid-Rate is a network proposed based on an encoder-decoder with a context perception boosting module (CPB) [65]. They adopted the CPB module to deal with the failing convolution layer in learning long-range dependencies. The features extracted are fed to the decoding path, which contains four decoding blocks.
LungInfseg is based on an encoder and decoder structure [66]. The encoder includes discrete wavelet transform (DWT) and four receptive fields aware module (RFA) blocks. Moreover, RFA also contains a learnable parallel dilated group convolutional block (LPDGC) and a feature attention module (FAM). The LungINFseg method obtains CT images as input and creates binary masks with a threshold of 0.5 and the same input image size.
nCovSegNet is a model proposed with ResNet50 backbone network, global context-aware (GCA), and dual-attention fusion (DAF) modules [67]. The nCoVSegNet encoder used the four initial layers of pre-trained ResNet50 with component-enhanced channel attention (ECA) [68] in each ResNet block (RB) to retain texture information. The encoder extracts multi-level features from the input by the hierarchical layers.
3.1.20 Contour-Enhanced Attention Decoder CNN
The contour-enhanced attention decoder CNN model is proposed with an encoder and decoder structure [69]. The six-encoder block has three convolutional branches and various receptive field sizes. The encoder block has four outputs, one to the next encoder block and the rest for the five corresponding cross-attention models in the decoder. In two final decoder blocks, the contour established on features to guide in tracing of the infected regions. Moreover, spatial attention combines structural features, including shape and boundary information, to predict infection.
3.1.21 Multiscale and Multi-Level Feature Extraction Structure
A multiscale and multi-level feature extraction network is proposed at each pyramid level in encoder and decoder to collect hierarchical contextual information features [70]. In the encoder with five stages, the kernel atrous spatial pyramid pooling layer (KASSP), EDP (expansion, depthwise, and projection), and squeeze and excitation blocks are applied. The equal convolutional depth block is applied to deal with the semantic problem. In contrast, the decoder has EDP squeezes and excitation blocks. The residual connection is also added between the encoder and decoder to work like ResNet. The output generates labels at various scales by applied spatial pyramid pooling on the ground truth segmentation.
3.1.22 Plug-and-play Attention Module
A plug-and-play attention module is proposed to extract spatial features by adding them after the segmentation model [71]. The output features from the segmentation model are fed to the proposed module and obtain the same dimension. After that, the final result is obtained by connecting the output features map with the initial feature map. The plug-and-play attention module has a position offset to build the positional relationship between pixels and capture the pixel’s affinity.
As we mentioned before, three-dimensional computed tomography can use as patient-level input with the 3D segmentation model to capture interslice context. The 3D at the patient level is practically desired, but a large patient number dataset is needed to train the model. The other drawback of 3D models is the high computational cost because of the increased number of parameters used [14]. The standard 3D U-Net has been applied to segment computed tomography images without residual to avoid unnecessary parameter growth [72]. It is the same 2D-Unet structure with an encoder and decoder and four stages. The pixel patch size CT images input to model to overcome the high-cost computational and single channel containing normalized Hounsfield units (HU). 3D ResNet U-Net architecture proposed to solve COVID-19 computed tomography image segmentation [73]. This model encoder consists of four blocks with 18-layer from 3D ResNet pre-trained on the Kinetics-400 dataset [74]. The 3D ResNet fully connected layers replace with a 3D convolutional layer and four decoder blocks. Each decoder block has one transposed convolutional and two traditional convolutional layers, followed by ReLU. The 3D Attention U-Net model is based on standard U-Net an encoder for feature extraction and decoder full-resolution, with four stages with dropout to reduce parameters [75]. The 3D Attention Module is used to discover skip-connection information with more target features that reduce the interference of the background of the CT image. The 3D nnU-Net was proposed based on 3D U-Net to adapt preprocessing automatically and network architectures without manual tuning [76]. It contains five stages and two parts: encoder and decoder. A cascaded 3D UNet is proposed with two 3D UNet, the first segment lung volumes and the second for infection volume [77]. The CT scans with 256 × 256 image size extract patches first and applied augmentation; then fed to 3D U-Net to segment lung volume. These crop volumes output with 128 × 128 × 32 are post-processing to decrease the background pixels and used as input of the second 3D UNet to segment the infected lung region. 3D CU-Net proposed dependent on the 3D U-Net architecture in encoder and decoder, and three stages [78]. The encoder contains a feature encoding module with a channel attention mechanism to focus on necessary information and weights of extracted features. After the encoder blocks, the feature maps are fed to a pyramid fusion module with dilated convolution global information interaction (PDS block) to transform low into high-scale features. The COLI-Net is proposed with 3D-ResNet proposed by Li et al. [79,80] to segment lung and COVID-19. The 3D-ResNet is added to 20 convolutional layers with different dilation factors zero for low-level, two for medium-level, and four for high level. The residual connections connect every two layers.
3D Covid-segNet model is proposed to segment COVID-19 from computed tomography images with an encoder and decoder [81]. The encoder contains four blocks to extract the features. The first block has a residual block, the second and third contain residual and Feature Variation (FV) blocks and the fourth includes residuals with progressive atrous spatial pyramid pooling (PASPP) block. They proposed an FV block that consists of three branches: contrast enhancement branch, position-sensitive branch, and identity branch, which help change parameters to determine the boundaries and area of COVID-19 infection. CovSegNet2D, CovSegNet3D, a hybrid of CovSegNet2D, and CovSegNet3D are proposed with multi-encoder-decoder architecture to enhance infection segmentation [82]. The CovSegNet2D contains five stages of the encoder, decoder, and multiscale fusion (MSF) module, whereas CovSegNet3D has four stages. The hybrid of the CovSegNet2D and CovSegNet3D method divides the segmentation process into two phases to reduce the computational complexity of 3D convolution and benefit multiscale 2D convolutions.
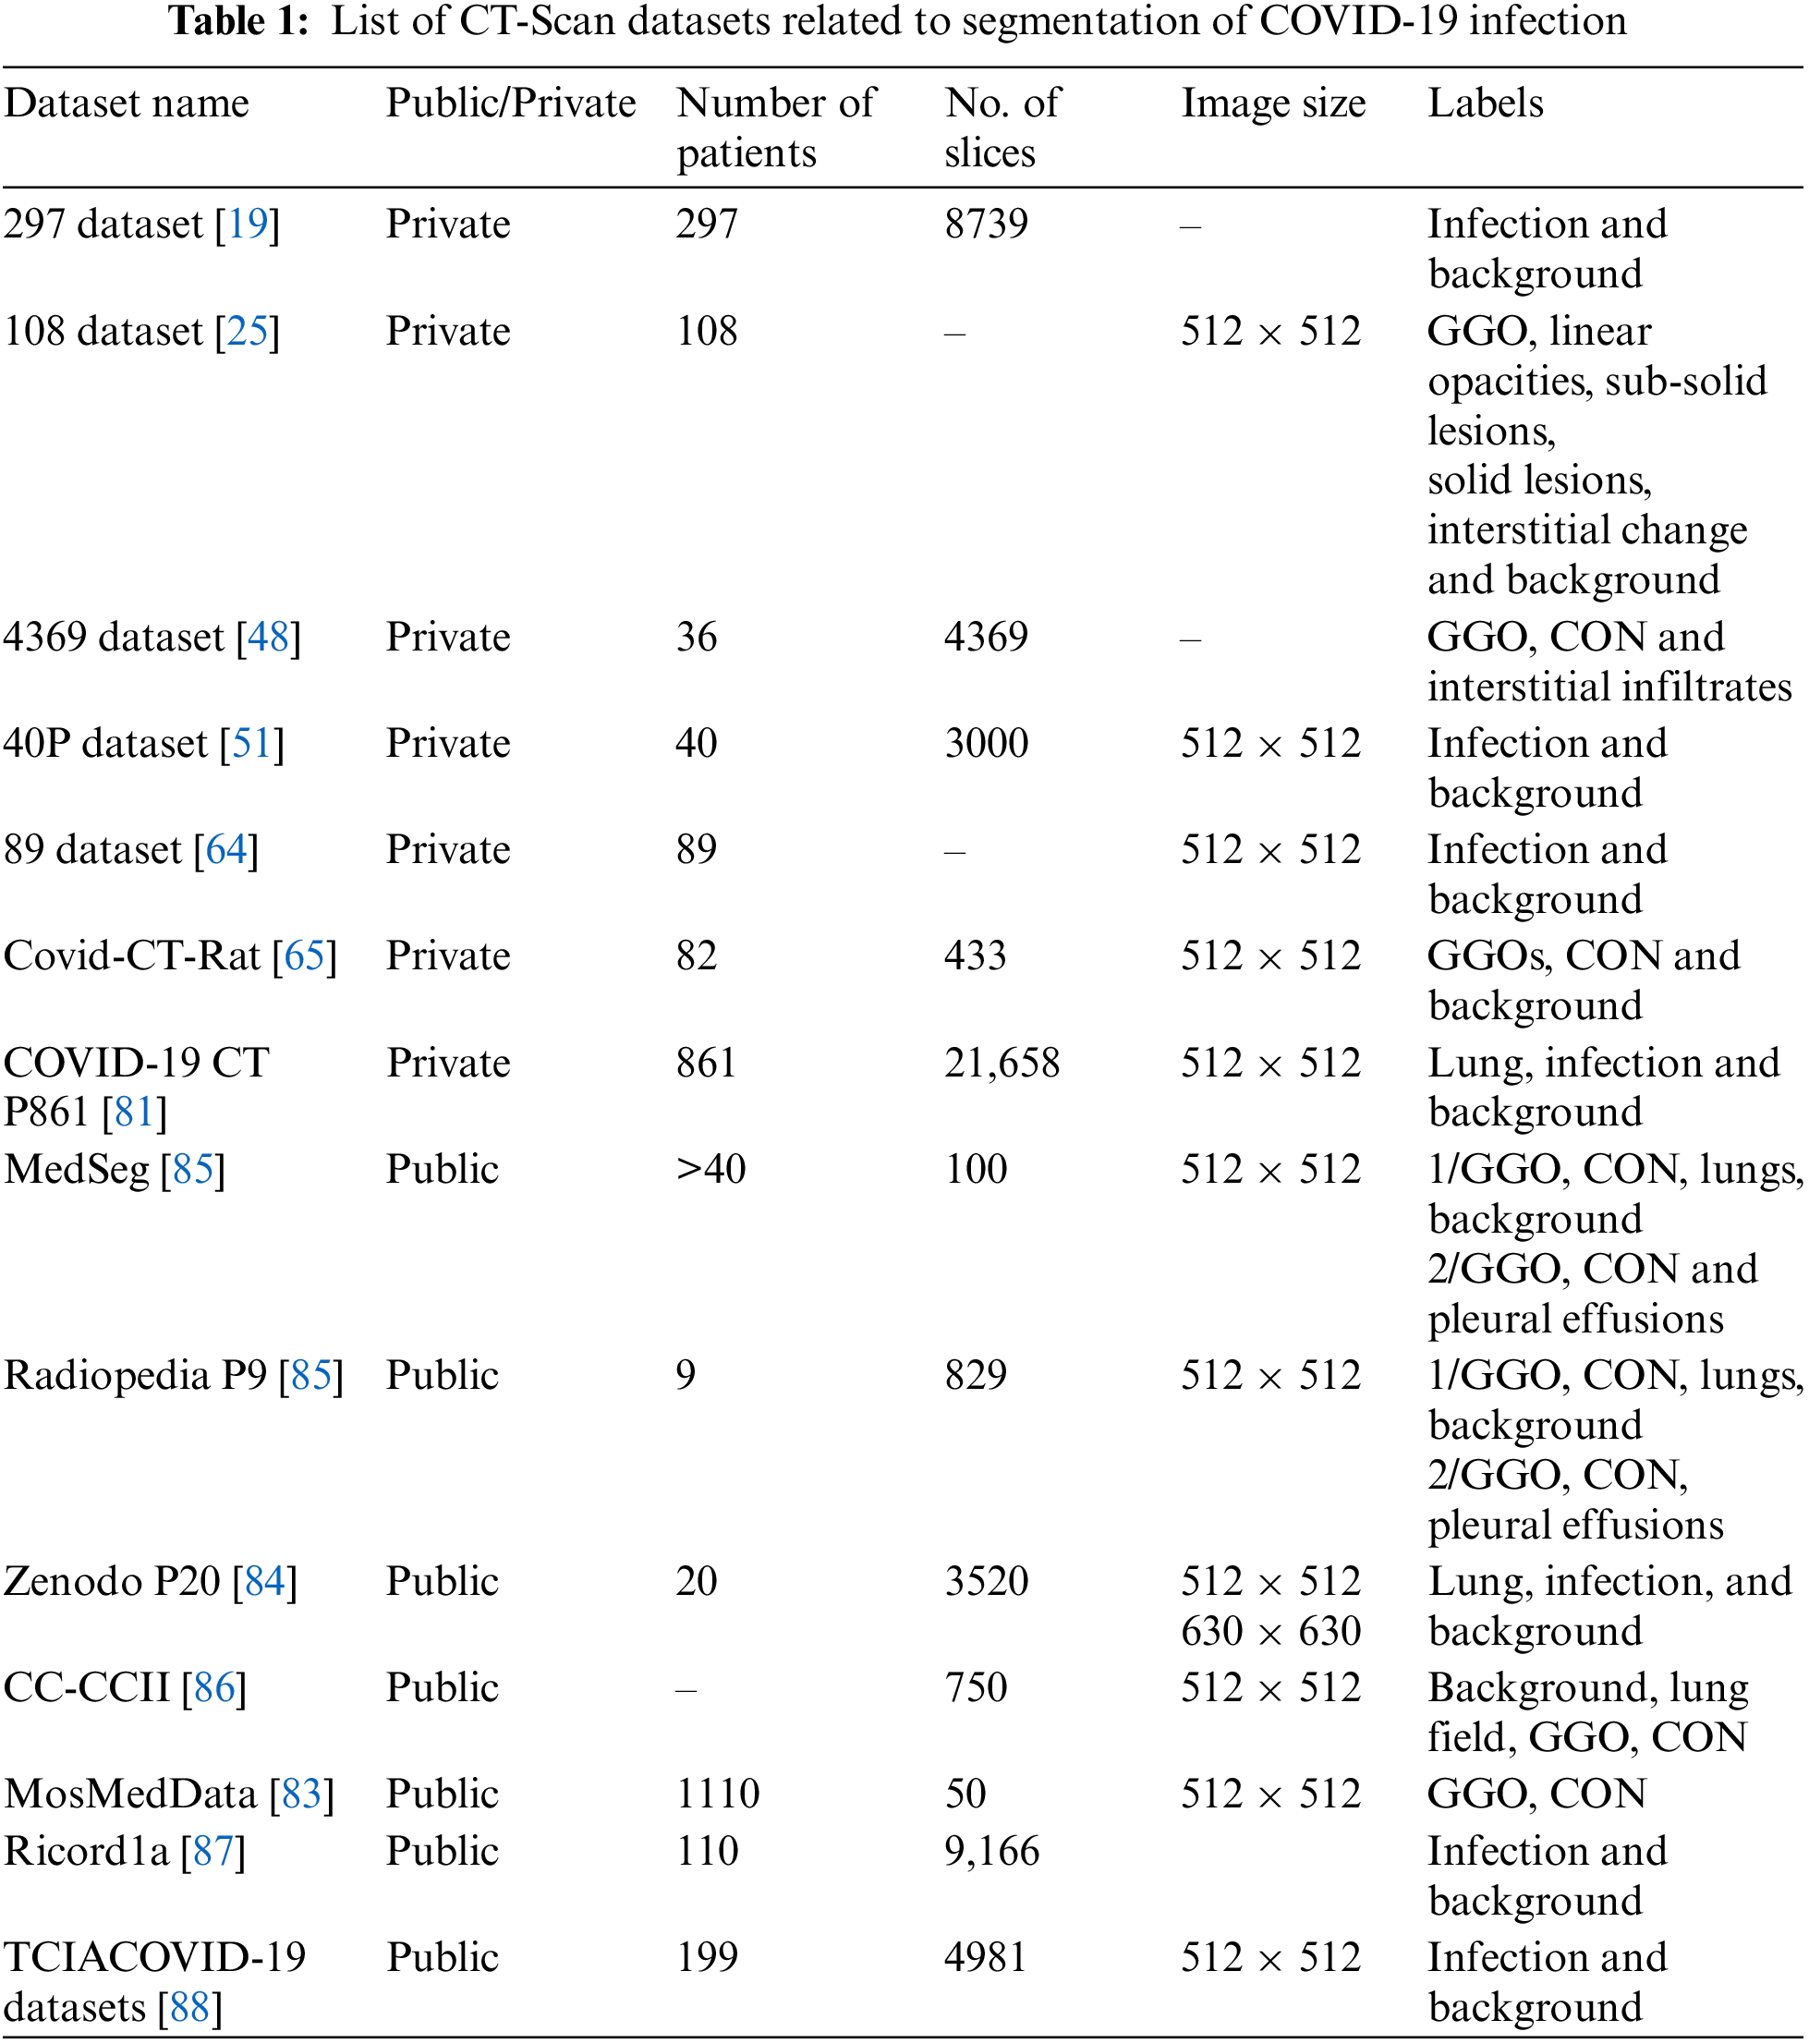
4 CT-Scan Datasets Related to COVID-19
Table 1 summarizes a public and private CT scan datasets related to COVID-19 lung infections. MosMed-Data [83] includes the most number of patients (1110 patients) but is annotated for only two classes ground-glass opacity (GGO) and consolidation (CON). Moreover, only a small subset of the data is annotated (50 slices). Zenodo P20 [84] contains CT-Scans of 20 patients, and all 3520 slices are annotated. Out of the available datasets, most of the published papers used MedSeg, Radiopedia, and Zenodo datasets.
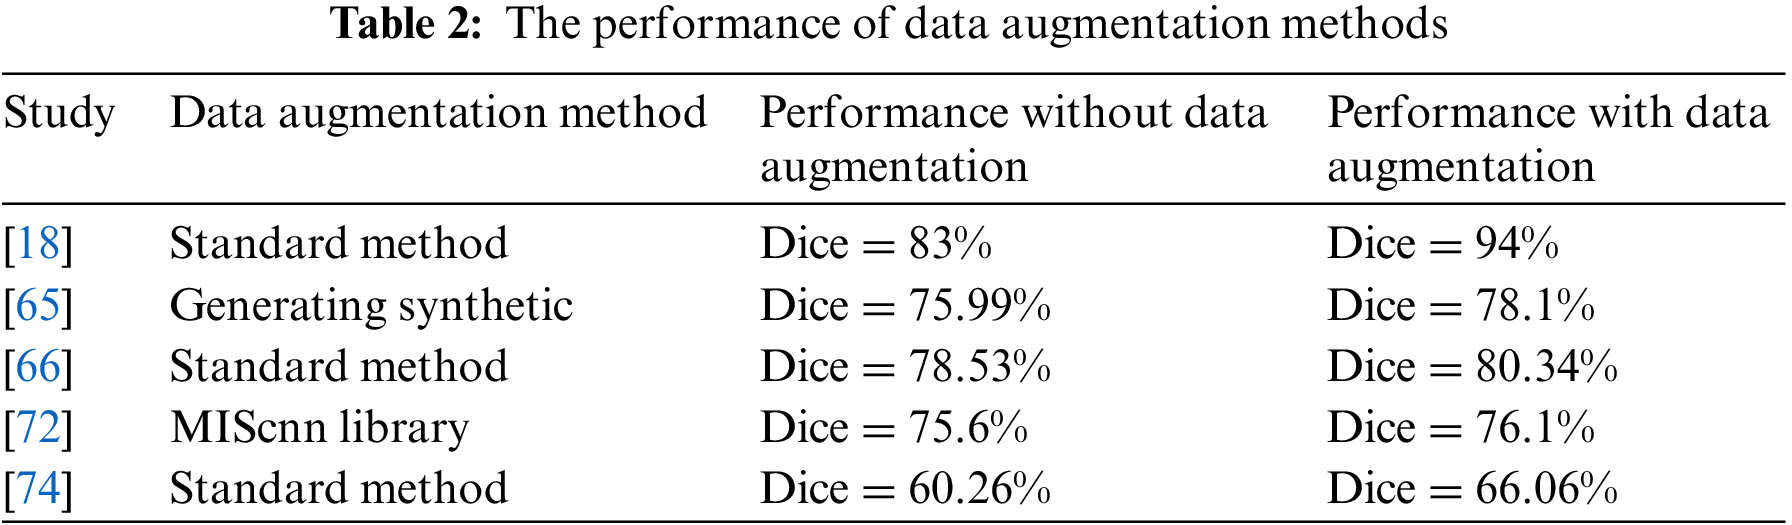
The deep learning algorithms need large datasets in the training process. Primarily, the fact of lack medical image dataset for each disease results in an actual problem of segmentation tasks that help diagnose diseases. Therefore, one problem solution is to increase the computed tomography dataset size by using several data augmentation methods. It includes Geometric transformations, Color space transformations, Kernel filters, Random Erasing, and Mixing images [18,66].
Another data augmentation method used is a medical image segmentation with CNN library (medical image segmentation with convolutional neural networks (MIScnn) library developed for medical image problems [89]. It is used for COVID-19 with three augment types: noisy, spatial, and color augmentation [16,72]. Moreover, the medical images dataset can augment using a generative adversarial network (GAN) dense network for data augmentation [90]. The synthetic CT data from GAN Dense was used to augment and then use the output as inputs to the U-Net model for segmentation. The vertical flipping process for data augmentation is used by merging the original image and the original mask and vertically flipping, then splitting into a new image and mask [32]. The infection regions in CT images of a person infected with COVID-19 are extracted to generate a synthetic pair (slice and related mask) from infected CT images [65]. After that, adding them to CT images from the same CT scanner of a healthy person with a mask of the lung area is taken as input. One way to deal with 3D volume is to split it into patches number and then augment by the rotating, horizontal, and vertical translations, zooming, and shearing the random patch volume [74].
Table 2 illustrates the performance of the segmentation deep learning model with and without different data augmentation methods. The Dice coefficient score when training the model with the data augmentation method is better than the training without augmentation methods. However, these transformations make subtle changes to existing medical images, which may affect disease recognition. As a result, medical image data augmentation methods still need to be developed to introduce more contrast into artificial samples to enhance the training stage.
Supervising segmentation models use various loss functions to guide the convergence model better. The loss functions of the segmentation process are essential in differentiating the categories and covering the edge of the pixel class regions. Some of them are more streamlined to deal with different shapes and hard-edge representations. The COVID-19 infection segments from computed tomography images is a more critical obstacle in diagnosing infections with blurred boundaries. The infection shapes and areas vary from patient to patient, which can mingle with tissues in the organ.
Several loss functions are used to improve and enhance the training proposed models. The effect of loss functions varies depending on the dataset, image resolution, number of images, and category balance. The design of the segmentation algorithm affects the work of the loss function and the layers used to identify pixel classes. In addition, the loss functions used with COVID-19 computed tomography depend on the dataset quality [91]. Fig. 3 illustrates the primary loss functions used as loss functions for segment lung COVID-19 infection on the left and right. The middle of the figure shows the aggregation of a combination of loss functions containing more than one of the primary loss functions to deal with the difficulty of segmenting the COVID-19 infection. In comparison, the four loss functions in the down middle are the one-time used compensation of loss function to COVID-19 infection segmentation. All loss functions in Fig. 3 are region loss functions that help extract the region of interest pixels. Except for the boundary loss, edge loss which is a combination of dice loss and wavelet loss, and the edge region mutual information loss (Edge-RMI) help extract the complex boundaries of infection shapes and boundaries between the region and others.
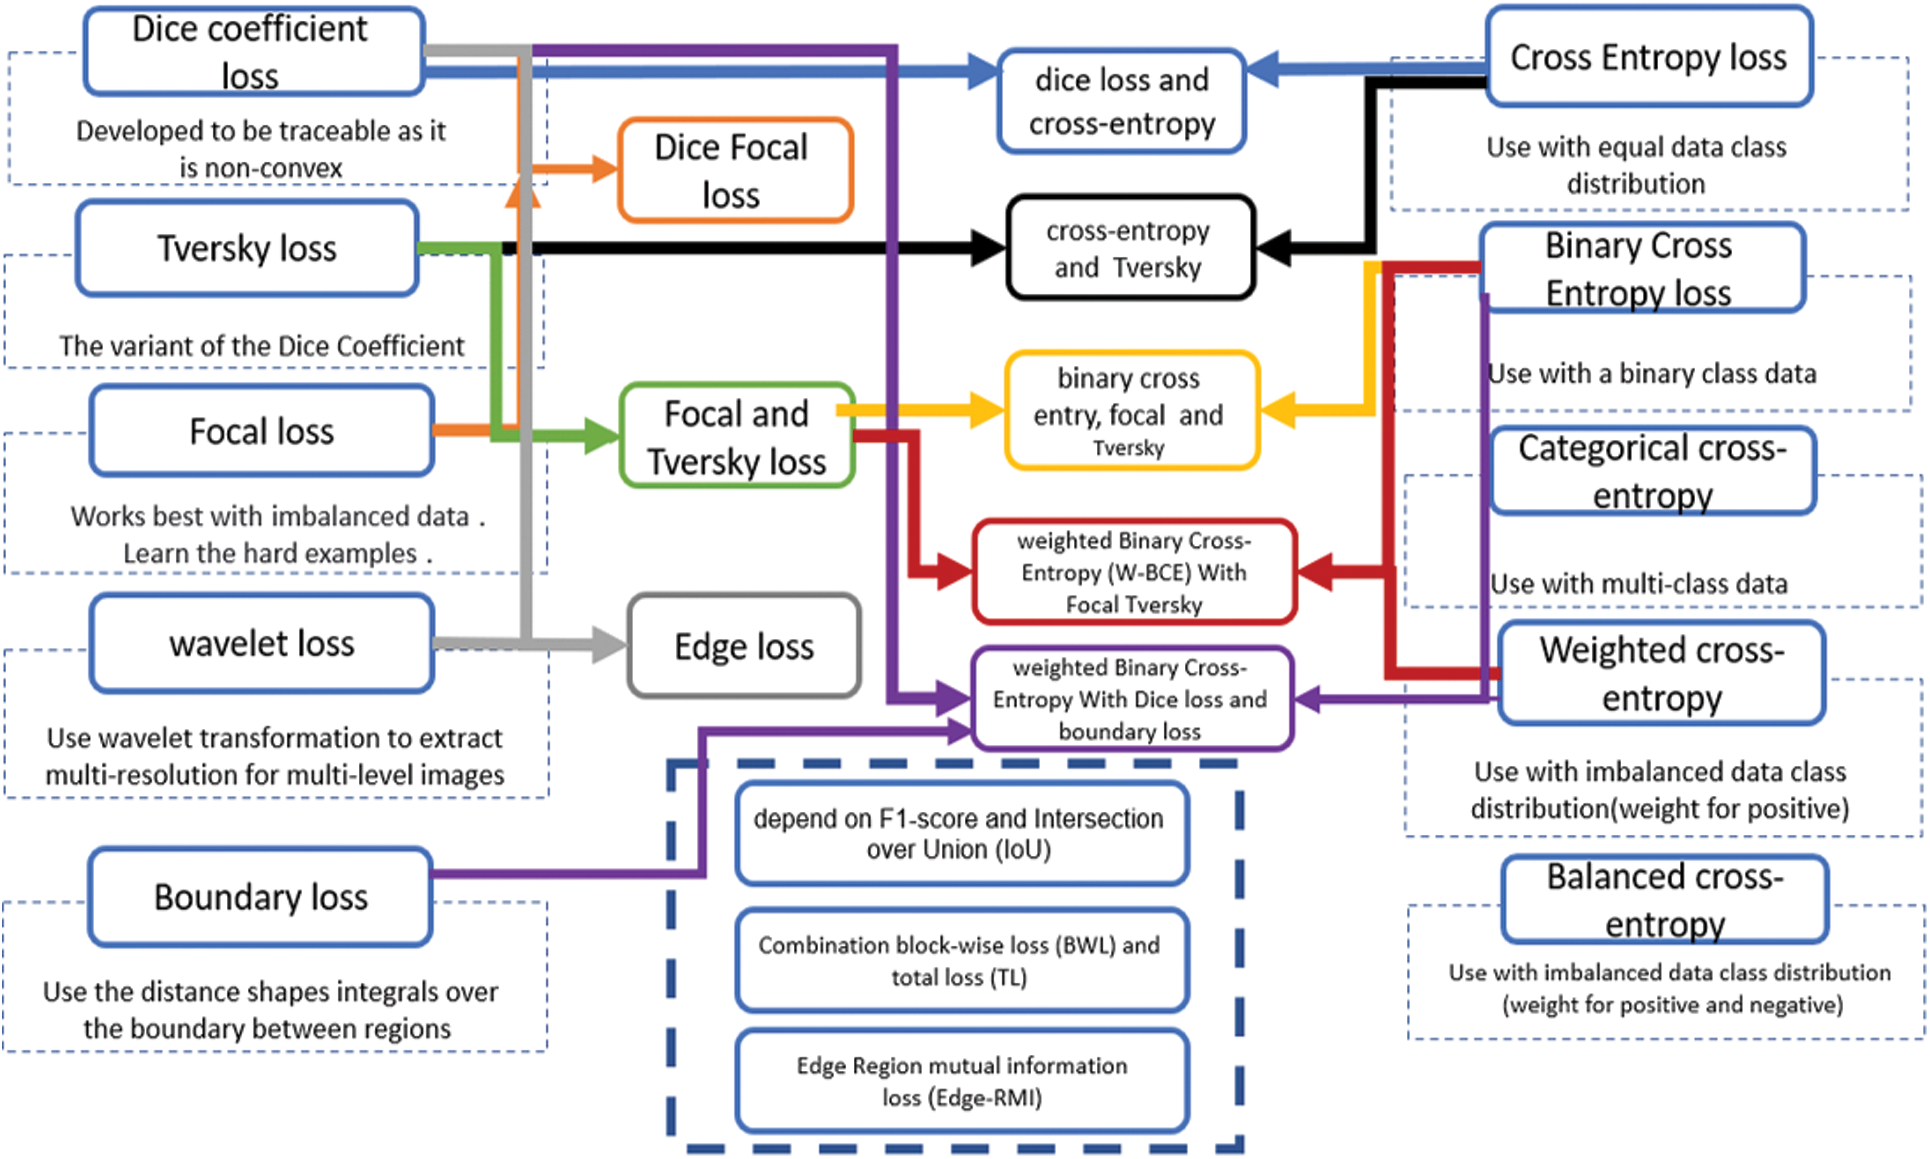
Figure 3: Loss functions used in COVID-19 deep learning segmentation models
The most commonly used measures to estimate semantic segmentation and was used to assess the COVID-19 infection segmentation from CT scans are the Dice coefficient score and the Intersection over Union (IoU) score. The dice coefficient score is two multiplication in the overlap area between ground truth and predicted segmentation divided by the total number of pixels in both images. It can calculate as follows
Where G is the ground truth and P is predicted. TP is genuinely positive, TN is a true negative, FP is a false positive, and FN is a false negative.
IoU is the overlap region between ground truth and predicted and divided by the area of union between them.
Segment lung damage by deep learning models is considered a complex problem due to the different sizes and locations according to the stage of the disease. The primary finding of this research is that 83% of published studies use a 2D segmentation deep learning than 3D due to the limited size dataset and the high-cost compensation need the huge Graphics processing unit (GPU) memory. The 2D models use the interslice of computed tomography as input to segment COVID-19 infection. For this reason, 2D models can segment a limited number of patients more effectively than 3D.
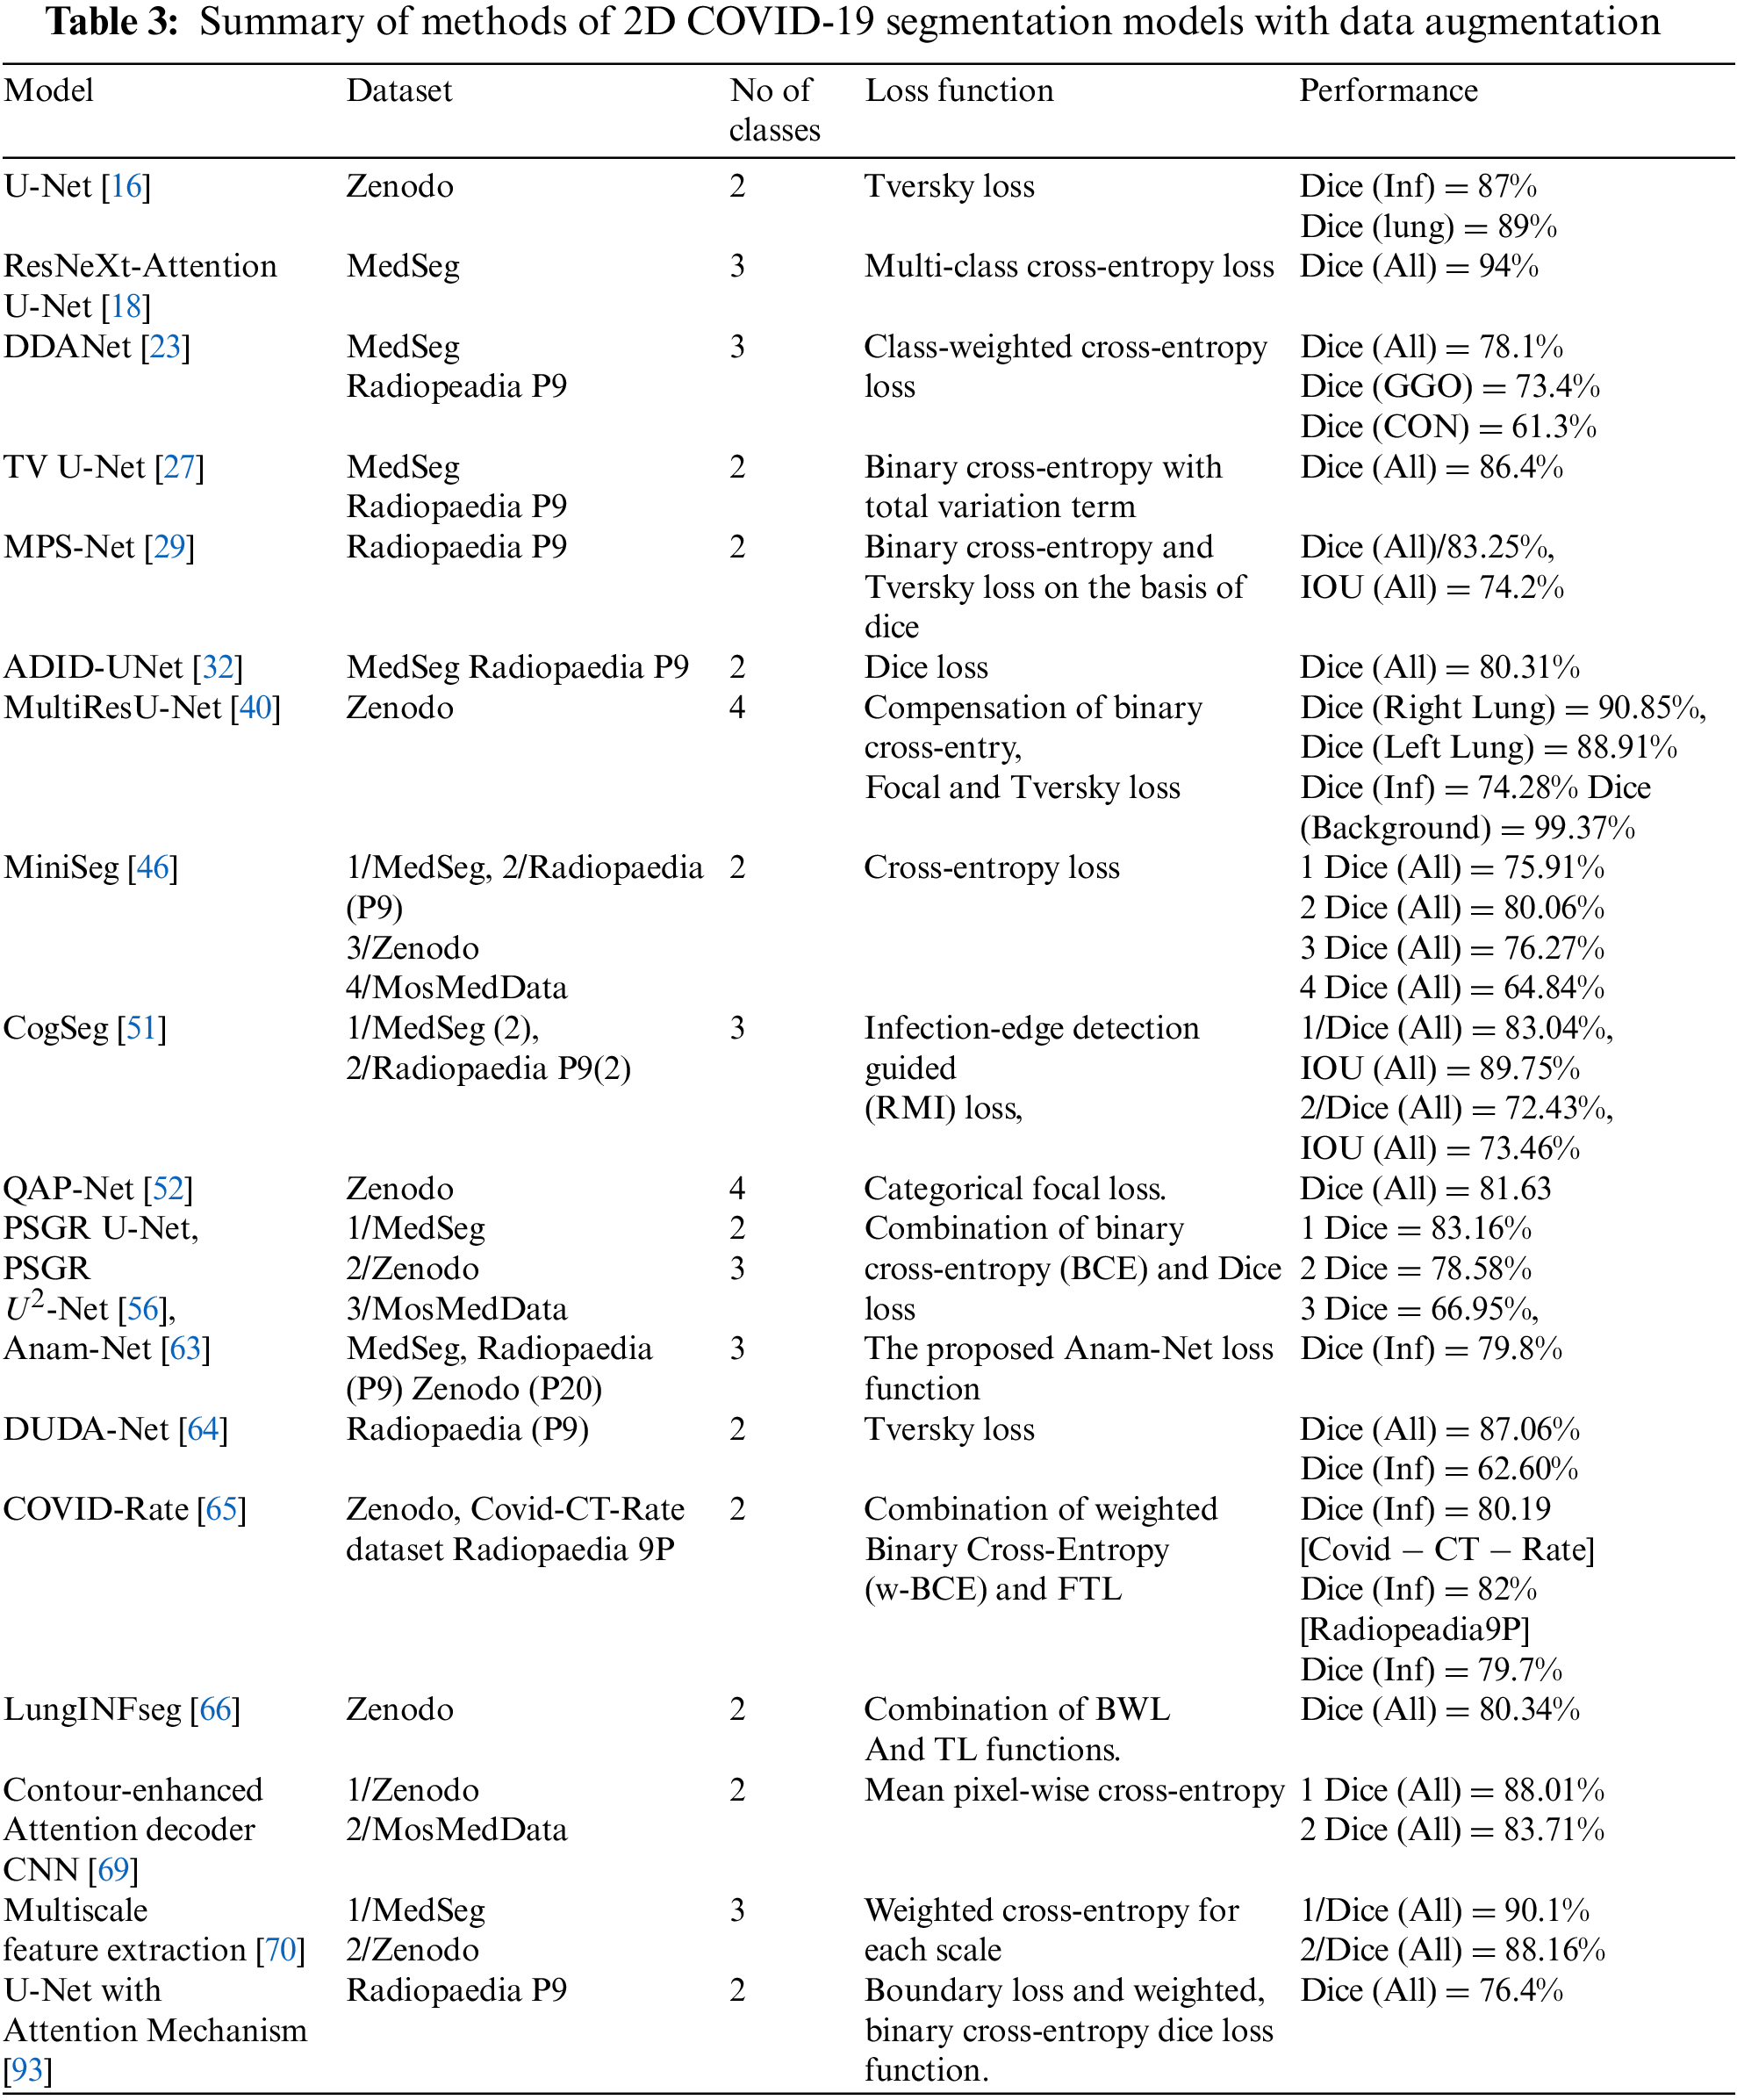
Many factors affect the performance of the segmentation models, such as data augmentation methods, the number of pixels class, feature extraction techniques, and loss functions. Table 3 summarizes the performance of 2D models dealing with the datasets using data augmentation methods. The U-Net [16] model trains on binary class and has the best dice score for infection (87%), and the Multiscale and multi-level feature extraction model [70] has a dice score of 88.34% for multi-class in the Zenodo dataset. The ResNeXt-Attention U-Net [18] train on multi-class has 94% in the validation set, whereas the Cogseg model [51] performed well with the MedSeg dataset with 83% in the test set. The Radioppedia P9 dataset has 87.06% when trained with the DUDA-Net model [64]. Some studies combine the MedSeg and Radioppedia P9 to deal with limited slices of CT scans and have an 86.4% with TV-UNet [27]. The MosMedData dataset works better with the contour-enhanced attention decoder CNN [68], which has 83.7%. Moreover, the state-of-art models are the most used where also multiscale such as MiniSeg [46], ResNet101 backbone [48], DUDA-Net [64] and Multiscale feature extraction [70]. PSGR module [56] is the one graphical representation used inside a decoder of state-of-art models to segment the Covid-19 infection.
The 2D models used without dataset augmentation methods are summarized in Table 4. It shows the MLCA2F [62] has the best work with a 98.80% dice score when a train on binary class. The MedSeg dataset has an 81% infection class when training ensemble learning of the U-Net model [22] on binary classes, whereas when training it on multi-class, it has a 77% in GGO and 57% in CON classes dice score. Ensemble U-Net model-based majority voting [36] has an 85.03% dice score on combining the MedSeg and Radioppedia P9 datasets. The MosMedData dataset has 59.69% when trained with SE-ResNet-50 U-Net++ [92]. Table 4 MASC-Net [61] and MLCA2F [62] are multiscale models, whereas the remaining are state-of-art models.
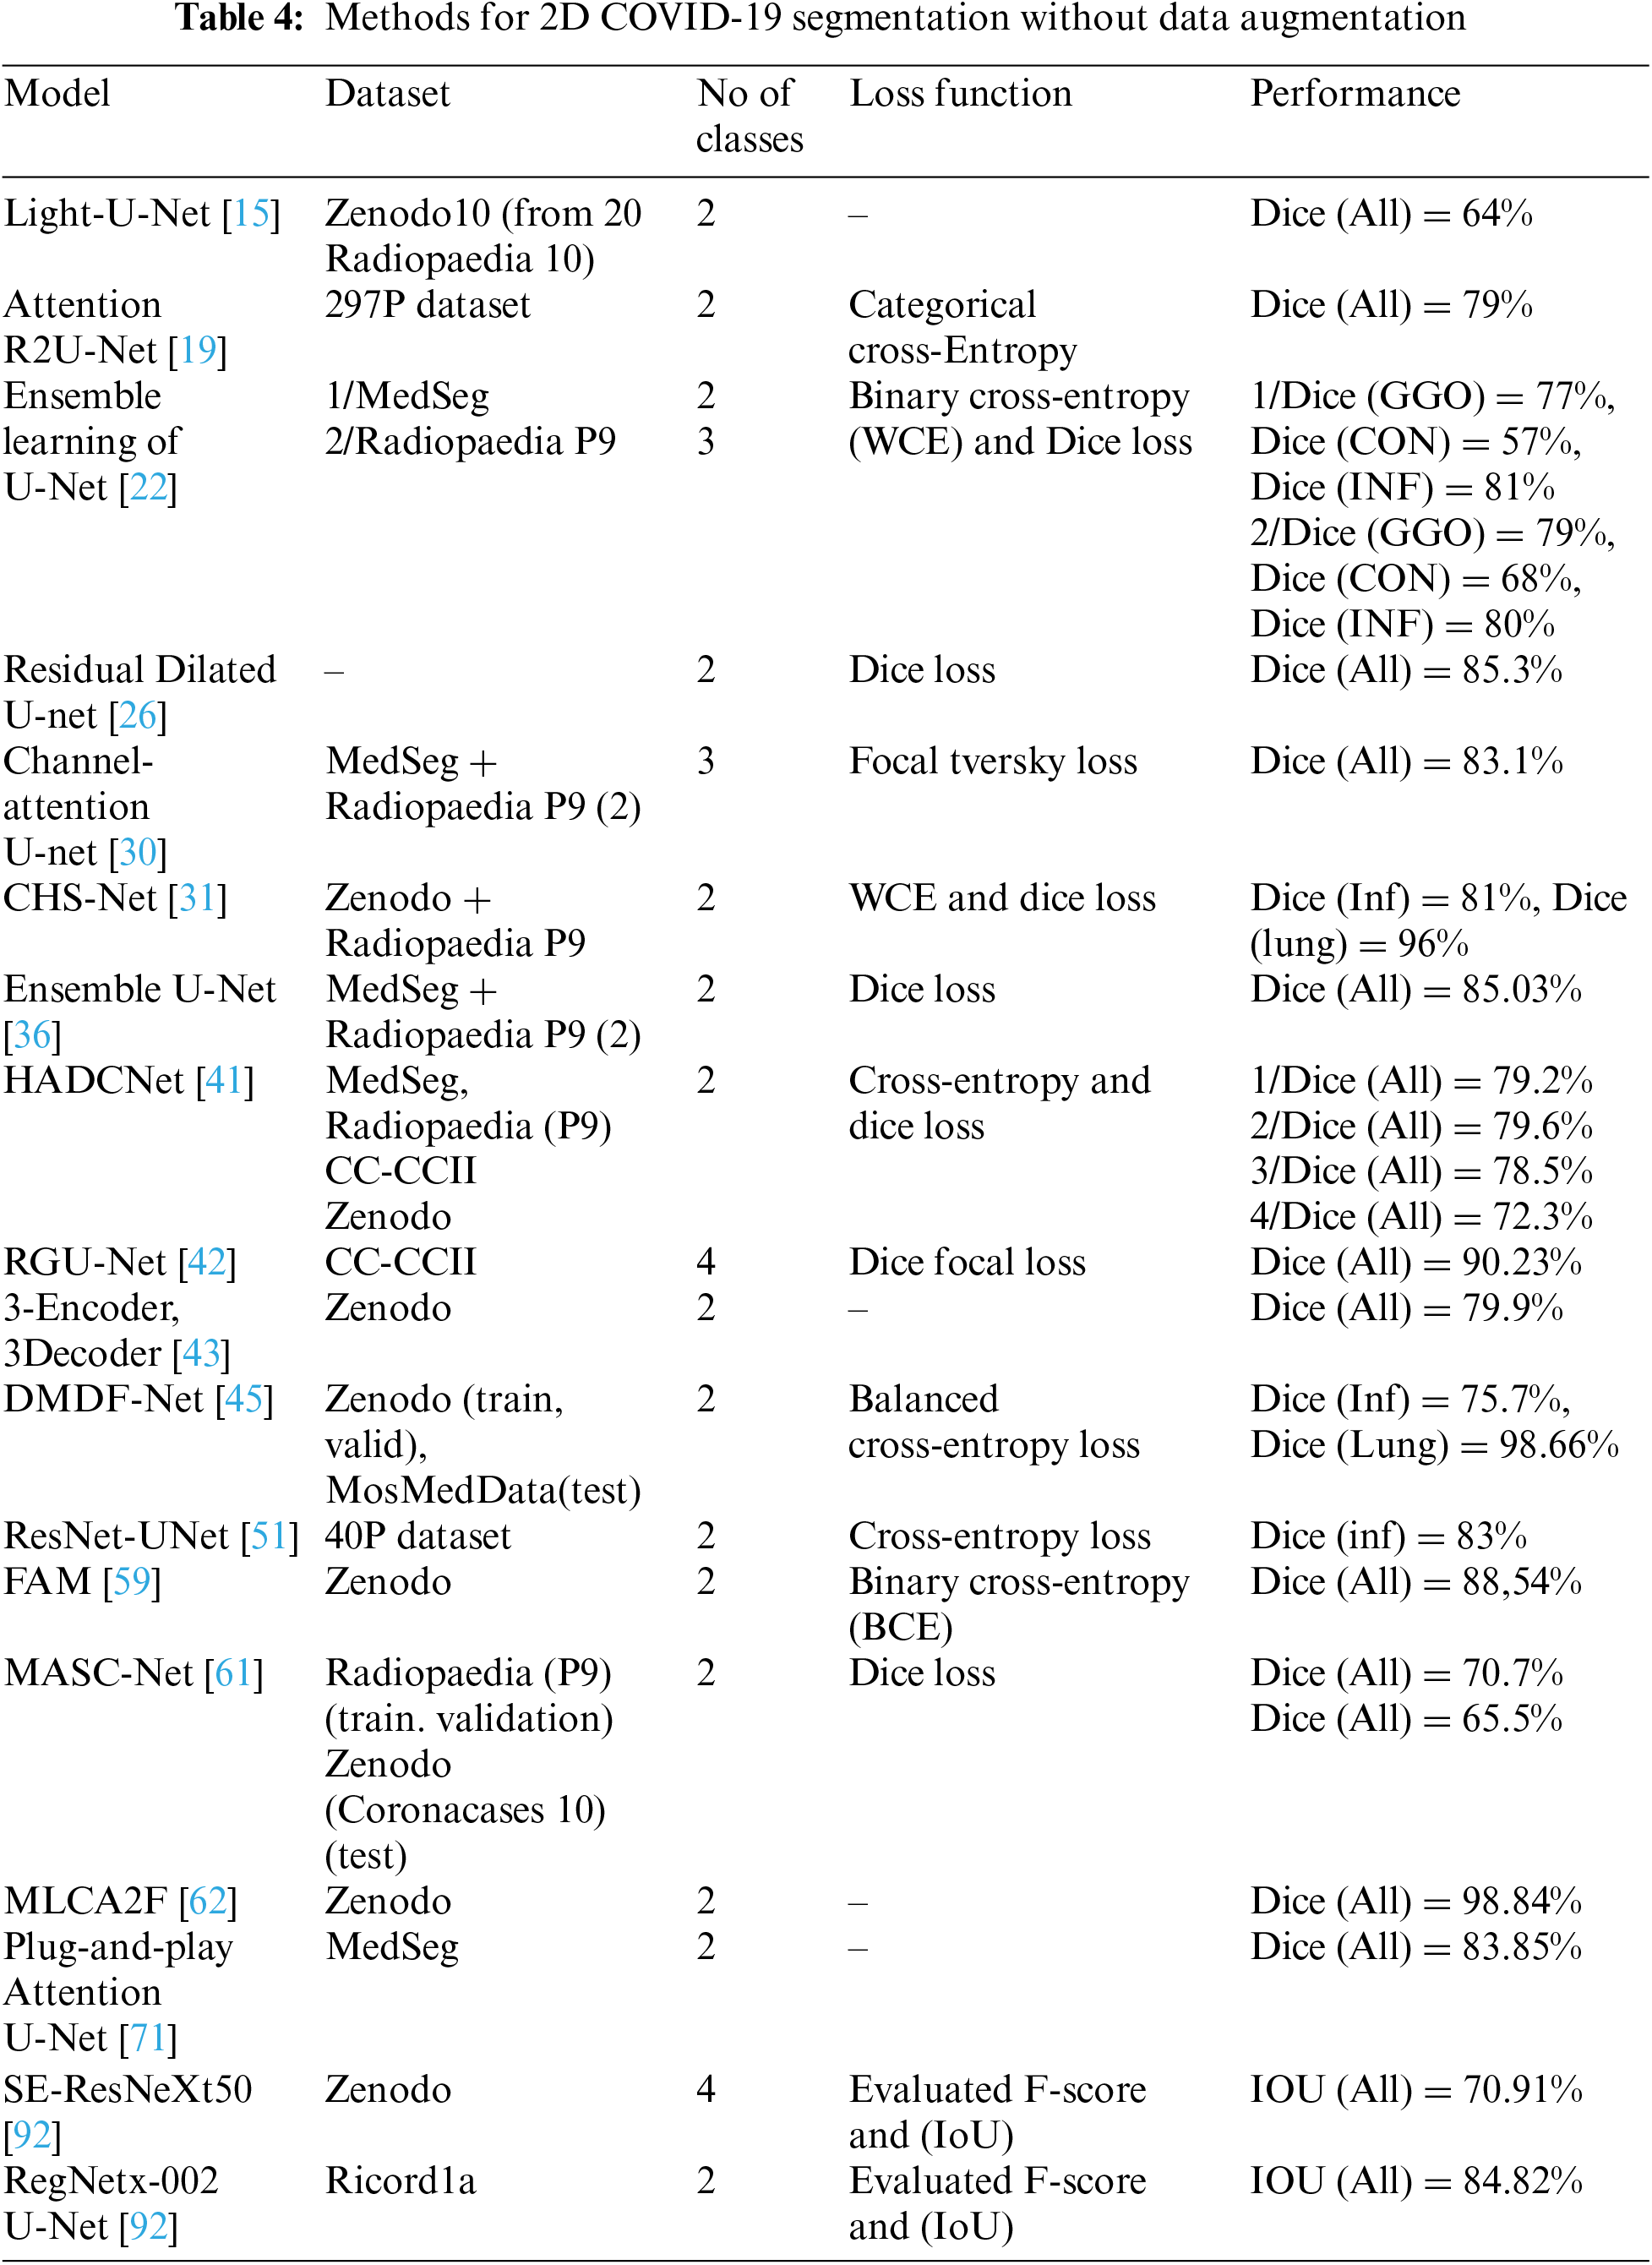
From the tables, we see that training the model on multi-class has lower results than on binary class. The models trained on four classes with promising results are the RGU-Net [42] model with CC-CCII dataset (90.23%), and MultiResU-Net [40] trained on Zenodo has an 88.35% dice score. FDA-Unet [25] trained on the highest number of infection shape classes: GGO, linear opacities, sub-solid lesions, solid lesions, interstitial change, and background with a 64.1% dice score. As mentioned before, many data augmentation methods were used with CT covid-19 datasets. MedSeg, MosMedData, and a combination of MedSeg and Radiopedia 9P have better results when using the augmentation methods (Table 3). In contrast, the Zenodo dataset has better results without using augmentation methods (Table 4). Increasing the datasets using the standard methods is the best so far to deal with the limited datasets problem of the tomographic images of Covid-19, using the rotation of the images for several angles, which gave better results than others. The loss functions use as an optimization function for the medical image segmentation task, as it helps capture the difficult pixel classification and edges between classes and fuzzy infection boundaries. There are many lung diseases, and determining the damage from COVID-19 is complicated, where CT images complement the standard RT-PCR test and other tests.
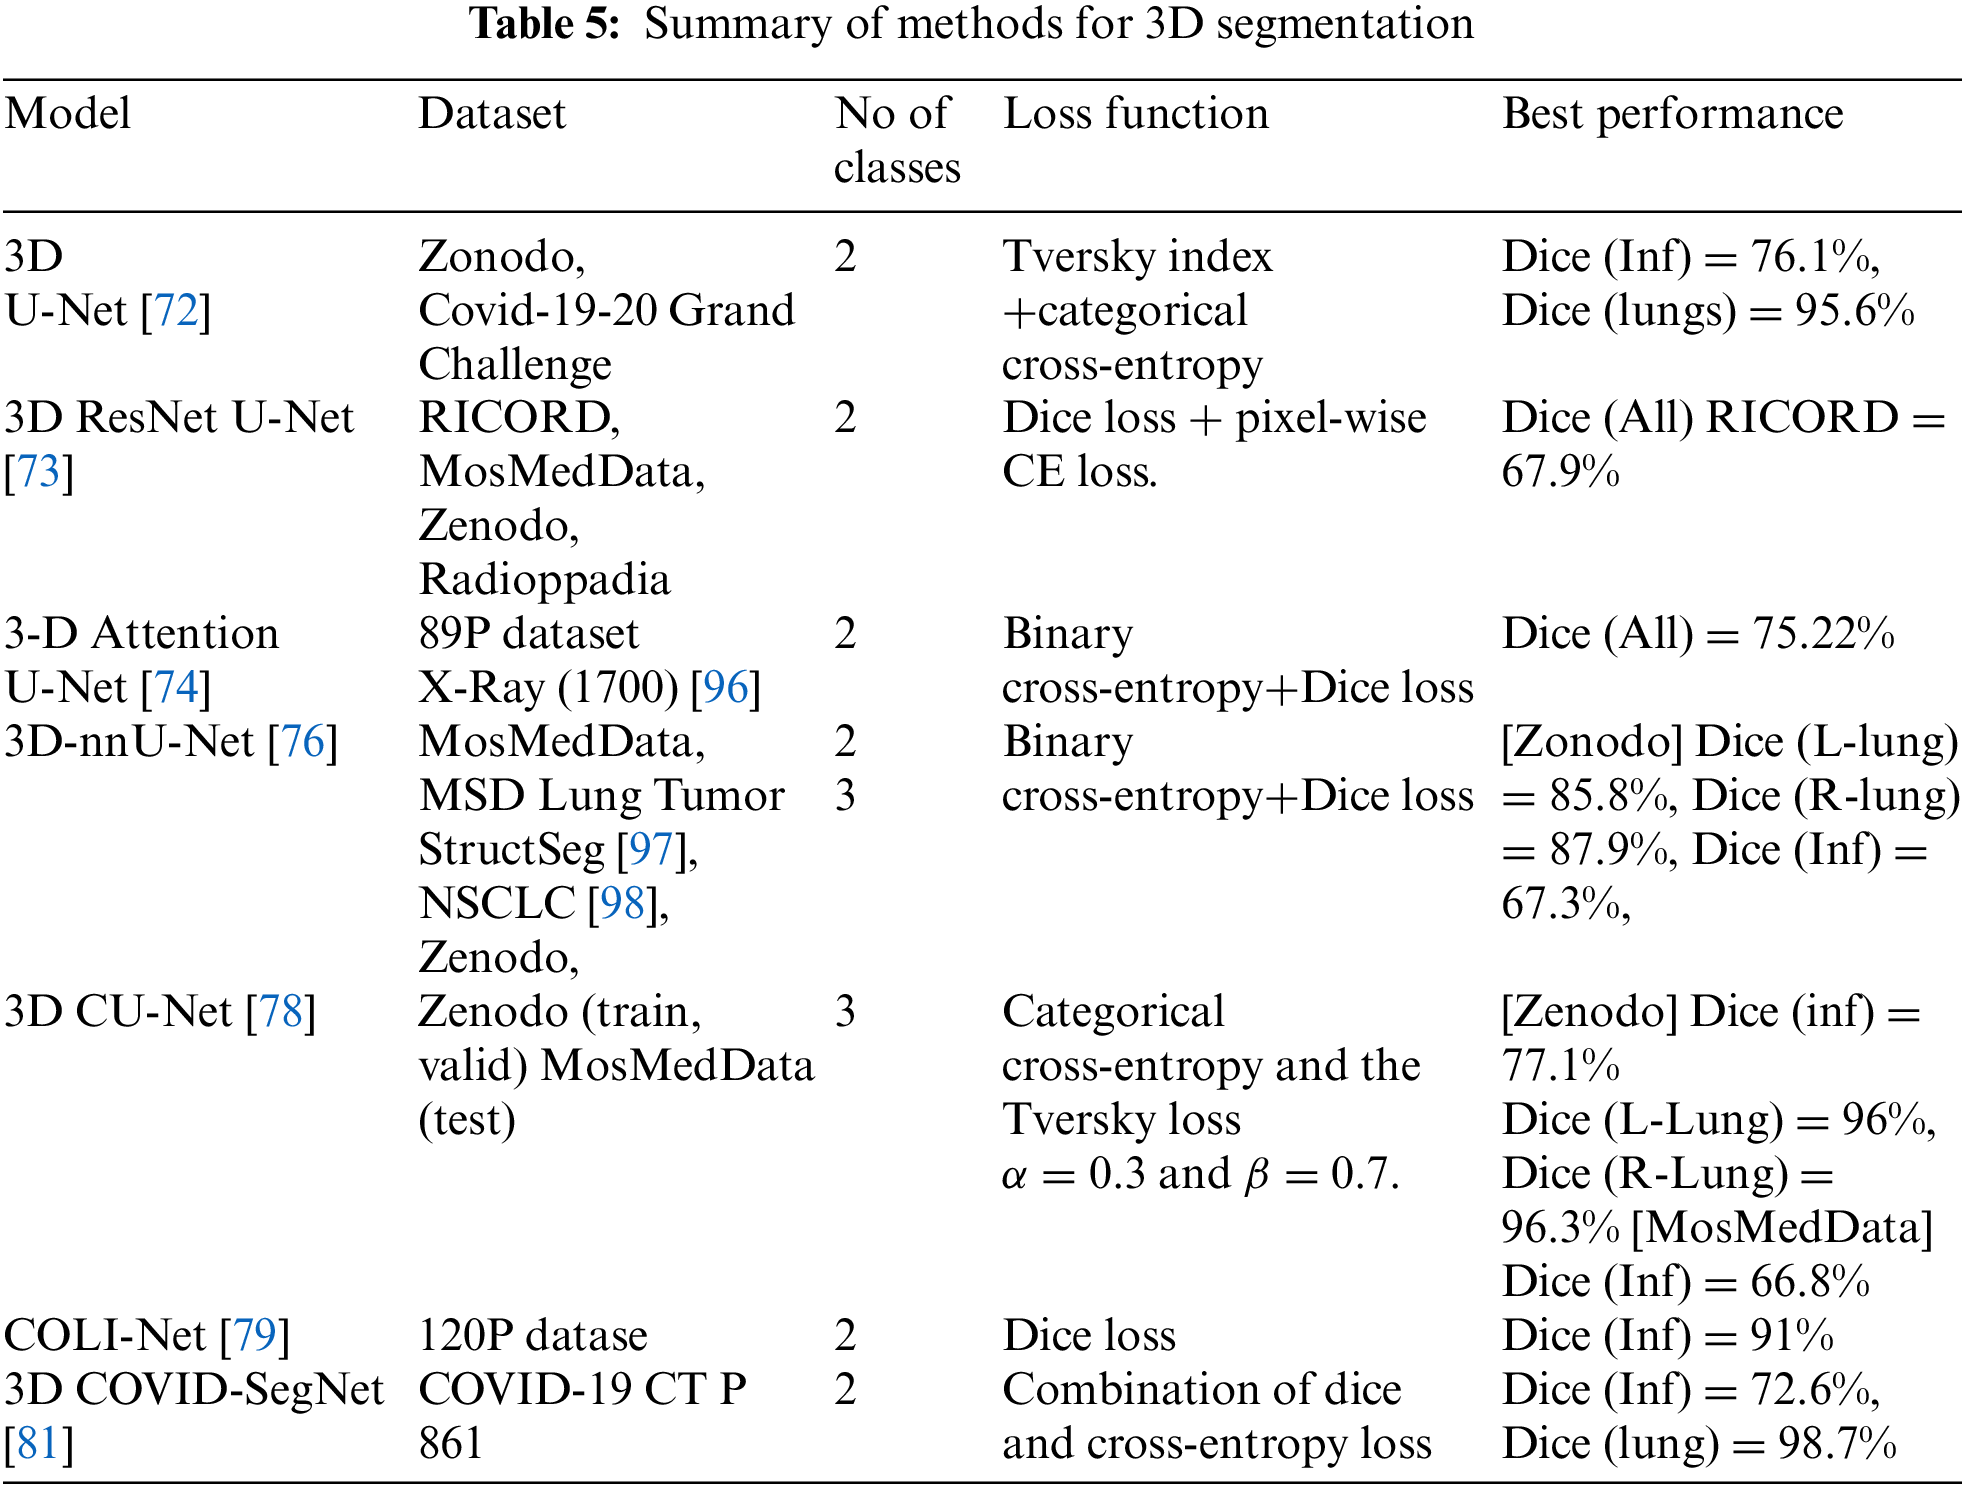
In the 3D models shown in Table 5, some researchers proposed dividing the 3D volume by the number of patches pixel-wise to reduce the high computational cost. The hybrid of CovSegNet2D and CovSegNet3D [82] has a 94.1% dice score on the validation set with the Zenodo dataset, another cost and GPU memory solution. Moreover, the Cascaded 3D UNet [77] has an 82% dice score in the infection class. The MosMedData dataset has 66.8% dice with 3D CU-Net, whereas 58.8% dice with nnU-Net++ in the infection class. Pneumonia has different shapes ground-glass opacity, consolidation, and pleural effusion, where first and second appear inside the lung where pleural effusion may occur out of the lunges edge. Furthermore, the infections have unclear edges, making it more challenging to identify their presence. The most significant impact on the model’s performance is the dataset’s quality, which has several aspects. The image resolution: The organ’s tissues appearing in the CT scan may lead to mixing the categories of pixels. The annotation process for each pixel, as some radiologists may introduce noise.
The biggest challenge for researchers is to develop frameworks that recognize early-stage COVID-19 pneumonia that contain the fewest number of pixels in an image. It is more beneficial to determine the disease’s stage at its beginning stage so that doctors can treat the patient before the disease progresses.
In the literature review, it is evident that many researchers have used U-Net or variants of U-Net to segment the COVID-19 infection. The architecture of U-Net is also widely used in other medical applications [94,95].
Determining the damage COVID-19 causes in the lungs of patients is becoming an important problem for researchers after the COVID-19 pandemic infected and the death of many people worldwide. Many researchers were published to develop a CT scan segmentation framework and the assistance of a radiologist. This systematic research brings several details of a framework designed to improve finding areas of damage, which is challenging due to the varying size, location, and hazy lung inflammation edges.
This paper discusses the effects of datasets, data augmentation methods, and loss functions on training performance. The number of patients, infection stage, and contrasts of CT scan considerably impact the chest CT dataset quality. Data augmentation methods also affect training performance. Data augmentation may change some information in CT scan that influences the generalization where medical pixel classification is a susceptible task. Using different loss functions in training the same deep learning model does not differ much in performance. However, they have the impact of extracting the region of interest and its complex boundaries. Likewise, the loss functions are used as optimization methods to extract regions and edges features and spatial features in the encoder and decoder of the model. We have investigated the performance of different deep learning algorithms architectures on segmentation accuracy. The state-of-art and multiscale models also the graph representation module are used within state-of-art models.
In Future work, we will analyze the impact of different data augmentation methods and loss functions on the performance of the weak, semi-supervised and unsupervised models.
Funding Statement: This research work is supported by Data and Artificial Intelligence Scientific Chair at Umm Al-Qura University, Makkah City, Saudi Arabia.
Conflicts of Interest: The authors declare that they have no conflicts of interest to report regarding the present study.
References
1. World Health Organization, “WHO Director-General’s Remarks at the Media Briefing on 2019-nCoV on 11th February 2020,” 2020. [Online]. Available: https://www.who.int/director-general/speeches/detail/who-director-general-s-remarks-at-the-media-briefing-on-2019-ncov-on-11-february-2020. Accessed: 2021-08-30. [Google Scholar]
2. WHO Director-general’s opening remarks at the media briefing on COVID-19-11th March 2020,” 2020. [Online]. Available: https://www.who.int/director-general/speeches/detail/who-director-general-s-opening-remarks-at-the-media-briefing-on-covid-19—2-march-2020. Accessed: 2021-08-30. [Google Scholar]
3. Y. Zhang, B. Yu, X. Chen, S. Rich, Q. Mo et al., “Dynamics of the coronavirus disease 2019 (COVID-19) epidemic in Wuhan City, Hubei Province and China: A second derivative analysis of the cumulative daily diagnosed cases during the first 85 days,” Glob Health Journal, vol. 5, no. 1, pp. 4–11, 2021. [Google Scholar]
4. World Health Organization, “WHO Coronavirus (COVID-19) dashboard,” 2022. [Online]. Available: https://covid19.who.int/. Accessed: 2022-12-30. [Google Scholar]
5. H. X. Bai, B. Hsieh, Z. Xiong, K. Halsey, J. W. Choi et al., “Performance of radiologists in differentiating COVID-19 from non-COVID-19 viral pneumonia at chest CT,” Radiology, vol. 296, no. 2, pp. 46–54, 2020. [Google Scholar]
6. U. Jain, “Effect of COVID-19 on the organs,” Cureus, vol. 12, no. 8, pp. 9540, 2020. [Google Scholar]
7. T. Ai, Z. Yang, H. Hou, C. Zhan, C. Chen et al., “Correlation of chest CT and RT-PCR testing in coronavirus disease 2019 (COVID-19) in China: A report of 1014 cases,” Radiology, vol. 296, no. 2, pp. 32–40, 2020. [Google Scholar]
8. Y. Fang, H. Zhang, J. Xie, M. Lin, L. Ying et al., “Sensitivity of chest CT for COVID-19: Comparison to RT-PCR,” Radiology, vol. 296, no. 2, pp. 115–117, 2020. [Google Scholar]
9. G. Litjens, T. Kooi, B. E. Bejnordi, A. A. A. Setio, F. Ciompi et al., “Survey on deep learning in medical image analysis,” Medical Image Analysis, vol. 42, no. 13, pp. 60–88, 2017. [Google Scholar] [PubMed]
10. P. Aggarwal, R. Vig, S. Bhadoria and C. G. Dethe, “Role of segmentation in medical imaging: A comparative study,” International Journal of Computer Applications, vol. 29, no. 1, pp. 54–61, 2011. [Google Scholar]
11. J. Long, E. Shelhamer and T. Darrell, “Fully convolutional networks for semantic segmentation,” in Proc. of the IEEE Conf. on Computer Vision and Pattern Recognition, Boston, MA, USA, pp. 3431–3440, 2015. [Google Scholar]
12. O. Ronneberger, P. Fischer and T. Brox, “U-net: Convolutional networks for biomedical image segmentation,” in Medical Image Computing and Computer-Assisted Intervention-MICCAI 2015: 18th Int. Conf., Munich, Germany, pp. 234–241, 2015. [Google Scholar]
13. M. J. Page, D. Moher, P. M. Bossuyt, I. Boutron, T. C. Hoffmann et al., “PRISMA, 2020 explanation and elaboration: Updated guidance and exemplars for reporting systematic reviews,” BMJ, vol. 372, no. 160, 2021. https://doi.org/10.1136/bmj.n160 [Google Scholar] [PubMed] [CrossRef]
14. M. Srikrishna, R. A. Heckemann, J. B. Pereira, G. Volpe, A. Zettergren et al., “Comparison of two-dimensional-and three-dimensional-based U-net architectures for brain tissue classification in one-dimensional brain CT,” Frontiers in Computational Neuroscience, vol. 15, pp. 123, 2022. [Google Scholar]
15. A. Voulodimos, E. Protopapadakis, I. Katsamenis, A. Doulamis and N. Doulamis, “Deep learning models for COVID-19 infected area segmentation in CT images,” in Proc. of the 14th PErvasive Technologies Related to Assistive Environments Conf., Corfu Greece, pp. 404–411, 2021. [Google Scholar]
16. S. Walvekar and S. Shinde, “Efficient medical image segmentation of covid-19 chest ct images based on deep learning techniques,” in 2021 Int. Conf. on Emerging Smart Computing and Informatics (ESCI), Pune, India, pp. 203–206, 2021. [Google Scholar]
17. S. Mishra, “A novel automated method for COVID-19 infection and lung segmentation using deep neural networks,” Research Square, 2020. https://doi.org/10.21203/rs.3.rs-86796/v1 [Google Scholar] [CrossRef]
18. X. Chen, L. Yao and Y. Zhang, “Residual attention U-Net for automated multi-class segmentation of COVID-19 chest CT images,” ArXiv Preprint ArXiv,2004.05645, 2020. [Google Scholar]
19. N. Hasanzadeh, S. S. Paima, A. Bashirgonbadi, M. Naghibi and H. Soltanian-Zadeh, “Segmentation of COVID-19 infections on CT: Comparison of four UNet-based networks,” in Proc. of the 2020 27th National and 5th Int. Iranian Conf. on Biomedical Engineering (ICBME), Tehran, Iran, pp. 222–225, 2020. [Google Scholar]
20. M. Z. Alom, M. Hasan, C. Yakopcic, T. M. Taha and V. K. Asari, “Recurrent residual convolutional neural network based on U-Net (R2U-Net) for medical image segmentation,” ArXiv Preprint ArXiv,1802.06955, 2018. [Google Scholar]
21. O. Oktay, J. Schlemper, L. L. Folgoc, M. Lee, M. Heinrich et al., “Attention u-net: Learning where to look for the pancreas,” ArXiv Preprint ArXiv,1804.03999, 2018. [Google Scholar]
22. T. Ben-Haim, R. M. Sofer, G. Ben-Arie, I. Shelef and T. A. Riklin-Raviv, “Deep ensemble learning approach to lung CT segmentation for COVID-19 severity assessment,” in 2022 IEEE Int. Conf. on Image Processing (ICIP), Bordeaux, France, pp. 151–155, 2022. [Google Scholar]
23. K. T. Rajamani, H. Siebert and M. P. Heinrich, “Dynamic deformable attention network (DDANet) for COVID-19 lesions semantic segmentation,” Journal of Biomedical Informatics, vol. 119, no. 8, pp. 103816, 2021. [Google Scholar] [PubMed]
24. Z. Huang, X. Wang, L. Huang, C. Huang, Y. Wei et al., “Ccnet: Criss-cross attention for semantic segmentation,” in Proc. of the IEEE/CVF Int. Conf. on Computer Vision, Seoul, South Korea, pp. 603–612, 2019. [Google Scholar]
25. T. Hong, W. Huang, Y. Bai and T. Zeng, “FDA-Unet: A feature fusional U-Net with deep supervision and attention mechanism for COVID-19 lung infection segmentation from CT images,” in Proc. of the 2022 14th Int. Conf. on Machine Learning and Computing (ICMLC), Guangzhou China, pp. 455–460, 2022. [Google Scholar]
26. A. Amer, X. Ye and F. Janan, “Residual dilated U-net for the segmentation Of COVID-19 infection from CT images,” in Proc. of the IEEE/CVF Int. Conf. on Computer Vision, Virtual Conference, pp. 462–470, 2021. [Google Scholar]
27. N. Saeedizadeh, S. Minaee, R. Kafieh, S. Yazdani and M. Sonka, “COVID TV-Unet: Segmenting COVID-19 chest CT images using connectivity imposed Unet,” Computer Methods and Programs in Biomedicine Update, vol. 1, pp. 100007, 2021. [Google Scholar] [PubMed]
28. A. Chambolle, “An algorithm for total variation minimization and applications,” Journal of Mathematical Imaging and Vision, vol. 20, no. 1/2, pp. 89–97, 2004. [Google Scholar]
29. H. Y. Pei, D. Yang, G. R. Liu and T. Lu, “MPS-Net: Multi-point supervised network for CT image segmentation of COVID-19,” IEEE Access, vol. 9, pp. 47144–47153, 2021. [Google Scholar] [PubMed]
30. T. Zhou, S. Canu and S. Ruan, “Automatic COVID-19 CT segmentation using U-Net integrated spatial and channel attention mechanism,” International Journal of Imaging Systems and Technology, vol. 31, no. 1, pp. 16–27, 2021. [Google Scholar] [PubMed]
31. N. S. Punn and S. Agarwal, “CHS-Net: A Deep learning approach for hierarchical segmentation of COVID-19 infected CT images,” ArXiv Preprint ArXiv, 2012.07079, 2012. [Google Scholar]
32. A. N. J. Raj, H. Zhu, A. Khan, Z. Zhuang, Z. Yang et al., “ADID-UNET—A segmentation model for COVID-19 infection from lung CT scans,” PeerJ Computer Science, vol. 7, pp. 349, 2021. [Google Scholar]
33. G. Huang, Z. Liu, L. V. D. Maaten and K. Q. Weinberger, “Densely connected convolutional networks,” in Proc. of the IEEE Conf. on Computer Vision and Pattern Recognition, Honolulu, HI, USA, pp. 4700–4708, 2017. [Google Scholar]
34. X. Zhao, P. Zhang, F. Song, G. Fan, Y. Sun et al., “D2a u-net: Automatic segmentation of covid-19 lesions from ct slices with dilated convolution and dual attention mechanism,” ArXiv Preprint ArXiv, 2102.05210, 2021. [Google Scholar]
35. S. Xie, R. Girshick, P. Dollar, Z. Tu and K. He, “Aggregated residual transformations for deep neural networks,” in Proc. of the IEEE Conf. on Computer Vision and Pattern Recognition, Honolulu, HI, USA, pp. 1492–1500, 2017. [Google Scholar]
36. P. Wang, P. Chen, Y. Yuan, D. Liu, Z. Huang et al., “Understanding convolution for semantic segmentation,” in 2018 IEEE Winter Conf. on Applications of Computer Vision (WACV), Lake Tahoe, NV, USA, IEEE, pp. 1451–1460, 2018. [Google Scholar]
37. X. Zhang, G. Wang and S. G. Zhao, “COVSeg-NET: A deep convolution neural network for COVID-19 lung CT image segmentation,” International Journal of Imaging Systems and Technology, vol. 31, no. 3, pp. 1071–1086, 2021. [Google Scholar] [PubMed]
38. K. Amara, A. Aouf, H. Kennouche, A. O. Djekoune, N. Zenati et al., “COVIR: A virtual rendering of a novel NN architecture O-Net for COVID-19 Ct-scan automatic lung lesions segmentation,” Computers & Graphics, vol. 104, no. 8, pp. 11–23, 2022. [Google Scholar]
39. N. Ibtehaz and M. S. Rahman, “MultiResUNet: Rethinking the U-Net architecture for multimodal biomedical image segmentation,” Neural Networks, vol. 121, no. 11, pp. 74–87, 2020. [Google Scholar] [PubMed]
40. Q. Yang, Y. Li, M. Zhang, T. Wang, F. Yan et al., “Automatic segmentation of COVID-19 CT Images using improved MultiResUNet,” in Proc. of the 2020 Chinese Automation Congress (CAC), Shanghai, China, pp. 1614–1618, 2020. [Google Scholar]
41. Y. Chen, T. Zhou, Y. Chen, L. Feng, C. Zheng et al., “HADCNet: Automatic segmentation of COVID-19 infection based on a hybrid attention dense connected network with dilated convolution,” Computers in Biology and Medicine, vol. 149, no. 18, pp. 105981, 2022. [Google Scholar] [PubMed]
42. F. Faruk, “RGU-Net: Residual guided U-Net architecture for automated segmentation of COVID-19 anomalies using CT images,” in Proc. of the 2021 Int. Conf. on Automation, Control and Mechatronics for Industry 4.0 (ACMI), Rajshahi, Bangladesh, IEEE, pp. 1–6, 2021. [Google Scholar]
43. N. E. M. Khalife, G. Manogaran, M. H. N. Taha and M. Loey, “A deep learning semantic segmentation architecture for COVID-19 lesions discovery in limited chest CT datasets,” Expert Systems, vol. 39, no. 6, pp. 12742, 2022. [Google Scholar]
44. N. Enshaei, P. Afshar, S. Heidarian, A. Mohammadi, M. J. Rafiee et al., “An ensemble learning framework for multi-class Covid-19 lesion segmentation from chest Ct images,” in Proc. of the 2021 IEEE Int. Conf. on Autonomous Systems (ICAS), Virtual Conference, pp. 1–6, 2021. [Google Scholar]
45. M. Owais, N. R. Baek and K. R. Park, “DMDF-Net: Dual multiscale dilated fusion network for accurate segmentation of lesions related to COVID-19 in lung radiographic scans,” Expert Systems with Applications, vol. 202, pp. 117360, 2022. [Google Scholar] [PubMed]
46. Y. Qiu, Y. Liu, S. Li and J. Xu, “Miniseg: An extremely minimum network for efficient covid-19 segmentation,” in Proc. of the AAAI Conf. on Artificial Intelligence, Virtual Conference, pp. 4846–4854, 2021. [Google Scholar]
47. K. He, X. Zhang, S. Ren and J. Sun, “Deep residual learning for image recognition,” in Proc. of the IEEE Conf. on Computer Vision and Pattern Recognition, Las Vegas, Nevada, USA, pp. 770–778, 2016. [Google Scholar]
48. F. Yu, Y. Zhu, X. Qin, Y. Xin, D. Yang et al., “A multi-class COVID-19 segmentation network with pyramid attention and edge loss in CT images,” IET Image Processing, vol. 15, no. 11, pp. 2604–2613, 2021. [Google Scholar] [PubMed]
49. L. C. Chen, G. Papandreou, F. Schroff and H. Adam, “Rethinking atrous convolution for semantic image segmentation,” ArXiv Preprint ArXiv,1706.05587, 2017. [Google Scholar]
50. S. Woo, J. Park, J. Y. Lee and I. S. Kweon, “Cbam: Convolutional block attention module,” in Proc. of the European Conf. on Computer Vision (ECCV), Munich, Germany, pp. 3–19, 2018. [Google Scholar]
51. Y. Sang, J. Sun, S. Wang, H. Qi and K. Li, “Super-resolution and infection edge detection co-guided learning for Covid-19 Ct segmentation,” in Proc. of the ICASSP 2021-2021 IEEE Int. Conf. on Acoustics, Speech and Signal Processing (ICASSP), Toronto, ON, Canada, pp. 1665–1669, 2021. [Google Scholar]
52. Z. Wang and I. Voiculescu, “Quadruple augmented pyramid network for multi-class COVID-19 segmentation via CT,” in Proc. of the 2021 43rd Annual Int. Conf. of the IEEE Engineering in Medicine & Biology Society (EMBC), Virtual Conference, pp. 2956–2959, 2021. [Google Scholar]
53. V. Badrinarayanan, A. Kendall and R. Cipolla, “Segnet: A deep convolutional encoder-decoder architecture for image segmentation,” IEEE Transactions on Pattern Analysis and Machine Intelligence, vol. 39, no. 12, pp. 2481–2495, 2017. [Google Scholar] [PubMed]
54. U. Budak, M. Çıbuk, Z. Cömert and A. Sengür, “Efficient COVID-19 segmentation from CT slices exploiting semantic segmentation with integrated attention mechanism,” Journal of Digital Imaging, vol. 34, no. 2, pp. 263–272, 2021. [Google Scholar] [PubMed]
55. J. S. Suri, S. Agarwal, G. L. Chabert, A. Carriero, A. Paschè et al., “COVLIAS 1.0 Lesion vs. MedSeg: An artificial intelligence framework for automated lesion segmentation in COVID-19 lung computed tomography scans,” Diagnostics, vol. 12, no. 5, pp. 1283, 2022. [Google Scholar] [PubMed]
56. H. Jia, H. Tang, G. Ma, W. Cai, H. Huang et al., “PSGR: Pixel-wise sparse graph reasoning for COVID-19 pneumonia segmentation in CT images,” ArXiv Preprint ArXiv,2108.03809, 2021. [Google Scholar]
57. C. Morris, M. Ritzert, M. Fey, W. L. Hamilton, J. E. Lenssen et al., “Weisfeiler and leman go neural: Higher-order graph neural networks,” in Proc. of the AAAI Conf. on Artificial Intelligence, Honolulu, Hawaii, USA, pp. 4602–4609, 2019. [Google Scholar]
58. X. Qin, Z. Zhang, C. Huang, M. Dehghan, O. R. Zaiane et al., “U2-Net: Going deeper with nested U-structure for salient object detection,” Pattern Recognition, vol. 106, no. 11, pp. 107404, 2020. [Google Scholar]
59. X. Wu, Z. Zhang, L. Guo, H. Chen, Q. Luo et al., “FAM: Focal attention module for lesion segmentation of COVID-19 CT images,” Journal of Real-Time Image Processing, vol. 19, no. 6, pp. 1091–1104, 2022. [Google Scholar] [PubMed]
60. S. Woo, J. Park, J. Y. Lee and I. S. Kweon, “Cbam: Convolutional block attention module,” in Proc. of the European Conf. on Computer Vision (ECCV), Munich, Germany, pp. 3–19, 2018. [Google Scholar]
61. V. Vasilescu, A. Neacşu, E. Chouzenoux, J. C. Pesquet and C. Burileanu, “A deep learning approach for improved segmentation of lesions related to covid-19 chest ct scans,” in 2021 IEEE 18th Int. Symp. on Biomedical Imaging (ISBI), Nice, France, pp. 635–639, 2021. [Google Scholar]
62. I. Bakkouri and K. Afdel, “MLCA2F: Multi-level context attentional feature fusion for COVID-19 lesion segmentation from CT scans,” Signal, Image and Video Processing, pp. 1–8, 2022. https://doi.org/10.1007/s11760-022-02325-w [Google Scholar] [PubMed] [CrossRef]
63. N. Paluru, A. Dayal, H. B. Jenssen, T. Sakinis, L. R. Cenkeramaddi et al., “Anam-Net: Anamorphic depth embedding-based lightweight CNN for segmentation of anomalies in COVID-19 chest CT images,” IEEE Transactions on Neural Networks and Learning Systems, vol. 32, no. 3, pp. 932–946, 2021. [Google Scholar] [PubMed]
64. F. Xie, Z. Huang, Z. Shi, T. Wang, G. Song et al., “DUDA-Net: A double U-shaped dilated attention network for automatic infection area segmentation in COVID-19 lung CT images,” International Journal of Computer Assisted Radiology and Surgery, vol. 16, no. 9, pp. 1425–1434, 2021. [Google Scholar] [PubMed]
65. N. Enshaei, A. Oikonomou, M. J. Rafiee, P. Afshar, S. Heidarian et al., “COVID-Rate: An automated framework for segmentation of COVID-19 lesions from chest CT scans,” ArXiv Preprint ArXiv,2107.01527, 2021. [Google Scholar]
66. V. K. Singh, M. Abdel-Nasser, N. Pandey and D. Puig, “Lunginfseg: Segmenting covid-19 infected regions in lung ct images based on a receptive-field-aware deep learning framework,” Diagnostics, vol. 11, no. 2, pp. 158, 2021. [Google Scholar]
67. J. Liu, B. Dong, S. Wang, H. Cui, D. P. Fan et al., “COVID-19 lung infection segmentation with a novel two-stage cross-domain transfer learning framework,” Medical Image Analysis, vol. 74, no. 2, pp. 102205, 2021. [Google Scholar] [PubMed]
68. Q. Wang, B. Wu, P. Zhu, P. Li, W. Zuo et al., “ECA-Net: Efficient channel attention for deep convolutional neural networks,” in 2020 IEEE. Proc. of the CVF Conf. on Computer Vision and Pattern Recognition (CVPR), Seattle, WA, USA, pp. 11534–11542, 2020. [Google Scholar]
69. R. Karthik, R. Menaka, M. Hariharan and D. Won, “Contour-enhanced attention CNN for CT-based COVID-19 segmentation,” Pattern Recognition, vol. 125, no. 2, pp. 108538, 2022. [Google Scholar] [PubMed]
70. A. Qayyum, A. Lalande and F. Meriaudeau, “Effective multiscale deep learning model for COVID19 segmentation tasks: A further step towards helping radiologist,” Neurocomputing, vol. 499, pp. 63–80, 2022. [Google Scholar] [PubMed]
71. Z. Zhang, H. Xue and G. Zhou, “A plug-and-play attention module for CT-based COVID-19 segmentation,” in Proc. of the Journal of Physics: Conf. Series, Guizhou, China via virtual format, pp. 012041, 2021. [Google Scholar]
72. D. Müller, I. Soto-Rey and F. Kramer, “Robust chest CT image segmentation of COVID-19 lung infection based on limited data,” Informatics in Medicine Unlocked, vol. 25, pp. 100681, 2021. [Google Scholar]
73. K. K. Bressem, S. M. Niehues, B. Hamm, M. R. Makowski, J. L. Vahldiek et al., “3D U-Net for segmentation of COVID-19 associated pulmonary infiltrates using transfer learning: State-of-the-art results on affordable hardware,” ArXiv Preprint ArXiv,2101.09976, 2021. [Google Scholar]
74. D. Tran, H. Wang, L. Torresani, J. Ray and Y. LeCun, “A closer look at spatiotemporal convolutions for action recognition,” in Proc. of the IEEE Conf. on Computer Vision and Pattern Recognition, Salt Lake City, UT, USA, pp. 6450–6459, 2018. [Google Scholar]
75. C. Chen, K. Zhou, M. Zha, X. Qu, X. Guo et al., “An effective deep neural network for lung lesions segmentation from COVID-19 CT images,” IEEE Transactions on Industrial Informatics, vol. 17, no. 9, pp. 6528–6538, 2021. [Google Scholar]
76. J. Ma, Y. Wang, X. An, C. Ge, Z. Yu et al., “Toward data-efficient learning: A benchmark for COVID-19 CT lung and infection segmentation,” Medical Physics, vol. 48, no. 3, pp. 1197–1210, 2021. [Google Scholar] [PubMed]
77. A. Aswathy and V. C. SS, “Cascaded 3D UNet architecture for segmenting the COVID-19 infection from lung CT volume,” Scientific Reports, vol. 12, pp. 3090, 2022. [Google Scholar]
78. R. Zheng, Y. Zheng and C. Dong-Ye, “Improved 3D U-Net for COVID-19 chest CT image segmentation,” Scientific Programming, vol. 2021, no. 5, pp. 1–9, 2021. [Google Scholar]
79. I. Shiri, H. Arabi, Y. Salimi, A. Sanaat, A. Akhavanallaf et al., “COLI-Net: Deep learning-assisted fully automated COVID-19 lung and infection pneumonia lesion detection and segmentation from chest computed tomography images,” International Journal of Imaging Systems and Technology, vol. 32, no. 1, pp. 12–25, 2022. [Google Scholar] [PubMed]
80. W. Li, G. Wang, L. Fidon, S. Ourselin, M. J. Cardoso et al., “On the compactness, efficiency, and representation of 3D convolutional networks: Brain parcellation as a pretext task,” in Proc. of the Int. Conf. on Information Processing in Medical Imaging, Boone, NC, USA, pp. 348–360, 2017. [Google Scholar]
81. Q. Yan, B. Wang, D. Gong, C. Luo, W. Zhao et al., “COVID-19 chest CT image segmentation-A deep convolutional neural network solution,” ArXiv Preprint ArXiv,2004.10987, 2020. [Google Scholar]
82. T. Mahmud, M. A. Rahman, S. A. Fattah and S. Y. Kung, “CovSegNet: A multi encoder-decoder architecture for improved lesion segmentation of COVID-19 chest CT scans,” IEEE Transactions on Artificial Intelligence, vol. 2, no. 3, pp. 283–297, 2021. [Google Scholar]
83. S. P. Morozov, A. E. Andreychenko, N. A. Pavlov, A. V. Vladzymyrskyy, N. V. Ledikhova et al., “Mosmeddata: Chest ct scans with covid-19 related findings dataset,” ArXiv Preprint ArXiv,2005.06465, 2020. [Google Scholar]
84. M. Jun, G. Cheng, W. Yixin, A. Xingle, G. Jiantao et al., “COVID-19 CT lung and infection segmentation dataset,” 2020. [Online]. Available: https://doi.org/10.5281/zenodo.3757476 [Google Scholar] [CrossRef]
85. COVID-19 CT segmentation dataset 2020. http://medicalsegmentation.com/covid19/. Accessed: 2021-08-22, 2020. [Google Scholar]
86. K. Zhang, X. Liu, J. Shen, Z. Li, Y. Sang et al., “Clinically applicable AI system for accurate diagnosis, quantitative measurements, and prognosis of COVID-19 pneumonia using computed tomography,” Cell, vol. 181, no. 6, pp. 1423–1433, 2020. [Google Scholar] [PubMed]
87. Medical Imaging Data Resource Center (MIDRC)-RSNA International COVID-19 Open Radiology Database (RICORD) Release1a-Chest CT Covid+ (MIDRC-RICORD-1a). [Online]. Available: https://wiki.cancerimagingarchive.net/pages/viewpage.action?pageId=80969742. Accessed: 2022-08-22, 2020. [Google Scholar]
88. COVID-19 lung CT lesion segmentation challenge-2020-grand challenge. [Online]. Available: https://covid-segmentation.grand-challenge.org/. Accessed: 2022-08-22, 2020. [Google Scholar]
89. D. Müller and F. Kramer, “MIScnn: A framework for medical image segmentation with convolutional neural networks and deep learning,” BMC Medical Imaging, vol. 21, no. 1, pp. 1–11, 2021. [Google Scholar]
90. J. Zhang, L. Yu, D. Chen, W. Pan, C. Shi et al., “Dense GAN and multi-layer attention based lesion segmentation method for COVID-19 CT images,” Biomedical Signal Processing and Control, vol. 69, pp. 102901, 2021. [Google Scholar] [PubMed]
91. S. Jadon, “A survey of loss functions for semantic segmentation,” in Proc. of the 2020 IEEE Conf. on Computational Intelligence in Bioinformatics and Computational Biology (CIBCB), Vina del Mar, Chile, pp. 1–7, 2020. [Google Scholar]
92. B. A. Krinski, D. V. Ruiz and E. Todt, “Spark in the dark: Evaluating encoder-decoder pairs for COVID-19 CT’s semantic segmentation,” in Proc. of the 2021 Latin American Robotics Symp. (LARS2021 Brazilian Symp. on Robotics (SBRand 2021 Workshop on Robotics in Education (WRE), Natal, Brazil, IEEE, pp. 198–203, 2021. [Google Scholar]
93. I. Ahmed, A. Chehri and G. Jeon, “A sustainable deep learning-based framework for automated segmentation of COVID-19 infected regions: Using U-Net with an attention mechanism and boundary loss function,” Electronics, vol. 11, no. 15, pp. 2296, 2022. [Google Scholar]
94. A. Bilal, L. Zhu, A. Deng, H. Lu and N. Wu, “AI-based automatic detection and classification of diabetic retinopathy using U-Net and deep learning,” Symmetry, vol. 14, no. 7, pp. 1427, 2022. [Google Scholar]
95. N. Siddique, S. Paheding, C. P. Elkin and V. Devabhaktuni, “U-net and its variants for medical image segmentation: A review of theory and applications,” IEEE Access, vol. 9, pp. 82031–82057, 2021. [Google Scholar]
96. D. P. Fan, T. Zhou, G. P. Ji, Y. Zhou, G. Chen et al., “Inf-net: Automatic covid-19 lung infection segmentation from ct images,” IEEE Transactions on Medical Imaging, vol. 39, no. 8, pp. 2626–2637, 2020. [Google Scholar] [PubMed]
97. Grand challenge,” https://structseg2019.grand-challenge.org/. Accessed: 2022-08-22. [Google Scholar]
98. K. J. Kiser, S. Ahmed, S. Stieb, A. S. Mohamed, H. Elhalawani et al., “PleThora: Pleural effusion and thoracic cavity segmentations in diseased lungs for benchmarking chest CT processing pipelines,” Medical Physics, vol. 47, no. 11, pp. 5941–5952, 2020. [Google Scholar] [PubMed]
Cite This Article
 Copyright © 2023 The Author(s). Published by Tech Science Press.
This work is licensed under a Creative Commons Attribution 4.0 International License , which permits unrestricted use, distribution, and reproduction in any medium, provided the original work is properly cited.
 Downloads
 Citation Tools