
 Submit a Paper
 Propose a Special lssue
 Open Access
ARTICLE

Modeling of Combined Economic and Emission Dispatch Using Improved Sand Cat Optimization Algorithm
1 Department of Computer Sciences, College of Computer and Information Sciences, Princess Nourah bint Abdulrahman University, P.O.Box 84428, Riyadh, 11671, Saudi Arabia
2 Department of Industrial Engineering, College of Engineering at Alqunfudah, Umm Al-Qura University, Mecca, 24382, Saudi Arabia
3 Research Centre, Future University in Egypt, New Cairo, 11845, Egypt
4 Department of Computer and Self Development, Preparatory Year Deanship, Prince Sattam bin Abdulaziz University, AlKharj, Saudi Arabia
* Corresponding Author: Gouse Pasha Mohammed. Email:
Computers, Materials & Continua 2023, 75(3), 6145-6160. https://doi.org/10.32604/cmc.2023.038300
Received 06 December 2022; Accepted 03 March 2023; Issue published 29 April 2023
 View Full Text
 Download PDF
Abstract
Combined Economic and Emission Dispatch (CEED) task forms multi-objective optimization problems to be resolved to minimize emission and fuel costs. The disadvantage of the conventional method is its incapability to avoid falling in local optimal, particularly when handling nonlinear and complex systems. Metaheuristics have recently received considerable attention due to their enhanced capacity to prevent local optimal solutions in addressing all the optimization problems as a black box. Therefore, this paper focuses on the design of an improved sand cat optimization algorithm based CEED (ISCOA-CEED) technique. The ISCOA-CEED technique majorly concentrates on reducing fuel costs and the emission of generation units. Moreover, the presented ISCOA-CEED technique transforms the equality constraints of the CEED issue into inequality constraints. Besides, the improved sand cat optimization algorithm (ISCOA) is derived from the integration of traditional SCOA with the Levy Flight (LF) concept. At last, the ISCOA-CEED technique is applied to solve a series of 6 and 11 generators in the CEED issue. The experimental validation of the ISCOA-CEED technique ensured the enhanced performance of the presented ISCOA-CEED technique over other recent approaches.Keywords
Smart grids can be defined as a set of technologies, approaches, and concepts, permitting the integration of distribution, generation, and transmission, employing them into one internet by using information technology, advanced sensor measurement technologies, communications technologies, new energy technologies, computer technology, control technology [1]. But Smart Grid employs digital technologies for controlling the grid and selecting the optimal mode of power dispersal to increase reliability, minimize energy consumption, increase transparency and reduce costs in the network. Thus, the intelligent system will have an important effect in the domains of economics and finance of the energy sector [2]. The economic dispatch (ED) is the power managing tool that can be utilized for determining the real-time power output of thermal production units to address essential load demand. The ED has minimal fuel production cost, and minimal transmission energy loss while fulfilling all units, along with that system restraint [3]. Fig. 1 illustrates the infrastructure of CEED.
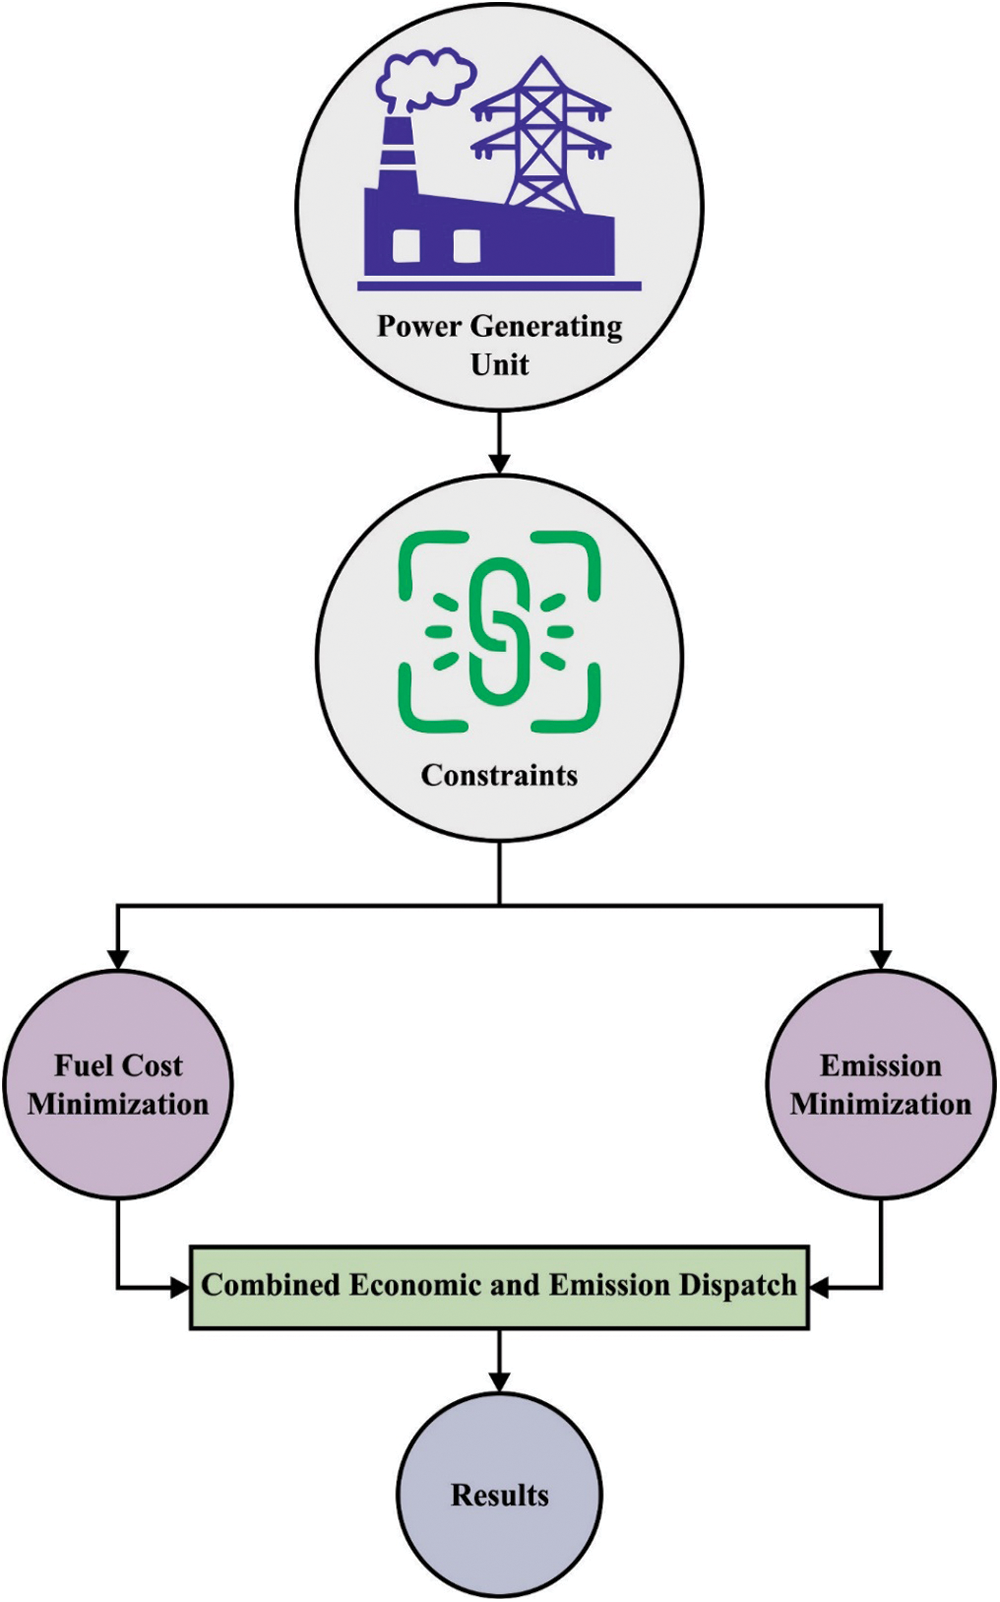
Figure 1: Structure of CEED
The conventional ED issue was to determine the best active power allotment from every involved unit for reducing the whole working cost irrespective of emissions formed while fulfilling every unit and system limitation [4]. But with growing public awareness of environmental protection and the increasing seriousness of the energy crisis, higher-efficacy consumption for renewable energy resources like wind, along with a decrease in pollutant emission extracted from fossil fuels, was paid much interest globally [5]. In this condition, adapting the current allocation technology tactics for minimizing fuel costs and emission levels of pollutants is becoming an urgent research problem. Hence, a novel dispatch method called the combined economic and emission dispatch (CEED) issue was offered for following the minimum emission level and minimal production cost of an energy system [6]. To detect quality solutions to the CEED issue, various optimized methods were formulated. Traditional optimization methods like recursive quadratic programming (QRP) and linear programming (LP) were modeled by researchers [7]. But, the real CEED issue can be a nonlinear and non-smooth constrained optimized issue with nonconvex and complex features, which makes it difficult to search for the best solution. Thus, certain conventional gradient data-related optimized approaches do not solve the CEED problem effectively [8].
Recently, as a replacement to the conventional optimized techniques, many population-related nature-inspired heuristic approaches were widely presented to solve several complicated optimization issues in the real world like electric power system planning, feature selection, image processing, neural networks training, and robotic path planning. Certain heuristic techniques were reported in the literature for solving CEED issues [9]. But the aforementioned CEED issue just relies upon how best to decline the contaminant discharge in the fossil-fuel energy sector through regulation of the prevailing dispatch approaches. Now, renewable energy like wind energy in the energy sector has obtained widespread attention because of its main benefit of zero-emission and less fuel cost [10]. Later, the CEED or ED model by combining wind power was devised for gaining viable scheduling solutions for authors to reach the objective of reducing emissions.
This paper focuses on the design of an improved sand cat optimization algorithm based CEED (ISCOA-CEED) technique. The presented ISCOA-CEED technique majorly concentrates on the reduction of fuel cost and emission of generation units. Moreover, the presented ISCOA-CEED technique transforms the equality constraints of the CEED issue into inequality constraints. Besides, the improved sand cat optimization algorithm (ISCOA) is derived from the integration of traditional SCOA with the Levy Flight (LF) concept. At last, the ISCOA-CEED technique is applied to solve a series of 6 generators as well as 11 generators in the CEED issue. The experimental validation of the ISCOA-CEED technique ensured the enhanced performance of the presented ISCOA-CEED technique over other recent approaches. In short, the key contributions of the study are given as follows.
• Develop a new ISCOA-CEED technique for reducing fuel cost and emission of generation units
• Converts the equality constraints of the CEED issue into the inequality constraints
• Propose an ISCOA by the integration of the conventional SCOA with the LF concept
• Validate the proposed model on a series of 6 generators as well as 11 generators in the CEED issue
The author in [11], developed an Ensemble Multi-objective Differential Evolution (EMODE) to address the problems of ED. Firstly, the equality constraint of the problems was converted into an inequality constraint. Then, two mutation approaches differential evolution (DE)/current-to-rand/1 and DE/rand/1 were employed for improving the traditional DE. The accuracy of the presented model has been estimated on 6 test functions and the mathematical solution has shown that the presented model is effective. Li et al. [12] present an enhanced sailfish optimization technique for handling the problem of large pollution emissions and high operation costs in hybrid dynamic economic emission dispatch (HDEED). The arbitrariness of wind energy can be demonstrated using Weibull distribution and integrated into the dynamic economic emission dispatch (DEED); therefore, it is necessary to establish the presented method. The conventional sailfish optimization (SFO) approach can be optimized by presenting the global search formula, weight inertia, and Levy flight approach to enhance the solution speed and search performance. The improved sailfish optimization (ISFO) technique is to handle the constraint conditions namely slope constraint, power balance constraints, and valve point effect of the thermal power unit.
Deb et al. [13] designs a novel Metaheuristic algorithm (MH) named the Turbulent Flow of Water Optimization (TFWO), which depends on the behaviors of whirlpools made in turbulent water flow, to solve various forms of CEED and economic load dispatch (ELD). To authenticate the effectiveness of the TFWO, numerous test networks of CEED with valve effects and ELD with loss of communication are integrated. The outcomes establish the robustness and potential of the grey wolf optimizer (GWO) to be a promising method to resolve different ELD challenges. Rex et al. [14] developed a new hybrid mechanism to resolve CEED problems that exploit the Whale optimization algorithm (WOA) and genetic algorithm (GA). The performance of the presented algorithm has been tested on 4 distinct test systems and the effectiveness is compared to other heuristic models. Hussien et al. [15] present an adapted moth-flame optimization technique (MMFO) to find the optimum solution to the CEED problem. The presented method is based mainly on the mayfly optimization (MFO) concept with path modification of moths in a new spiral around the flame. The proposed mode is utilized for improving the convergence features of CEED optimum solutions more than others.
The author in [16], developed the Moth Swarm Algorithm to resolve the CEED problems for a twenty-four-hour period. The algorithm has been carried out on the test system composed of solar photovoltaic and thermal plants while considering spinning reserve allocation. Jadoun et al. [17] suggest a Dynamically Controlled Whale Optimization Algorithm (DCWOA) to resolve the Multi-objective non-convex MO-CHPEED problems. The presented method is a better variant of conventional WOA by dynamically adding a controlled constriction function. The contradictory aims of mass emissions and fuel costs are managed through Fuzzy Framework. Li et al. [18] recommend an improved tunicate swarm algorithm (ITSA) for optimizing and solving DEED problems. The presented method aims to minimize the pollutant emission and energy cost of the power system. Furthermore, the presented model is a complicated optimization problem and has numerous optimization goals.
In this study, a new ISCOA-CEED technique has been developed for CEED. The presented ISCOA-CEED technique aims at the effectual reduction of fuel costs and the emission of generation units. Following, the presented ISCOA-CEED technique transforms the equality constraint of the CEED issues into an inequality constraint.
The solution to CEED problems can be accomplished by minimalizing the objective function (OF) incorporated with weighted sum methodology under the system constraint [19].
From the expression, the fuel cost rate ($/h) can be demonstrated with
The fuel cost function of every generator in the system might be characterized by the quadratic function of real power production:
whereas
whereas
Fossil-fuelled thermal unit causes atmospheric waste emission made up of gases and particles namely nitrogen oxide
where
In the minimization method, inequality and equality constraints should be fulfilled. In the presented model, inequality constraints are named generation capacity constraints and equality constraints are termed power balance.
3.1.4 Power Balance Constraint
The overall power production should cover the real power loss in transmission line
The communication loss of the system is denoted as loss coefficients
In Eq. (6),
3.1.5 Generation Capacity Constraint
The real power output of all the generators is constrained using minimal
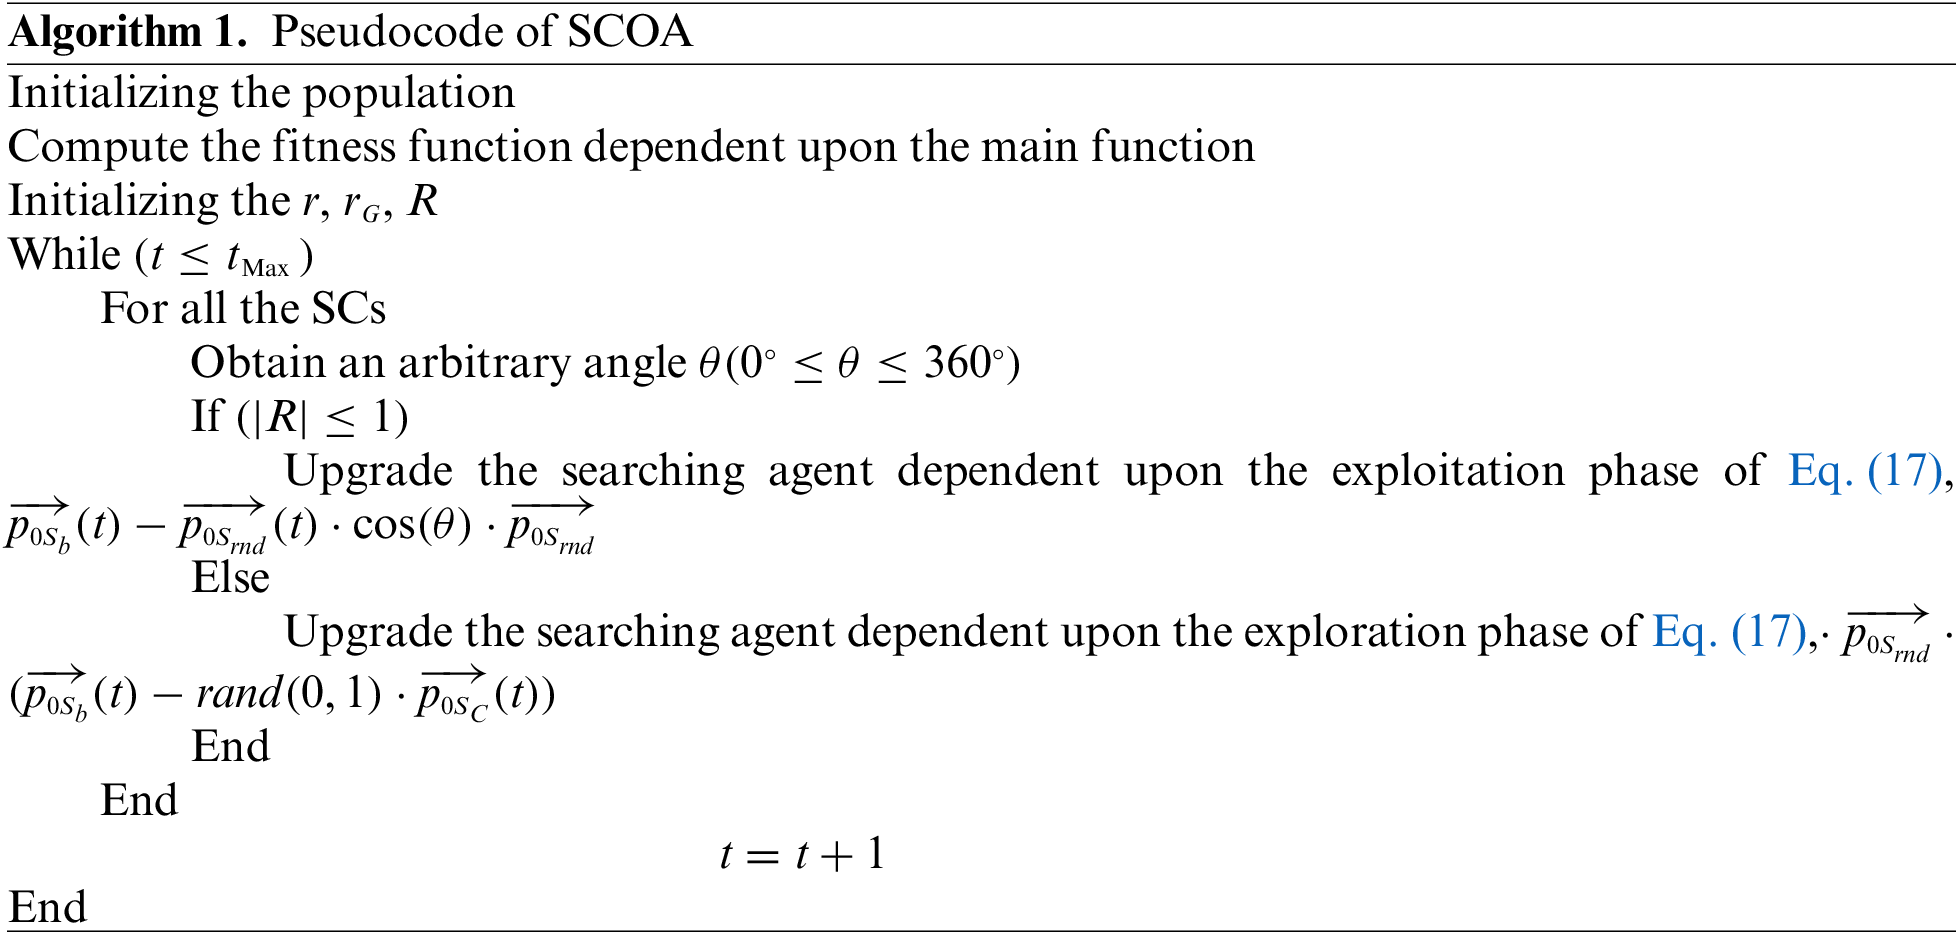
The SCOA technique is called based on a special feature of sand cat (SC) performance in the environment which is the size to classify lower-frequency sound [20]. The attacking and foraging of the prey are the 2 main performances of SC. According to the research study, the SC frequency absorption to frequency under 2
The dimensional of the candidate matrix to a
The
For escaping the local optimal trap, all the SCs have a distinct sensitivity range
Therefore,
In which
At last, the
Once
In Eq. (14), SCs are orderly for attacking their victim if
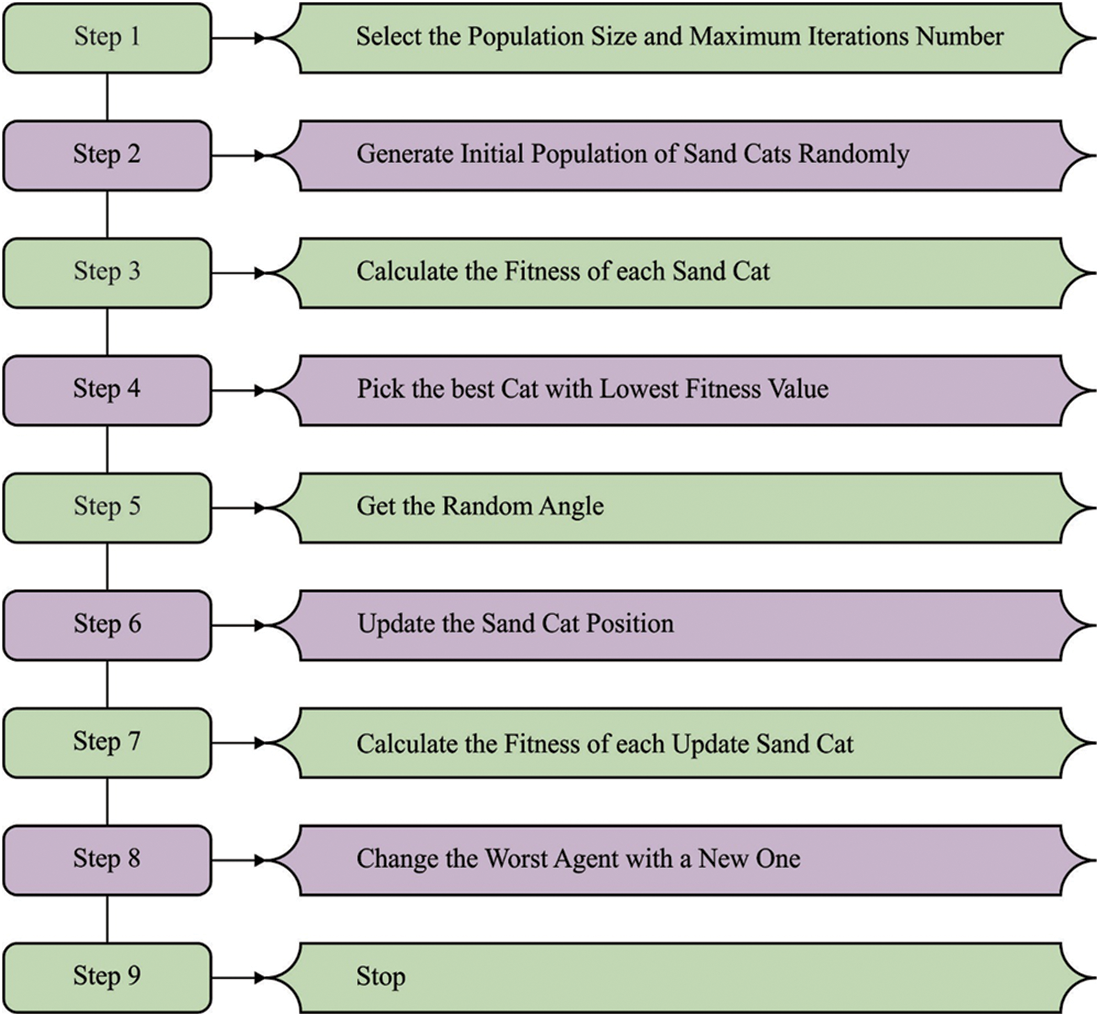
Figure 2: Steps involved in SCO
Moreover, the ISCOA is derived from the integration of traditional SCOA with the LF concept. LF is a type of chaotic system where the leap magnitude can be defined using the likelihood function [21].
In Eq. (15),
Now,
In Eq. (17),
For the provided number of search iterations,
3.3 Process Involved in ISCOA for CEED Problem
During this phase, the CSBO algorithm derives a fitness function to resolve the CEED problems. The fitness function for CEED is the total costs of the estimated system and the fitness function for effective EED is the total emitted emission evaluated as follows:
In Eq. (19),
In Eq. (20),
The proposed model is simulated using the MATLAB tool. The performance validation of the ISCOA-CEED model has been validated through two scenarios a test system with 11 generators and a test system with 6 generators. The test system with eleven generators involves emission level and quadratic cost functions. The power demand ranges from 1000 to 2500 MW. As well, the test system with six generators involves emission level and quadratic cost functions. The power demand ranges from 500 to 1100 MW.
Table 1 and Fig. 3 exhibits a comparative fuel cost (FC) examination of the ISCOA-CEED model with recent models on six generators. The experimental values depicted that the ISCOA-CEED model has shown maximum performance with the least FC values. At the same time, it is noticed that the recursive and improved recursive models have exhibited poor performance with maximum FC values. Although the particle swarm optimization (PSO) and DE models have demonstrated moderately closer FV values, the ISCOA-CEED model has surpassed them with minimal FC values.
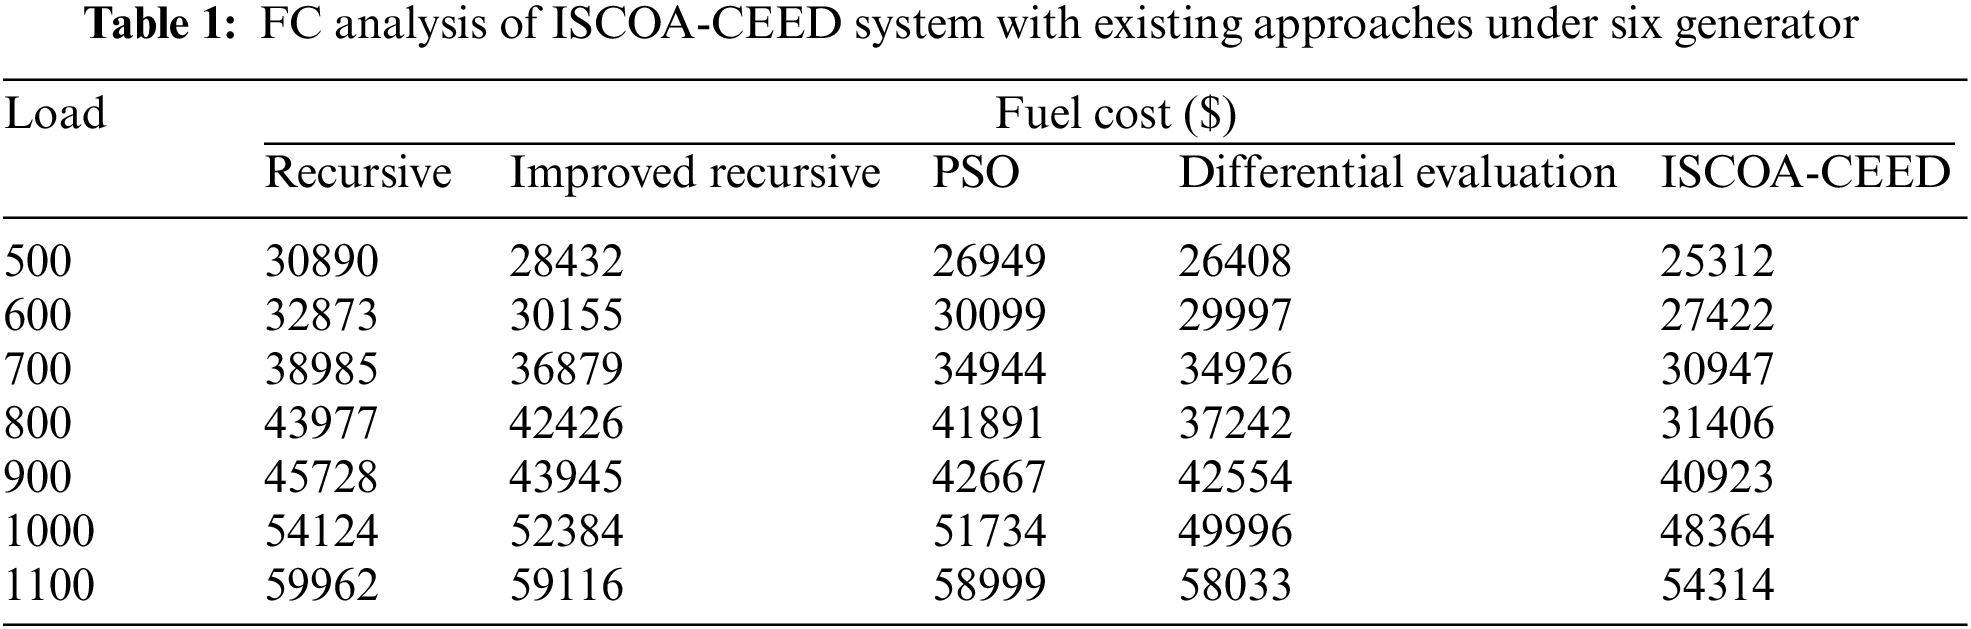
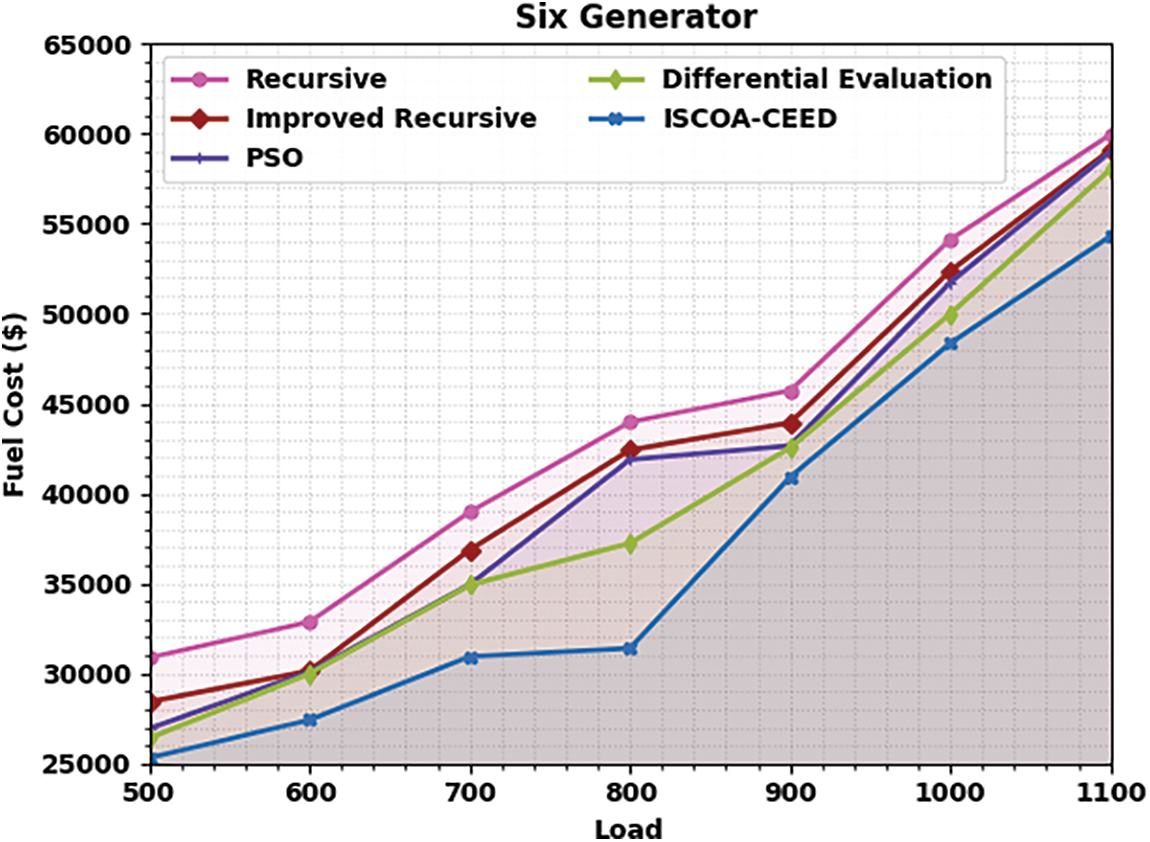
Figure 3: FC analysis of ISCOA-CEED system under six generator
Table 2 and Fig. 4 show a comparative fuel emission (FE) analysis of the ISCOA-CEED with current methods on six generators. The experimental value depicts that the ISCOA-CEED technique has exhibited maximal performance with minimum FE values. Simultaneously, it is noted that the recursive and improved recursive approaches have displayed poor performance with maximal FE values. Even though the PSO and DE techniques have demonstrated reasonably nearer FV values, the ISCOA-CEED method has surpassed them with the least FE values.
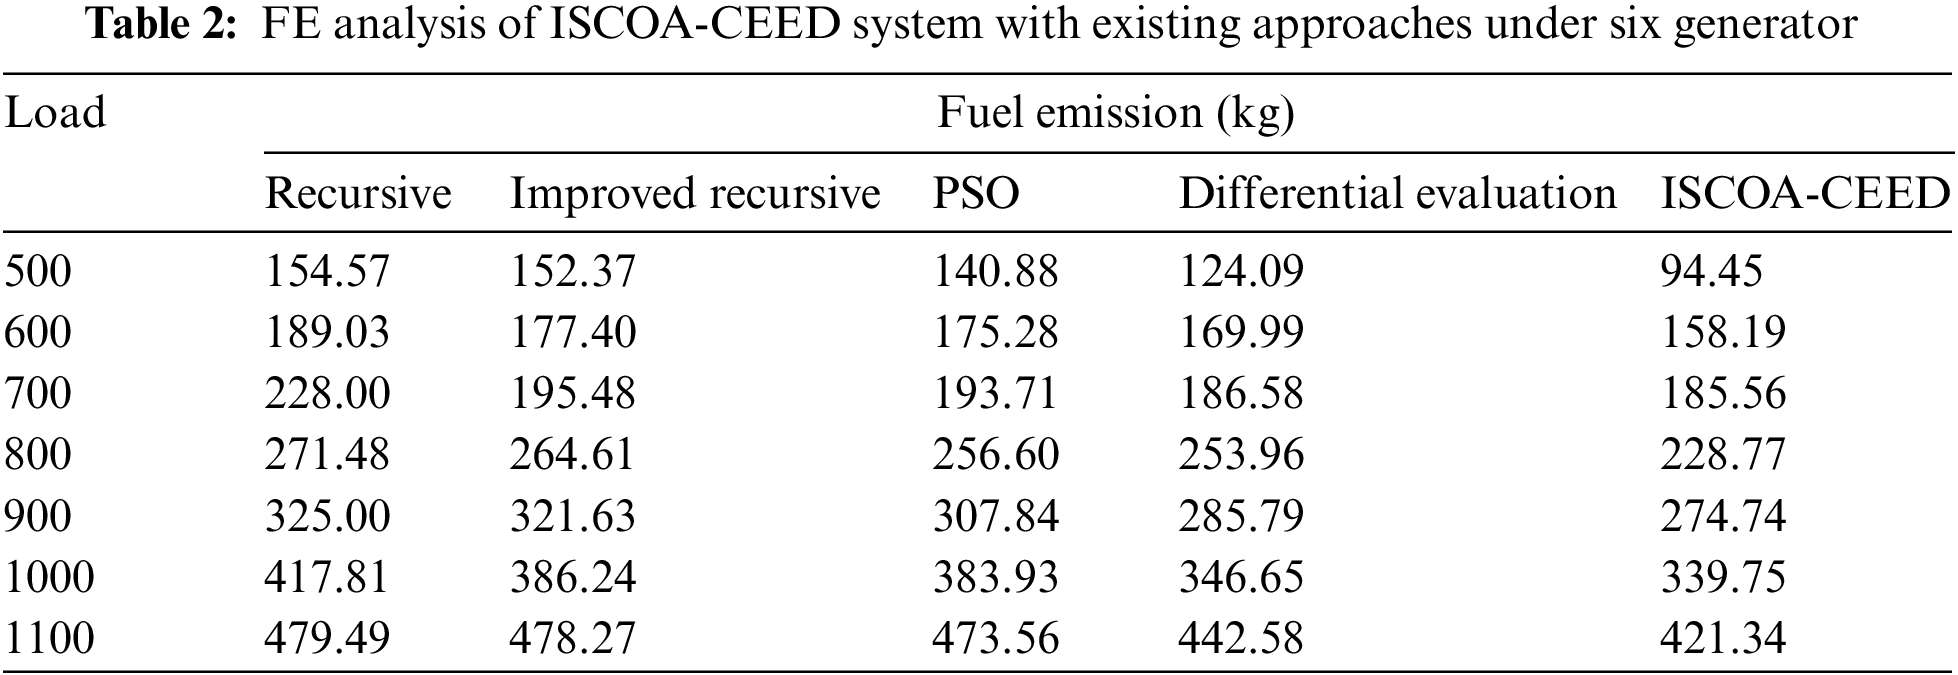
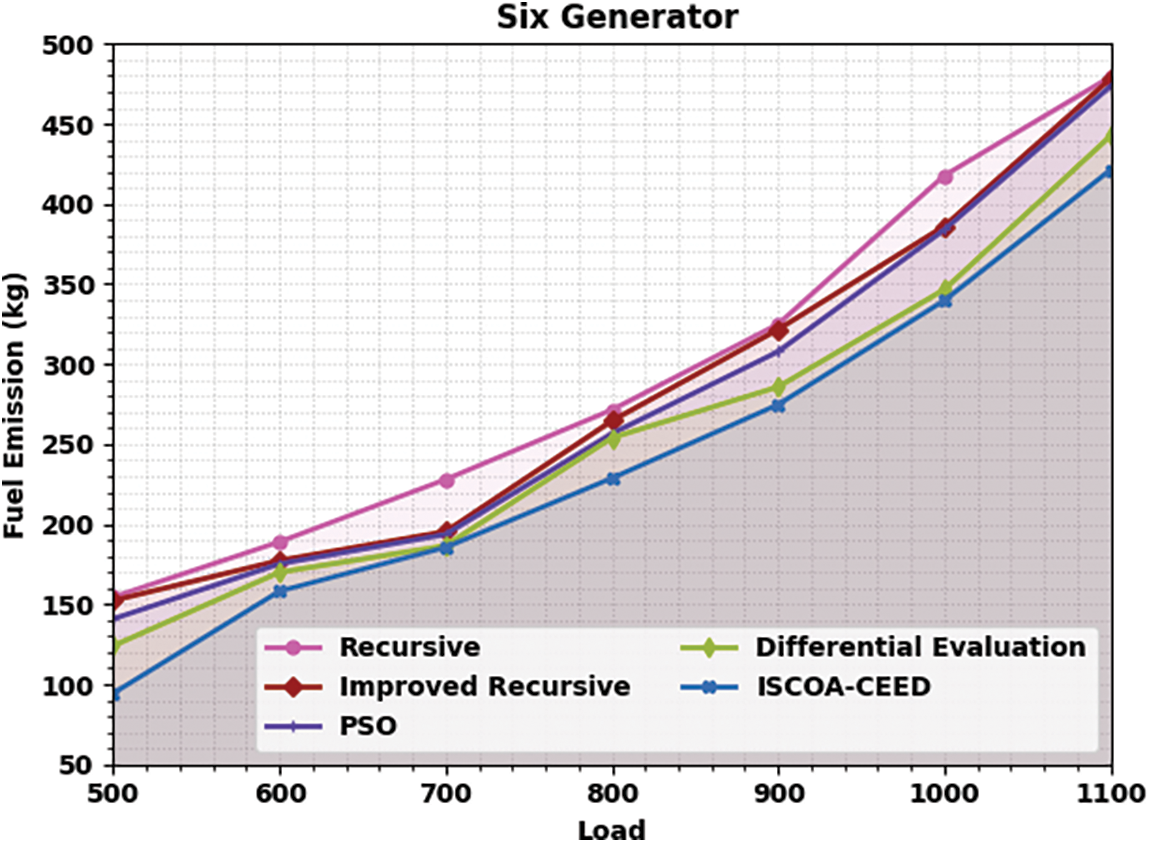
Figure 4: FE analysis of ISCOA-CEED system under six generator
In Table 3, the EED optimal compromise solutions of the ISCOA-CEED model are examined under distinct loads and six generators. The experimental values demonstrated that the ISCOA-CEED model has reached an effectual outcome under each load value.
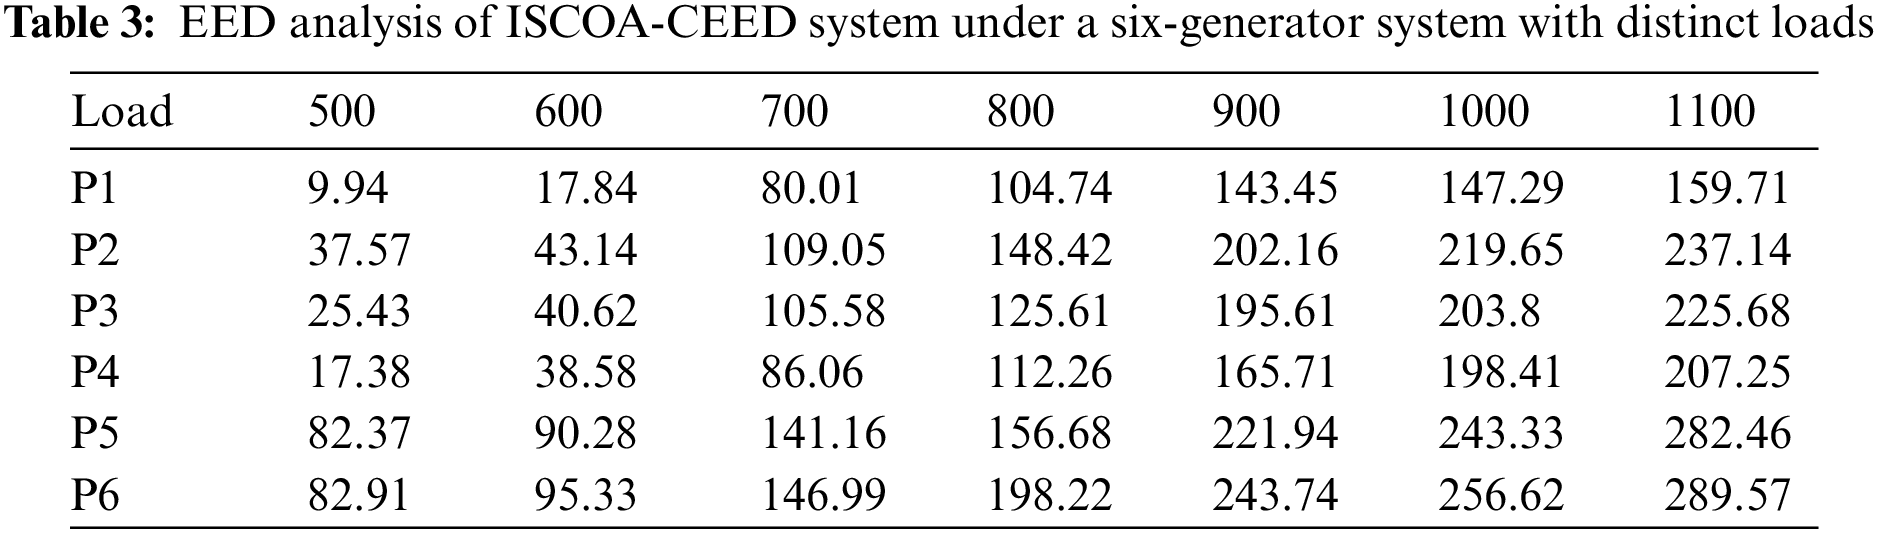
Table 4 and Fig. 5 display a comparative FC inspection of the ISCOA-CEED with current techniques on eleven generators. The experimental value depicts that the ISCOA-CEED model has presented maximal performance with minimum FC values. Simultaneously, it is noted that the recursive and improved recursive techniques have demonstrated poor performance with maximal FC values. Even though the PSO and DE techniques have illustrated reasonably closer FV values, the ISCOA-CEED approach has surpassed them with the least FC values.
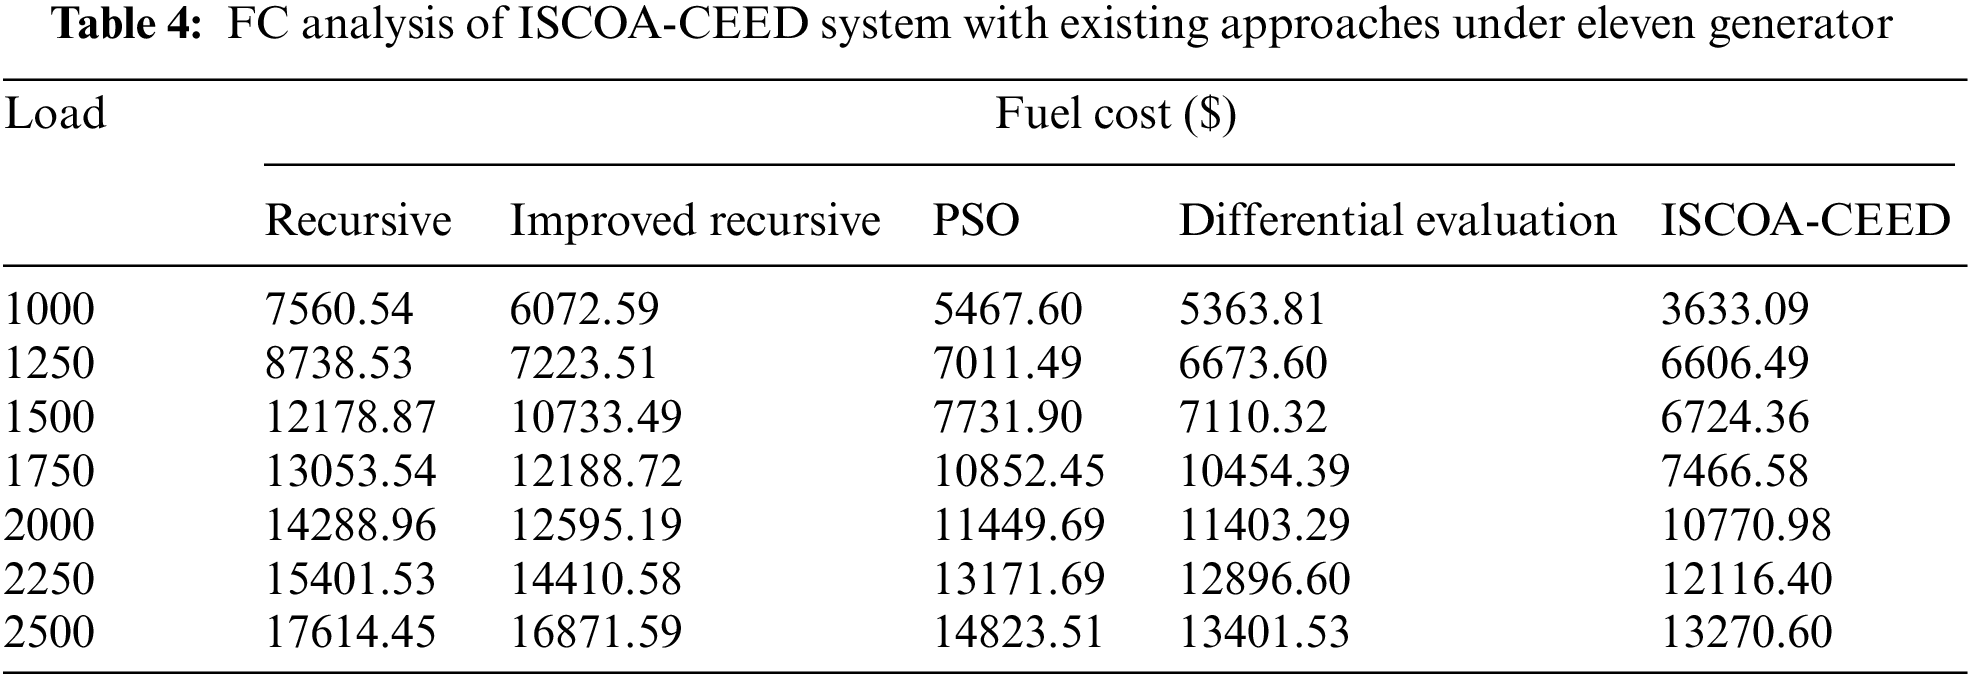

Figure 5: FC analysis of ISCOA-CEED system under eleven generator
Table 5 and Fig. 6 display a comparative FE inspection of the ISCOA-CEED with recent systems on eleven generators. The experimental values portrayed that the ISCOA-CEED method has displayed maximal performance with minimum FE values. Simultaneously, it is noted that the recursive and improved recursive approaches have shown poor performance with maximum FE values. Even though the PSO and DE techniques have illustrated reasonably closer FV values, the ISCOA-CEED method has surpassed them with the least FE values.
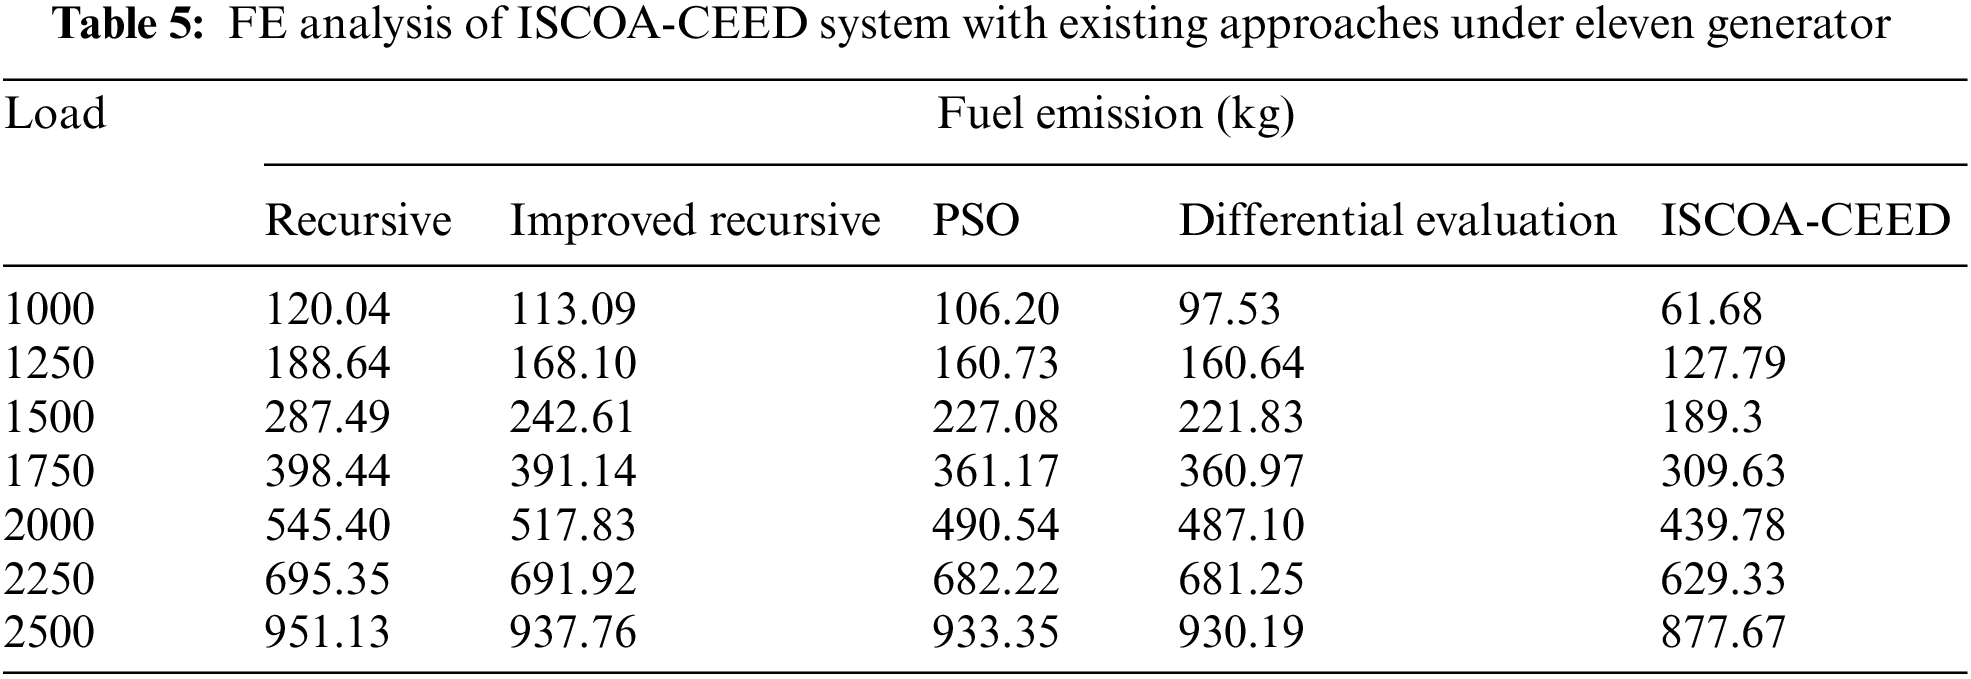
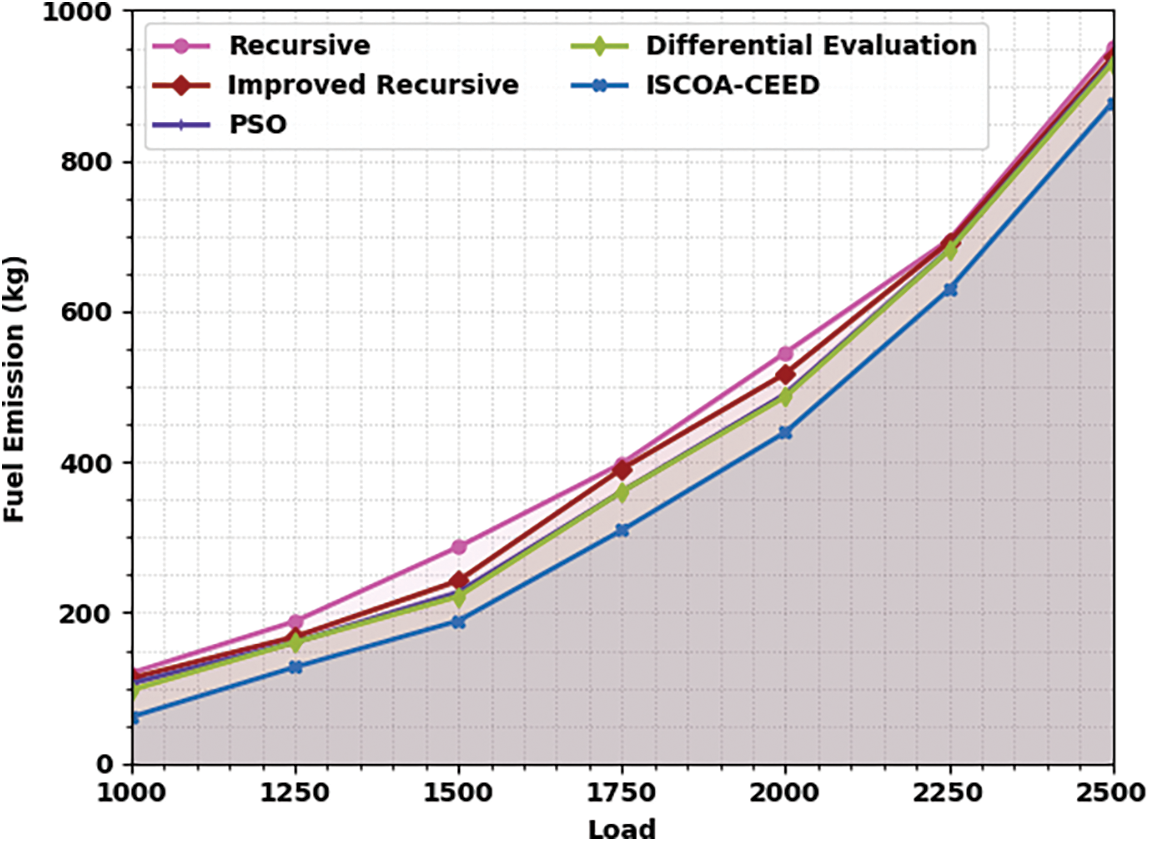
Figure 6: FE analysis of ISCOA-CEED system under eleven generator
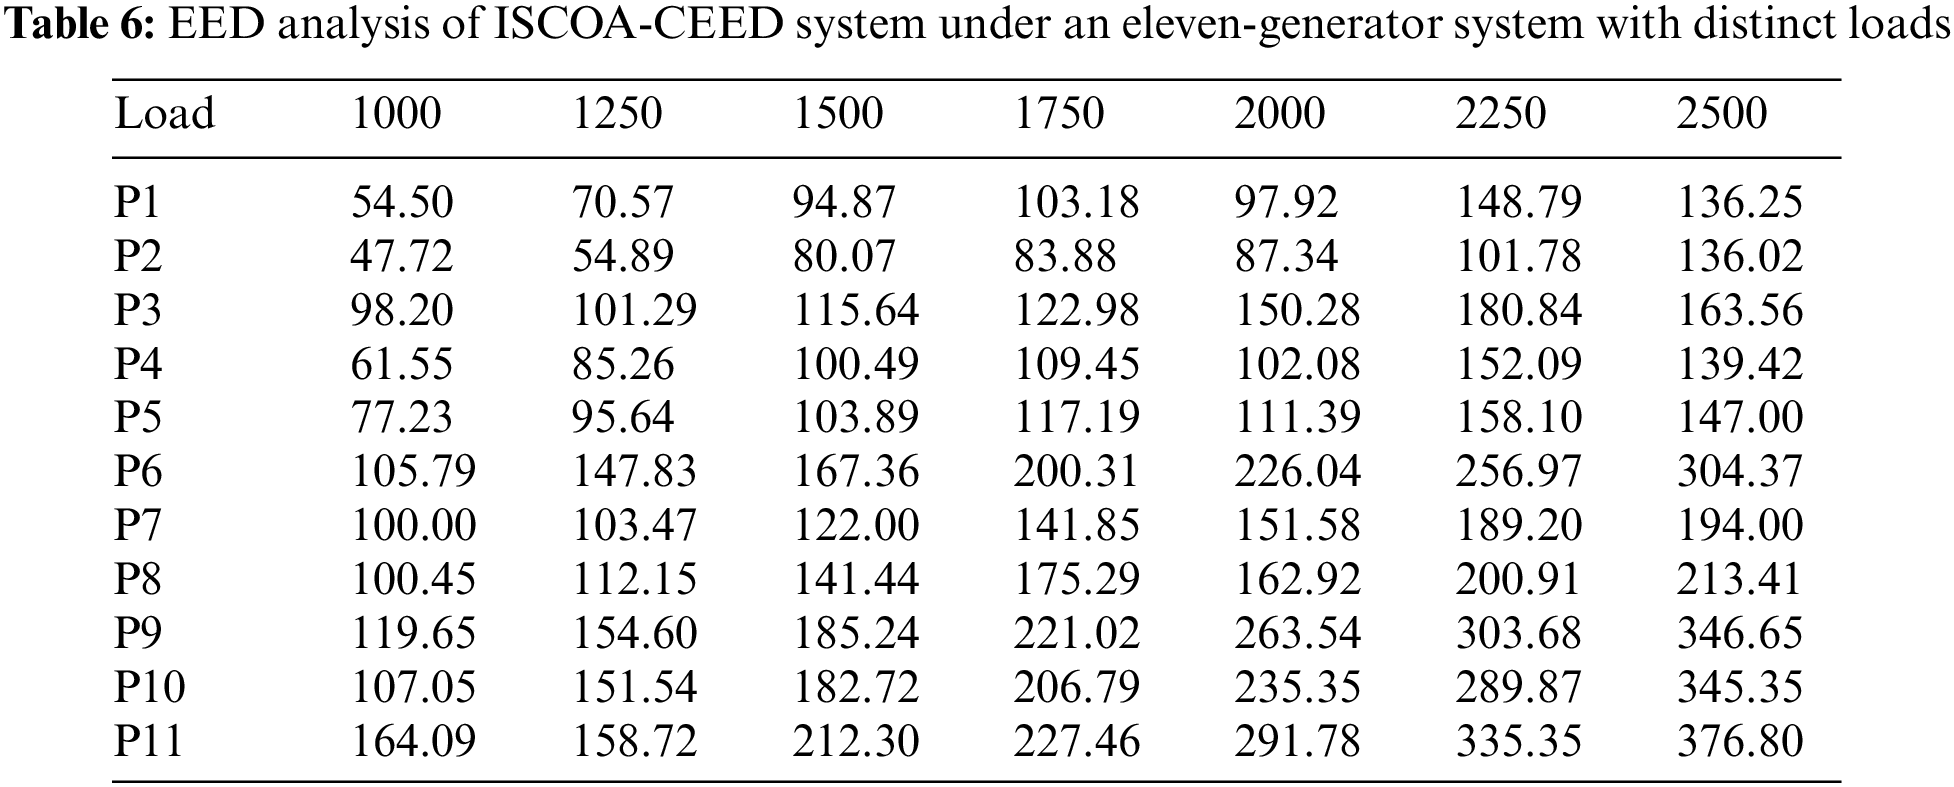
In Table 6, the EED optimum compromise solutions of the ISCOA-CEED method are inspected under dissimilar loads and eleven generators. The experimental values show that the ISCOA-CEED technique has obtained effective results under each load value.
The computation time (CT) analysis of the ISCOA-CEED model under varying loads of six generators is given in Table 7 and Fig. 7. These results inferred that the ISCOA-CEED model has reached effectual outcomes with minimal CT values under all loads. For instance, with 500 loads, the ISCOA-CEED model obtained a CT of 6.62s. At the same time, with 600 loads, the ISCOA-CEED method has acquired a CT of 7s. Moreover, with 900 loads, the ISCOA-CEED method has attained a CT of 10.57s. Next, with an 1100 load, the ISCOA-CEED approach has accomplished a CT of 12.03s.
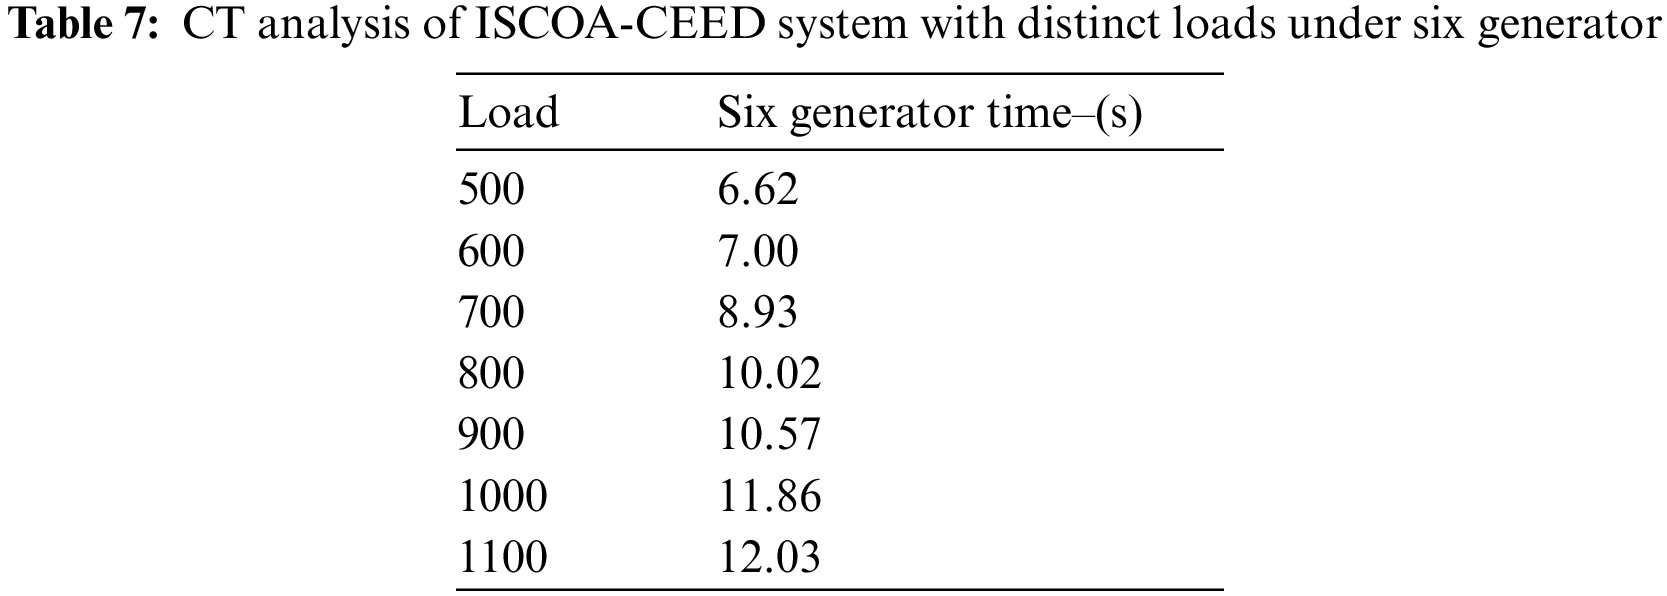
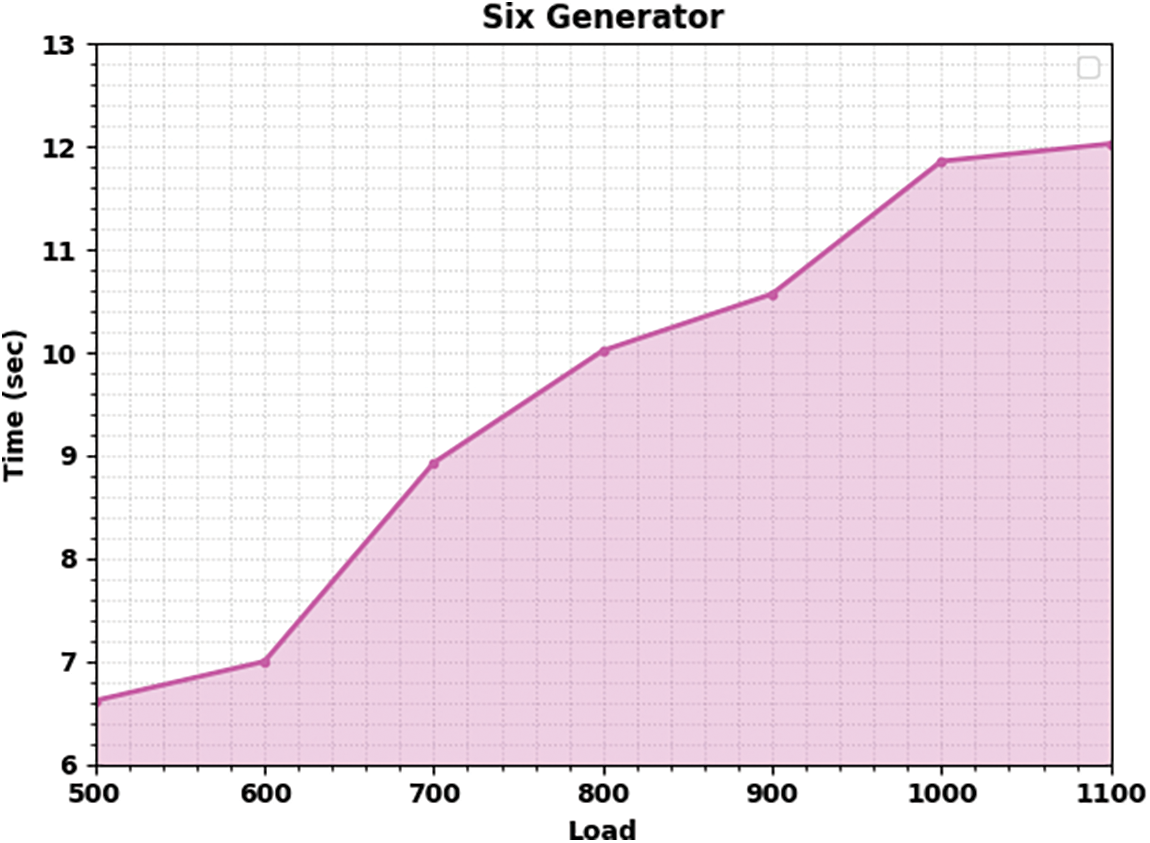
Figure 7: CT analysis of ISCOA-CEED system under six generator
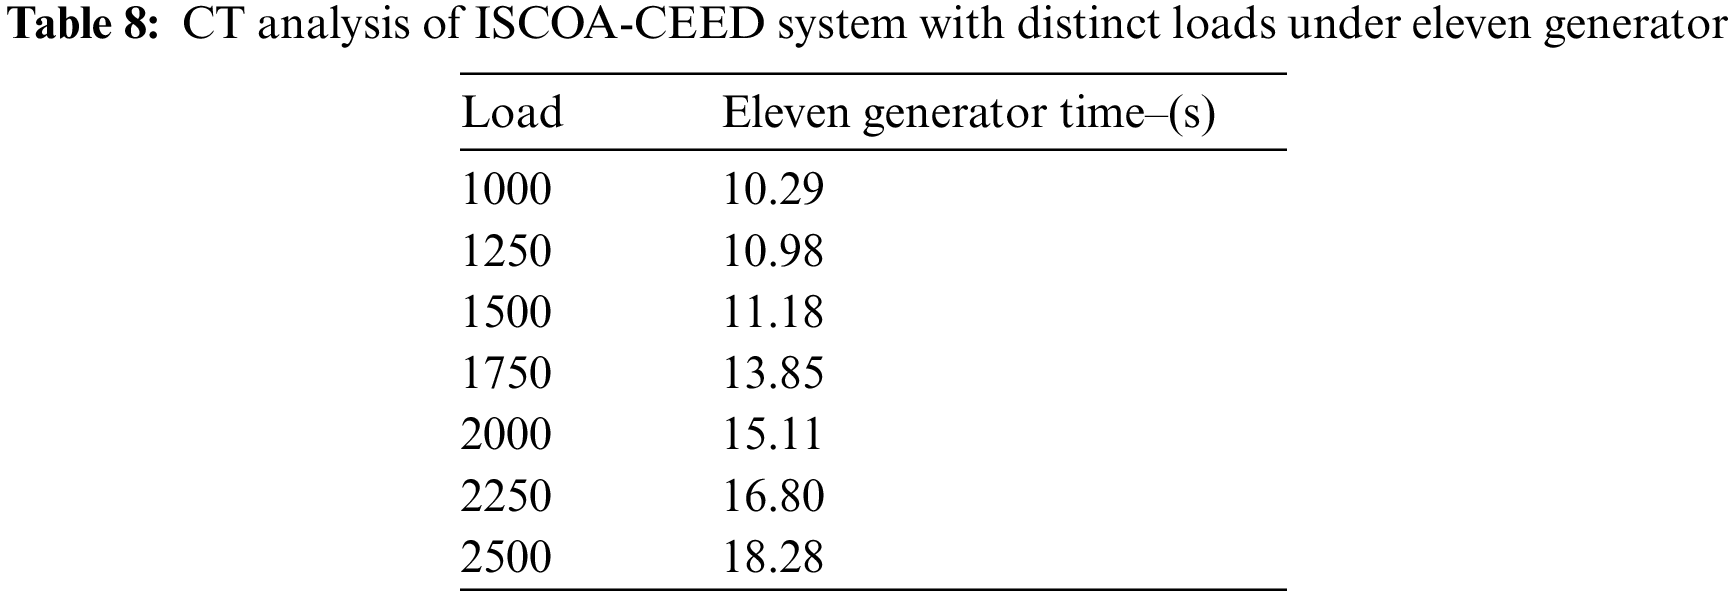
The CT examination of the ISCOA-CEED approach under varying loads of eleven generators is demonstrated in Table 8. The result depicts that the ISCOA-CEED approach has obtained effective results with the least CT values under each load. For example, with 1000 loads, the ISCOA-CEED method has attained a CT of 10.29s. Simultaneously, with a 1250 load, the ISCOA-CEED technique has attained a CT of 10.98s. Furthermore, with a 2250 load, the ISCOA-CEED technique has accomplished a CT of 16.80s. Then, with a 2500 load, the ISCOA-CEED approach attained a CT of 18.28s. These results assured the enhanced performance of the ISCOA-CEED model over other models.
In this study, a new ISCOA-CEED technique has been developed for CEED. The presented ISCOA-CEED technique aims at the effectual reduction of fuel cost and emission of generation units. Following, the presented ISCOA-CEED technique transforms the equality constraint of the CEED issues into the inequality constraint. Moreover, the ISCOA is derived from the integration of traditional SCOA with the LF concept. Finally, the ISCOA-CEED technique is applied to solve a series of 6 generators as well as 11 generators in the CEED issue. The experimental validation of the ISCOA-CEED technique ensured the enhanced performance of the presented ISCOA-CEED technique over other recent approaches. Therefore, the ISCOA-CEED technique can resolve the CEED in a real-time environment. In the future, the presented ISCOA-CEED technique can be extended by the use of deep learning (DL) models.
Funding Statement: Princess Nourah bint Abdulrahman University Researchers Supporting Project number (PNURSP2023R77), Princess Nourah bint Abdulrahman University, Riyadh, Saudi Arabia. This study is supported via funding from Prince Sattam bin Abdulaziz University project number (PSAU/2023/R/1444). The authors would like to thank the Deanship of Scientific Research at Umm Al-Qura University for supporting this work by Grant Code: 22UQU4340237DSR65.
Conflicts of Interest: The authors declare that they have no conflicts of interest to report regarding the present study.
References
1. C. K. Faseela and H. Vennila, “Economic and emission dispatch using whale optimization algorithm (WOA),” International Journal of Electrical and Computer Engineering, vol. 8, no. 3, pp. 1297, 2018. [Google Scholar]
2. R. Habachi, A. Boulal, A. Touil, A. Charkaoui and A. Echchatbi, “Economic and emission dispatch using cuckoo search algorithm,” International Journal of Electrical and Computer Engineering, vol. 9, no. 5, pp. 3384, 2019. [Google Scholar]
3. S. Jiang, C. Zhang, W. Wu and S. Chen, “Combined economic and emission dispatch problem of wind-thermal power system using gravitational particle swarm optimization algorithm,” Mathematical Problems in Engineering, vol. 2019, pp. 1–19, 2019. [Google Scholar]
4. S. Deb, D. S. Abdelminaam, M. Said and E. H. Houssein, “Recent methodology-based gradient-based optimizer for economic load dispatch problem,” IEEE Access, vol. 9, pp. 44322–44338, 2021. [Google Scholar]
5. T. R. Manikandan and V. Thangavelu, “Combined economic and emission power dispatch control using substantial augmented transformative algorithm,” Intelligent Automation & Soft Computing, vol. 35, no. 1, pp. 431–447, 2023. https://doi.org/10.32604/iasc.2023.026546 [Google Scholar] [CrossRef]
6. P. Verma and R. P. Parouha, “An innovative hybrid algorithm for solving combined economic and emission dispatch problems,” Soft Comput, vol. 26, no. 22, pp. 12635–12666, 2022. [Google Scholar]
7. G. Xiong, M. Shuai and X. Hu, “Combined heat and power economic emission dispatch using improved bare-bone multi-objective particle swarm optimization,” Energy, vol. 244, pp. 123108, 2022. [Google Scholar]
8. S. Fayyaz, M. K. Sattar, M. Waseem, M. U. Ashraf, A. Ahmad et al., “Solution of combined economic emission dispatch problem using improved and chaotic population-based polar bear optimization algorithm,” IEEE Access, vol. 9, pp. 56152–56167, 2021. [Google Scholar]
9. A. K. Sahoo, T. K. Panigrahi, S. R. Das and A. Behera, “Chaotic butterfly optimization algorithm applied to multi-objective economic and emission dispatch in modern power system,” Recent Advances in Computer Science and Communications, vol. 15, no. 2, pp. 170–185, 2022. [Google Scholar]
10. T. A. Ahmed, M. Ebeed, A. Refai and S. Kamel, “Solving combined economic and emission dispatch problem using the slime mould algorithm,” Sohag Engineering Journal, vol. 1, no. 1, pp. 62–70, 2021. [Google Scholar]
11. X. Yu, X. Yu, Y. Lu and J. Sheng, “Economic and emission dispatch using ensemble multi-objective differential evolution algorithm,” Sustainability, vol. 10, no. 2, pp. 418, 2018. [Google Scholar]
12. L. L. Li, Q. Shen, M. L. Tseng and S. Luo, “Power system hybrid dynamic economic emission dispatch with wind energy based on improved sailfish algorithm,” Journal of Cleaner Production, vol. 316, pp. 128318, 2021. [Google Scholar]
13. S. Deb, E. H. Houssein, M. Said and D. S. Abdelminaam, “Performance of turbulent flow of water optimization on economic load dispatch problem,” IEEE Access, vol. 9, pp. 77882–77893, 2021. [Google Scholar]
14. C. R. E. S. Rex, M. M. Beno and J. Annrose, “A solution for combined economic and emission dispatch problem using hybrid optimization techniques,” Journal of Electrical Engineering & Technology, pp. 1–10, 2019. https://doi.org/10.1007/s42835-019-00192-z [Google Scholar] [CrossRef]
15. A. R. Hussien, S. Kamel, M. Ebeed and J. Yu, “A developed approach to solve economic and emission dispatch problems based on moth-flame algorithm,” Electric Power Components and Systems, vol. 49, pp. 94–107, 2021. [Google Scholar]
16. O. Ajayi and R. Heymann, “Day-ahead combined economic and emission dispatch with spinning reserve consideration using moth swarm algorithm for a data centre load,” Heliyon, vol. 7, no. 9, pp. e08054, 2021. [Google Scholar] [PubMed]
17. V. K. Jadoun, G. R. Prashanth, S. S. Joshi, K. Narayanan, H. Malik et al., “Optimal fuzzy based economic emission dispatch of combined heat and power units using dynamically controlled whale optimization algorithm,” Applied Energy, vol. 315, pp. 119033, 2022. [Google Scholar]
18. L. L. Li, Z. F. Liu, M. L. Tseng, S. J. Zheng and M. K. Lim, “Improved tunicate swarm algorithm: Solving the dynamic economic emission dispatch problems,” Applied Soft Computing, vol. 108, pp. 107504, 2021. [Google Scholar]
19. J. Radosavljević, “A solution to the combined economic and emission dispatch using hybrid PSOGSA algorithm,” Applied Artificial Intelligence, vol. 30, no. 5, pp. 445–474, 2016. [Google Scholar]
20. A. Iraji, J. Karimi, S. Keawsawasvong and M. L. Nehdi, “Minimum safety factor evaluation of slopes using hybrid chaotic sand cat and pattern search approach,” Sustainability, vol. 14, no. 13, pp. 8097, 2022. [Google Scholar]
21. M. Abd Elaziz, A. Mabrouk, A. Dahou and S. A. Chelloug, “Medical image classification utilizing ensemble learning and levy flight-based honey badger algorithm on 6G-enabled internet of things,” Computational Intelligence and Neuroscience, vol. 2022, pp. 1–17, 2022. [Google Scholar]
Cite This Article
 Copyright © 2023 The Author(s). Published by Tech Science Press.
This work is licensed under a Creative Commons Attribution 4.0 International License , which permits unrestricted use, distribution, and reproduction in any medium, provided the original work is properly cited.
 Downloads
 Citation Tools