
 Submit a Paper
 Propose a Special lssue
 Open Access
ARTICLE

Early Diagnosis of Lung Tumors for Extending Patients’ Life Using Deep Neural Networks
1 Department of Computer Science and Engineering, SRM Institute of Science and Technology, Ramapuram, Chennai, India
2 Department of Computer Science and Engineering, Saveetha Engineering College, Chennai, India
3 Department of Computer Science and Engineering, Vardhaman College of Engineering, Hyderabad, India
4 Department of Computer Science and Information Engineering, National Yunlin University of Science and Technology, Yunlin 64002, Taiwan
5 Intelligence Recognition Industry Service Research Center, National Yunlin University of Science and Technology, Yunlin 64002, Taiwan
6 Chitkara University Institute of Engineering and Technology, Chitkara University, Punjab, India
7 Department of Computing Science, University of Aberdeen, Aberdeen, UK
8 Software Engineering Department, College of Computer and Information Sciences, King Saud University, Riyadh 12372, Saudi Arabia
9 Computer Science Department, Community College, King Saud University, Riyadh 11437, Saudi Arabia
10 School of Computer & Communication Engineering, Changsha University of Science & Technology, Changsha, China
* Corresponding Author: Shih-Yu Chen. Email:
Computers, Materials & Continua 2023, 76(1), 993-1007. https://doi.org/10.32604/cmc.2023.039567
Received 06 February 2023; Accepted 23 April 2023; Issue published 08 June 2023
 View Full Text
 Download PDF
Abstract
The medical community has more concern on lung cancer analysis. Medical experts’ physical segmentation of lung cancers is time-consuming and needs to be automated. The research study’s objective is to diagnose lung tumors at an early stage to extend the life of humans using deep learning techniques. Computer-Aided Diagnostic (CAD) system aids in the diagnosis and shortens the time necessary to detect the tumor detected. The application of Deep Neural Networks (DNN) has also been exhibited as an excellent and effective method in classification and segmentation tasks. This research aims to separate lung cancers from images of Magnetic Resonance Imaging (MRI) with threshold segmentation. The Honey hook process categorizes lung cancer based on characteristics retrieved using several classifiers. Considering this principle, the work presents a solution for image compression utilizing a Deep Wave Auto-Encoder (DWAE). The combination of the two approaches significantly reduces the overall size of the feature set required for any future classification process performed using DNN. The proposed DWAE-DNN image classifier is applied to a lung imaging dataset with Radial Basis Function (RBF) classifier. The study reported promising results with an accuracy of 97.34%, whereas using the Decision Tree (DT) classifier has an accuracy of 94.24%. The proposed approach (DWAE-DNN) is found to classify the images with an accuracy of 98.67%, either as malignant or normal patients. In contrast to the accuracy requirements, the work also uses the benchmark standards like specificity, sensitivity, and precision to evaluate the efficiency of the network. It is found from an investigation that the DT classifier provides the maximum performance in the DWAE-DNN depending on the network’s performance on image testing, as shown by the data acquired by the categorizers themselves.Keywords
The lung is the most complicated organ in the human body and needs to be observed more closely. In specific scenarios, lung cancers are harmful and often lead to fatalities in human life due to abnormal cell growth within the lung [1,2]. Many valuable lives are lost due to incorrect lung cancer estimation and identification. In biomedical image processing, which uses computer methods, several significant studies have been done to correctly segment and categorize lung cancers [3]. However, image grouping and segmentation algorithms suffer from different image content, occlusion, noisy images, chaotic objects, consistent image texture, and other problems. Magnetic Resonance Imaging (MRI) scans are often used to identify the existence of lung cancers by segmenting lung cancers and then classifying them using a dataset [4]. In addition, during this process, further information about the location of cancer beyond those seen on the Computed Tomography (CT) scan and the X-ray is traced [5].
Several researchers focus mainly on lung cancer segmentation and classification, taking into account discovering lung tumors as a primary goal. Lung cancer segmentation is tricky because of the vast data required for testing [6]. The image is separated into pieces during segmentation based on pixels with comparable characteristics [7]. Typically, specialists and physicians use manual segmentation to extract the contaminated zone from MRI scans in hospitals. According to the literature, several algorithms concentrate on segmentation, classification, or feature extraction [8]. However, these existing methods are improved marginally with MRI image analysis and need effective preprocessing and sufficient feature selection procedures.
The procedure is a time-consuming operation that requires a precise evaluation of the information provided by numerous algorithms as soon as the parameters are analyzed in governing the automated segmentation process [9]. The evaluation task must also take into consideration how the parameters for the system must be set. Lung tissue may be categorized into healthy and pathological, which can be used to identify diseased regions and diagnose neurological conditions. Segmentation can be conducted to determine cancer and edema. To examine distinct forms of lung tumors, cancer, and edema are divided [10].
Soft computing and Machine Learning (ML) based approaches have emerged as a top option among researchers in image processing & signal processing applications. Soft computing techniques give more priority because of advancements in extremely large-scale integration built on low-power execution [11]. Most real-time applications use a threshold value to accomplish segmentation on image characteristics. For texture-based and histogram segmentation approaches, the histogram generated is considered for analysis. Based on the observations, threshold value adjustment is made, a complicated process requiring much background work [12].
Computerized Tomography (CT), Ultrasound imaging, and MRI are among the image modalities used in analyzing cancer detected in the breast, liver, lung, or other organs in the human body leading to an accuracy of 92.14% [13]. However, it has certain limitations in that measurements are supplied for a limited number of images [14]. Because of the high level of geographical and anatomical variations in the environment surrounding lung tumors, automating the classification of lung cancers is a challenging endeavor with VGG19 + CNN combinational model leading to an accuracy level of 98.05% [15]. The DNN architecture is created by using several smaller kernels. The neuron has a shallow mass, according to the descriptions. The experimental results performed in the study show that DNN achieves a higher accuracy rate of 98.01% when compared to all other methods that were considered to be state-of-the-art [16].
A novel lung cancer segmentation system presented with multimodal features for lung cancer segmentation experimental study with an accuracy level of 94.33% [17,18]. Here in the designed system, a fuzzy method is used to classify and segment lung cancer. Fuzzy Interaction Technology is a piece of technology utilized mainly for lung segmentation. The unsupervised classification method creates a membership value for fuzzy controllers with an accuracy level of 86.21% [19]. Although the performance is significantly better in terms of accuracy, it is noted that it doesn’t fulfill the requirements, and there exists some lag in the process. The adaptive histogram equalization technique compensates for this with higher contrast in the image. Subsequently, segmentation using fuzzy c-means algorithm is used to separate the overall appearance of the lung from retrieving the global characteristics to sort out the normal and abnormal cells [20].
One of the most difficult challenges in image processing is image segmentation of the lung image, which may be found in the medical field. Image segmentation is essential in many image-processing applications [21,22]. The requirement for extreme precision in dealing with human life drives the automated categorization and identification of various medical images of malignancies [23]. It has been quite effective in evaluating lung images. Technically, the technique develops a parametric model that considers the chosen attributes. Deep neural networks (DNNs) have recently received much interest in the proposed research context and play a predominant role [24–31].
The structure of the proposed system for classifying lung MRI images for disease diagnosis using a DNN (based on a DWAE) is shown in Fig. 1. The major difficulty that occurs is that the data collected bears complexity and are non-stationary with heavy noise [32]. This could be overcome with wavelet function is employed as the nonlinear activation function to design wavelet auto-encoder. Subsequently, DWAE is constructed with multiple WAEs. The overall process is to extract significant proportion of the gathered images which have been preserved using DICOM format, a file used in the medical field developed particularly for use with computer memory. The data themselves need to be processed first to extract images from these Digital Imaging and Communications in Medicine (DICOM) files. This image is pre-processed and matrix construction is done. Followed by this data images are further sub-divided into tiny sub-arrays. Then finally DWAE function is applied and the encoded image is processed with DNN. The results image set is finally reconstructed and output is fetched.
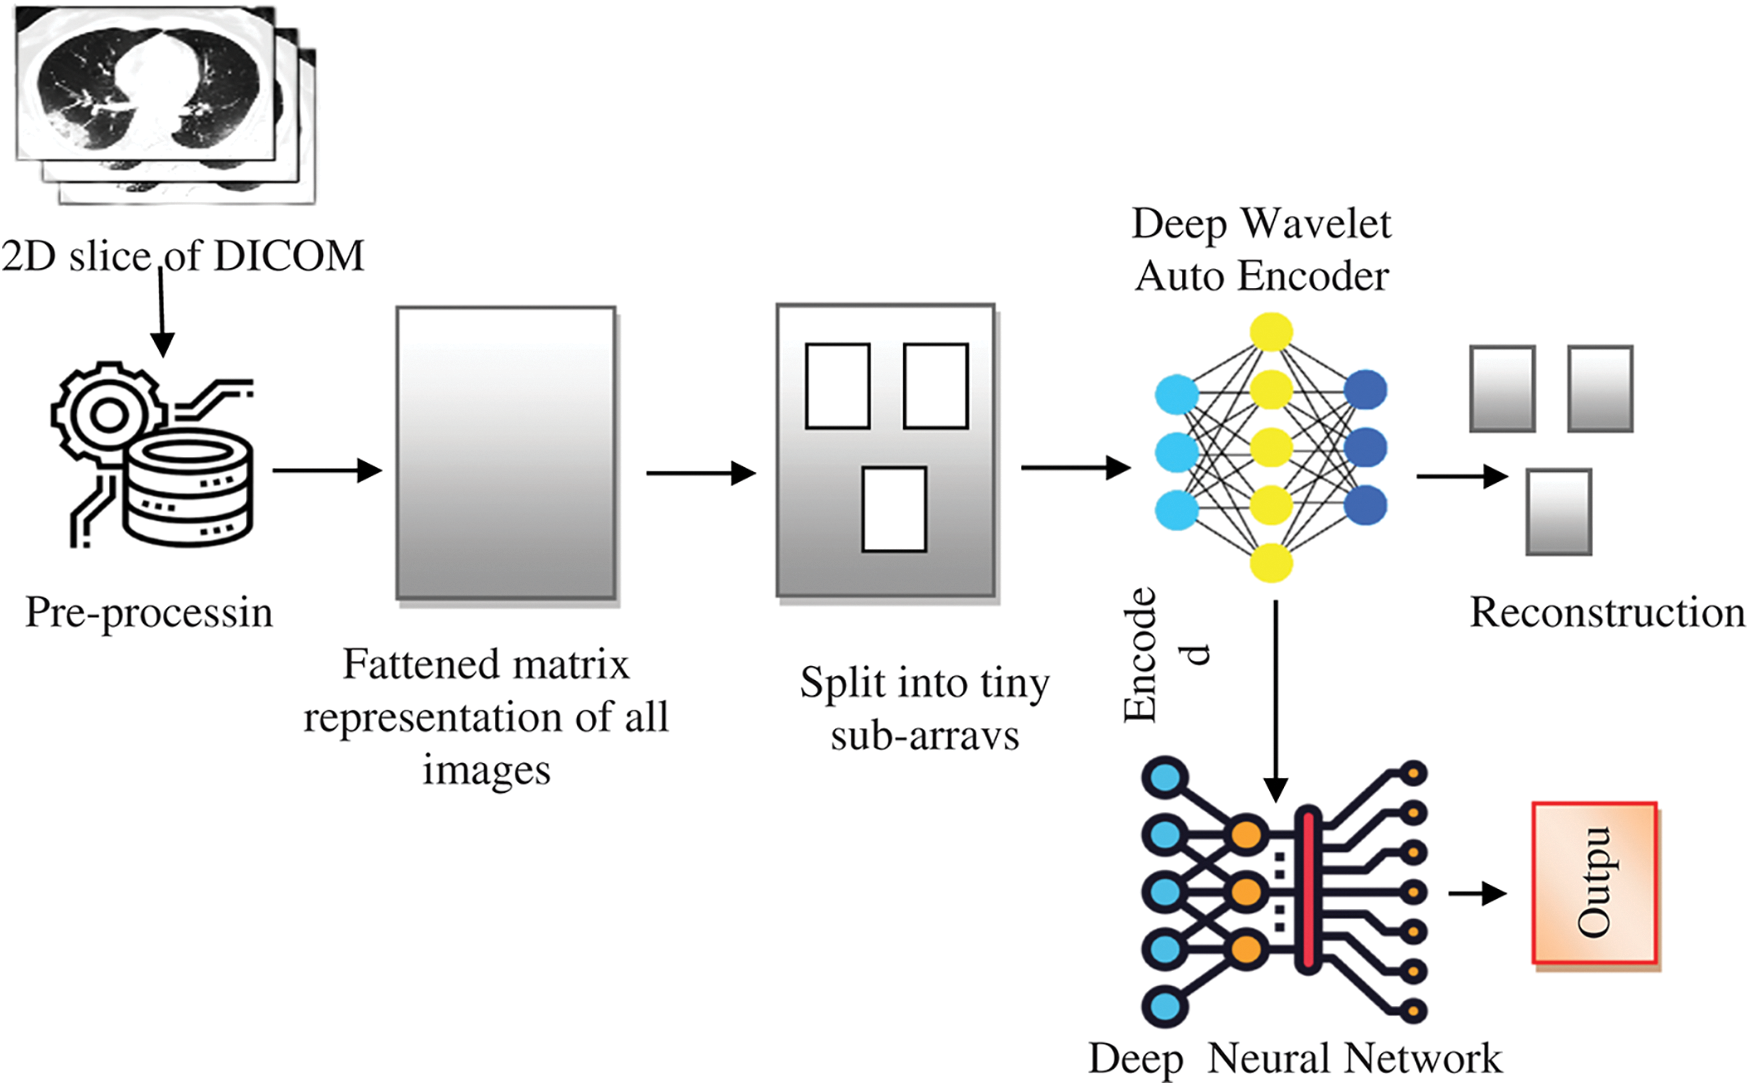
Figure 1: A DICOM image classification based on a DWAE-DNN model
Because there are many images, those have been broken up into smaller sub-arrays to enhance the performance. When these image sub-arrays are processed using Data Weighted Averaging (DWA), the encoded images are produced. The data set used in this study includes lung MRI scans of 153 people (both regular and with lung malignancies) referred to imaging facilities due to headaches, with a total of 1892 images, of which 1666 were used for the training and 226 for the testing. Following the doctor’s inspection and diagnosis, these images included lung images of 80 healthy people. A total of 1321 images were taken for the study, out of which 56 of them were test data, and the remaining was used for training. Seventy-three of those are cancer patients, which includes a total of 571 images. The overall number of people detected with lung cancer disease varied between 8 to 66 years old, with 86 girls and 68 men among them.
One of the methods of clustering is called central clustering. A duplicating technique repeatedly seeks locations as cluster centers, which have essentially the same mean positions for every cluster. Then it assigns each sampling dataset to a group that gives the least distance toward the center of each cluster for a certain number of sets. The centers of the groups are awarded points based on the degree to which they are similar, which ultimately leads to the formation of new clusters. This technique may be simplified to its most basic form by randomly selecting the cluster centers. Extracting features from the data using a first-order clustering technique is the procedure used for investigation. Fig. 2 presents the clustering approach that has been applied to it.
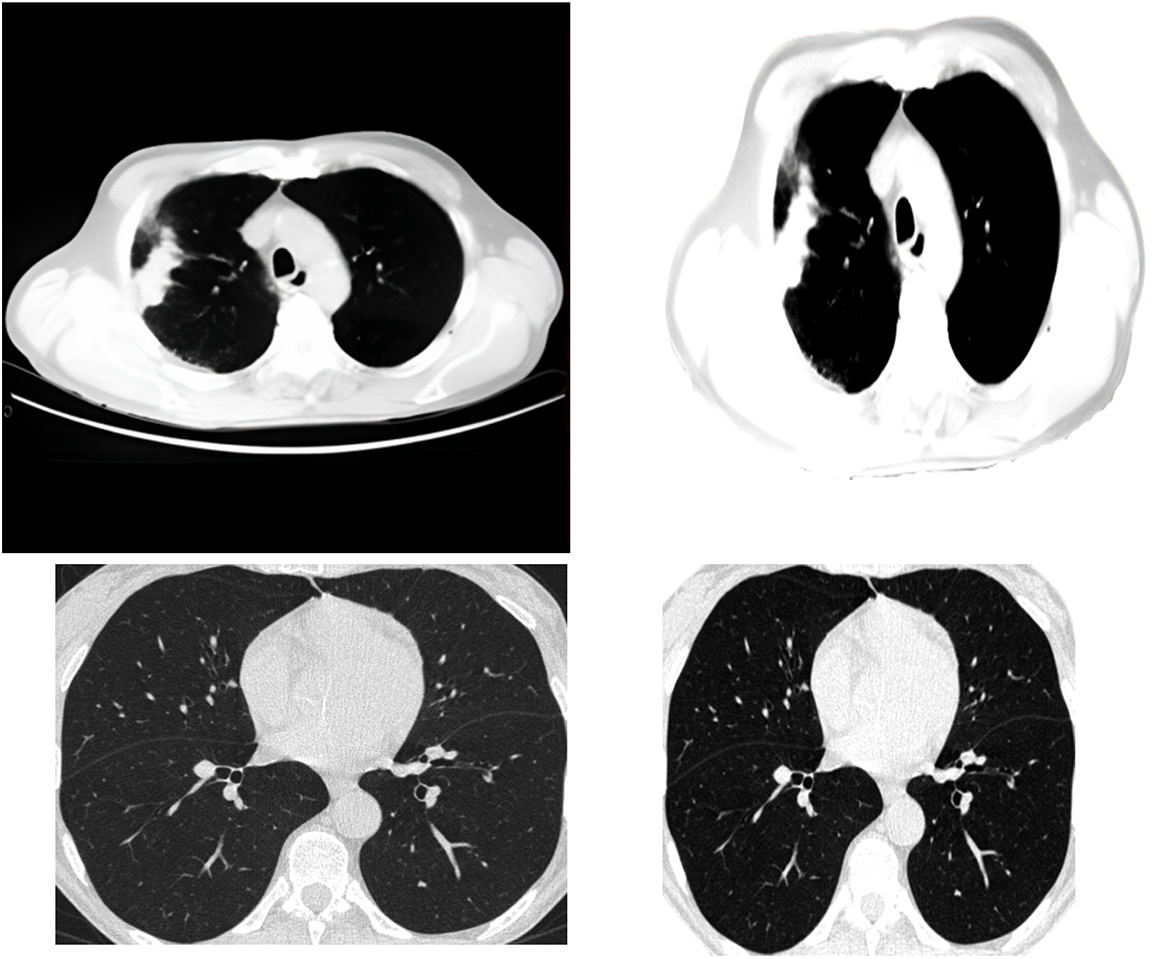
Figure 2: Applying the clustering algorithm to the image
Fig. 3 presents the design of single-layer DWAE. This approach uses discrete wave transform using a Daubechies mother wavelet with class 2 to process the encoded image generated from the original image and produce estimation and precision coefficients through Low Pass Filter (LPF) and High Pass Filter (HPF). Using the DNN model, the approximation coefficients are further analyzed for classification. The presented architecture may be refined to create a more accurate replica.
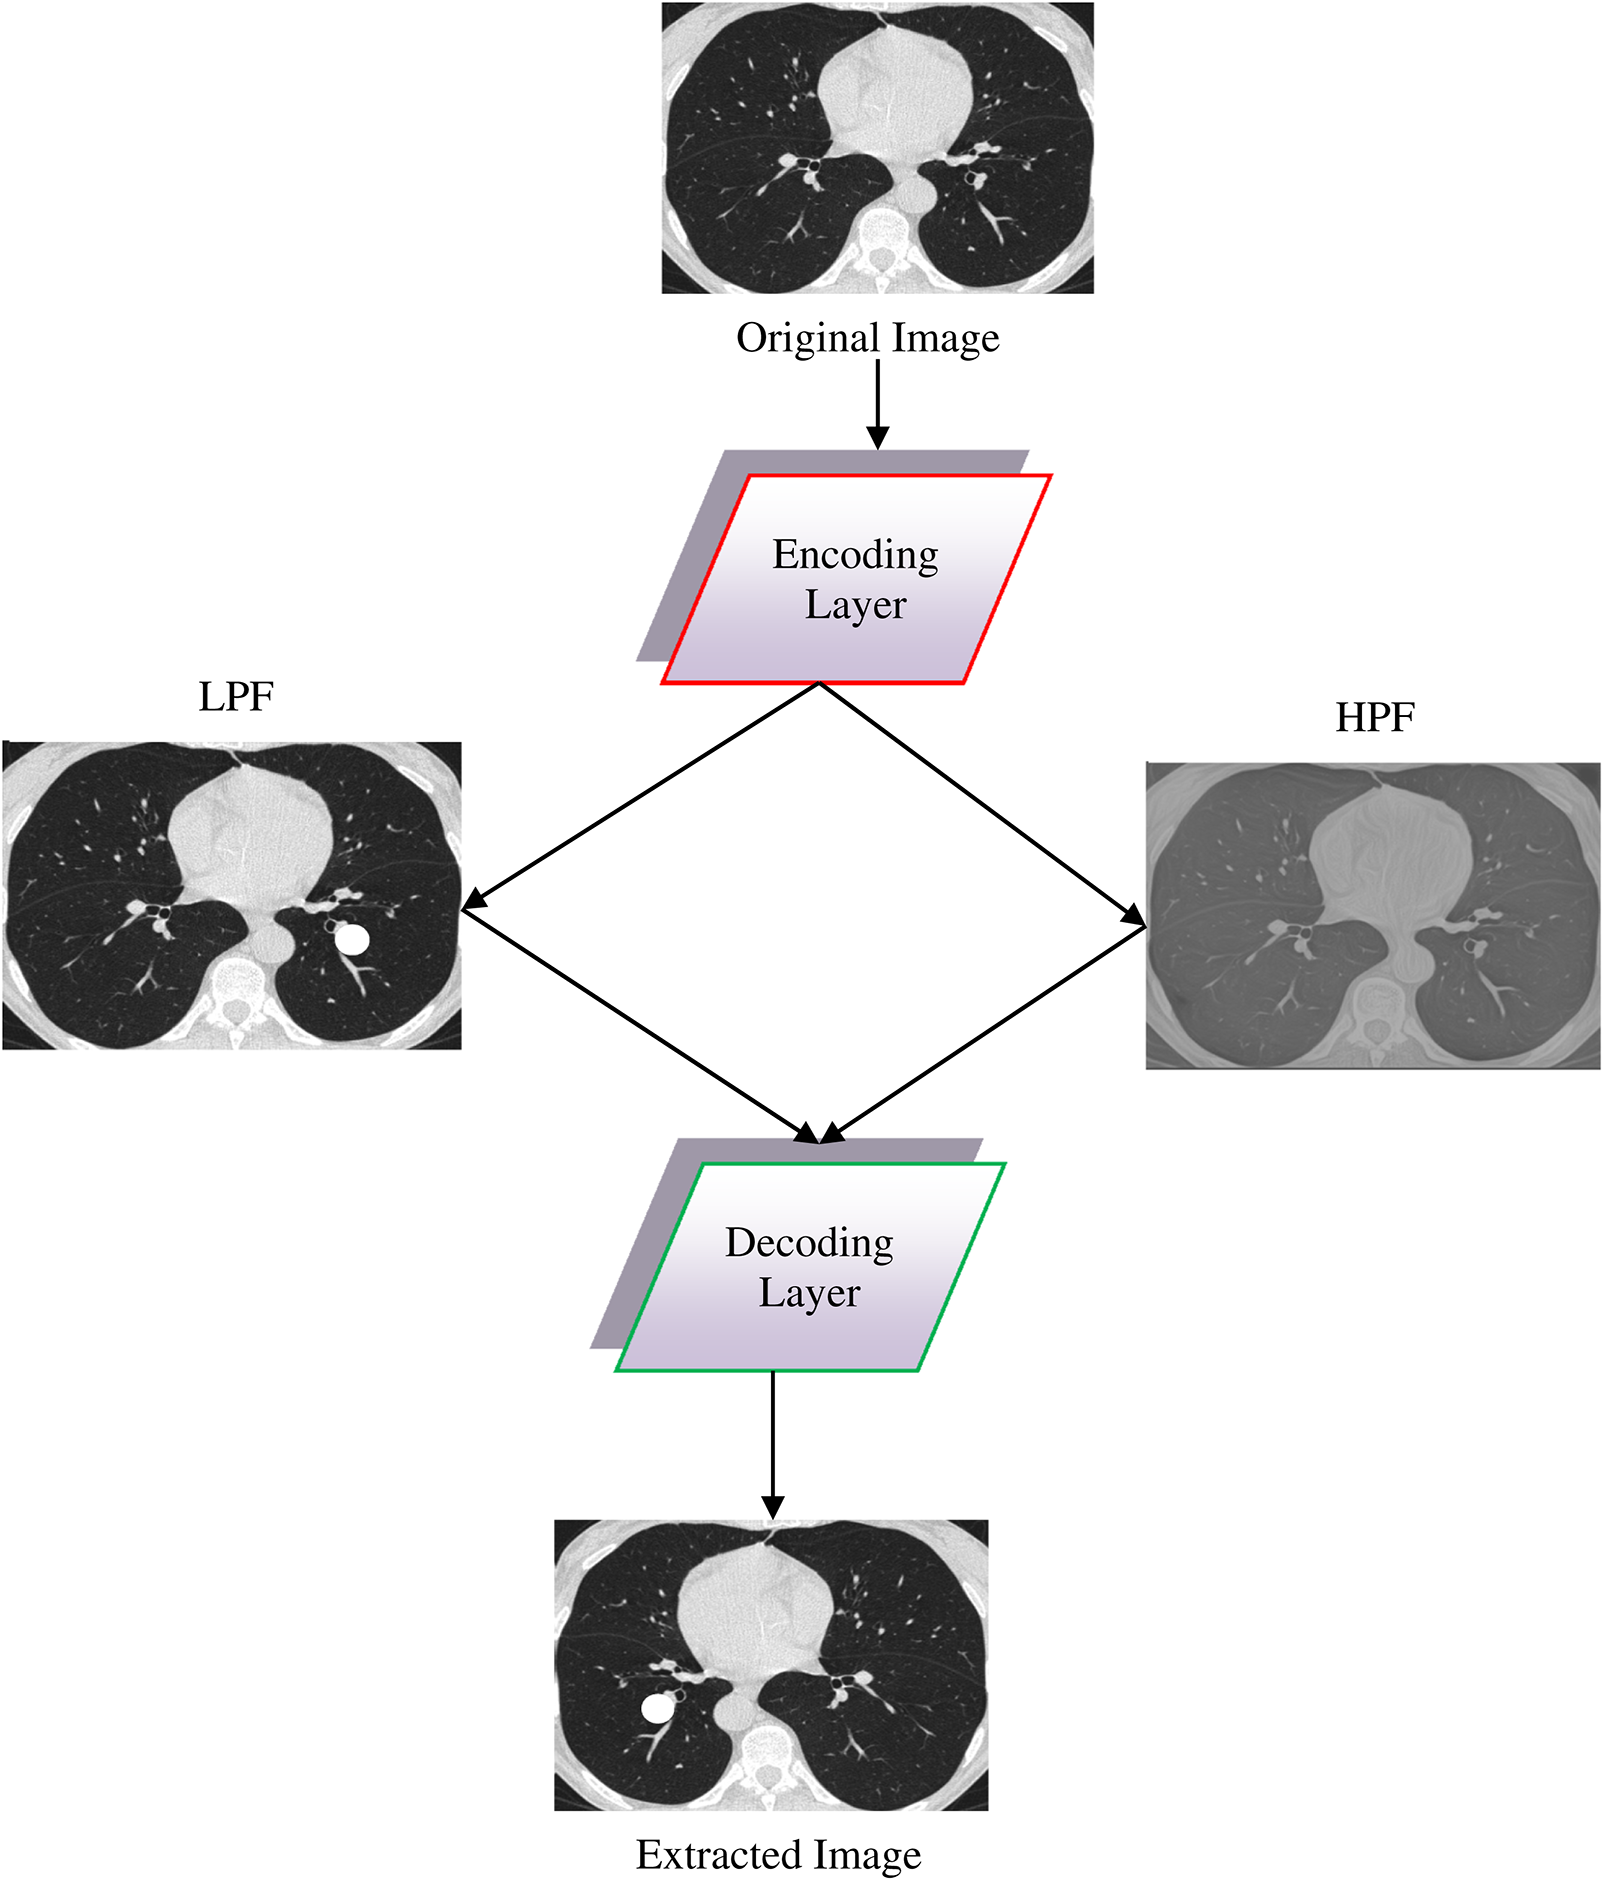
Figure 3: Design for a single-layer DWAE
Image segmentation is the process of classifying or dividing image pixels into various groupings or areas based on the pixels’ characteristics. Based on some resemblance, each pixel in the image is assigned to one of the areas. Pixels in one zone have virtually identical pixel values, whereas pixels in the adjacent region have varying pixel values. Fig. 4 depicts the pixels with almost similar pixel values clustered in one section and pixels with varied pixel values organized in other parts. Threshold segmentation is used in the proposed strategy.
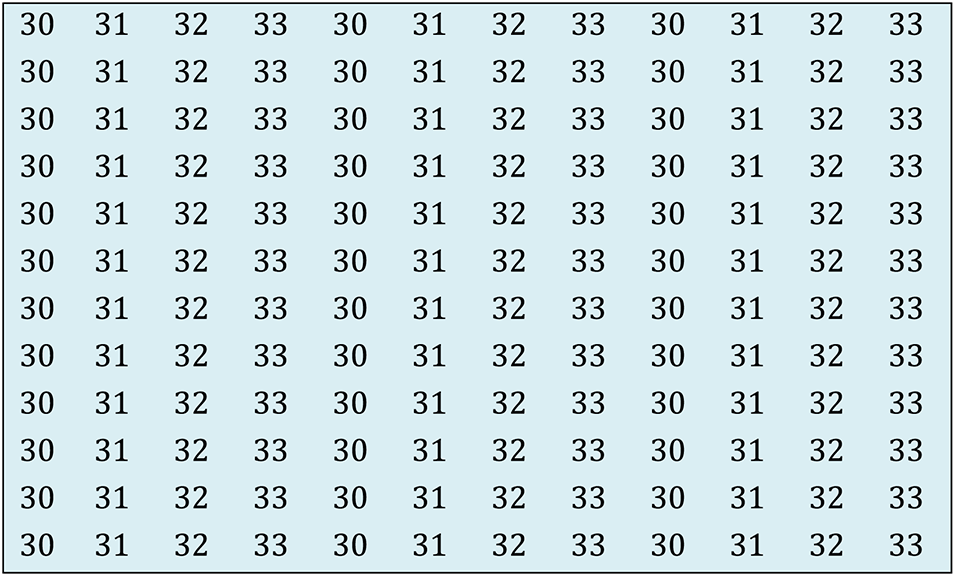
Figure 4: Segmentation illustration
Pixels are assigned to regions in threshold segmentation depending on the threshold value ‘T’. If the ith pixel of picture ‘X’ has a value greater than a specified threshold. The algorithm places specific pixels (depending on this threshold value) in a specified one. For example, in MRI picture X, the binary pixels and the pixels with values higher than the threshold T are kept in the brighter area, while the remaining pixels are preserved in the blacker region. Eq. (1) represents the region ‘R’ with the combined representation of both segments.
where ‘I’ represents the image pixel, ‘N’ denotes the number of pixels, and ‘T’ represents the threshold value. An anisotropic filter is employed before threshold segmentation in the proposed approach. This boosts the image clarity and improves the image’s textural quality. Color, transparency, and reflectivity are the texture properties that give an object on the screen a realistic appearance. Fig. 5 shows how an anisotropic filter was applied to a skull-stripped picture, which was then succeeded by threshold segmentation and morphological processes. Finally, the bounding box highlights the split area.
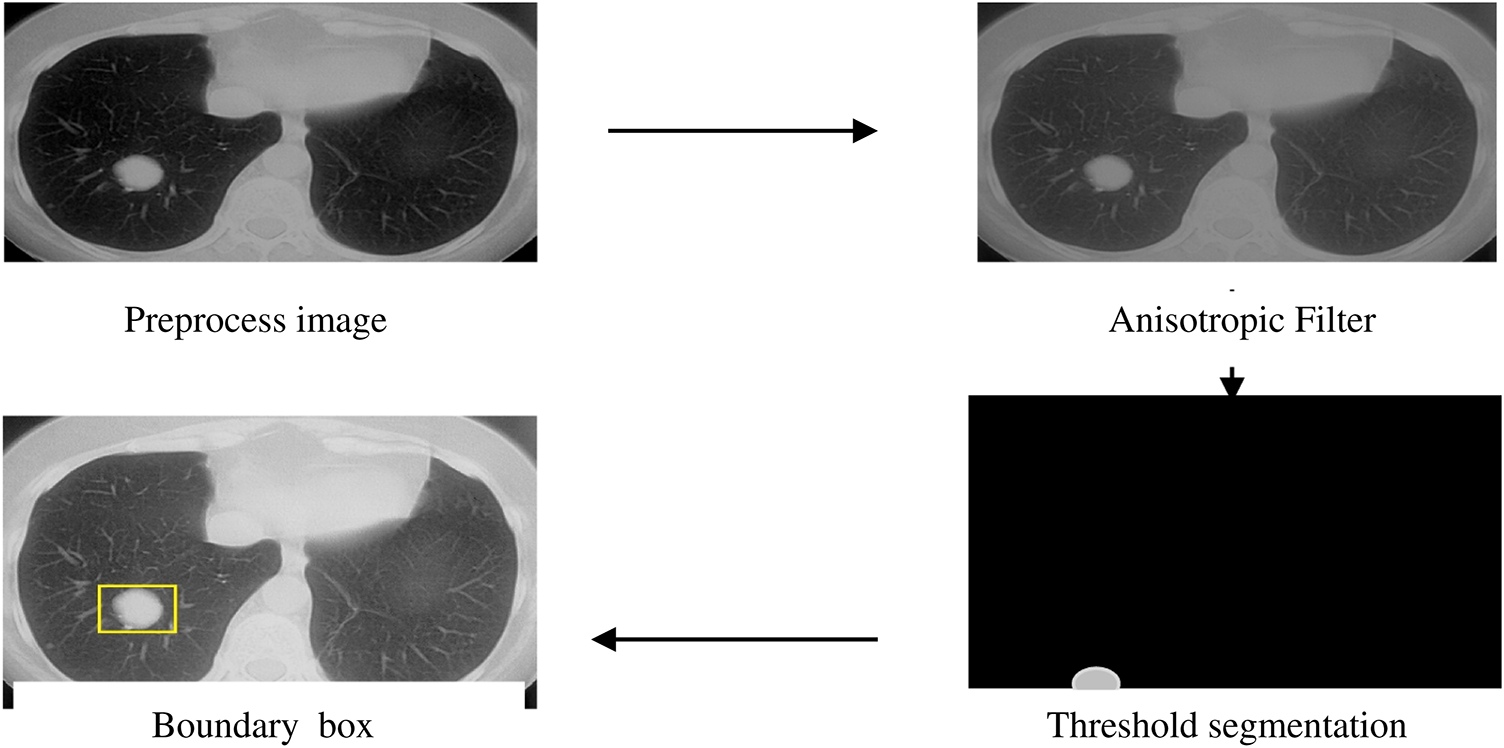
Figure 5: Threshold segmentation
One of the most challenging classification difficulties is categorizing the data to aid in predictions and generating results. A K-Fold Cross validation approach helps divide the datasets into testing and training sets (with ‘K’ representing the number of groups in a data sample). Cross-validation builds prediction models using testing and training datasets. Support Vector Machine (SVM) was made up of interconnected supervised learning algorithms that are often used for regression and classification. ‘SVM’ can minimize empirical classification error while increasing the geometric margin, which is considered one of its distinguishing features. This is regarded as one of the specific qualities, Structural Risk Minimization (SRM). SVM maps the input vector to a higher-dimensional space where the maximum separating hyperplane is constructed. The data is divided into two parallel hyperplanes, one on either side of the hyperplane. The separating hyperplanes increase the distance across the two parallel hyperplanes. The vector ‘W’ runs in a transverse direction to the hyperplane that separates the two points. The margin is expected to rise if the offset parameter ‘b’ is included. Without this offset parameter, the hyperplane is compelled to go past the origin, making finding a solution more difficult.
A comparison of the accuracy of various segmented image techniques in the real world is shown in Fig. 6. According to the results, the threshold has better accuracy. The similarity between individual pixels in an image is used as a basis for the production of distinct segmented regions, which draws attention to relatively small areas. To achieve a higher level of precision, several morphological techniques may cut off a portion of the image without completely obliterating it. The categorization accuracy and ground truth image comparison yield higher values of more than 95%, as shown in Fig. 6.
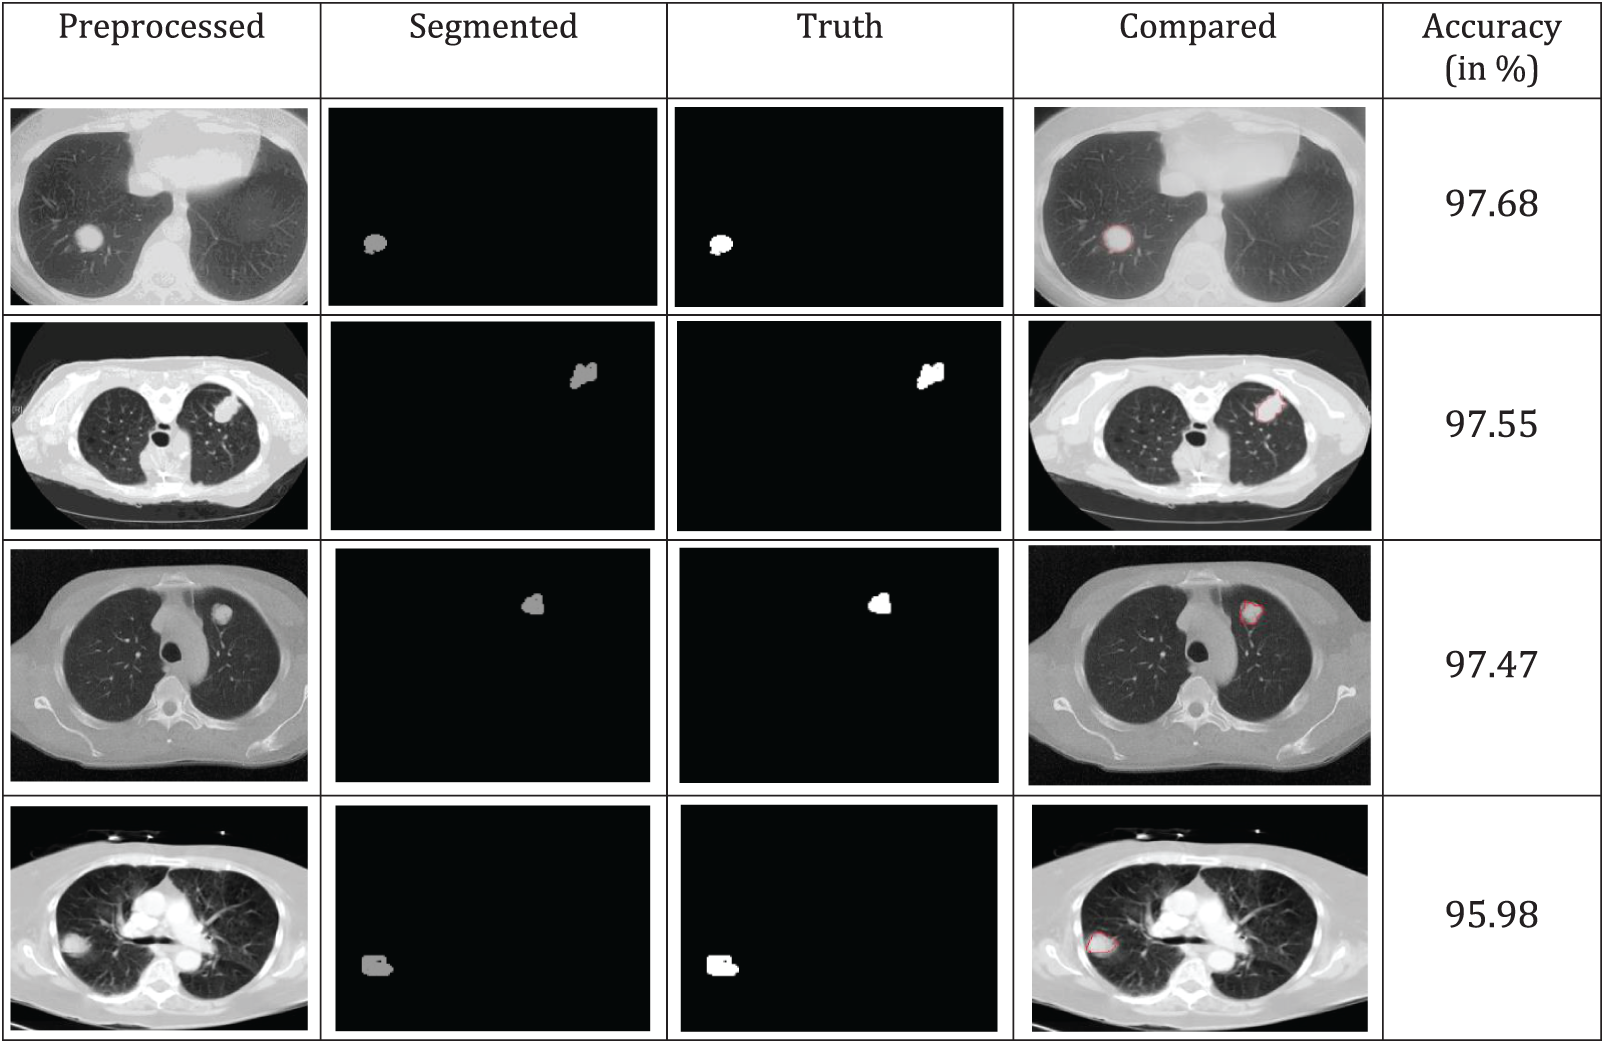
Figure 6: Segmentation and truth image comparison
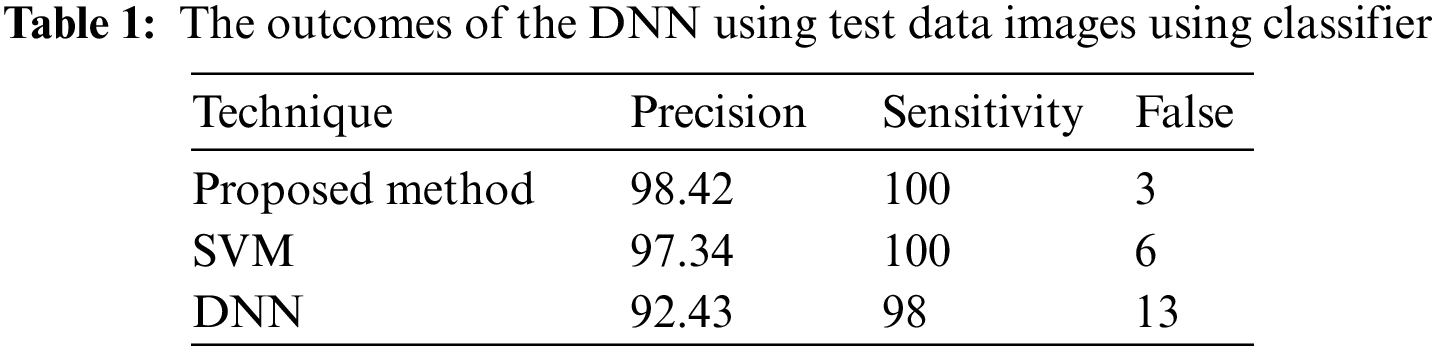
In a few situations, specific patches of fat in the images are misidentified as tumors, or the cancers are not visible to the physician, who depends entirely on the physician’s ability. The DWAE-DNN was utilized in this work to identify cancers in lung scans. These margins were clipped to avoid image noise. Implementing and combining image feature extraction using the DWAE-DNN is done to boost the network’s accuracy. With an accuracy of 98.67%, DWAE-DNN correctly categorized the images as either a patient diagnosed with a tumor or otherwise. Clustering, a method for feature extraction, is combined with DWAE-DNN and is used to improve network performance in such situations. This decision was made based on the results that DWAE-DNN obtained from the first images. To determine whether or not the proposed strategy is beneficial, several other classifiers included within the DWAE-DNN architecture were put to use. In addition, the function of the classifier was validated by using the criteria of accuracy, precision, specificity, and sensitivity. Using the information shown in Table 1, the DT classifier used to assign categories to images had a DNN accuracy of 98.67%. When using the RBF classifier, the DNN has an accuracy of 97.34%, while the DT classifier has an accuracy of 94.24%. The results from the test showed that the strategy that was advised increased accuracy to 99.12%.
According to the findings of the inquiry, out of a maximum of 226 images used as test data, there were a total of three images that were misread and classified wrongly. This can be shown in Fig. 7. Table 2 displays the findings obtained from DWAE-DNN analysis by applying the proposed approach to the dataset. These findings may be seen by clicking here. In contrast to the conventional DNN, the newly presented method achieved an accuracy of 99.12% based on the test data, representing a significant improvement over the older approach. The images were tested with the dataset images as discussed earlier, and the standard DWAE-DNN proposed approach is used to classify after adopting the proposed technique. Fig. 8 presents the network accuracy process with the tested images.
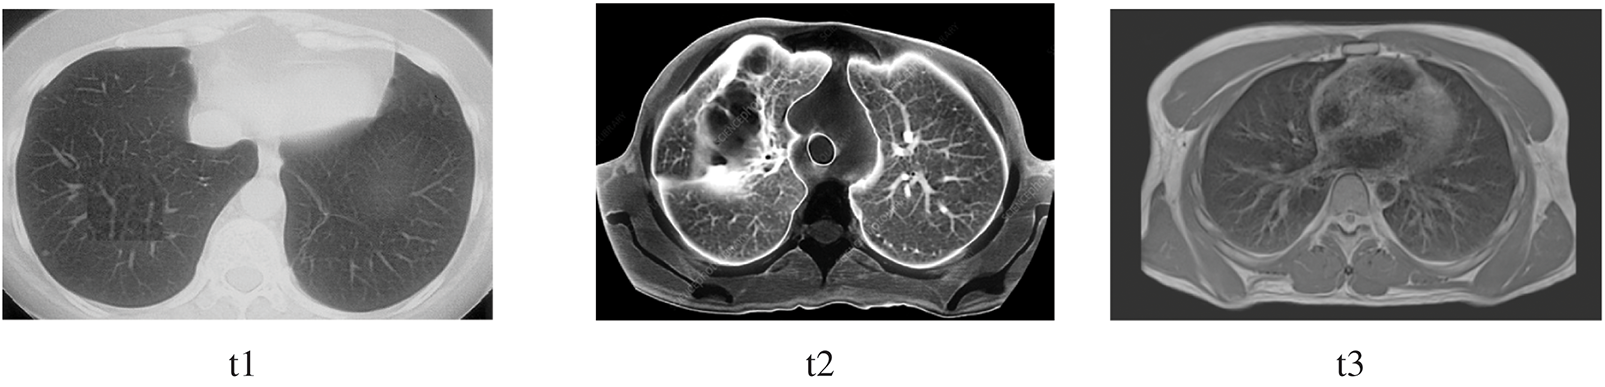
Figure 7: Images by the DWAE-DNN for error classified
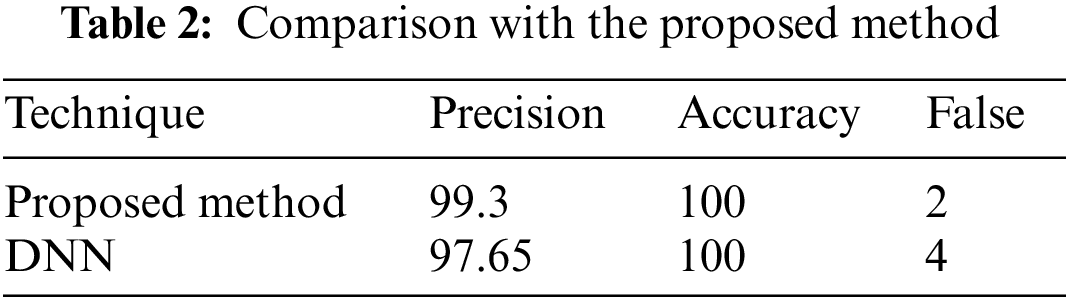
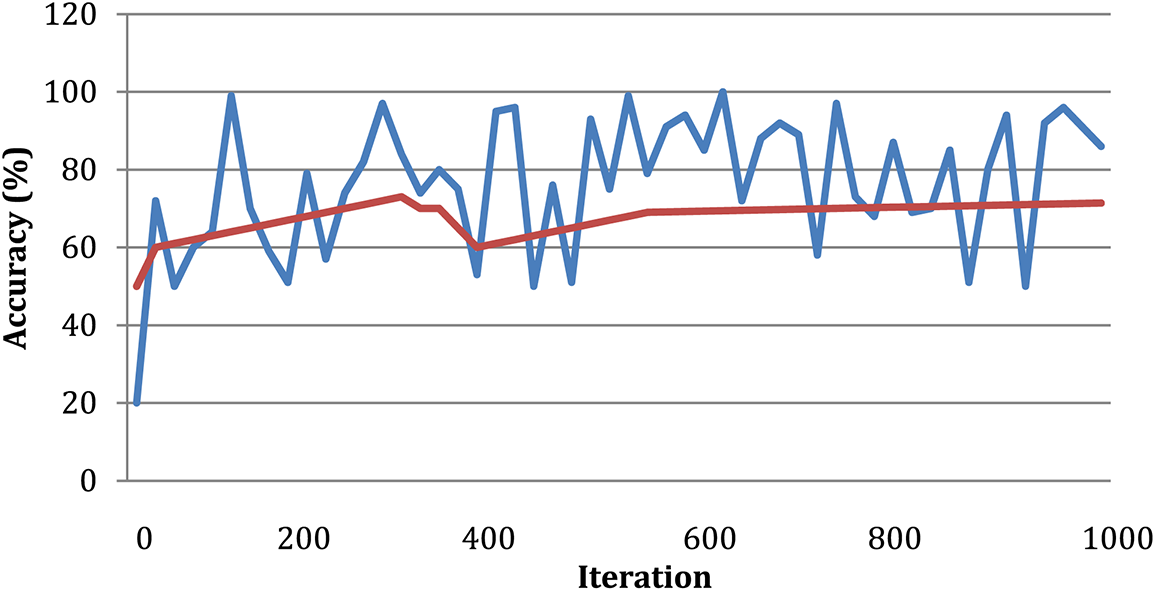
Figure 8: Network accuracy process
The convolution neural network is used in this study to accomplish effective automated lung cancer identification [33–35]. The Python programming language is used for simulation. After computing the precision, it is compared to all the other cutting-edge methods currently used. This method classifies lung cancers using the SVM technique. Utilizing the features extracted through the SVM, classification accuracy is computed based on the components extracted. SVM-based cancer and non-tumor identification process are time-consuming and imprecise. Hence, an alternative DWAE-DNN-based classification is proposed that does not need any distinct phases for feature extraction. Fig. 9 depicts the variety of cancer and non-neoplastic lung image. As a direct consequence, both the complexity and the amount of time spent computing are reduced while the accuracy increases. Fig. 10 presents the accuracy of lung cancer categorization output. The conclusion of the classification is either cancer lung or non-tumor lung, which is determined by the value of the probability score. The probability score associated with a standard lung image is the lowest possible score. Compared to normal lungs, cancer lung has the highest probability score value compared to normal lung.
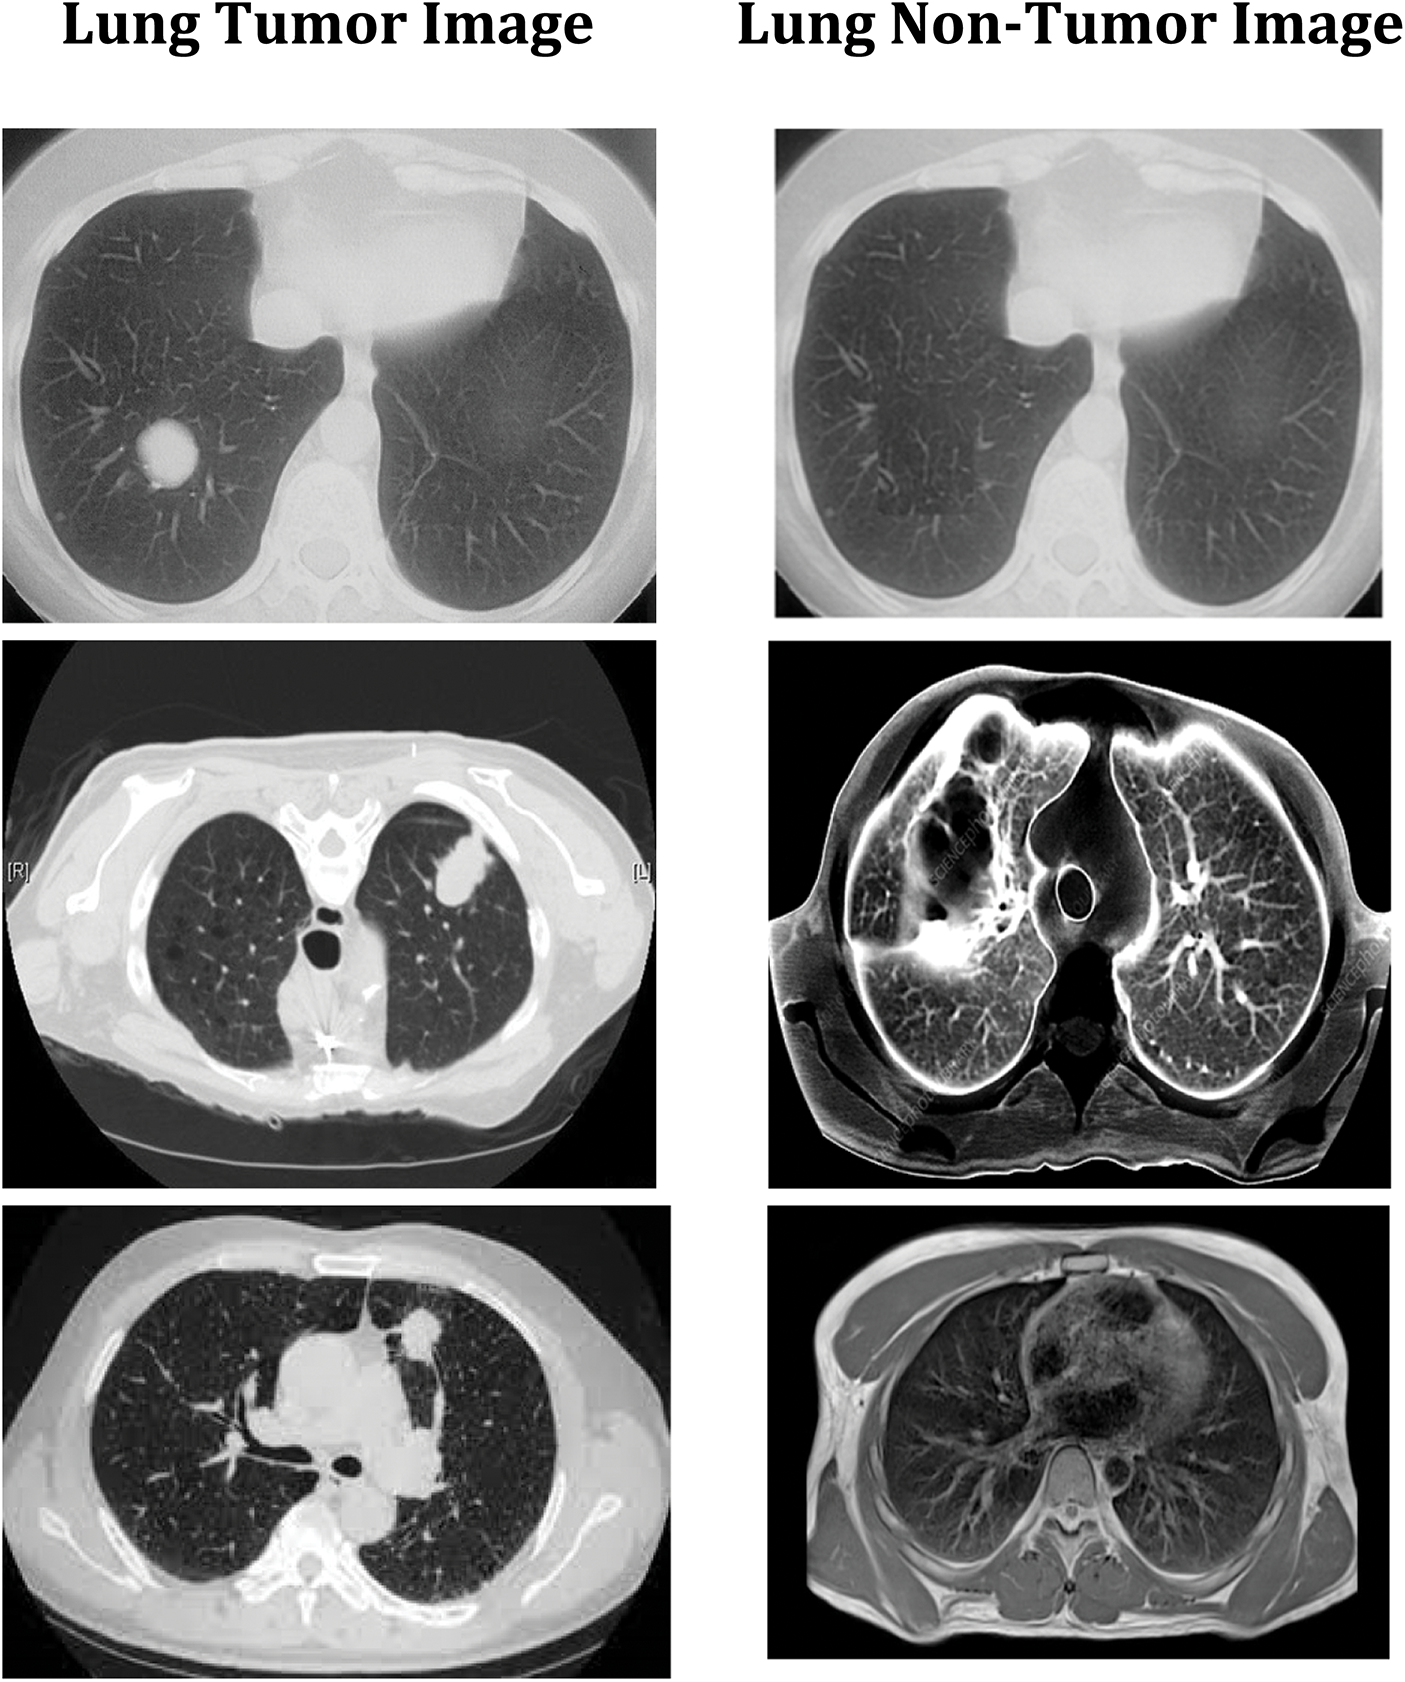
Figure 9: DWAE-DNN classified observations
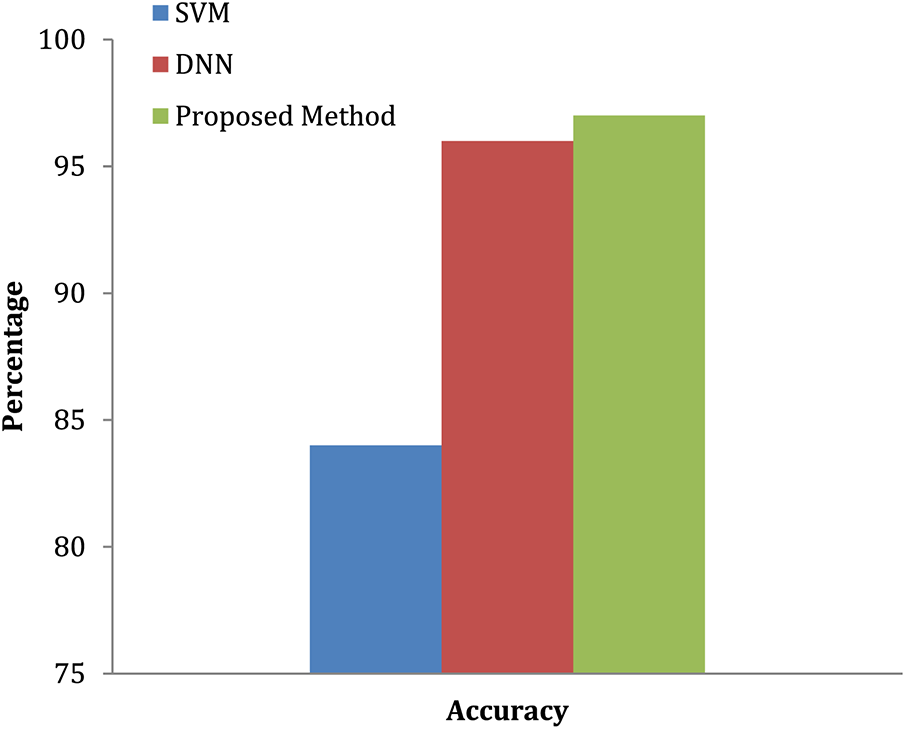
Figure 10: Accuracy of lung tumor classification
ML algorithms are validated using various tests, such as regression, distribution, and re-sampling techniques, such as cross-validation and K-fold. For the experimental study, mean skill scores are derived using these approaches and compared with other outcomes. The validation process is accomplished via statistical significance tests, guaranteeing that skill scores are obtained from the same distribution. Statistical tests are classified into two types parametric and non-parametric tests. If the model is selected correctly, parametric testing might benefit greatly. Simultaneously, non-parametric approaches are most often used to assess machine learning algorithms. Identifying the underlying distribution based on the data that is provided without taking into consideration the structure of the distributions is what is involved in non-parametric testing. These tests consider a few assumptions that were frequently referred to as distribution-free tests.
A 6-month observation period is usually recommended to detect illness signs. These illness symptoms are graded on a 6-point scale as severely impacted, partially impacted, unaffected, partly improved, substantially better, and entirely improved. This study has around 200 patients randomly assigned to an experimental therapy for observation. The final findings are shown in Fig. 11 in the form of distributions based on the statistically significant test results. This graph shows that the number of patients who are considerably worse off has increased while the number of patients who are significantly worse off has decreased shown in Table 3. However, there is minimal difference between partly and improved individuals.
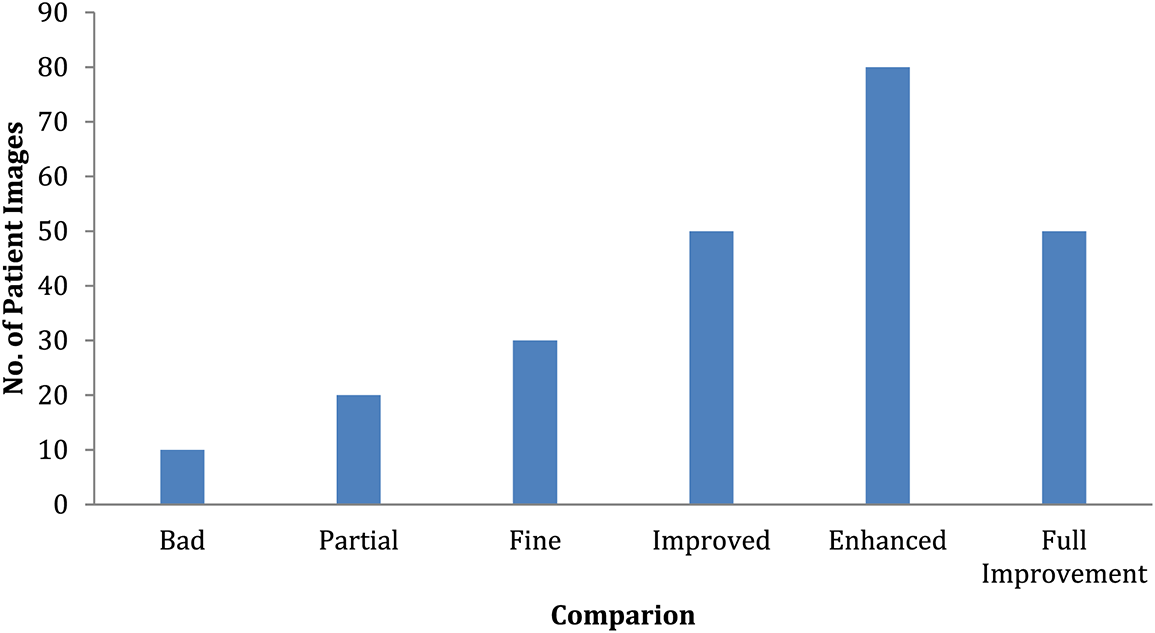
Figure 11: Comparison of patient severity
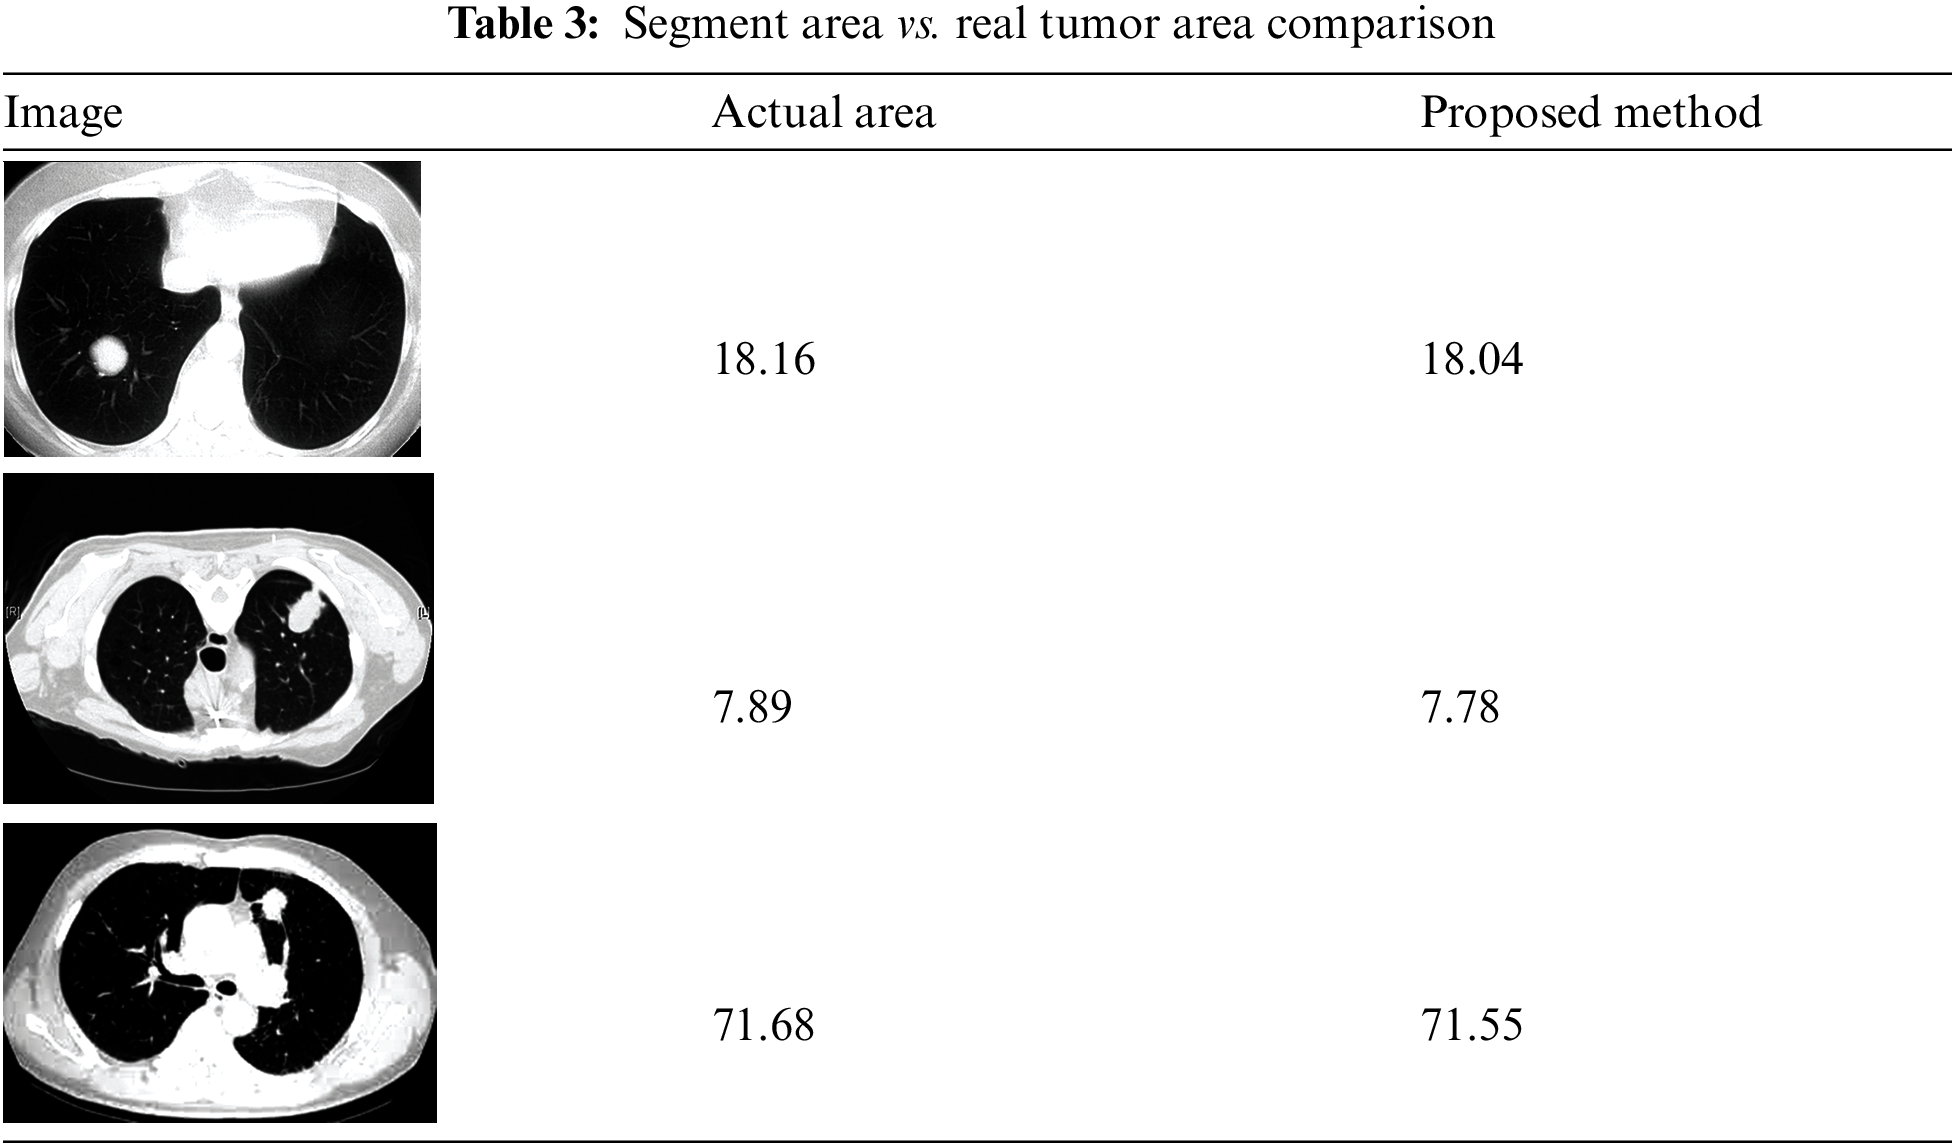
The image has several qualities: intensity, contrast, noise, and darkness. The mathematical illustrations are applied to derive the mean, standard deviation, entropy, skewness, and kurtosis. The precise range for these statistical parameters can sometimes be determined. Nevertheless, for the sake of coherence, there should be significant variation among the numbers, as seen in Table 3. Except for a few factors, all of the properties are consistent across all three images. Controlling darkness may increase contrast, but this cannot overcome certain limitations.
Consequently, certain anomalies occur in the preprocessing stage but can be resolved after segmentation. The correctness of the ground truth is the primary focus since it reveals the segmentation’s precision, homogeneity, and segmented area. The first indication that the segmentation result was excellent is that the homogeneity was more than 90%, as was the ground truth accuracy. Consequently, threshold segmentation achieves higher categorization, uniformity, and accuracy relative to the ground truth.
From the study, image classification is done and categorized into two groups related to the patient-to-healthy subject ratio. After preprocessing, images were fed into the DNN. Other classifiers, like the RBF classifier and decision trees classifier, have been used in the DNN framework to examine its performance. The work also assessed the network performance using accuracy, sensitivity, specificity, and precision. According to categorizer statistics, the DT classification performs most in the DWAE-DNN. The proposed approach (DWAE-DNN) is found to classify the images with an accuracy of 98.67%, either as malignant or normal patients. The results were tested from image data consisting of 226 images altogether. Using the recommended feature extraction approach and applying it to the DWAE-DNN, recommended method’s accuracy is further increased to 99.12%, outperforming the standard DWAE-DNN. The accuracy of the doctors’ aid in diagnosing cancer, including treating the patient, increased the recommended method’s high medical accuracy because of the relevance of the physician’s diagnosis.
Funding Statement: This work was funded by the Researchers Supporting Project Number (RSP2023R509) King Saud University, Riyadh, Saudi Arabia. This work was supported in part by the Higher Education Sprout Project from the Ministry of Education (MOE) and National Science and Technology Council, Taiwan, (109-2628-E-224-001-MY3), and in part by Isuzu Optics Corporation. Dr. Shih-Yu Chen is the corresponding author.
Conflicts of Interest: The authors declare that they have no conflicts of interest to report regarding the present study.
References
1. A. Alsirhani, M. Ezz, G. Paliwal and U. Kurmi, “A comprehensive analysis of identifying lung cancer via different machine learning approach,” in Proc. Smart, Moradabad, India, pp. 691–696, 2021. [Google Scholar]
2. H. A. Lee, L. R. Chao and C. Y. Hsu, “A 10-year probability deep neural network prediction model for lung cancer,” Cancers, vol. 13, no. 4, pp. 1–15, 2021. [Google Scholar]
3. P. Surendar, “Diagnosis of lung cancer using a hybrid deep neural network with adaptive sine cosine crow search algorithm,” Computational Science, vol. 53, Article ID. 101374, 2021. [Google Scholar]
4. Z. H. Zhou, Y. Jiang, Y. B. Yang and S. F. Chen, “Lung cancer cell identification based on artificial neural network ensembles,” Artificial Intelligence in Medicine, vol. 24, no. 1, pp. 25–36, 2002. [Google Scholar] [PubMed]
5. A. M. Rahmani, E. Yousefpoor, M. S. Yousefpoor, Z. Mehmood, A. Haider et al., “Machine learning (ML) in medicine: Review, applications, and challenges,” Mathematics, vol. 9, no. 22, Article ID. 2970, 2021. [Google Scholar]
6. M. H. Nadimi-Shahraki, S. Taghian, S. Mirjalili, H. Zamani and A. Bahreininejad, “GGWO: Gaze cues learning-based grey wolf optimizer and its applications for solving engineering problems,” Computational Science, vol. 61, Article ID. 101636, 2022. [Google Scholar]
7. S. Dodia, B. Annappa and P. A. Mahesh, “Recent advancements in deep learning-based lung cancer detection: A systematic review,” Engineering Applications of Artificial Intelligence, vol. 116, no. 1, Article ID. 105490, 2022. [Google Scholar]
8. E. Bębas, K. Borowska, M. Derlatka, E. Oczeretko, M. Hładuński et al., “Machine-learning-based classification of the histological subtype of non-small-cell lung cancer using MRI texture analysis,” Biomedical Signal Processing and Control, vol. 66, Article ID. 102446, 2021. [Google Scholar]
9. M. A. Awadallah, M. A. Al-Betar, I. A. Doush, S. N. Makhadmeh, Z. A. Alyasseri et al., “CCSA: Cellular crow search algorithm with topological neighborhood shapes for optimization,” Expert Systems with Applications, vol. 194, no. 8, Article ID. 116431, 2022. [Google Scholar]
10. C. Zhao, J. Han, Y. Jia and F. Gou, “Lung nodule detection via 3D U-Net and contextual convolutional neural network,” in Proc. NaNa, Xi’an, China, pp. 356–361, 2018. [Google Scholar]
11. H. Xue, “A quasi-reflection-based SC-PSO for ship path planning with grounding avoidance,” Ocean Engineering, vol. 247, no. 1, Article ID. 10772, 2022. [Google Scholar]
12. M. Anand, N. Balaji, N. Bharathiraja and A. Antonidoss, “A controlled framework for reliable multicast routing protocol in mobile ad hoc network,” in Proc. Materials Today, Ramanathapuram, India, pp. 1–6, 2021. [Google Scholar]
13. A. Bhattacharjee, R. Murugan and T. Goel, “A hybrid approach for lung cancer diagnosis using optimized random forest classification and K-means visualization algorithm,” Health and Technology, vol. 7, no. 4, Article ID. 787–800, 2022. [Google Scholar]
14. T. Li, Y. Liu and Z. Chen, “Application of sine cosine egret swarm optimization algorithm in gas turbine cooling system,” Systems, vol. 10, no. 6, Article ID. 201, 2022. [Google Scholar]
15. D. M. Ibrahim, N. M. Elshennawy and A. M. Sarhan, “Deep-chest: Multi-classification deep learning model for diagnosing COVID-19, pneumonia, and lung cancer chest diseases,” Computers in Biology and Medicine, vol. 132, no. 2, Article ID. 104348, 2021. [Google Scholar] [PubMed]
16. C. Cheng and H. Huang, “Evaluation and analysis of regional economic growth factors in digital economy based on the deep neural network,” Mathematical Problems in Engineering, vol. 2022, Article ID. 1121886, 2022. [Google Scholar]
17. N. V. Kumaran and D. M. D. Preethi, “Impact of chronic lung disease using deep learning: A survey,” in Proc. Int. Conf. on Computer, Communication, and Signal Processing, Chennai, India, Springer, pp. 46–59, 2022. [Google Scholar]
18. A. Umamageswari, N. Bharathiraja and D. Shiny Irene, “A novel fuzzy C-means based chameleon swarm algorithm for segmentation and progressive neural architecture search for plant disease classification,” ICT Express, vol. 9, no. 2, pp. 160–167, 2021. [Google Scholar]
19. X. Wang, I. Ahmad, D. Javeed, S. Zaidi, S. F. Alotaibi et al., “Intelligent hybrid deep learning model for breast cancer detection,” Electronics, vol. 11, no. 17, Article ID. 2767, 2022. [Google Scholar]
20. M. Liu, J. Dong, X. Dong, H. Yu and L. Qi, “Segmentation of lung nodule in CT images based on mask R-CNN,” in Proc. iCAST, Fukuoka, Japan, pp. 1–6, 2018. [Google Scholar]
21. Z. Guo, L. Xu, Y. Si and N. Razmjooy, “Novel computer-aided lung cancer detection based on convolutional neural network-based and feature-based classifiers using metaheuristics,” Imaging Systems and Technology, vol. 31, no. 4, pp. 1954–1969, 2021. [Google Scholar]
22. D. Z. Karim and T. A. Bushra, “Detecting lung cancer from histopathological images using convolution neural network,” in Proc. TENCON 2021, Auckland, New Zealand, pp. 626–631, 2021. [Google Scholar]
23. S. B. Rathod and L. Ragha, “Analysis of CT scan lung cancer images using machine learning algorithms,” in Proc. ICICCS, Madurai, India, pp. 1273–1279, 2022. [Google Scholar]
24. M. Gasmi, M. Derdour and A. Gahmous, “Transfer learning for the classification of small-cell and non-small-cell lung cancer,” in Proc. ISPR, Jaipur, India, pp. 341–348, 2022. [Google Scholar]
25. A. S. Oliver, T. Jayasankar, K. R. Sekar, T. K. Devi, R. Shalini et al., “Early detection of lung carcinoma using machine learning,” Intelligent Automation & Soft Computing, vol. 30, no. 3, pp. 755–770, 2021. [Google Scholar]
26. I. Naseer, T. Masood, S. Akram, A. Jaffar, M. Rashid et al., “Lung cancer detection using modified alexNet architecture and support vector machine,” Computers, Materials & Continua, vol. 7, no. 1, pp. 2039–2054, 2023. [Google Scholar]
27. Y. Gao, J. Hu, H. Yu, J. Du and C. Jia, “Variance-constrained resilient H∞ state estimation for time-varrying neural networks with random saturation observation under uncertain occurrence probability,” Neural Processing Letters, vol. 33, no. 24, pp. 16881, 2023. [Google Scholar]
28. M. Ramprasath, M. V. Anand and S. Hariharan, “Image classification using convolutional neural networks,” International Journal of Pure and Applied Mathematics, vol. 119, no. 17, pp. 1307–1319, 2018. [Google Scholar]
29. D. N. Raju, S. Hariharan and B. Sasikumar, “Fuzzy segmentation and black widow-based optimal SVM for skin disease classification,” Medical & Biological Engineering & Computing, vol. 59, no. 10, pp. 2019–2035, 2021. [Google Scholar]
30. H. Garg, B. Sharma, S. Shekhar and R. Agarwal, “Spoofing detection system for E-health digital twin using efficient net convolution neural network,” Multimedia Tools and Applications, vol. 81, no. 19, pp. 26873–26888, 2022. [Google Scholar]
31. K. Bhalla, D. Koundal, B. Sharma, Y. C. Hu and Y. A. Zaguia, “A fuzzy convolutional neural network for enhancing multi-focus image fusion,” Journal of Visual Communication and Image Representation, vol. 84, no. 1, Article ID. 103485, 2022. [Google Scholar]
32. H. Shao, H. Jiang, L. Xingqiu and W. Shuaipeng, “Intelligent fault diagnosis of rolling bearing using deep wavelet auto-encoder with extreme learning machine,” Knowledge-Based Systems, vol. 140, no. 15, pp. 1–14, 2018. [Google Scholar]
33. J. Wang, Y. Zou and S. J. Lim, “An improved time feedforward connections recurrent neural networks,” Intelligent Automation & Soft Computing, vol. 36, no. 3, pp. 2743–2755, 2023. [Google Scholar]
34. J. Wang, Y. Wu, S. He, P. Sharma, X. Yu et al., “Lightweight single image super-resolution convolution neural network in portable device,” KSII Transactions on Internet and Information Systems, vol. 15, no. 11, pp. 4065–4083, 2021. [Google Scholar]
35. J. Wang, Y. Zou, L. Peng, L. Wang, O. Alfarraj et al., “Research on crack opening prediction of concrete dam based on recurrent neural network,” Journal of Internet Technology, vol. 21, no. 4, pp. 1161–1170, 2020. [Google Scholar]
Cite This Article
 Copyright © 2023 The Author(s). Published by Tech Science Press.
This work is licensed under a Creative Commons Attribution 4.0 International License , which permits unrestricted use, distribution, and reproduction in any medium, provided the original work is properly cited.
 Downloads
 Citation Tools