
 Submit a Paper
 Propose a Special lssue
 Open Access
ARTICLE

Vessels Segmentation in Angiograms Using Convolutional Neural Network: A Deep Learning Based Approach
1 School of Computer Science and Engineering, Vellore Institute of Technology, Vellore, 632014, India
2 Department of Computer Science and Information Engineering, Asia University, Taichung, 41354, Taiwan
3 Department of Medical Research, China Medical University Hospital, China Medical University, Taichung, 406, Taiwan
4 Guangdong-Hong Kong-Macao Joint Laboratory for Intelligent Micro-Nano Optoelectronic Technology, School of Mathematics and Big Data, Foshan University, Foshan, 528000, China
5 Medica Superspecialty Hospital, Kolkata, 700099, India
6 Automation and Applied Informatics, Aurel Vlaicu University of Arad, Arad, 310130, Romania
* Corresponding Author: Ching-Hsien Hsu. Email:
(This article belongs to the Special Issue: Bio-inspired Computer Modelling: Theories and Applications in Engineering and Sciences)
Computer Modeling in Engineering & Sciences 2023, 136(1), 241-255. https://doi.org/10.32604/cmes.2023.019644
Received 05 October 2021; Accepted 23 August 2022; Issue published 05 January 2023
 View Full Text
 Download PDF
Abstract
Coronary artery disease (CAD) has become a significant cause of heart attack, especially among those 40 years old or younger. There is a need to develop new technologies and methods to deal with this disease. Many researchers have proposed image processing-based solutions for CAD diagnosis, but achieving highly accurate results for angiogram segmentation is still a challenge. Several different types of angiograms are adopted for CAD diagnosis. This paper proposes an approach for image segmentation using Convolution Neural Networks (CNN) for diagnosing coronary artery disease to achieve state-of-the-art results. We have collected the 2D X-ray images from the hospital, and the proposed model has been applied to them. Image augmentation has been performed in this research as it’s the most significant task required to be initiated to increase the dataset’s size. Also, the images have been enhanced using noise removal techniques before being fed to the CNN model for segmentation to achieve high accuracy. As the output, different settings of the network architecture undoubtedly have achieved different accuracy, among which the highest accuracy of the model is 97.61%. Compared with the other models, these results have proven to be superior to this proposed method in achieving state-of-the-art results.Keywords
Coronary artery disease (CAD) is the most common type of heart disease and is the leading cause of death worldwide [1]. Also known as atherosclerotic heart disease or ischemic heart disease (IHD), CAD develops when the major blood vessels get luminal narrowing due to some fat deposition or build-up of plaque [2,3], resulting in restricted blood flow [4], leading to chest pain or even a heart attack. The treatment requires medical diagnosis, often including lab tests or computer-aided diagnosis imaging like coronary angiograph. An angiogram of the heart, also known as the coronary angiogram, is used to evaluate CAD. Coronary angiography is considered as one of the popular diagnostic procedures for treating coronary artery disease. During coronary angiography, a liquid dye is injected through a thin, flexible tube known as a catheter [5,6]. The dye makes the blood flowing inside the blood vessels visible on the X-ray, which is used to analyse the narrowed or blocked area in the blood vessel. X-ray angiography is one of the standard procedures that is adopted as a diagnostic measure for CAD disease. In other words, angiogram or arteriogram refers to the X-ray test employing dye to exhibit the arteries. As an X-ray cannot make the arteries visible, the dye or contrast material is used for the same by inserting a long and thin hallow tube known as a catheter into an artery. Accurately segmenting vessel regions from the background is a tough task. The images that are to be incorporated may have low brightness. Moreover, due to several reasons, the arteries may be mixed with tissues, noise, etc., thereby making the task of segmentation arduous. Now, as every year around 3 million people die due to heart attacks, among which about 40% of deaths that occur due to heart attacks are below the age of 55, need for an expert model for the detection of blockage in a short span of time has become the need of time. Hence such a situation has motivated us to propose an efficient model, based on deep learning to segment the blockage portion in the coronary arteries of the heart. Several different types of angiograms are been adopted for diagnoses such as Coronary angiogram, Computed tomography angiography, Magnetic resonance angiography, Pulmonary angiogram, Radionuclide angiogram, Renal angiogram, and Digital subtraction angiography. However, to achieve a proper CAD diagnosis, image processing techniques such as image segmentation [7] have been adopted sometimes for the segmentation of the blood vessels. Though different methodologies have been incorporated by researchers [8–13] to segment the vessels in the past, achieving satisfactory results and high accuracy remained a major challenge.
In this paper, a methodology for detecting vessel regions in coronary angiogram images is proposed based on the deep convolution neural network (CNN) which is an image classification algorithm inspired by deep learning CNNs that are the subfield of deep learning and are used extensively in the recent times for medical image classification and segmentation [14,15]. It uses the deep feedforward artificial neural network (ANN). It takes input images and predicts the labels that are to be assigned. The outcome of CNNs usually is very satisfying in terms of accuracy as it uses the sparsity of connections and shares the parameters with the use of convolution and fully connected layers [16,17]. The data augmentation concept is utilized in the proposed methodology in order to construct the dataset from the angiogram images. We have initially 28 images which were not enough to train the model. So, in order to create a proper dataset, data augmentation is accomplished so that we can generate sufficient training images by applying different operations such as rotating the image, skewing, translation, darkening and brightening. This image augmentation also helps in avoiding the overfitting of the model. Different methodologies have been incorporated by researchers [17,18] in the past to segment the vessels, but achieving satisfactory results and high accuracy is still a major challenge. Coronary heart disease has made severe threats to human health in recent times. The Angiogram technique seems to be a high-standard procedure for evaluating the condition of the heart. However, due to overlaps between vessels in the angiogram, it becomes difficult to visualize the actual blockage or the crossing area of vessels. That says that extraction of vessels is challenging due to the noisy background, contrast variation between the arteries, overlapping shadows of the bones and other difficulties. Therefore, this paper aims to develop vessel segmentation techniques by proposing a convolutional neural network model powered by deep learning techniques.
The rest of the paper is organized in the following manner: Section 2 provides the related work including existing methodologies proposed by the researchers in the field of image classification and segmentation. Section 3 provides the proposed method. Section 4 describes the network architecture. Section 5 provides the result and analysis. Section 6 presents the discussion part and finally, Section 7 depicts the conclusion of the paper.
Despite the presence of numerous studies and proposed methodologies [19–21] related to the work done in this field, most of the work deals with the existing images that are available freely on the web. This proposed work has used images of an angiogram of patients from hospitals situated in Kolkata, West Bengal and collection of images accomplished after proper provisional formalities. To begin with, the most relevant work related to the paper was found in the Nasr-Esfahani et al. [22] paper that proposed a method to detect the vessels using the CNN approach. In this work, the angiogram images were enhanced with respect to their contrast followed by attaching a patch around each pixel then fed into a trained CNN to find whether the pixel belongs to the vessel region. The dice score projected was precisely 81.51 and the accuracy was found to be 97.93 after following all the steps of enhancement and segmentation that included contrast enhancement, feature extraction, edge detection and thresholding.
In [23], authors proposed a segmentation technique based on a Deep Neural Network (DNN) that has been trained on a large sample of pre-processed examples (up to 400 thousand) that included global contrast normalization, zero phase whitening followed by the augmentation using geometric transformations and gamma corrections. The work performed in the paper is based on three databases namely DRIVE (Digital Retinal Images for Vessel Extraction), STARE (Structured Analysis of the Retina) and CHASE. The work first considered only the patches that fitted entirely into the Fields of View (FOVs), ignoring the patches beyond the FOVs. The FOVs are nothing but patches present in the circular active area in the fundus images. With this assumption, this decision is cross-verified by taking all the pixels in the FOVs, but the results do not improve significantly. This work also has presented variants of the models that can give structured predictions for the simultaneous classification of multiple pixels. The accuracy obtained in this paper is found to be almost 97 percent [23]. Wong et al. [24] contradicted the point of taking a large sample of data to train the model. Their work proposed a strategy to build the medical image classifiers with the use of limited data and it builds the classifiers using the features from segmentation networks. Moreover, it suggested that the sizes of the constraint images and the model complexity can result in high computational costs and poor performance. This work has applied the model to a 3D three-class brain tumor classification that showed an accuracy of 82% for the 91 training and 191 testing data and when applied to the 2D nine-class cardiac semantic level classification, showed an accuracy of 86 percent that was achieved with the use of 108 training and 263 testing data. The main understanding of this research is that the work focused on making the machine learn simpler shapes and structural concepts first before solving the actual problem. Another segmentation approach using CNN approach was presented by Fu et al. [25] which was applied on histological images and fibrosis identification. As the manual thresholding approach is not suitable in today’s world due to unnecessary labor work and high sensitivity towards the inter and intra-image intensity variations, the authors proposed a method to evaluate an elegant CNN developed to segment the histological images, especially those having Masson’s trichrome stain. The dice similarity projected in this paper is 0.947 and it has outperformed the start of art CNNs on a dataset of cardiac histological images.
Also, some of the works failed to improve the accuracy without increasing the complexity and the computation time. Thus, the literature survey of the related works showed that there is a major need to provide a suitable methodology for image segmentation with the help of CNN that can address all these challenges and issues and outperform the other models [26]. So, in this paper, we propose a methodology that is applied to the angiogram images to produce high-quality segmented images.
2.1 Novelties and Contributions
The related works clearly state that several challenges need to be addressed. As described in the related work section, none of the results tried to use raw images of patients from hospitals; instead, they chose images mainly from the existing dataset on the web. However, in our work, we have considered authentic coronary angiogram images of patients from the hospitals around Kolkata, WestBengal, India, which helps in achieving the objective of this paper, i.e., segmentation of angiogram images using CNN with high accuracy, and experiments have been conducted with patients’ heart images that were taken from hospitals not from the existing archives on the web. Also, it is observed that many works considered the disintegration and reconstruction [27,28] of the images for training the model. In contrast, in our proposed model, the image augmentation is done as a whole, thus removing the requirement of performing the same. The proposed work focuses on applying filters to remove the noise. The main contributions of this work are as below:
1. Real images of angiograms from hospitals have been adopted.
2. Image augmentation has been accomplished and then filters are applied.
3. A deep learning model based on CNN has been proposed to avoid normal feature extraction requirement.
4. Noise Removal including blurring and irregular brightness has been carried out.
5. Accuracy of 97.61% has been achieved using the proposed CNN model.
In our work, CNN-based image segmentation methodology is proposed to segment the coronary angiogram for the diagnosis of CAD. Firstly, the original raw images of angiograms have been preprocessed and thereafter, the images have been manually annotated by tracing the angiograms. The preprocessing is done to make the image easier to trace. Next, the annotated images are obtained for training data. Now, the training data is sent to the CNN model. After training, the trained model is tested over the test images and the output containing the segmented image is obtained. Fig. 1 depicts the proposed methodology with the flow of data starting from the original raw input image to the segmented output image. The CNN architecture shown in the proposed methodology is based on the U-Net model which is used for biomedical image segmentation due to its ability to produce fast and precise segmented images. Fig. 2 depicts the CNN architecture of the proposed model using 2 × 2 max pooling. The blocks in red depict the convolution with the Rectified Linear Unit (ReLU) activation function used for acquiring the outputs of the CNN neurons. The blocks shown in pink are the max pooling layers. Up-sampling is performed to recreate the segmented image.
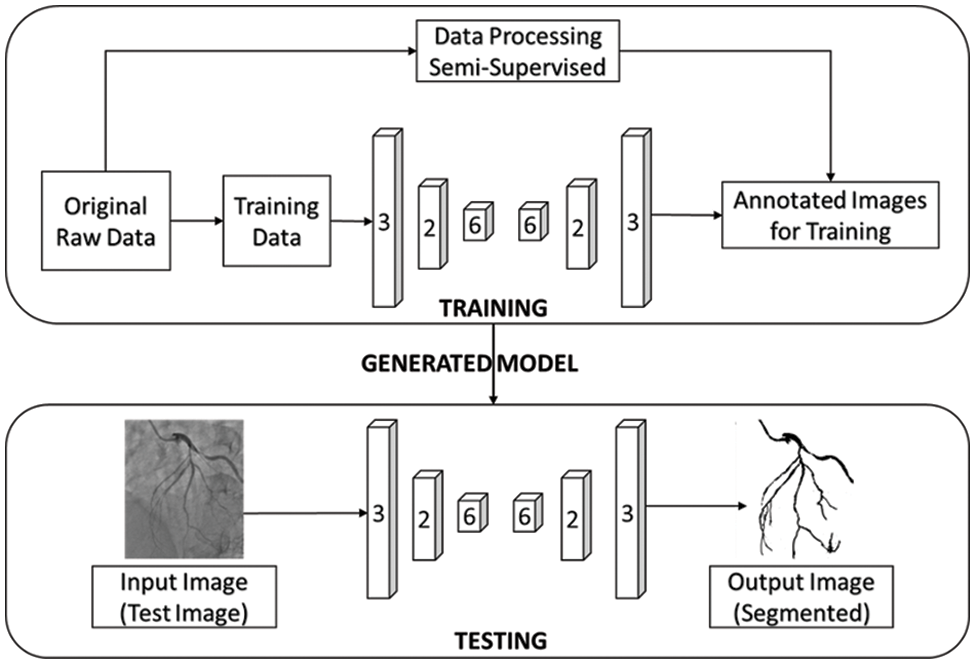
Figure 1: The proposed workflow of the whole image segmentation including the input image of and output image of angiogram
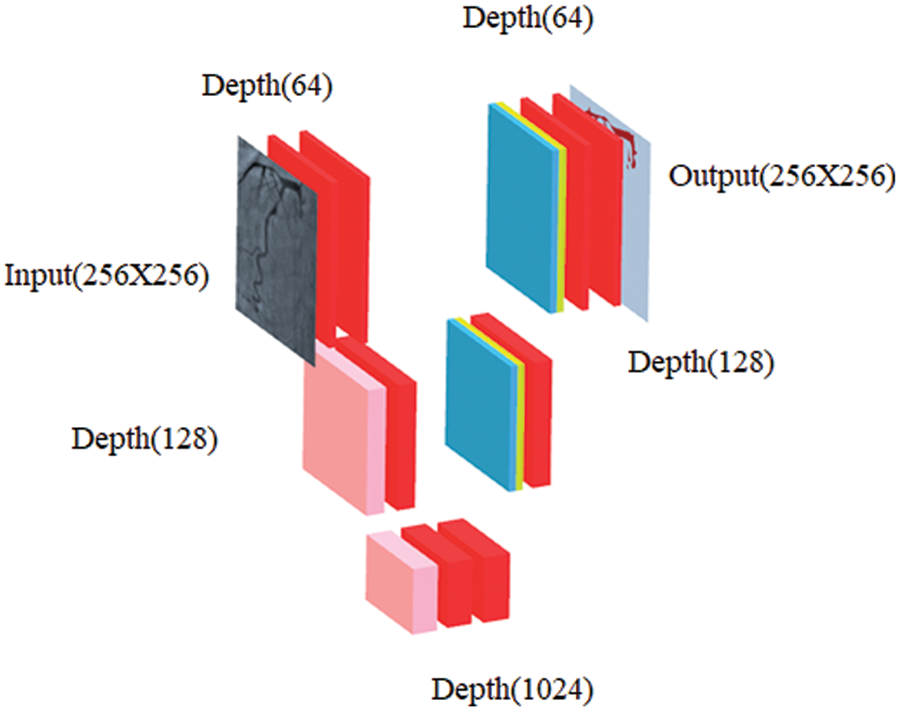
Figure 2: Schematic diagram of proposed CNN where blockwise transformation has been shown
3.1 Convolution Neural Network
In order to build a convolution concept, the theorem of convolution that maps convolution in the domain of space and time has to be incorporated. This theorem has been adopted by many authors in the past and is related to the Fourier domain. One can refer to convolution as a Fast Fourier transformation (FFT) [29]:
Eq. (1) depicts the convolution theorem which is the convolution of two continuous functions h and g; f(x) is the final output hypothesis. Here h refers to the input images and g refers to the kernel function. Eq. (2) refers to the 2D discrete convolution theorem related to discrete images. In CNN, the feature map or activation map refers to the output of one filter served to the previous layer. The definition of feature map (FM) can be given as,
One of the main building blocks of a CNN is the convolutional layer. The parameters consist of a set of learnable filters with a small receptive field. Every filter extends through the full depth of the input volume, and so the depth of these filters is the same as the depth of the input volume. Each filter is convolved in terms of the width and height of the input images in the forward pass, and while doing so, it also computes the dot product for all the admittances of the filter and the input to provide a 2-D map of activations of that filter. All components of the output volume can thus be inferred as an output of a neuron that gazes at a trivial area in the input and segment parameters with neurons in the identical activation map. Several such filters are used and they produce different activation maps of the same size, thus generating an output volume when the different activation maps are stacked together in the third dimension. This helps the CNN to learn the filters that activate to detect some precise type of features at some spatial points in the input.
In the case of CNN, the input is an n × n × r image. Here, height and width are n and the number of channels is r; for example, RGB image has r = 3. CNN layers consist of k filters of size m × m × q where m is smaller than the dimension of the image and q can either be the same as the number of channels r. The size of the filters increases the connected structure; that is, all are convolved with the image to yield k feature maps with size n−m + 1. Most of the time, the convolution layer uses a ReLU (Rectified Linear Unit) layer. This activation function is given as,
and raises the properties of nonlinearity of the decision function without touching the receptive fields of the convolution layer. In Eq. (3), x is the input size.
Additionally, the main building blocks of a CNN is the pooling layer. The operations on the pooling layer happen autonomously on each size of the depth of the input and resize it spatially. The size of the filters 2 × 2 are applied with a step of 2, thus down-sampling the input by two along the width and height, ignoring 75% of the activations. From the several choices of non-linear functions that exist, the max-pool is the most commonly used operation. Fig. 3 depicts how the existing layer is down sampled and resized based on the pooling operation.
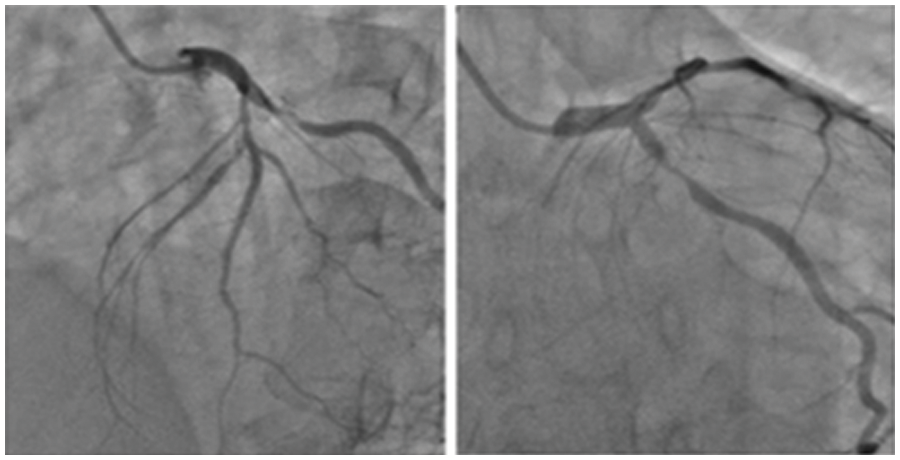
Figure 3: Sample input images containing coronary angiograms
As part of the pre-processing pipeline, we perform the grey-scale conversion, normalization, contrast-limited adaptive histogram equalization and gamma adjustment. The training of the neural network is performed on satellite sub-images (patches) of the pre-processed full images. Heavy data augmentation is performed by randomly combining sheer, rotation, and zoom transformations by means of a generator that generates transformed images on the fly and this operation increase the dataset size by a factor of a number. This comprehensive data augmentation scheme makes the network resist over-fitting. The network iteratively adjusts its parameters using the Adam optimization algorithm which is a variant of stochastic gradient descent. Along with gradient descent, training of satellite images of water spread area is also done using back-propagation (an algorithm that defines backward propagation of errors when training artificial neural networks). Given a neural network and an error function, the method calculates the gradient of the error function with respect to the neural network’s weights during the forward pass and the error contribution of each neuron is calculated when processing every batch of the input image.
Back-propagation iteratively computes error for every layer l, and the error term
To calculate the gradient of the loss function and errors, Back-propagation is used. Following the same convention, the gradients can be calculated as,
In Eqs. (5) and (6), W, b are the parameters and x, y represent the input image. The process of optimization, thus, repeats these two steps: propagation and weight update. In the second phase, this gradient is used to update the weights to minimize the loss function.
For the raw images, the mask is generated by a series of steps followed by manual annotation. During the stage of data preprocessing, the images are subjected to a series of image processing techniques. Firstly, the image is subjected to clahe histogram equalization. The clahe histogram equalization is performed in order to increase the contrast of the images. The ordinary histogram equalization is not used since there are areas in the image that are significantly lighter or darker compared to the background pixels. Hence, the clahe histogram equalization is applied.
The next technique applied to the image is the gamma adjustment so as to adjust the luminance values of the pixels. In the next step, the binary thresholding is applied and the threshold value is selected based on which the pixels are updated. Finally, the images are annotated manually in order to remove any background noise and enhance the vessels, specifically the target area. In this preprocessing, several steps have been incorporated. The first step is to consider the raw images of the angiogram that had been collected earlier from the hospital; afterward, Clahe equalization, Gamma Adjustment, Thresholding and Manual Annotation steps also have been carried out.
The network architecture which is derived from the U-Net architecture originally used in compressing image data consisting of two parts: the compression and decompression, is provided next. In this approach, the classic U-Net model is tweaked such that the compressed image data is transformed into a segmented output. Two different settings are provided, A and B which have different architectures in order to analyse the performance of the model. Table 1 provides the information of the architecture for setting A and Table 2 provides the information of the architecture for setting B.


This section elucidates the fact that CNNs provide a superior result compared to other traditional methods. Their ability to learn extremely useful features from the higher layers is also discussed to an extent. CNNs are useful for extracting information based on pattern matching by means of loss fitting. This paper demonstrates the superiority of this technique based on the data collected from some reputed hospitals. The data consists of 28 images for training and their corresponding segmented images as labels. The dataset description, dataset building and CNN parameters are discussed in the following subsections:
The data consisting of 28 images of coronary angiograms are taken from reputed medical institutions. We used the Keras Image data Generator to virtually generate more images using different forms of rotation, skewing etc. Since our batch size is 500, for every epoch 500 images are generated. In 10 epochs, the number of images is 500 * 10 = 5000. These images have been tested with various image processing techniques to segment the image. Some of the notable techniques include log transformation, contrast stretching with histograms and thresholding. The techniques previously proposed by researchers did not provide satisfactory results. Hence, in this methodology, a semi-supervised-based technique with neighborhood contrasting is used to generate annotations for the image. Fig. 3 depicts the sample input images of coronary angiograms and shows the coronary branches in the coronary angiogram. From this figure, Left Main (LF), Left Anterior Descending (LAD), Left Circumflex (LCx), Obtuse Marginal (OM), Diagonal (D), Septal branch, Right Coronary artery (RCA), Acute Marginal, Posterior Left ventricular branch (PLV), Posterior Descending Artery (PDA) can easily be identified by any experienced cardiologist or cardiac surgeon.
It is notable that the dataset of 28 images is vastly insufficient for the training of the proposed CNN model. Hence, to solve this problem, the augmentation of the data is performed with the utilization of different methods like translation, darkening, brightening, rotation and skewing. These methods can be used to automatically generate random images based on the parameters mentioned above. This method ensures that images under any condition can be identified, and this makes the network translational and rotational invariant (since it is trained on images of various degrees of rotation and translation). The images generated are around 50 K which is used for the final training. Here, in the data augmentation, the specific characteristics used are rotation range, width shift range, height shift range, the sheer range and zoom range.
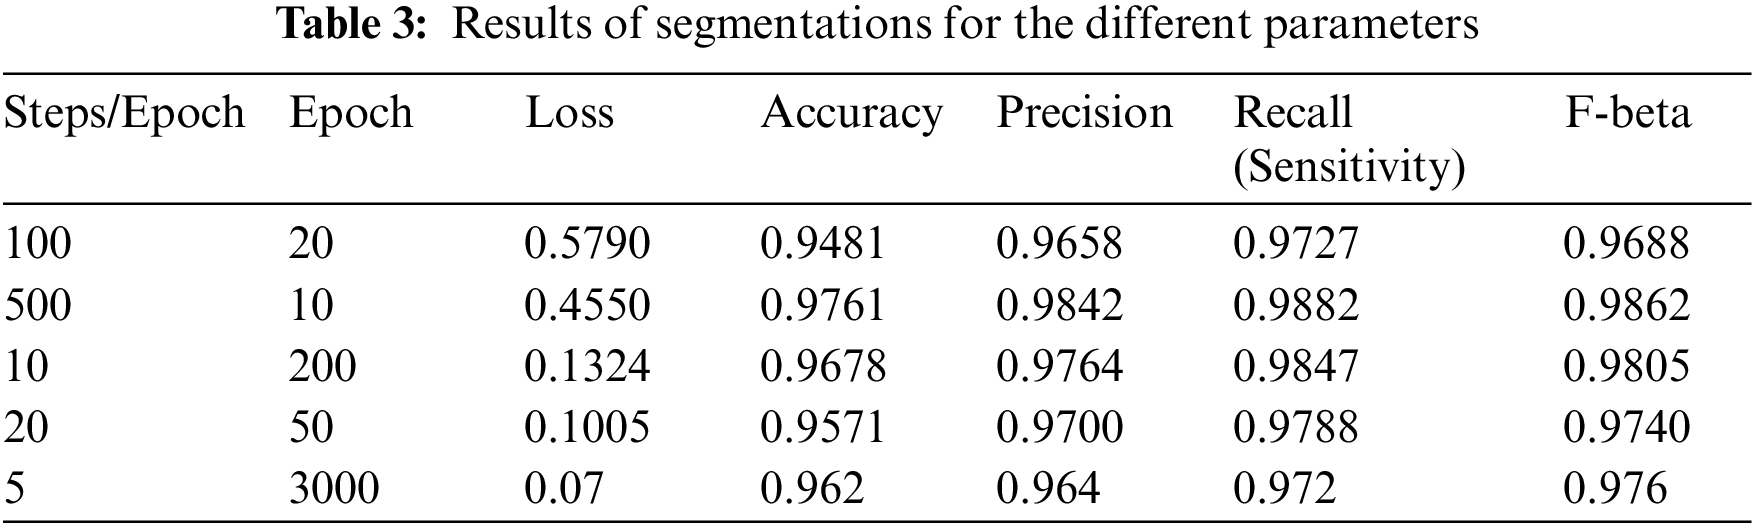
The model uses the U-Net architecture for the deconstruction and reconstruction of the image and for analysis of its performance on the dataset. The model is trained using Stochastic Gradient Descent (SGD) and a batch size of 4. The learning rate used is between 0.05 and 0.1. All the input images and output images are transformed into size of 256 × 256. Table 3 elucidates the different parameters used for analysis. A total of 5 different combinations of steps per epoch and the number of epochs are used. The following parameters are incorporated in the results shown in Table 3:
• Sensitivity (SN) or Recall is the proportion of positives that are correctly identified as positives. This is also called the True Positive Rate (TPR):
• Precision is the proportion of positive classified values that are actually positive. This is also called the Positive Predictive Value (PPV):
• Accuracy is the proportion of all values that have been classified correctly:
• F-beta score for any positive real β is given as:
where the TP, FP, FN and TN are defined as follows:
• True Positive (TP)-The number of cases in which the positive class is classified as positive.
• False Positive (FP)-The number of cases in which the negative class is classified as positive.
• False Negative (FN)-The number of cases in which the positive class is classified as negative.
• True Negative (TN)-The number of cases in which the negative class is classified as negative.
The training of the model is performed on a Tesla K80 GPU, compute 3.7, having 2496 CUDA cores and 12 GB GDDR5 VRAM in Google Collaboratory. The total RAM is 11 GB. Fig. 4 depicts the cloud training architecture of the model wherein some of the parameters are empirically chosen and the activation function used is ‘ReLU’. Fig. 5 provides the sample segment outputs for the corresponding input coronary angiograms. The images are inserted into the trained model and the output is the object for the input coronary angiogram image. The core python modules are placed in a Drive account and the Google Collaboratory is connected via Ocaml fuse socket. In this way, we make a line between data, code and runtime. With the help of the online free GPU, the training time reduces by a factor of 80 as compared to a normal CPU. The model is likewise trained online and stored in drive. The dice score achieved 94.
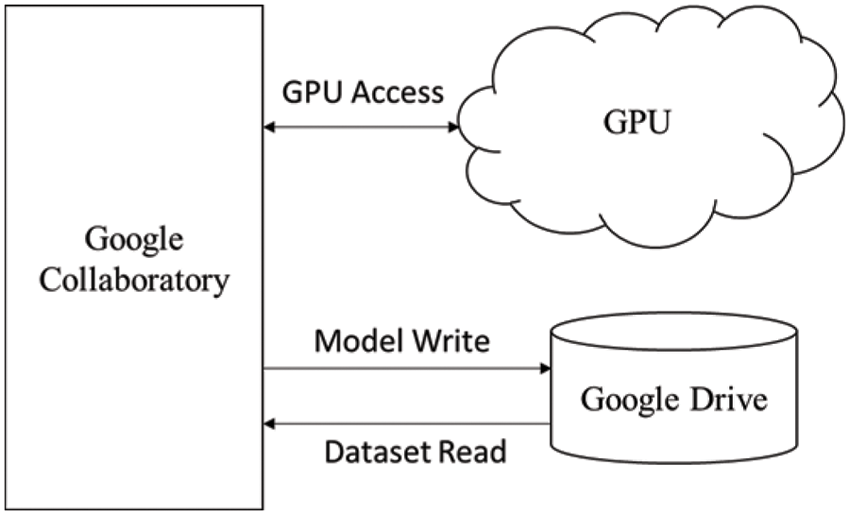
Figure 4: Cloud training architecture of the model
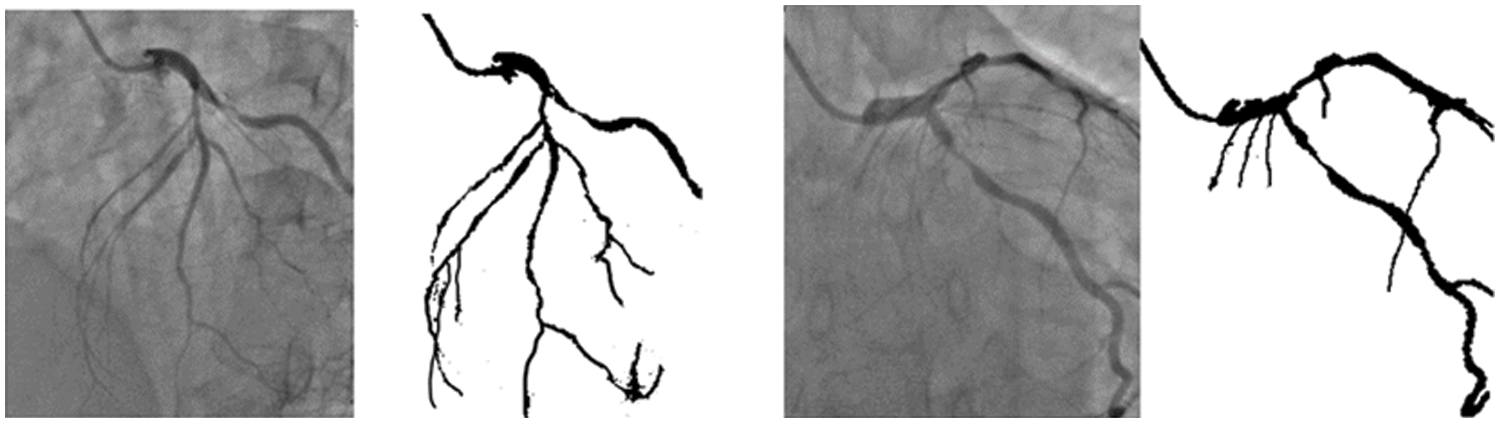
Figure 5: Sample segmentation outputs for the corresponding input angiograms
Fig. 6 shows the performance analysis of the results obtained for the segmented output image. From this graph, the parameters namely training loss, training accuracy, precision, recall and f-beta score results are analyzed. The training loss decreases with the increasing steps per epoch and converges after some point of time. The other parameters including training accuracy improved with increasing steps per epoch with maximum accuracy of approximately 0.97. Also, the results for the different settings are given in Table 4, which shows that setting A provides the best results. It can be since setting A consists of the deepest architecture out of the three settings.
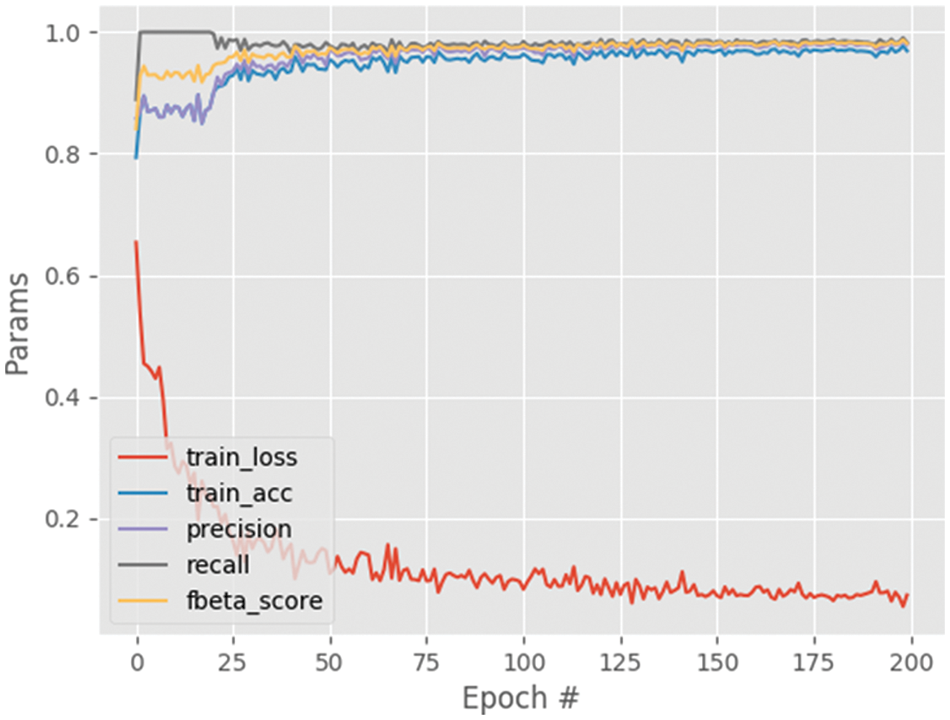
Figure 6: Performance analysis graph

Though there is some declining trend of coronary artery disease in the developed nations due to proper implication of lifestyle, measures, the extent of the disease is ever increasing in other parts of the world. In India, the situation is particularly gloomy because this disease can be seen in much younger age due to genetic problems. The incidence of CAD in young Indians is 12%–16%, which is higher than any other ethnic group in the world [30–34]. It is really surprising that 25% of heart attacks in India affect individuals less than 40 years of age. So, it is important that newer and novel technologies combating the situation must be developed. Our current effort is to segregate and improve the coronary angiogram images using the CNN model. We have highlighted that the proposed technique helps better understand coronary anatomy and luminal stenosis. A similar exercise with a larger sample size will further enhance this insight. The identified segmented regions of the images for the corresponding input coronary angiograms are given in Fig. 7. The identified region is the thin region in the vessel that is affected by the coronary artery disease resulting in the accumulation of fats making the blood flow pass from a lesser available area. In our study, the proposed models have shown high-performance detection in coronary vessels. Therefore, it has the potential to assist heart surgeons to understand the profiling of coronary arteries blockage, especially from the 2D images.
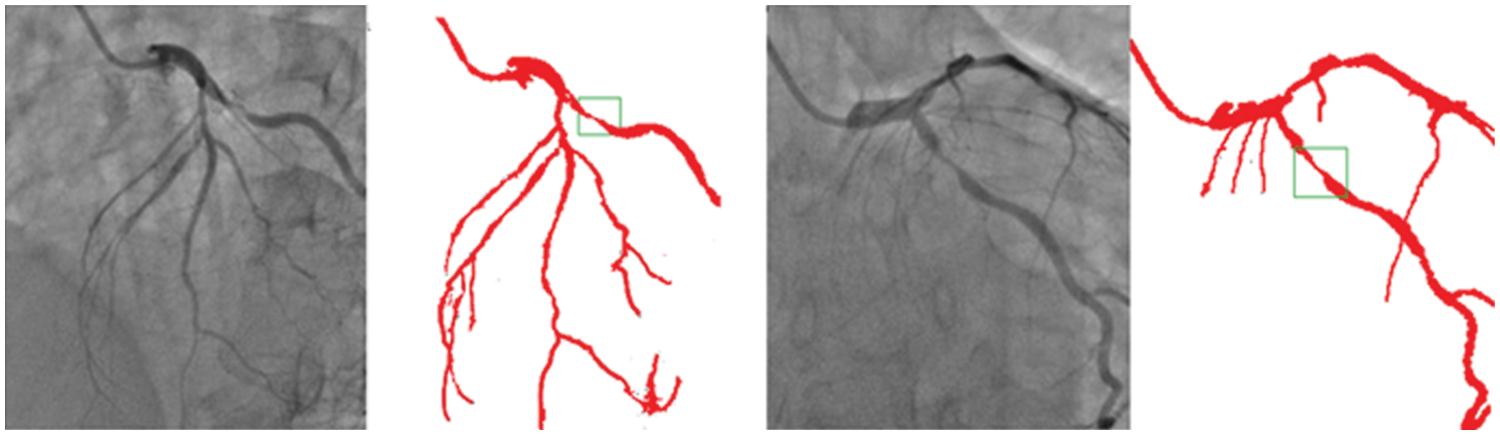
Figure 7: Identified regions from the segmented images for the corresponding input angiograms
This paper proposes an approach for the segmentation of coronary angiogram images for diagnosing CAD. Angiogram images comprise noise, so image processing techniques such as image augmentation and noise removals methods have been utilized. Data augmentation has played an essential role in achieving accurate segmentation results. The accuracy of the proposed model is 97.61% for one of the settings used in the network architecture. The future work for this research includes further enhancement of the output with a similar approach but with a larger dataset of angiography images. Though the data augmentation helped achieve superior results, a larger dataset can further enhance the output. Instead of 2D images, if we had considered 3D images of the angiogram, the value of the work would have been more. Incorporating the 2D images is a drawback of this proposed work. Therefore, in future, we aim to consider the 3D images of coronary arteries to help create detailed profiling of the blockage inside the angiograms so heart surgeons and cardiologists can make crucial decisions. However, generating 3D images of the angiogram is challenging, and 3D images of coronary arteries are not readily available. In future, we also would like to propose a 3D convolutional neural network model for the same problem.
Acknowledgement: The authors would like to thank different reputed hospitals of Kolkata for providing the angiogram images to carry out this research work.
Funding Statement: The authors received no specific funding for this study.
Conflicts of Interest: The authors declare that they have no conflicts of interest to report regarding the present study.
References
1. Fazlali, H. R., Karimi, N., Soroushmehr, S. M. R., Samavi, S., Nallamothu, B. et al. (2015). Robust catheter identification and tracking in X-ray angiographic sequences. 2015 37th Annual International Conference of the IEEE Engineering in Medicine and Biology Society (EMBC), pp. 7901–7904. Milan, Italy, IEEE. [Google Scholar]
2. Sameh, S., Azim, M. A., AbdelRaouf, A. (2017). Narrowed coronary artery detection and classification using angiographic scans. 2017 12th International Conference on Computer Engineering and Systems (ICCES), pp. 73–79. Cairo, Egypt, IEEE. [Google Scholar]
3. Zhao, F., Wu, B., Chen, F., Cao, X., Yi, H. et al. (2019). An automatic multi-class coronary atherosclerosis plaque detection and classification framework. Medical & Biological Engineering & Computing, 57(1), 245–257. DOI 10.1007/s11517-018-1880-6. [Google Scholar] [CrossRef]
4. Yang, S., Kweon, J., Roh, J. H., Lee, J. H., Kang, H. et al. (2019). Deep learning segmentation of major vessels in X-ray coronary angiography. Scientific Reports, 9(1), 1–11. DOI 10.1038/s41598-019-53254-7. [Google Scholar] [CrossRef]
5. Hofer, D., Schmidt-Erfurth, U., Orlando, J. I., Goldbach, F., Gerendas, B. S. et al. (2022). Improving foveal avascular zone segmentation in fluorescein angiograms by leveraging manual vessel labels from public color fundus pictures. Biomedical Optics Express, 13(5), 2566–2580. [Google Scholar]
6. Tatsugami, F., Higaki, T., Nakamura, Y., Yu, Z., Zhou, J. et al. (2019). Deep learning–based image restoration algorithm for coronary CT angiography. European Radiology, 29(10), 5322–5329. DOI 10.1007/s00330-019-06183-y. [Google Scholar] [CrossRef]
7. Tsai, Y. C., Lee, H. J., Chen, M. Y. C. (2013). Adaptive segmentation of vessels from coronary angiograms using multi-scale filtering. 2013 International Conference on Signal-Image Technology & Internet-Based Systems, pp. 143–147. Kyoto, Japan, IEEE. [Google Scholar]
8. M’hiri, F., Le, T. H. N., Duong, L., Desrosiers, C., Cherief, M. (2015). Hierarchical segmentation and tracking of coronary arteries in 2D X-ray angiography sequences. 2015 IEEE International Conference on Image Processing (ICIP), pp. 1707–1711. Quebec City, QC, Canada, IEEE. [Google Scholar]
9. Kazeminia, S., Karimi, N., Mirmahboub, B., Soroushmehr, S. M. R., Samavi, S. et al. (2015). Bone extraction in X-ray images by analysis of line fluctuations. 2015 IEEE International Conference on Image Processing (ICIP), pp. 882–886. Quebec City, QC, Canada, IEEE. [Google Scholar]
10. Oueslati, C., Mabrouk, S., Ghorbel, F., Bedoui, M. H. (2016). A coronary artery segmentation method based on graph cuts and MultiScale analysis. International Workshop on Representations, Analysis and Recognition of Shape and Motion FroM Imaging Data, pp. 141–151. Cham, Springer. [Google Scholar]
11. Huang, D., Gong, R., Li, H., Tang, W., Ding, Y. (2017). A 3D tube-object centerline extraction algorithm based on steady fluid dynamics. International Conference on Image and Graphics, pp. 275–286. Springer, Cham. [Google Scholar]
12. Zhao, F., Chen, Y., Hou, Y., He, X. (2019). Segmentation of blood vessels using rule-based and machine-learning-based methods: A review. Multimedia Systems, 25(2), 109–118. DOI 10.1007/s00530-017-0580-7. [Google Scholar] [CrossRef]
13. Cai, K., Yang, R., Li, L., Ou, S., Chen, Y. et al. (2015). A semi-automatic coronary artery segmentation framework using mechanical simulation. Journal of Medical Systems, 39(10), 1–7. DOI 10.1007/s10916-015-0329-9. [Google Scholar] [CrossRef]
14. Samuel, P. M., Veeramalai, T. (2021). VSSC Net: Vessel specific skip chain convolutional network for blood vessel segmentation. Computer Methods and Programs in Biomedicine, 198, 105769. DOI 10.1016/j.cmpb.2020.105769. [Google Scholar] [CrossRef]
15. Gegundez-Arias, M. E., Marin-Santos, D., Perez-Borrero, I., Vasallo-Vazquez, M. J. (2021). A new deep learning method for blood vessel segmentation in retinal images based on convolutional kernels and modified U-Net model. Computer Methods and Programs in Biomedicine, 205, 106081. DOI 10.1016/j.cmpb.2021.106081. [Google Scholar] [CrossRef]
16. Sarvamangala, D. R., Kulkarni, R. V. (2022). Convolutional neural networks in medical image understanding: A survey. Evolutionary Intelligence, 15(1), 1–22. [Google Scholar]
17. Ueda, D., Katayama, Y., Yamamoto, A., Ichinose, T., Arima, H. et al. (2021). Deep learning–based angiogram generation model for cerebral angiography without misregistration artifacts. Radiology, 299(3), 675–681. DOI 10.1148/radiol.2021203692. [Google Scholar] [CrossRef]
18. Roy, S. S., Rodrigues, N., Taguchi, Y. (2020). Incremental dilations using CNN for brain tumor classification. Applied Sciences, 10(14), 4915. DOI 10.3390/app10144915. [Google Scholar] [CrossRef]
19. Woźniak, T., Strzelecki, M., Majos, A., Stefańczyk, L. (2017). 3D vascular tree segmentation using a multiscale vesselness function and a level set approach. Biocybernetics and Biomedical Engineering, 37(1), 66–77. DOI 10.1016/j.bbe.2016.11.003. [Google Scholar] [CrossRef]
20. Li, Z., Zhang, Y., Liu, G., Shao, H., Li, W. et al. (2015). A robust coronary artery identification and centerline extraction method in angiographies. Biomedical Signal Processing and Control, 16, 1–8. DOI 10.1016/j.bspc.2014.09.015. [Google Scholar] [CrossRef]
21. Ahmad, S., Khan, M. F. (2017). Dynamic elasticity model for inter-subject non-rigid registration of 3D MRI brain scans. Biomedical Signal Processing and Control, 33, 346–357. DOI 10.1016/j.bspc.2016.12.016. [Google Scholar] [CrossRef]
22. Nasr-Esfahani, E., Karimi, N., Jafari, M. H., Soroushmehr, S. M. R., Samavi, S. et al. (2018). Segmentation of vessels in angiograms using convolutional neural networks. Biomedical Signal Processing and Control, 40, 240–251. DOI 10.1016/j.bspc.2017.09.012. [Google Scholar] [CrossRef]
23. Liskowski, P., Krawiec, K. (2016). Segmenting retinal blood vessels with deep neural networks. IEEE Transactions on Medical Imaging, 35(11), 2369–2380. DOI 10.1109/TMI.2016.2546227. [Google Scholar] [CrossRef]
24. Wong, K. C., Syeda-Mahmood, T., Moradi, M. (2018). Building medical image classifiers with very limited data using segmentation networks. Medical Image Analysis, 49, 105–116. DOI 10.1016/j.media.2018.07.010. [Google Scholar] [CrossRef]
25. Fu, X., Liu, T., Xiong, Z., Smaill, B. H., Stiles, M. K. et al. (2018). Segmentation of histological images and fibrosis identification with a convolutional neural network. Computers in Biology and Medicine, 98, 147–158. DOI 10.1016/j.compbiomed.2018.05.015. [Google Scholar] [CrossRef]
26. Pusit, P., Xie, X., Hou, Z. (2018). Guide-wire detecting based on speeded up robust features for percutaneous coronary intervention. International Conference on Neural Information Processing, pp. 405–415. Cham, Springer. [Google Scholar]
27. Ueda, D., Katayama, Y., Yamamoto, A., Ichinose, T., Arima, H. et al. (2021). Deep learning–based angiogram generation model for cerebral angiography without misregistration artifacts. Radiology, 299(3), 675–681. DOI 10.1148/radiol.2021203692. [Google Scholar] [CrossRef]
28. Petkov, S., Carrillo, X., Radeva, P., Gatta, C. (2014). Diaphragm border detection in coronary X-ray angiographies: New method and applications. Computerized Medical Imaging and Graphics, 38(4), 296–305. DOI 10.1016/j.compmedimag.2014.01.003. [Google Scholar] [CrossRef]
29. Biswas, R., Vasan, A., Roy, S. S. (2020). Dilated deep neural network for segmentation of retinal blood vessels in fundus images. Iranian Journal of Science and Technology, Transactions of Electrical Engineering, 44(1), 505–518. [Google Scholar]
30. Li, Z., Zhang, Y., Gong, H., Li, W., Tang, X. (2016). Automatic coronary artery segmentation based on multi-domains remapping and quantile regression in angiographies. Computerized Medical Imaging and Graphics, 54, 55–66. DOI 10.1016/j.compmedimag.2016.08.006. [Google Scholar] [CrossRef]
31. Mabrouk, S., Oueslati, C., Ghorbel, F. (2017). Multiscale graph cuts based method for coronary artery segmentation in angiograms. IRBM, 38(3), 167–175. DOI 10.1016/j.irbm.2017.04.004. [Google Scholar] [CrossRef]
32. Yokota, Y., Takeda, C., Kidoh, M., Oda, S., Aoki, R. et al. (2021). Effects of deep learning reconstruction technique in high-resolution non-contrast magnetic resonance coronary angiography at a 3-Tesla machine. Canadian Association of Radiologists Journal, 72(1), 120–127. DOI 10.1177/0846537119900469. [Google Scholar] [CrossRef]
33. Mitra, S., Roy, S. S., Srinivasan, K. (2021). Classifying CT scan images based on contrast material and age of a person: ConvNets approach. In: Data analytics in biomedical engineering and healthcare, pp. 105–118. Academic Press. [Google Scholar]
34. Kerkeni, A., Benabdallah, A., Manzanera, A., Bedoui, M. H. (2016). A coronary artery segmentation method based on multiscale analysis and region growing. Computerized Medical Imaging and Graphics, 48, 49–61. DOI 10.1016/j.compmedimag.2015.12.004. [Google Scholar] [CrossRef]
Cite This Article
 Copyright © 2023 The Author(s). Published by Tech Science Press.
This work is licensed under a Creative Commons Attribution 4.0 International License , which permits unrestricted use, distribution, and reproduction in any medium, provided the original work is properly cited.
 Downloads
 Citation Tools