
 Submit a Paper
 Propose a Special lssue
 Open Access
ARTICLE

Degree-Based Entropy Descriptors of Graphenylene Using Topological Indices
1
Department of Mathematics, Bapuji Institute of Engineering & Technology, Davanagere, 577004, India
2
Department of Computer Engineering (Smart Security), Gachon University, Seongnam, 13120, South Korea
3
Department of Mathematics, Alliance School of Applied Mathematics, Alliance University, Bangalore, 562106, India
4
Department of Computer Science and Engineering, Bapuji Institute of Engineering & Technology, Davanagere, 577004, India
5
Department of Mathematics, Riphah Institute of Computing and Applied Sciences, Riphah International University, Lahore,
54660, Pakistan
* Corresponding Author: Sokjoon Lee. Email:
(This article belongs to the Special Issue: Resolvability Parameters and their Applications)
Computer Modeling in Engineering & Sciences 2023, 137(1), 939-964. https://doi.org/10.32604/cmes.2023.027254
Received 21 October 2022; Accepted 19 December 2022; Issue published 23 April 2023
 View Full Text
 Download PDF
Abstract
Graph theory plays a significant role in the applications of chemistry, pharmacy, communication, maps, and aeronautical fields. The molecules of chemical compounds are modelled as a graph to study the properties of the compounds. The geometric structure of the compound relates to a few physical properties such as boiling point, enthalpy, π-electron energy, molecular weight. The article aims to determine the practical application of graph theory by solving one of the interdisciplinary problems describing the structures of benzenoid hydrocarbons and graphenylene. The topological index is an invariant of a molecular graph associated with the chemical structure, which shows the correlation of chemical structures using many physical, chemical properties and biological activities. This study aims to introduce some novel degree-based entropy descriptors such as ENTSO, ENTGH, ENTHG, ENTSS, ENTNSO, ENTNReZ1 , ENTNReZ2 and ENTNSS using the respective topological indices. Also, the above-mentioned entropy measures and physico-chemical properties of benzenoid hydrocarbons are fitted using linear regression models and calculated for graphenylene structure.Keywords
Mathematics and computer science are often used in the applications of research development. One example of such applications is cheminformatics which is a relatively recent area of research in mathematics. The study includes the problem of analysing the structure of a molecule which can be retrieved from the cheminformatics dataset. There are many compounds available in organic and inorganic chemistry whose properties and structures seem promising to search and evaluate the uses of a substance. The study of the structure of a molecule gives information about its chemical properties [1,2].
Graph theory has been a very useful branch of science, especially in the applications of chemistry. It has a very powerful tool known as the topological index which provides a lot of information about a chemical compound. These topological indices are classified based on degree, distance, and eccentricity [3–6].
Most of these indices have a good correlation with the properties of isomers and benzenoid hydrocarbons, such that the compounds are used for various purposes based on their correlation coefficient [7–9].
Graph theory facilitates the mathematical model of a compound to draw information about the chemical compound. In modelling a compound into a graph, the hydrogen atoms are neglected without losing information about the molecule, as carbon atoms have four chemical bonds whereas hydrogen atom has one chemical bond [10–13].
The recent trends in research have attracted a lot of studies involving information science. It provides a good correlation between the biological and structural properties of compounds. Many scientists have done remarkable findings which led to wide applications in graph theory [14–16].
Graph theory being an ideal tool in the hands of the chemist involves representation, synthesis of compounds and numerous chemical activities. Also, chemists are always interested in breaking and making chemical bonds, resulting in different types of structures [17,18].
The degree of amount of energy dispersed and the measure of unavailability of heat energy for work is termed as the entropy. Originally, Shannon introduced the concept of entropy as a part of the communication theory [19]. According to him, data is communicated as a system consisting of three elements: source, channel and receiver. During his learning, Shannon used various methods to encode, transmit and compress the messages which proved that the entropy denotes an absolute limit on how well data can be compressed from the source to reach the receiver in his famous coding theorem.
The measure of uncertainty refers to the entropy of a probability distribution. Indeed, the result of an analysis conducted can be assumed by taking the numerical value equal to the amount of uncertainty of the outcome of the analysis. Furthermore, studies on graphs and networks were studied by various researchers during the late 1950s. More work on entropy measures was carried out using graph invariants which proved advantageous to study important properties of graphs [20–23].
Several theoretic measures and tools have been developed to study the complexity of the structure of chemical compounds and complex networks. The word entropy is dealt with various ways by researchers involving a variety of problems in different fields like discrete mathematics, biology, chemistry, statistics, etc., in investigating entropies of relational structures. In mathematical chemistry, graph entropy is used to characterize the structure of a graph [24–26].
A class of chemical compounds having at least one benzene ring is termed as a benzenoid. They have a high chemical stability because of its bonding with certain molecules. Benzenoids are aromatic hydrocarbons having significant applications in gasoline additives, dry cleaning, manufacture of synthetic fibres, plastics and products in rubber-like materials [27]. Their applications are growing rapidly in the fields of industrial chemistry particularly, in the products of polymers. The work is carried out for twenty-two benzenoid hydrocarbons refer Fig. 1.
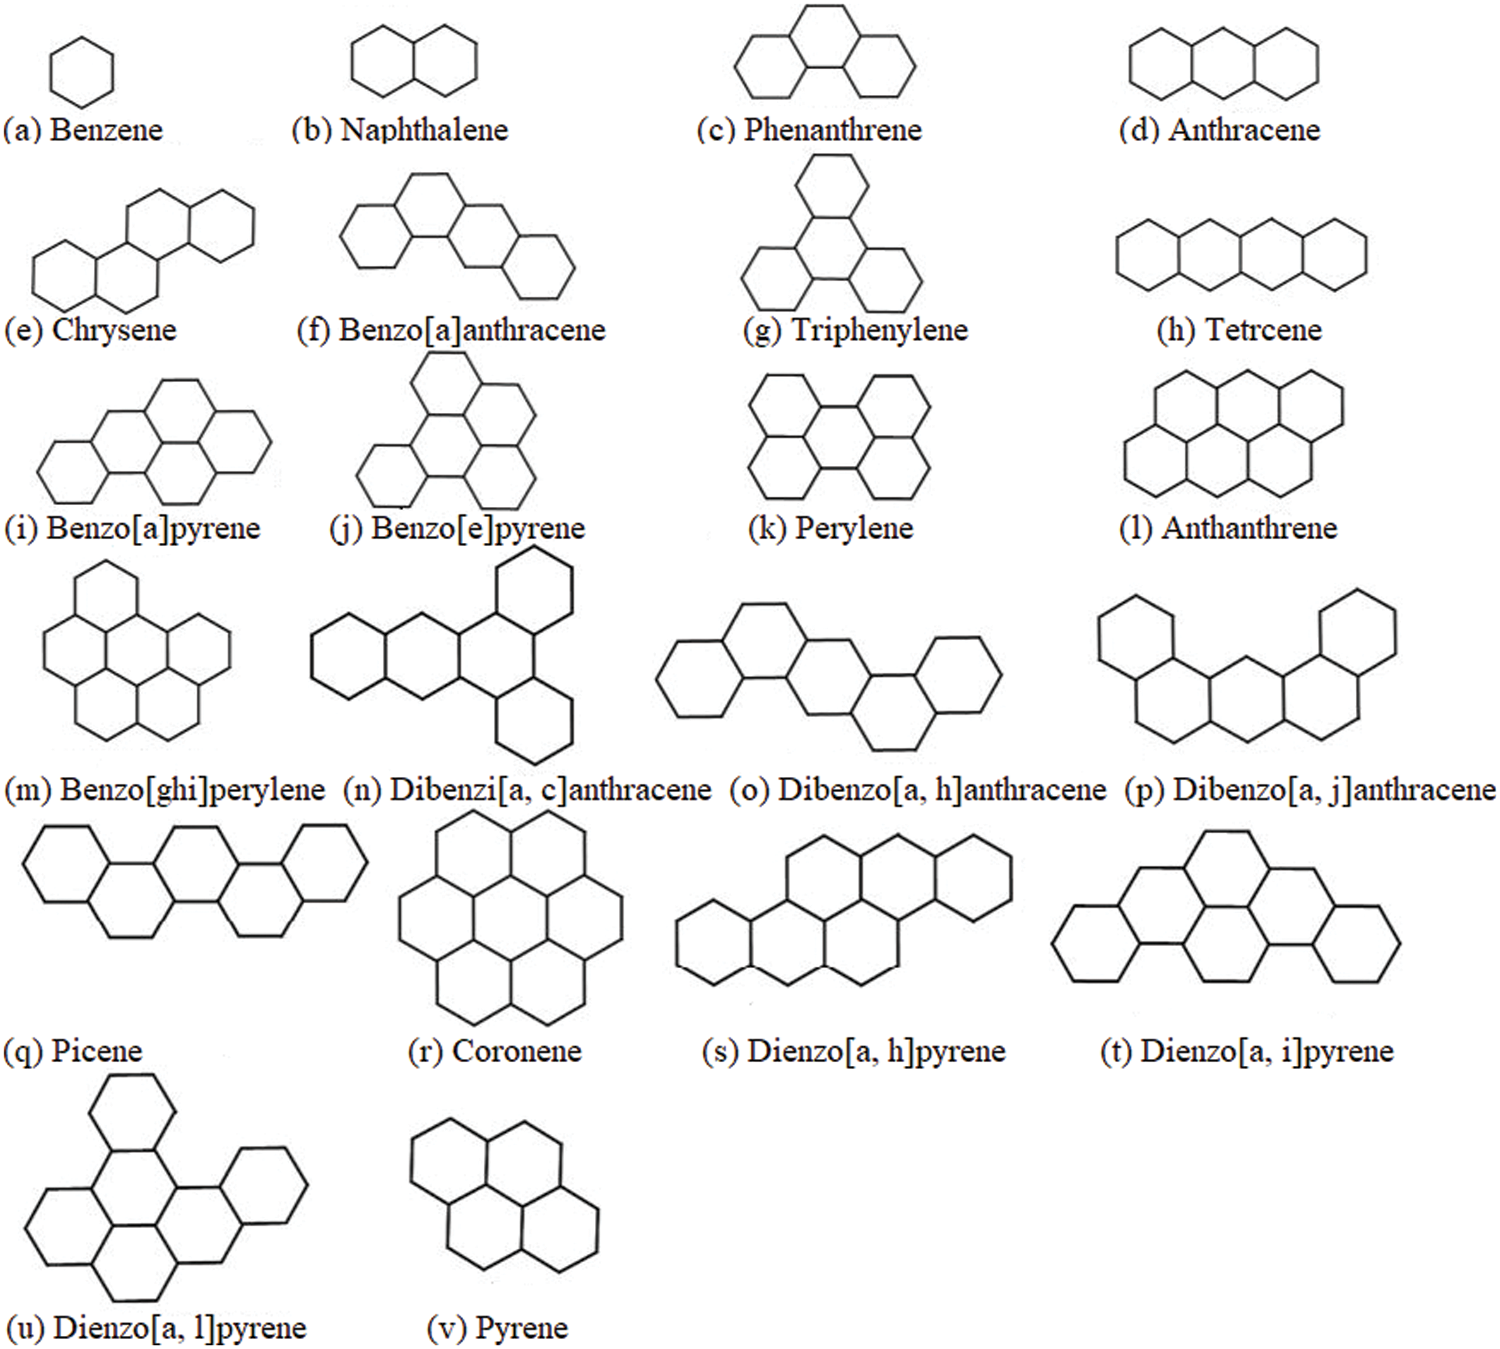
Figure 1: Molecular structure of benzenoid hydrocarbons
Graphenylene is a cyclic hydrocarbon in which each hexagon has a square adjacent to it. Two such hexagons separated by a square are termed as biphenylenes. Chemically, it is a cyclobutadiene ring in between two benzene rings. Biphenylene is a building block of graphenylene which is pale yellowish powder having melting temperature of
Numerous studies on graphene have grabbed researchers across the globe due to its magnificent properties and promising potential applications because of its unique 2D structure. Graphene can be wrapped up into fullerenes, carbon nanotubes and even along a specific direction that forms graphene nanoribbon. These have extremely enriched the family of carbon nanomaterials. Also, these studies have created an interest in exploiting new 2D carbon allotropes through both experimental techniques and theoretical calculations [30]. Biphenylene carbon is a product of cyclotrimerization of graphene whose structure is 2D network of hydrogen free carbon atoms.
The main aims/objectives of this work are
• To introduce novel entropy measures.
• To understand their physical/chemical applicability of benzenoid hydrocarbons by regression models.
• To calculate defined entropies of graphenylene structure.
In this article, all standard graph terminologies and notations are referred from [31–33]. In the literature, various studies are carried out using topological indices of which the below mentioned indices are considered in this work.
Definition 1.1.Gutman defined Sombor index [34] as
Definition 1.2.Usha et al. [35] defined Geometric-Harmonic index as
Definition 1.3.Shanmukha et al. [36] defined Harmonic-Geometric index as
Definition 1.4.Zhao et al. [37] defined SS index as
In continuation to SS index, the neighborhood version of SS index is defined as
Definition 1.5.Kulli [38] defined neighborhood Sombor index as
Definition 1.6.Shanmukha et al. [39] defined neighborhood redefined first and second Zagreb indices as
1.1 Graph Entropy Based on Degree and Edge Weight
The theory of edge weighted graph based on entropy was first introduced by Chen et al. [40] in the year 2014. Let G be an edge weighted graph, denoted by
• Sombor Entropy
If
Using the definition of Eq. (1) for Sombor index results in Sombor entropy given by
• Geometric-Harmonic Entropy
If
Using the definition of Eq. (1) for Geometric-Harmonic index results in Geometric-Harmonic entropy given by
• Harmonic-Geometric Entropy
If
Using the definition of Eq. (1) for Harmonic-Geometric index results in Harmonic-Geometric entropy given by
• The SS Entropy
If
Using the definition of Eq. (1) for SS index results in SS entropy given by
• The Neighborhood Sombor Entropy
If
Using the definition of Eq. (1) for neighborhood Sombor index results in neighborhood Sombor entropy given by
• The
If
Using the definition of Eq. (1) for
• The
If
Using the definition of Eq. (1) for
• The Neighborhood SS Entropy
If
Using the definition of Eq. (1) for neighborhood SS index results in neighborhood SS entropy given by
1.2 Chemical Applicability of Defined Degree-Based Entropies
This section concentrates on framing the linear regression model for the properties viz., boiling point
The
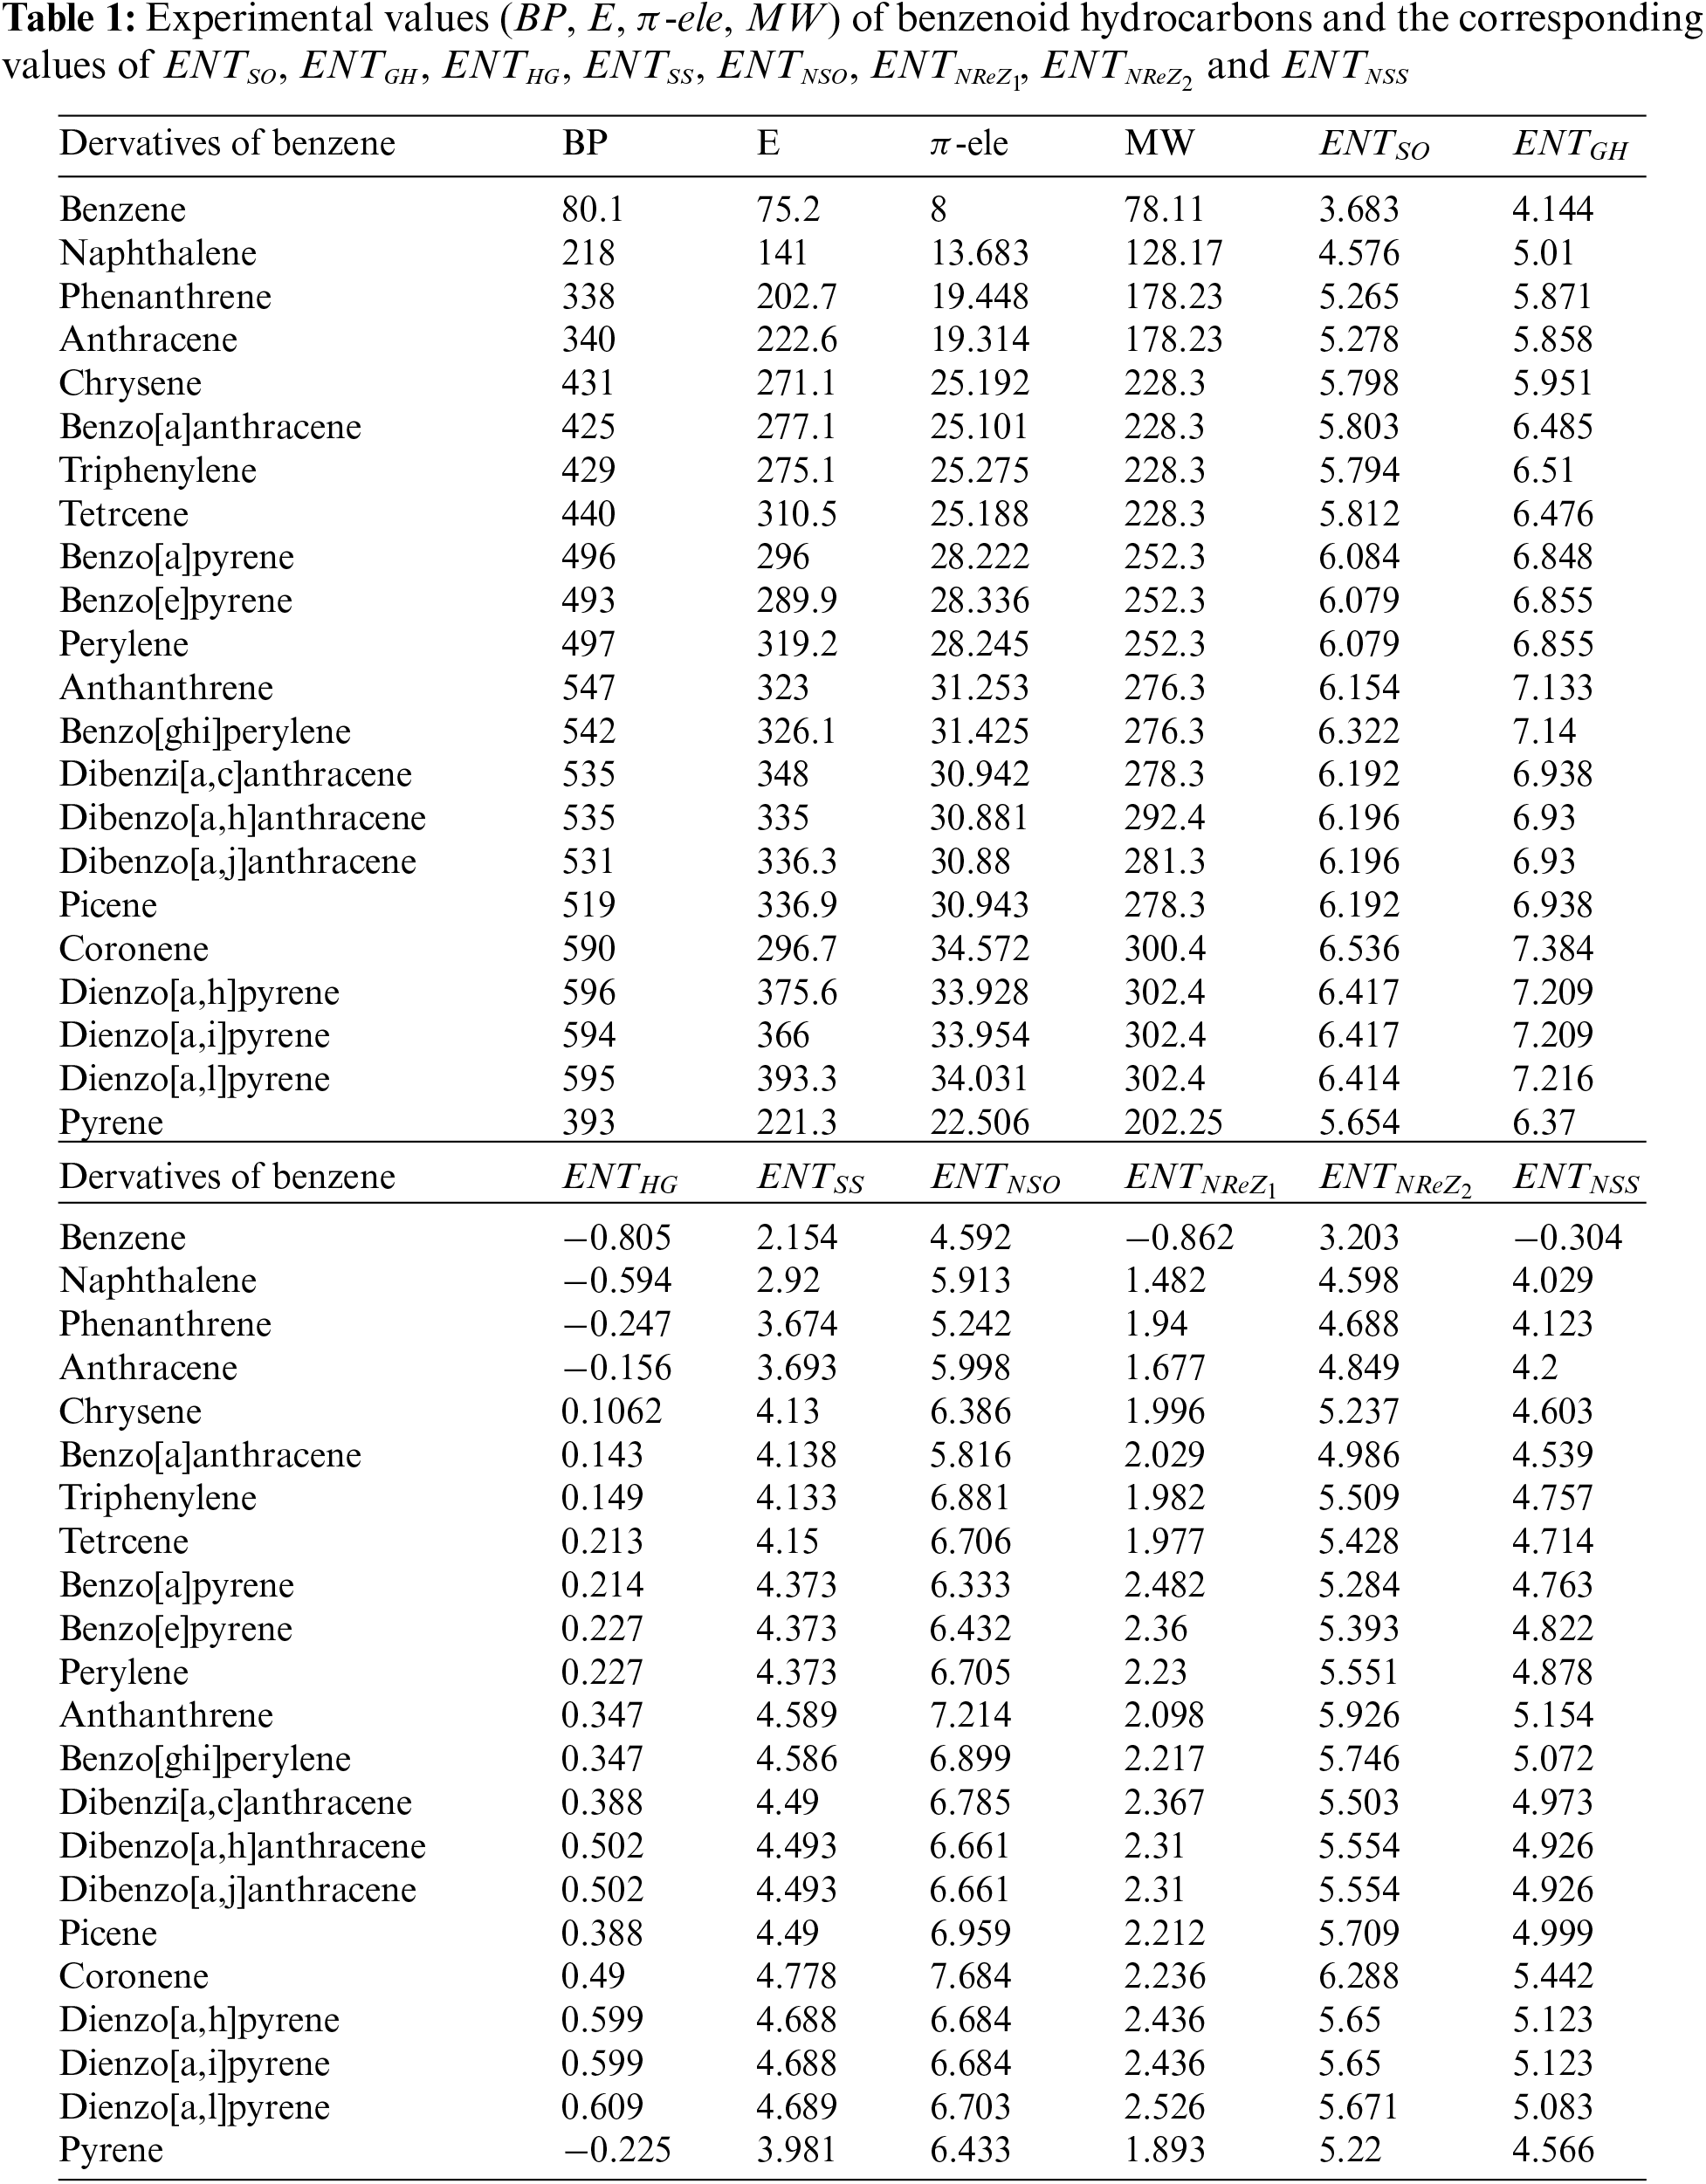
The linear regression models for BP, E,
The models fitted for
The models fitted for
The models fitted for
The models fitted for
The models fitted for
The models fitted for
The models fitted for
The models fitted for
Note: The errors associated with the regression coefficients are enclosed with in brackets of Eqs. (10)–(41).
Tables 2 to 9 and Fig. 2 show the
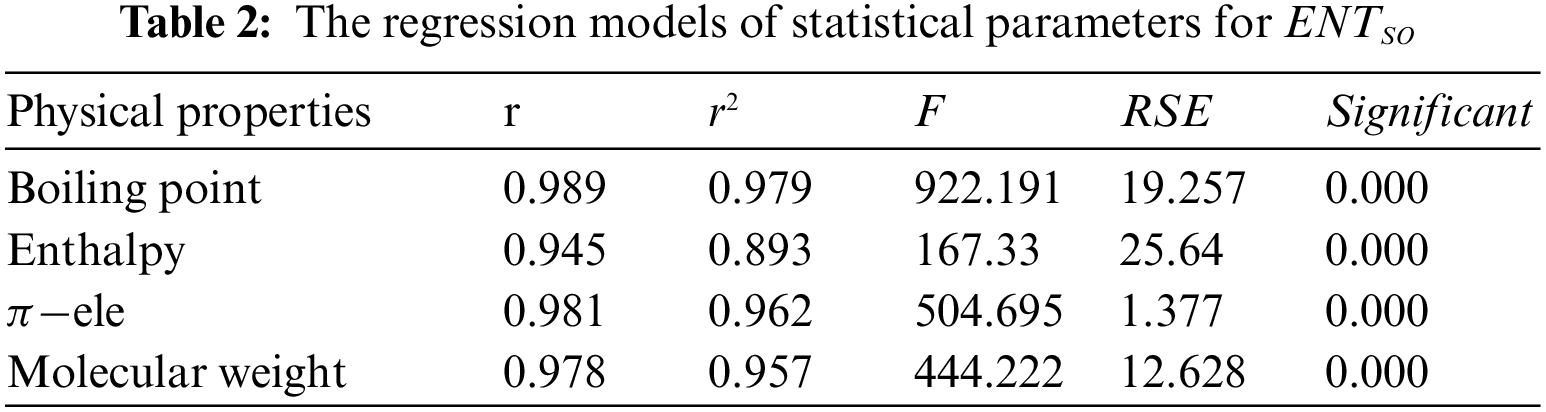
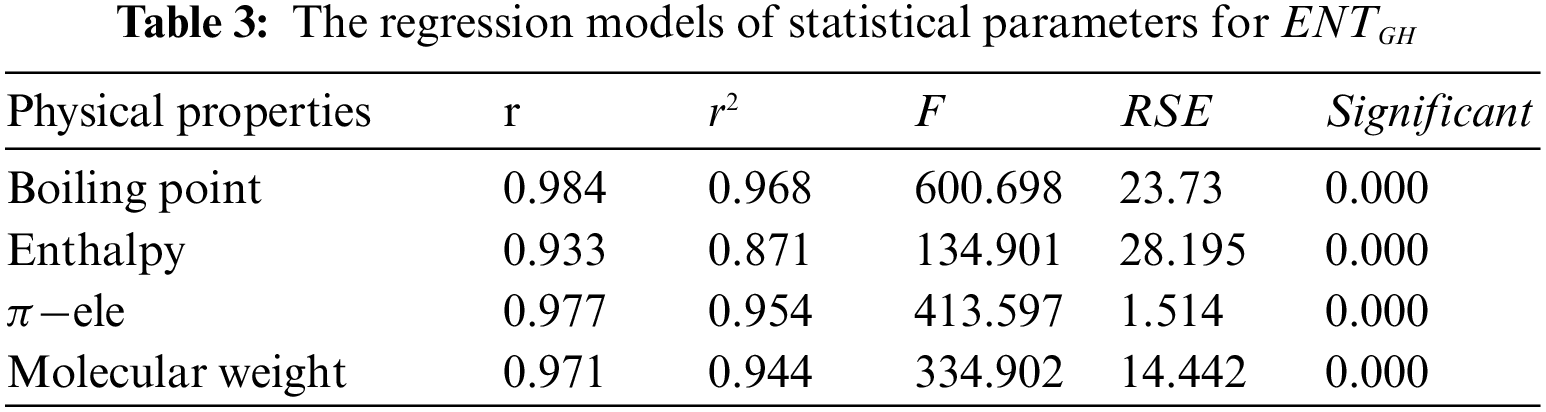
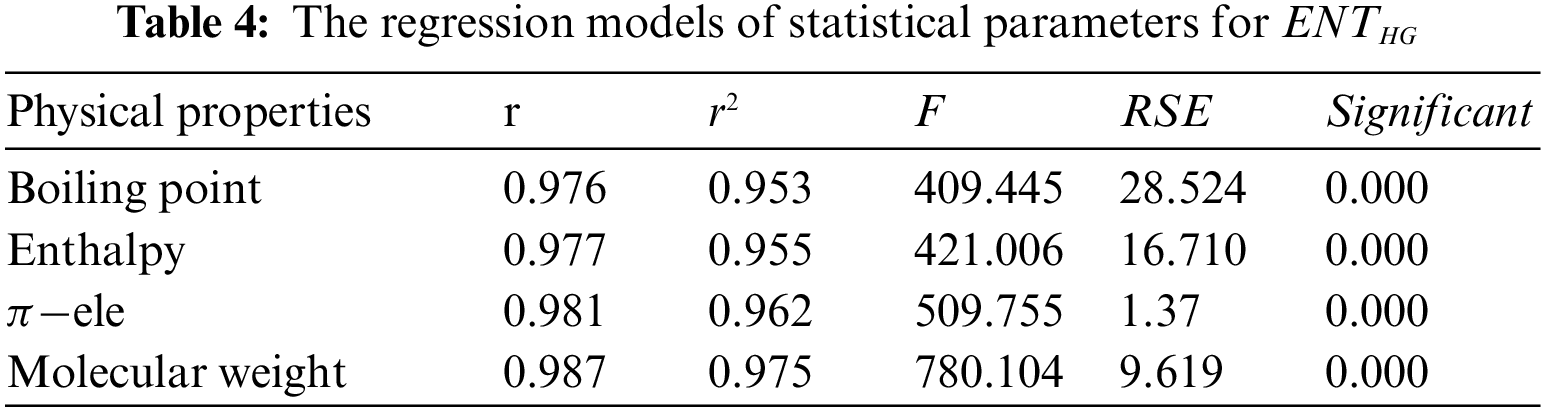
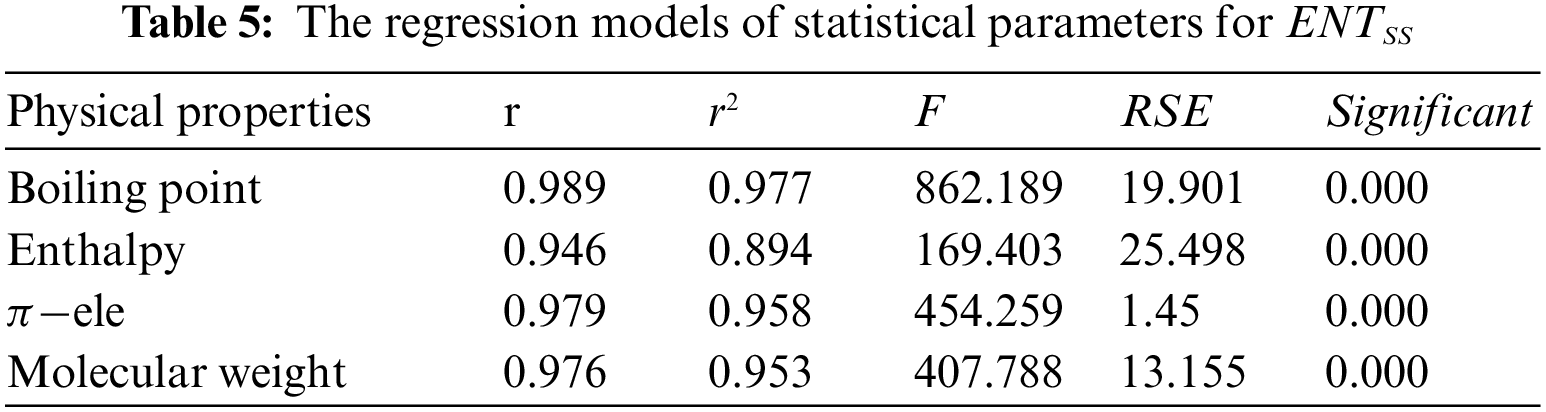
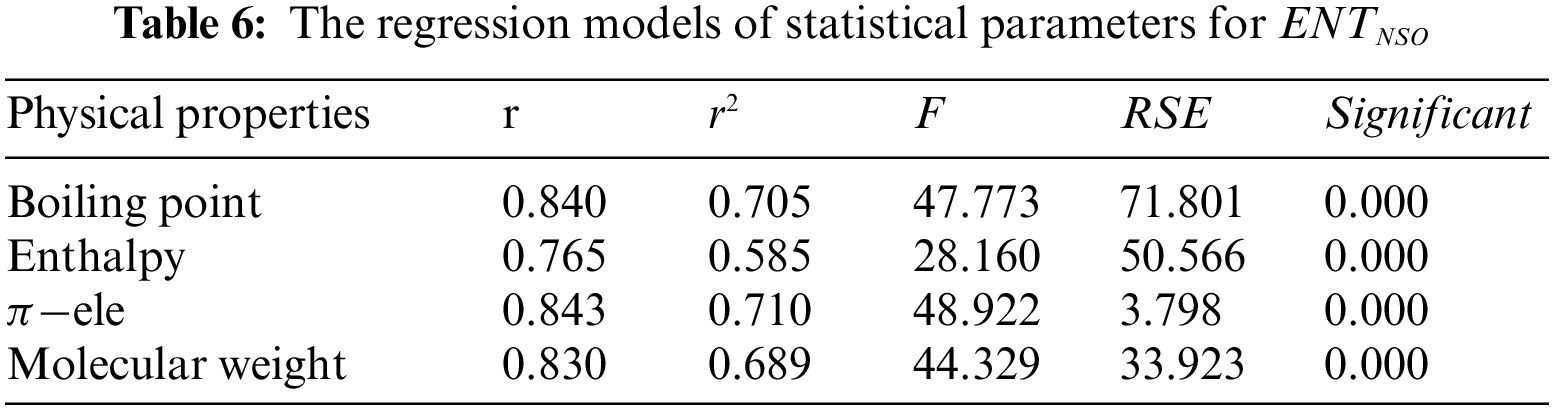
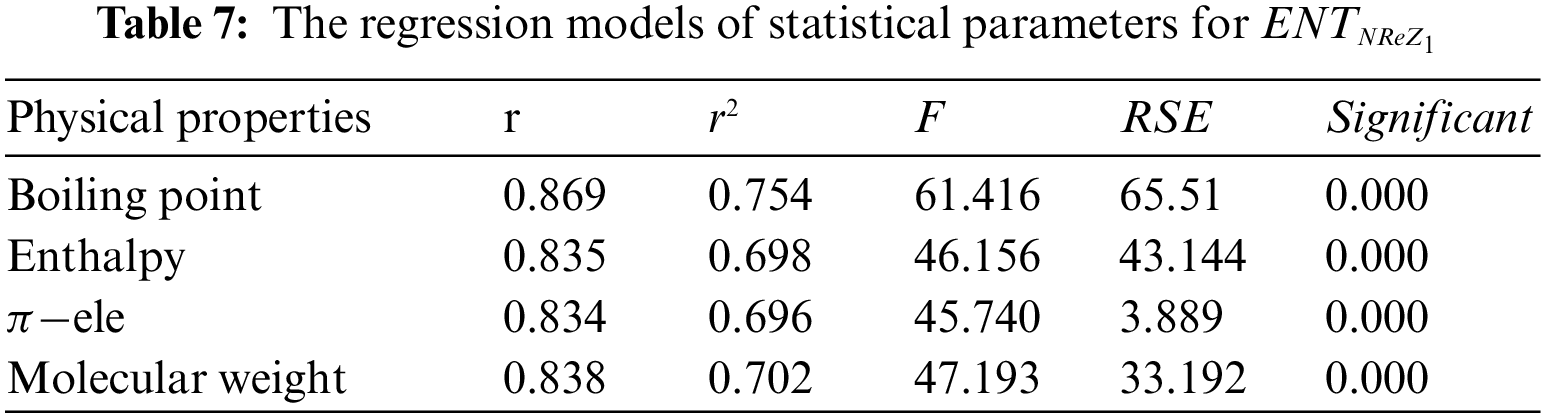
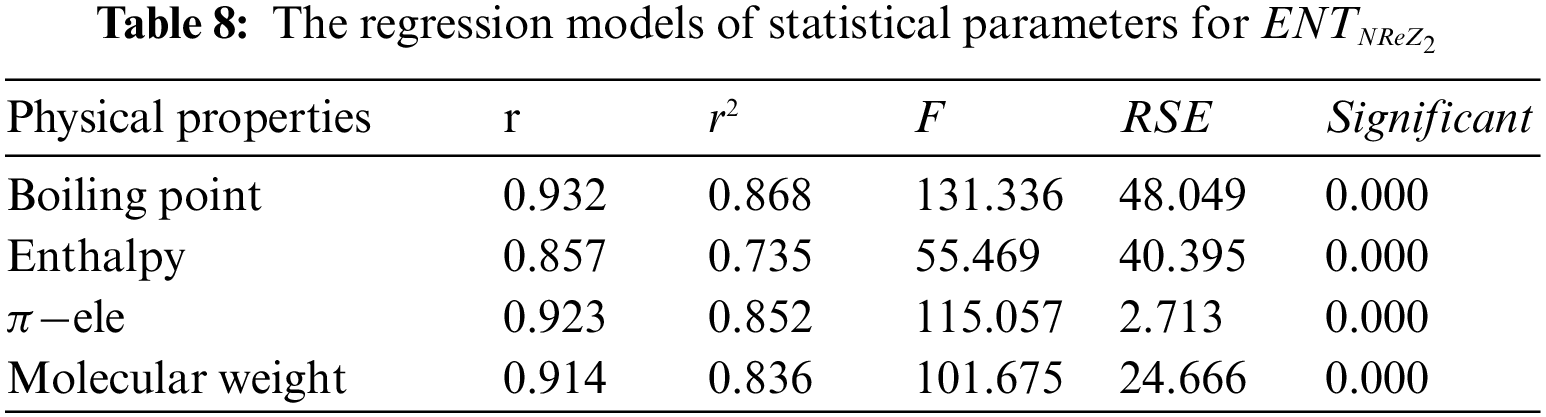
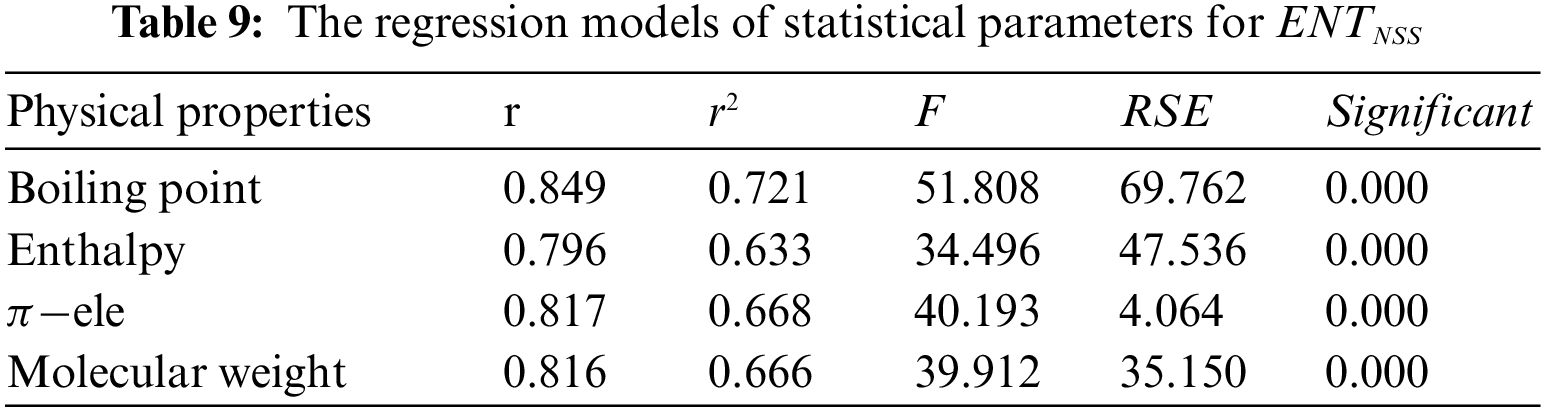
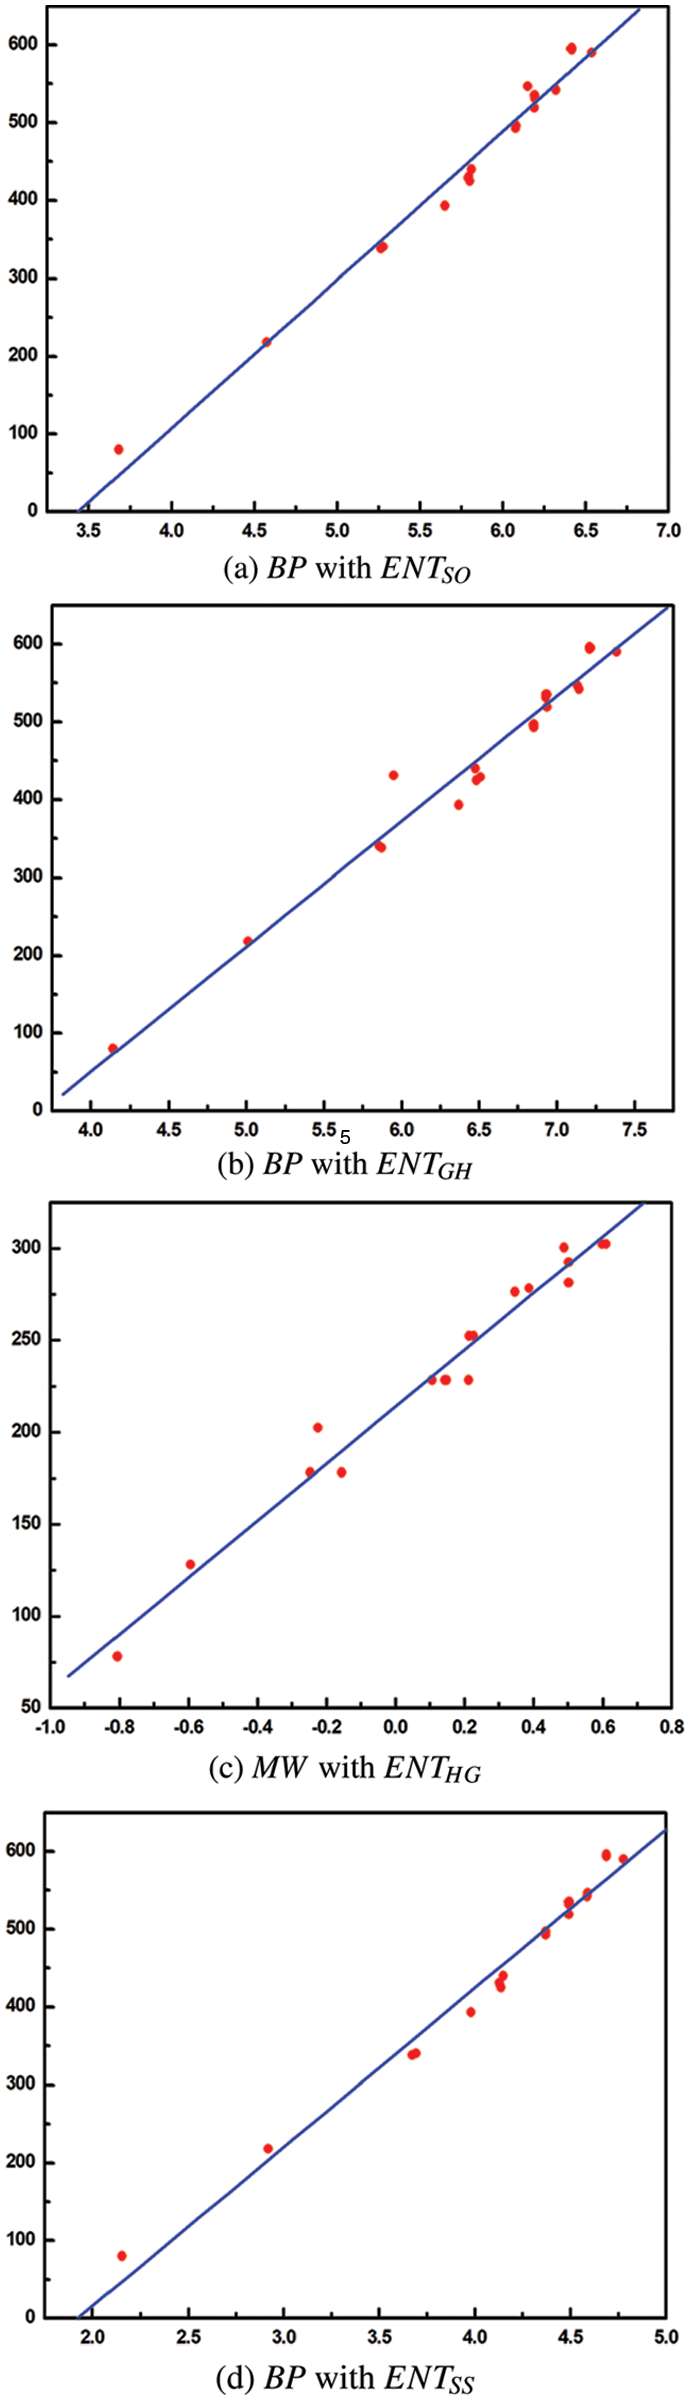
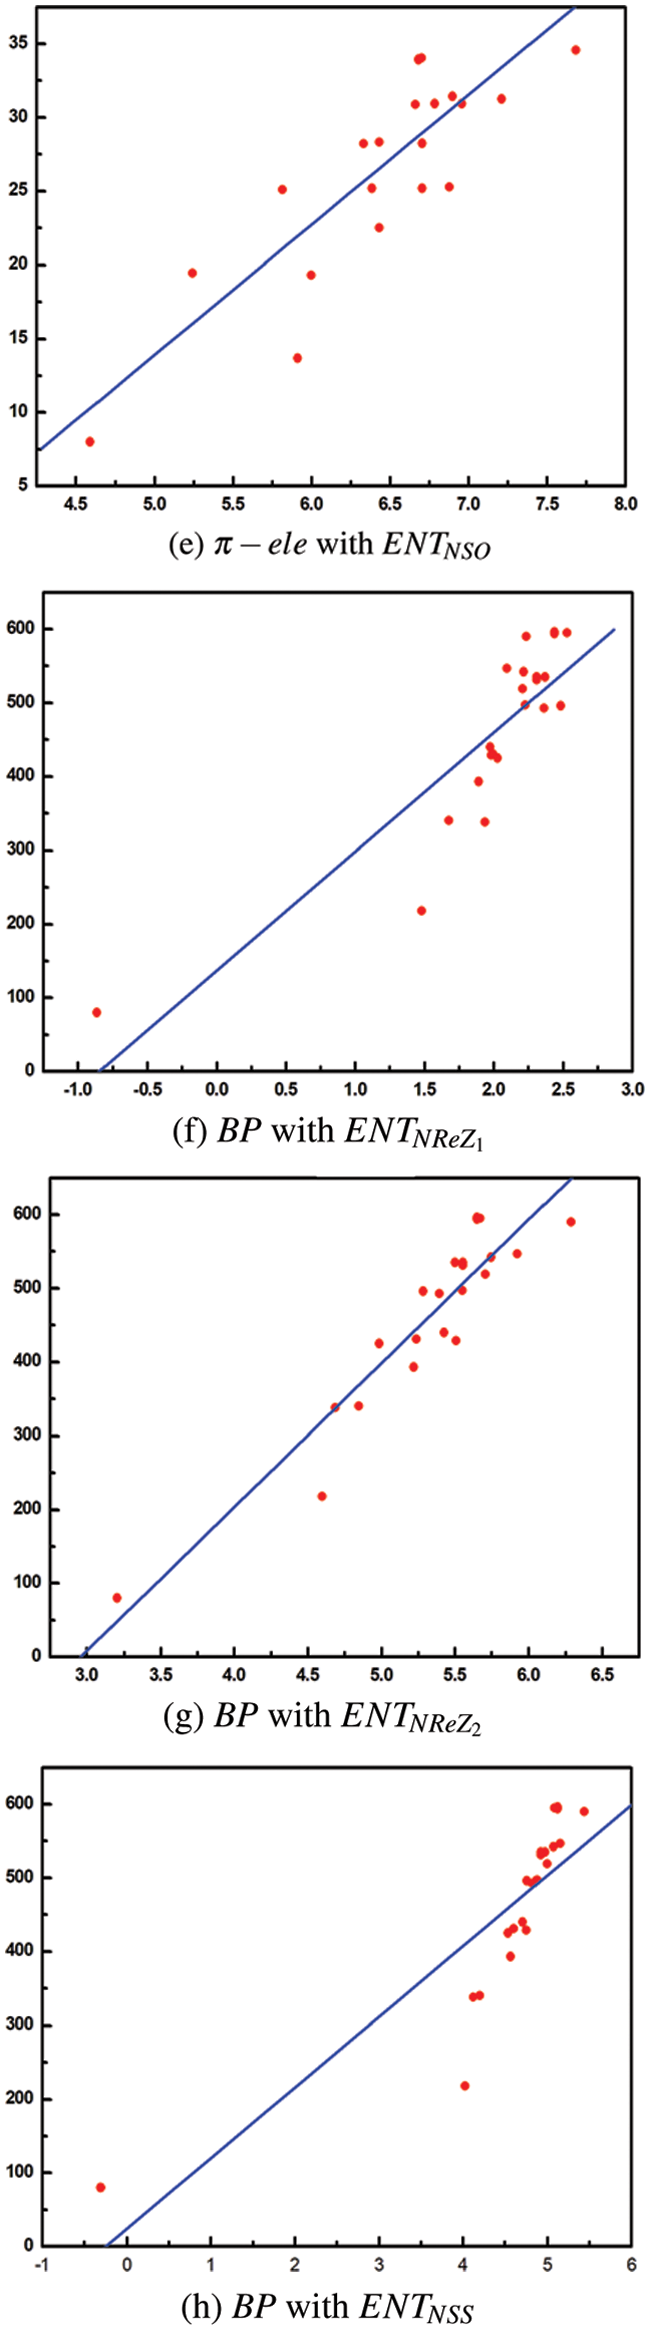
Figure 2: Scatter diagram of physical property with entropy descriptor
By inspection of Table 2, it shows that
From Table 3, it is observed that
From Table 4, it is observed that
From Table 5, it is observed that
From Table 6, it is observed that
From Table 7, it is observed that
From Table 8, it is observed that
From Table 9, it is observed that
2
Graphenylene is a cyclic hydrocarbon, where each hexagon has a square adjacent to it. Two such hexagons separated by a square are termed as biphenylene. Chemically, it is a cyclobutadiene ring in between two benzene rings. Graphenylene is modelled as a molecular graph for which the vertices and edges are computed and details are tabulated in Tables 10 and 11 based on degrees and neighborhood degrees of end vertices respectively. From the Fig. 3, the total number of vertices and edges of Graphenylene are
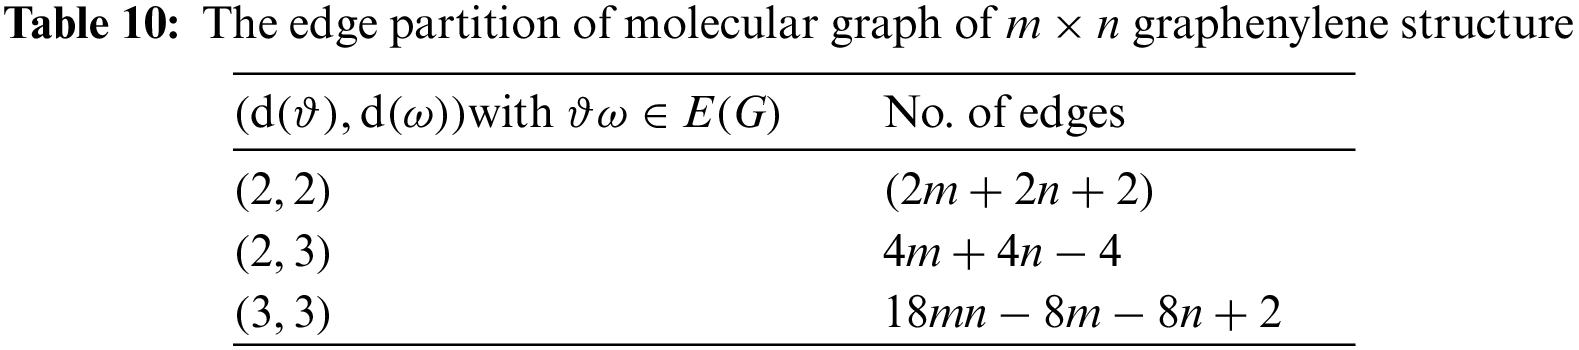
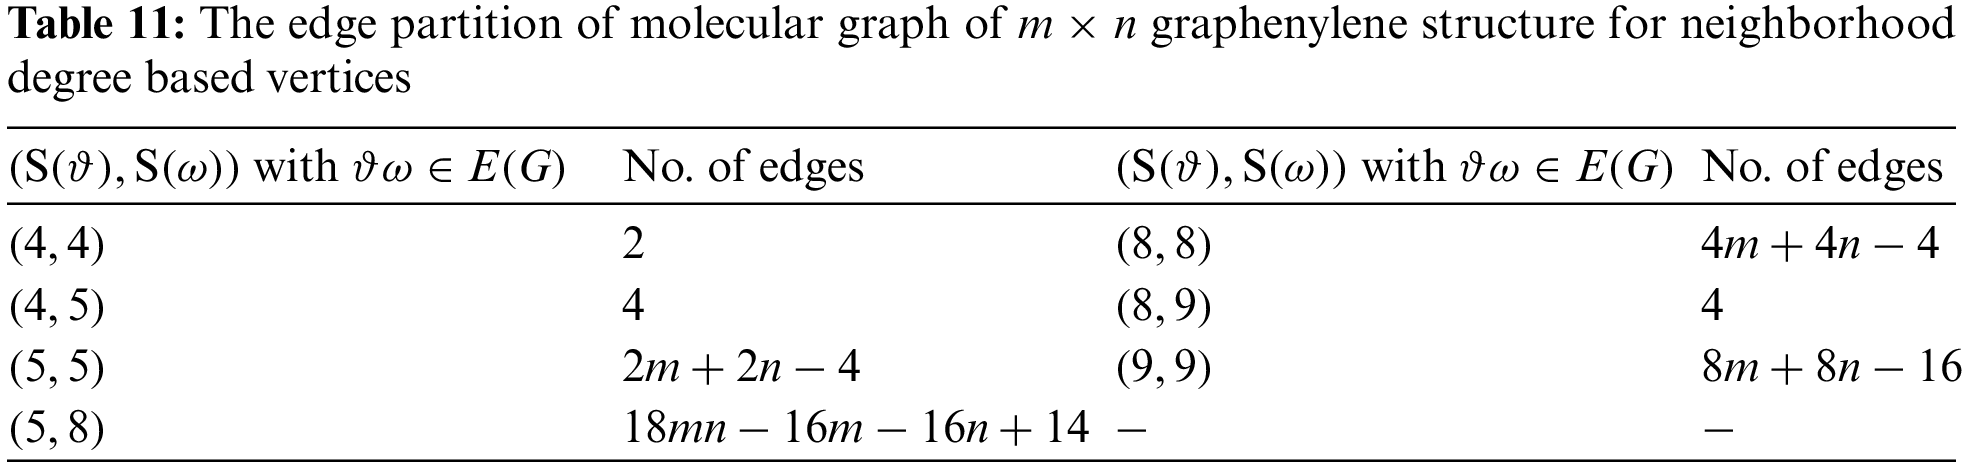
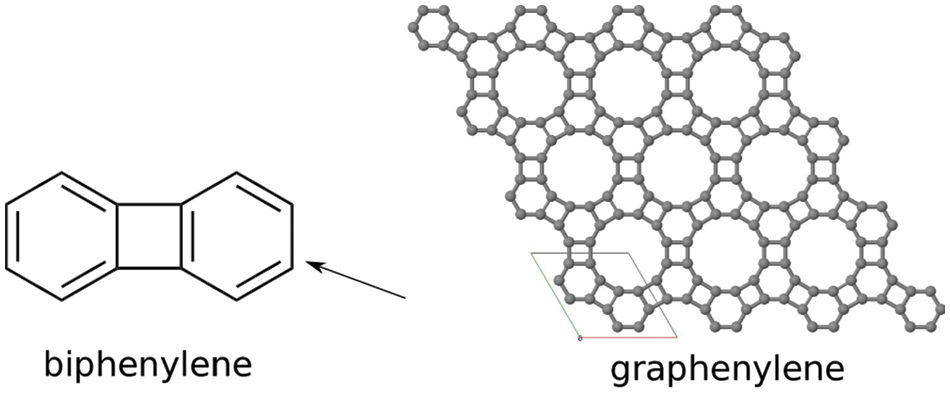
Figure 3: Planar view of
In this section,
2.1 Results for Graphenylene for Degree Based Vertices
Theorem 2.1. Consider graphenylene structure as a molecular graph G, then the Sombor entropy is:
Proof. The Sombor entropy and Sombor index are computed as per the above definitions and Table 10.
Then the Sombor index is given by
The Sombor entropy is computed for graphenylene structure using Eq. (2) and Table 10, which results in:
Theorem 2.2. Consider graphenylene structure as a molecular graph G, then the GH entropy is:
Proof. The GH entropy and GH index are computed as per the above definitions and Table 10.
Then, the GH index is given by
The GH entropy is calculated for graphenylene structure using Eq. (3) and Table 10, results in:
Theorem 2.3. Consider graphenylene structure as a molecular graph G, then the HG entropy is:
Proof. The HG entropy and HG index are computed as per the above definitions and Table 10.
Then, the HG index is given by
The HG entropy is calculated for graphenylene structure using Eq. (4) and Table 10, results in:
Theorem 2.4. Consider graphenylene structure as a molecular graph G, then the SS entropy is:
Proof. The SS entropy and SS index are computed as per the above definitions and Table 10.
Then, the SS index is given by
The SS entropy is calculated for graphenylene structure using Eq. (5) and Table 10, which results in:
2.2 Results for Graphenylene Using Neighbourhood Degree of End Vertices
Theorem 2.5. Consider graphenylene structure as a molecular graph G, then the neighborhood Sombor entropy is:
Proof. The neighborhood Sombor entropy and neighborhood Sombor index are computed as per the above definitions and Table 11.
Then, the neighborhood Sombor index is given by
The neighborhood Sombor entropy is calculated for graphenylene structure using Eq. (6) and Table 11, which results in:
Theorem 2.6. Consider graphenylene structure as a molecular graph G, then
Proof.
The
Then, the
The
Theorem 2.7. Consider graphenylene structure as a molecular graph G, then
Proof. The
Then, the
The
Theorem 2.8. Consider graphenylene structure as a molecular graph G, then neighborhood SS entropy is:
Proof. The neighborhood SS entropy and neighborhood SS index are computed as per the above definitions and Table 11.
Then, the neighborhood SS index is given by
The neighborhood SS entropy is calculated for graphenylene structure using Eq. (9) and Table 11, which results in:
This work is dedicated to defining and discussing the chemical applicability of
There has been a remarkable increase in the applications of graphenylene as it has distinguished mechanical, electrical, and thermal properties. This study provides a way for researchers to study physico-chemical and biological properties of various compounds associated with degree-based entropies.
Funding Statement: The authors received no specific funding for this study.
Conflicts of Interest: The authors declare that they have no conflicts of interest to report regarding the present study.
References
1. Gutman, I., Polansky, O. E. (2012). Mathematical concepts in organic chemistry. New York, Springer Science & Business Media. [Google Scholar]
2. Trinajstic, N. (1992). Chemical graph theory. 2nd edition. Boca Raton: CRC Press. https://doi.org/10.1201/9781315139111 [Google Scholar] [CrossRef]
3. Estrada, E., Torres, L., Rodriguez, L., Gutman, I. (1998). An atom-bond connectivity index: Modelling the enthalpy of formation of alkanes. Indian Journal of Chemistry, 37A(10), 849–855. [Google Scholar]
4. Zheng, J., Iqbal, Z., Fahad, A., Zafar, A., Aslam, A. et al. (2019). Some eccentricity-based topological indices and polynomials of poly(EThyleneAmidoAmine)(PETAA) dendrimers. Processes, 7(7), 433. https://doi.org/10.3390/pr7070433 [Google Scholar] [CrossRef]
5. Hu, M., Ali, H., Binyamin, M. A., Ali, B., Liu, J. B. et al. (2021). On distance-based topological descriptors of chemical interconnection networks. Journal of Mathematics, 2021(7), 1–10. https://doi.org/10.1155/2021/5520619 [Google Scholar] [CrossRef]
6. Shirdel, G. H., Rezapour, H., Sayadi, A. M. (2013). The hyper-Zagreb index of graph operations. Iranian Journal of Mathematical Chemistry, 4(2), 213–220. [Google Scholar]
7. Deepika, T. (2021). VL index and bounds for the tensor products of F-sum graphs. TWMS Journal of Applied and Engineering Mathematics, 11(2), 374–385. [Google Scholar]
8. Ramane, H. S., Joshi, V. B., Jummannaver, R. B., Shindhe, S. D. (2019). Relationship between randic index, sum-connectivity index, harmonic index and π−electron energy for benzenoid hydrocarbons. National Academy Science Letters, 42(6), 519–524. [Google Scholar]
9. Vukicevic, D., Furtula, B. (2009). Topological index based on the ratios of geometrical and arithmetical means of end-vertex degrees of edges. Journal of Mathematical Chemistry, 46(4), 1369–1376. [Google Scholar]
10. Lokesha, V., Deepika, T., Ranjini, P. S., Cangul, I. N. (2017). Operations of nanostructures via SDD, ABC4 and GA5 indices. Applied Mathematics and Nonlinear Sciences, 2(1), 173–180. [Google Scholar]
11. Randic, M. (1975). Characterization of molecular branching. Journal of the American Chemical Society, 97(23), 6609–6615. [Google Scholar]
12. Lokesha, V., Yasmeen, K. Z., Deepika, T. (2019). Edge version of SDD and ISI index for rooted product graphs. Journal of Discrete Mathematical Sciences and Cryptography, 22(6), 1077–1090. [Google Scholar]
13. Zhou, B., Trinajstic, N. (2010). On general sum-connectivity index. Journal of Mathematical Chemistry, 47(1), 210–218. https://doi.org/10.1007/s10910-009-9542-4 [Google Scholar] [CrossRef]
14. Biggs, N., Lloyd, E. K., Wilson, R. J. (1986). Graph theory, pp. 1736–1936. Oxford University Press. [Google Scholar]
15. Randic, M. (1996). Quantitative structure-property relationship. Boiling points of planar benzenoids. New Journal of Chemistry, 20(10), 1001–1009. [Google Scholar]
16. Ulanowicz, R. E. (2004). Quantitative methods for ecological network analysis. Computational Biology and Chemistry, 28(5–6), 321–339. https://doi.org/10.1016/j.compbiolchem.2004.09.001 [Google Scholar] [PubMed] [CrossRef]
17. Furtula, B., Gutman, I. (2015). A forgotten topological index. Journal of Mathematical Chemistry, 53(4), 1184–1190. https://doi.org/10.1007/s10910-015-0480-z [Google Scholar] [CrossRef]
18. Gutman, I. (2013). Degree-based topological indices. Croatica Chemica Acta, 86(4), 351–361. https://doi.org/10.5562/cca2294 [Google Scholar] [CrossRef]
19. Shannon, C. E. (1948). A mathematical theory of communication. The Bell System Technical Journal, 27(3), 379–423. https://doi.org/10.1002/j.1538-7305.1948.tb01338.x [Google Scholar] [CrossRef]
20. Bonchev, D. (1983). Information theoretic indices for characterization of chemical structures. New York: Wiley. [Google Scholar]
21. Dehmer, M., Mowshowitz, A. (2011). A history of graph entropy measures. Information Sciences, 181(1), 57–78. https://doi.org/10.1016/j.ins.2010.08.041 [Google Scholar] [CrossRef]
22. Kazemi, R. (2016). Entropy of weighted graphs with the degree-based topological indices as weights. MATCH Communications in Mathematicaland in Computer Chemistry, 76(1), 69–80. [Google Scholar]
23. Manzoor, S., Siddiqui, M. K., Ahmad, S. (2020). On entropy measures of molecular graphs using topological indices. Arabian Journal of Chemistry, 13(8), 6285–6298. https://doi.org/10.1016/j.arabjc.2020.05.021 [Google Scholar] [CrossRef]
24. Cao, S., Dehmer, M. (2015). Degree-based entropies of networks revisited. Applied Mathematics and Computation, 261(1), 141–147. https://doi.org/10.1016/j.amc.2015.03.046 [Google Scholar] [CrossRef]
25. Dehmer, M., Grabner, M. (2013). The discrimination power of molecular identification numbers revisited. MATCH Communications in Mathematicaland in Computer Chemistry, 69(3), 785–794. [Google Scholar]
26. Manzoor, S., Siddiqui, M. K., Ahmad, S. (2021). On physical analysis of degree-based entropy measures for metal organic superlattices. The European Physical Journal Plus, 136(3), 1–22. https://doi.org/10.1140/epjp/s13360-021-01275-5 [Google Scholar] [CrossRef]
27. Hayat, S., Khan, S., Imran, M. (2021). Quality testing of spectrum-based distance descriptors for polycyclic aromatic hydrocarbons with applications to carbon nanotubes and nanocones. Arabian Journal of Chemistry, 14(3), 102994. https://doi.org/10.1016/j.arabjc.2021.102994 [Google Scholar] [CrossRef]
28. De La Pierre, M., Karamanis, P., Baima, J., Orlando, R., Pouchan, C. et al. (2013). Ab initio periodic simulation of the spectroscopic and optical properties of novel porous graphene phases. The Journal of Physical Chemistry C, 117(5), 2222–2229. https://doi.org/10.1021/jp3103436 [Google Scholar] [CrossRef]
29. Zhang, T. (2018). Synchrotron radiation studies of molecular building blocks for functional materials (Ph.D. Thesis). Uppsala University, Uppsala. [Google Scholar]
30. Rong, J., Dong, H., Feng, J., Wang, X., Zhang, Y. et al. (2018). Planar metallic carbon allotrope from graphene-like nanoribbons. Carbon, 135(3B), 21–28. https://doi.org/10.1016/j.carbon.2018.04.033 [Google Scholar] [CrossRef]
31. Harary, F. (1969). Graph theory. New York, Addison-Wesley Publishing Company. [Google Scholar]
32. Kulli, V. R. (2012). College graph theory. Gulbarga, India, Vishwa Int. Publ. [Google Scholar]
33. van Steen, M. (2010). Graph theory and complex networks. Amsterdam, The Netherlands: Maarten van Steen. 978-90-815406-1-2. [Google Scholar]
34. Gutman, I. (2021). Geometric approach to degree-based topological indices: Sombor indices. MATCH Communications in Mathematical and in Computer Chemistry, 86(1), 11–16. [Google Scholar]
35. Usha, A., Shanmukha, M. C., Anil Kumar, K. N., Shilpa, K. C. (2021). Comparison of novel index with geometric-arithmetic and sum-connectivity indices. Journal of Mathematical and Computational Science, 11(5), 5344–5360. [Google Scholar]
36. Shanmukha, M. C., Usha, A., Siddiqui, M. K., Shilpa, K. C., Asare-Tuah, A. (2021). Novel degree-based topological descriptors of carbon nanotubes. Journal of Chemistry, 2021, 1–15. https://doi.org/10.1155/2021/3734185 [Google Scholar] [CrossRef]
37. Zhao, W., Shanmukha, M. C., Usha, A., Farahani, M. R., Shilpa, K. C. (2021). Computing SS index of certain dendrimers. Journal of Mathematics, 2021(2), 1–14. https://doi.org/10.1155/2021/7483508 [Google Scholar] [CrossRef]
38. Kulli, V. R. (2021). Different versions of Sombor index of some chemical structures. International Journal of Engineering Sciences & Research Technology, 10, 23–32. [Google Scholar]
39. Shanmukha, M. C., Basavarajappa, N. S., Usha, A., Shilpa, K. C. (2021). Novel neighbourhood redefined first and second Zagreb indices on carborundum structures. Journal of Applied Mathematics and Computing, 66(1), 263–276. https://doi.org/10.1007/s12190-020-01435-3 [Google Scholar] [CrossRef]
40. Chen, Z., Dehmer, M., Shi, Y. (2014). A note on distance-based graph entropies. Entropy, 16(10), 5416–5427. https://doi.org/10.3390/e16105416 [Google Scholar] [CrossRef]
41. Basak, S. C., Grunwald, G. D., Niemi, G. J. (2002). Use of graph-theoretic and geometrical molecular descriptors in structure-activity relationships. In: From chemical topology to three-dimensional geometry, pp. 73–116. Boston, MA, Springer. [Google Scholar]
42. Streitwieser, A., Smith, C. M. H. (1965). Dictionary of pi-electron calculations. San Francisco, Freeman. [Google Scholar]
43. Nikolic, S., Trinajstic, N., Baucic, I. (1998). Comparison between the vertex-and edge-connectivity indices for benzenoid hydrocarbons. Journal of Chemical Information and Computer Sciences, 38(1), 42–46. https://doi.org/10.1021/ci970031m [Google Scholar] [CrossRef]
44. Allison, T. C., Burgess Jr, D. R. (2015). First-principles prediction of enthalpies of formation for polycyclic aromatic hydrocarbons and derivatives. The Journal of Physical Chemistry A, 119(46), 11329–11365. https://doi.org/10.1021/acs.jpca.5b07908 [Google Scholar] [PubMed] [CrossRef]
Cite This Article
 Copyright © 2023 The Author(s). Published by Tech Science Press.
This work is licensed under a Creative Commons Attribution 4.0 International License , which permits unrestricted use, distribution, and reproduction in any medium, provided the original work is properly cited.
 Downloads
 Citation Tools