
 Submit a Paper
 Propose a Special lssue
 Open Access
ARTICLE
Research on Evaluation of Multi-Timescale Flexibility and Energy Storage Deployment for the High-Penetration Renewable Energy of Power Systems
1 Economic Research Institute of State Grid, Hangzhou, 310016, China
2 College of Information Engineering, Zhejiang University of Technology, Hangzhou, 310023, China
* Corresponding Author: Changsen Feng. Email:
(This article belongs to the Special Issue: Artificial Intelligence in Renewable Energy and Storage Systems)
Computer Modeling in Engineering & Sciences 2023, 134(2), 1137-1158. https://doi.org/10.32604/cmes.2022.021965
Received 15 February 2022; Accepted 21 March 2022; Issue published 31 August 2022
 View Full Text
 Download PDF
Abstract
With the rapid and wide deployment of renewable energy, the operations of the power system are facing greater challenges when dispatching flexible resources to keep power balance. The output power of renewable energy is uncertain, and thus flexible regulation for the power balance is highly demanded. Considering the multi-timescale output characteristics of renewable energy, a flexibility evaluation method based on multi-scale morphological decomposition and a multi-timescale energy storage deployment model based on bi-level decision-making are proposed in this paper. Through the multi-timescale decomposition algorithm on the basis of mathematical morphology, the multi-timescale components are separated to determine the flexibility requirements on different timescales. Based on the obtained flexibility requirements, a multi-timescale energy resources deployment model based on bi-level optimization is established considering the economic performance and the flexibility of system operation. This optimization model can allocate corresponding flexibility resources according to the economy, flexibility and reliability requirements of the power system, and achieve the trade-off between them. Finally, case studies demonstrate the effectiveness of our model and method.Keywords
Vigorously developing renewable energy and establishing a clean, low-carbon, safe and efficient energy system have been the theme of global energy development since the 21st century [1,2]. High-penetration renewable energy power access to grid is one of the most important and clear development trends of China's power grid in the next decade. Renewable energy represented by wind power, photovoltaic power and hydropower will maintain a rapid development momentum and have an increasingly significant impact on the power grid. Compared with traditional generator sets, the output of wind power and photovoltaic is affected by wind speed, sunshine, weather, season and geographical location, with randomness, fluctuation and intermittence. The uncertainty of wind and photovoltaic power output will impact the power grid in many aspects, such as peak shaving and frequency modulation, dispatching operation, voltage stability and relay protection [3,4]. Therefore, in order to improve the proportion of new energy and in the meantime meet the system's requirements of economy, flexibility and reliability, a reasonable flexibility evaluation method and energy storage allocation scheme are needed to explore the flexibility demand according to the output characteristics of new energy, deploy corresponding flexibility resources and improve power flexibility.
At present, experts and scholars have conducted extensive research on power system flexibility evaluation. In the early research, the system flexibility resource is often scored according to the capacity and output characteristics of each flexibility resource to measure the system flexibility. Although the scoring method has the advantages of simple calculation process and intuitive evaluation results, it cannot reflect the relationship between flexibility resources and flexibility requirements within the system. From the perspective of probability method, Lannoye et al. [5] established the cumulative probability distribution curve of system upward and downward flexible adjustment capacity representing the flexibility resources of the system according to the time series output sequence of each power supply, and then compares the cumulative distribution curve with the time series output curve of system net load, The probability of insufficient ramping resource probability (RRP) and insufficient ramping resource expectation (IRRE) are obtained, and the evaluation of system flexibility is completed from the perspective of probability method. Nosair et al. [6] simulated the sequential operation of each unit in the system, obtains the output of each unit including wind turbine unit and conventional unit, analyses the load shedding and wind power limitation of the system, and quantitatively characterizes the system flexibility by using the probability of insufficient system flexibility and the expectation of insufficient system flexibility. Through production simulation, this method can fully reflect the flexible regulation ability of each unit in the wind-solar access system, but its high computational complexity makes it difficult to apply the method in large-scale power grid system. Li et al. [7] considered the directional characteristics of flexibility, establishes upward flexibility index and downward flexibility index, respectively, and proposes a flexibility evaluation method considering the impact of wind power and load forecasting errors on system flexibility based on Monte Carlo simulation and economic dispatching model.
To sum up, the existing research on flexibility evaluation mainly reflects the flexibility of power system on a specific scale, and it is difficult to quantitatively evaluate the flexibility on multiple different time scales at the same time. Moreover, the consideration of multi-timescale in the above research is based on the first-order difference of net load curve, which cannot independently reflect the differences of flexibility requirements of different time scales. Accordingly, in terms of flexibility resources, it is difficult to effectively distinguish the regulation characteristics of system controllable units on different time scales. The resulting flexibility evaluation method lacks the differentiation of regulation rate, which is not conducive to the programming of flexible power supply. Therefore, how to comprehensively consider the corresponding relationship between flexibility requirements and flexibility resources on multiple time scales, and establish an evaluation method that can reflect the multi-timescale flexibility of the system is a problem worthy of research. Reference [8] proposed a flexibility evaluation method based on multi-scale morphological decomposition, which obtains multi-scale components through multi-scale morphological filtering to reflect the multi-time scale flexibility requirements of the system. The decomposition principle of multi-scale morphological filtering can be referred to reference [9].
As an important flexible regulation power supply, energy storage has been widely studied in the related applications of new energy access power system, and the energy storage technologies represented by pumped storage, battery energy storage, flywheel energy storage and super capacitor energy storage have also been more mature. Based on the method of empirical formula, reference [10] defined the peak load regulating capacity ratio as the ratio of energy storage adjustable capacity to maximum installed capacity, generalizes the concept to the power grid, and then optimizes the allocated capacity of the pumped storage unit with the objective of optimizing the comprehensive peak regulating ability of the power grid. From the perspective of power grid managers, reference [11] studied the energy storage configuration under large-scale photovoltaic access, and establishes a bi-level planning model with the objective of optimizing the improvement effect of system voltage fluctuation and minimizing the energy storage allocation capacity, considering the power grid operation constraints and energy storage operation constraints. From the perspective of power supply side, reference [12] optimized the allocation of energy storage battery capacity with the goal of smoothing the fluctuation of photovoltaic output and the longest utilization time under the unit cost of energy storage battery. Reference [13] considered the influence of the charging and discharging times and charging and discharging depth of the energy storage battery on its service life, establishes the life attenuation model of the energy storage battery, considers the optimization of the battery life in the energy storage operation strategy, and carries out the energy storage configuration of wind power. Reference [14] analysed and quantifies the impact of energy storage on the peak shaving and valley filling capacity, power quality level and feeder power active regulation capacity of active distribution network, and constructs the optimal allocation model of energy storage aiming at the optimal impact of energy storage on these three aspects. Reference [15] respectively aimed at the optimal operation stability and economy of the system, and solves the multi-objective problem based on the bi-level decision-making model. By comparing the cycle life and allocation cost of super capacitor and battery in different scenarios, reference [16] proved that the complementary allocation of two energy storage can effectively improve the operating environment of each energy storage and improve the cycle life of energy storage. Considering the complementarity of output of pumped storage and new battery energy storage on long-time scale and short-time scale, and based on the constraint of output fluctuation rate of wind power grid connected system, reference [17] established a hybrid energy storage allocation model composed of pumped storage and battery energy storage with the goal of minimizing energy storage investment cost and operation cost. Reference [8] proposed a multi-scale energy storage allocation model based on bi-level programming, and established a hybrid energy storage allocation model composed of pumped storage, liquid flow battery and super capacitor with the goal of minimizing energy storage investment cost and operation cost.
To sum up, at present, there are relatively mature methods for building a single energy storage deployment model. The research on participation of multiple energy storage in deployment is mainly focused on battery and super capacitor energy storage deployment in the context of small-scale wind power and photovoltaic access to micro-grid. Large-scale wind power and photovoltaic access to large power grid is an irresistible development trend. Energy storage system's economy and operation characteristics of large power grid are different from those of the micro-grid. Therefore, the research on hybrid energy storage deployment of the power grid with large-scale wind and photovoltaic access to is a positive exploration for the future power grid.
Under the above background, this article proposes a multi-scale evaluation strategy to evaluate the output characteristics of wind power and photovoltaic, establishes a multi-scale flexibility evaluation method based on morphologically decomposed flexibility requirements. Then according to the multi-timescale characteristics of flexibility demand of power system with renewable energy, a multi-scale energy storage system framework is constructed and a multi-scale energy storage deployment model based on bi-level decision-making is established considering the economy of energy storage allocation and the flexibility of system operation.
2 Net Load Forecasting Based on Bayesian Neural Network
2.1 Principle of Bayesian Deep Neural Network
Compared with other deep networks, Bayesian neural network has a special probabilistic layer structure, which can achieve a more stable prediction model according to a small amount of data. At the same time, the weight and bias of neurons in the probabilistic layer obey a certain probability distribution, which gives it the ability to describe uncertain variables. Bayesian neural network can be regarded as a conditional distribution model. X, Y and W are used to represent the neural network input, predicted value and weight. Then the principle of Bayesian reasoning can be described by Eq. (1):
where
For general neural networks, it is necessary to design the objective function or loss function, and obtain the optimal neural network parameters through optimization methods such as random gradient descent algorithm or adaptive motion estimation (Adam). Bayesian neural network carries out weighted average on multiple groups of data, that is, integrating the whole weight space. In addition, the training of general neural network needs a lot of data, so it is difficult to obtain the mean variance of
As shown in the Fig. 1,
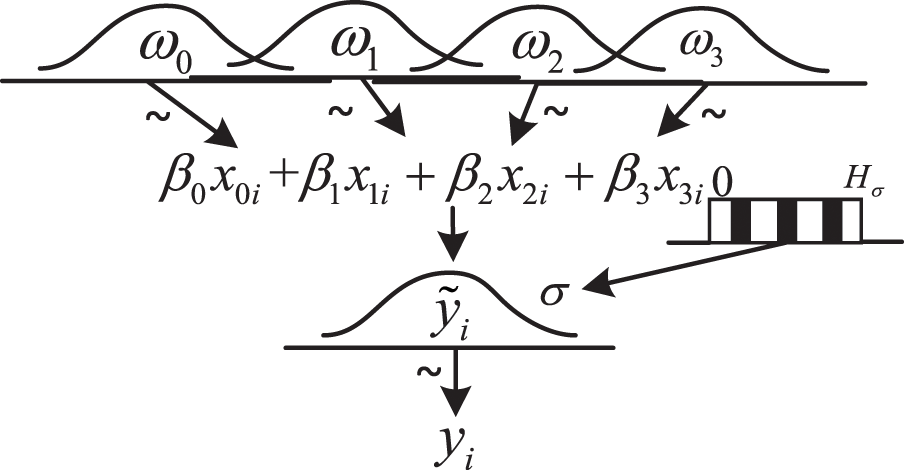
Figure 1: Structure of the probability layer of the Bayesian neural network
2.2 Net Load Forecasting Based on Bayesian Deep Neural Network
The net load distribution probability is determined by the PV output distribution and the wind turbine output distribution. Therefore, firstly, the light intensity with the most significant impact on photovoltaic output and the wind speed with the most important impact on wind turbine output are preprocessed for neural network input. Secondly, due to the time coupling characteristics of photovoltaic, wind turbine and load, the output of photovoltaic and wind turbine at the current time should also be input in the neural network. Finally, the net load is the difference between the supply power and the demand power, and the load power at time t should be added to the input. Based on this, the probability distribution of net load can be obtained in Bayesian neural network. The predicted results of net load probability distribution on a typical day are as follows:
It can be seen from Fig. 2 that the net load forecasting model based on Bayesian depth network has high accuracy. The larger prediction interval at 7:00 is due to the obvious sudden change of photovoltaic output at this time. After 17 o'clock, the photovoltaic output is basically 0, and the impact of net load prediction results comes from the wind turbine.
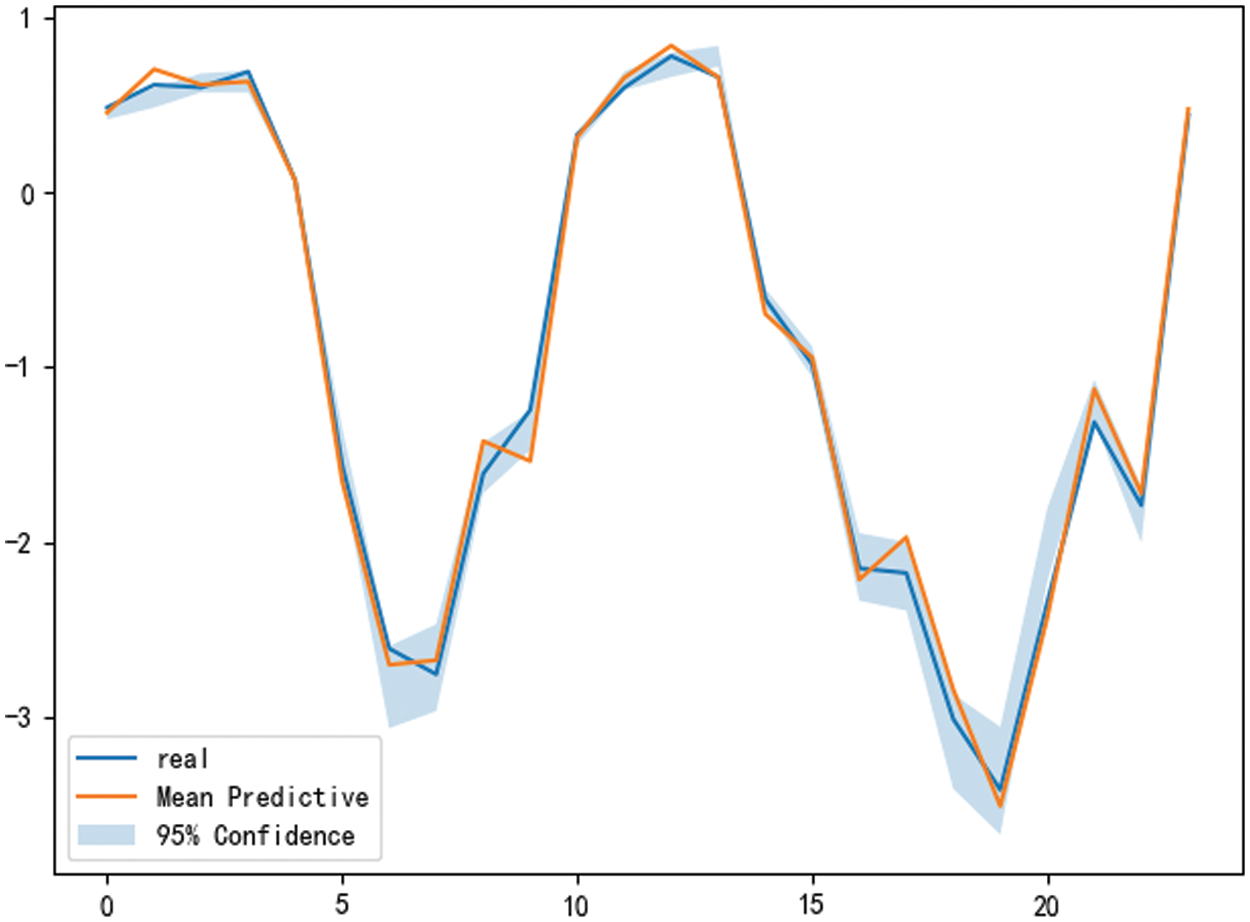
Figure 2: Prediction results of net load
3 Multi-Timescale Flexibility Evaluation
Considering the impact of multi-timescale flexibility demand caused by multi-timescale output of wind power and photovoltaic, a power system flexibility evaluation method based on multi-scale morphology is proposed to effectively distinguish multi-timescale flexibility requirement.
3.1 Flexibility Requirement Analysis Based on Multi-Scale Morphology
The power fluctuation of wind power, photovoltaic power and other new energy power generation has multi-timescale characteristics. New energy output and load can both be regarded as the power disturbance source of the power grid. The net load curve formed by the superposition of new energy output and grid load shows the fluctuation characteristics on multiple time scales different from the original load curve, which puts forward new requirements for flexible regulating ability of the grid-controlled power supply. Starting from demand analysis, this article uses mathematical morphology algorithm to decompose the fluctuation of different frequency bands of the net load curve, and extract upward and downward flexibility requirements under different fluctuation rates, so as to realize the classification, evaluation and deployment of available flexibility resources.
Expansion operation and corrosion operation are the most basic operations of mathematical morphology. Let the input signal
where
Generally, corrosion and expansion are irreversible operations. The results of corrosion before expansion and expansion before corrosion are usually different. Therefore, new morphological transformations are produced, namely opening operation and closing operation. The opening and closing operations are expressed as
where
Different cascading of opening and closing operations can form a variety of filters, of which OCCO filter is more commonly used. In this article, a cluster weighted multi-scale morphology filter (WMMF) is constructed. The filtering results of the target signal using multi-scale structural elements are weighted and superimposed, and the waveform decomposition under custom divided fluctuation period is realized. The mathematical expression of WMMF filter is
where
The steps of mathematical morphological decomposition algorithm based on WMMF filter mainly include:
(1) Construct different structural elements of each time scale;
(2) Calculate the OCCO filtering results on each time scale;
(3) The filtering results on each time scale are weighted and superimposed to form WMMF filtering results.
Combined with the fluctuation characteristics of wind power and photovoltaic and the regulation rate distribution of conventional power supply, the net load fluctuation can be divided into three frequency bands: fast, medium and slow, and their flexibility requirements are evaluated respectively. Therefore, two series WMMF filters are designed to decompose the input signal. The input net load time series is first separated into high-frequency fluctuation series and residual component series with medium and low frequency fluctuations by the first stage WMMF filter. After the latter passes through the second stage WMMF filter, the low frequency and intermediate frequency fluctuation sequences are obtained, respectively. The multi-scale morphological decomposition effect is shown in Fig. 3.
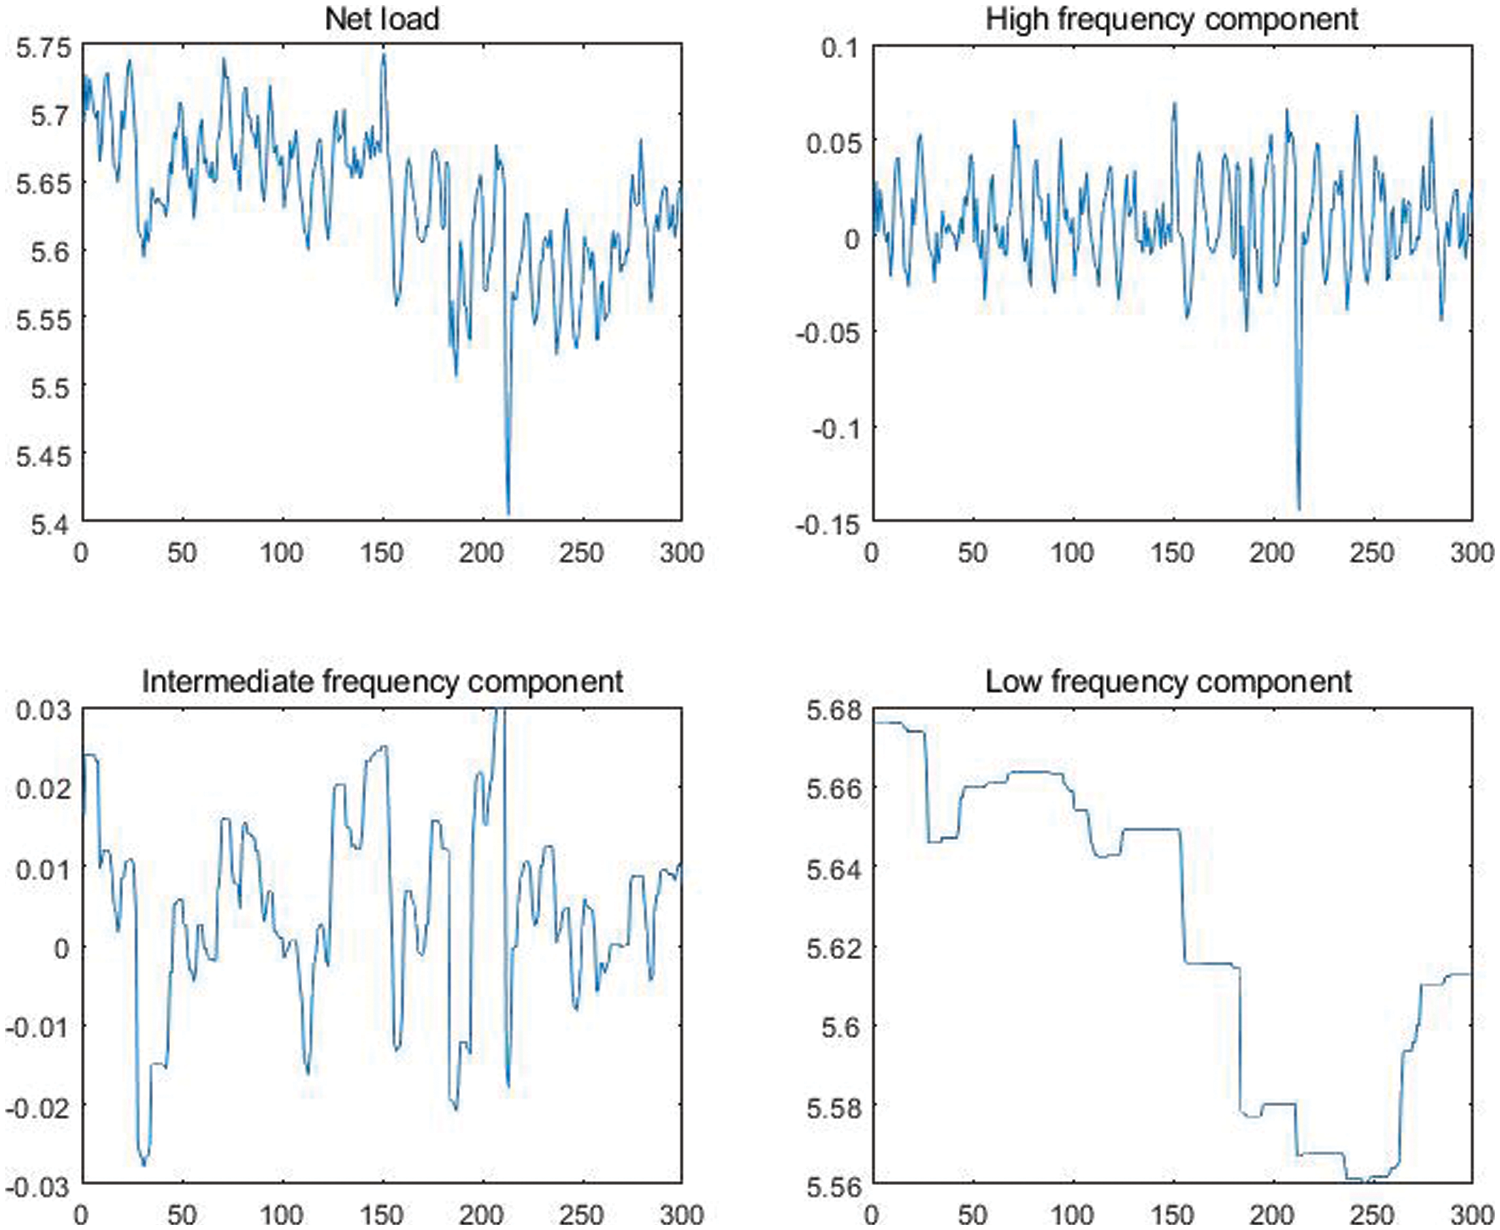
Figure 3: Multi-scale morphological decomposition schematics
System flexibility evaluation includes two directions: upward adjustment and downward adjustment. After decomposing the fluctuation components of different time scales, the fluctuations of different scales correspond to different regulation rate requirements. Through waveform identification, the fluctuation curve is divided into upward and downward climbing subsets. The amplitude of the climbing section in the climbing subset represents the flexibility demand of the climbing section, and the duration represents the fluctuation period of the climbing section. The length of the fluctuation period under different fluctuation components should correspond to its specified time scale. Taking the intermediate frequency component obtained by the above filtering result as an example, the flexibility demand analysis is carried out, and the effect diagram of the flexibility demand is shown in Fig. 4.
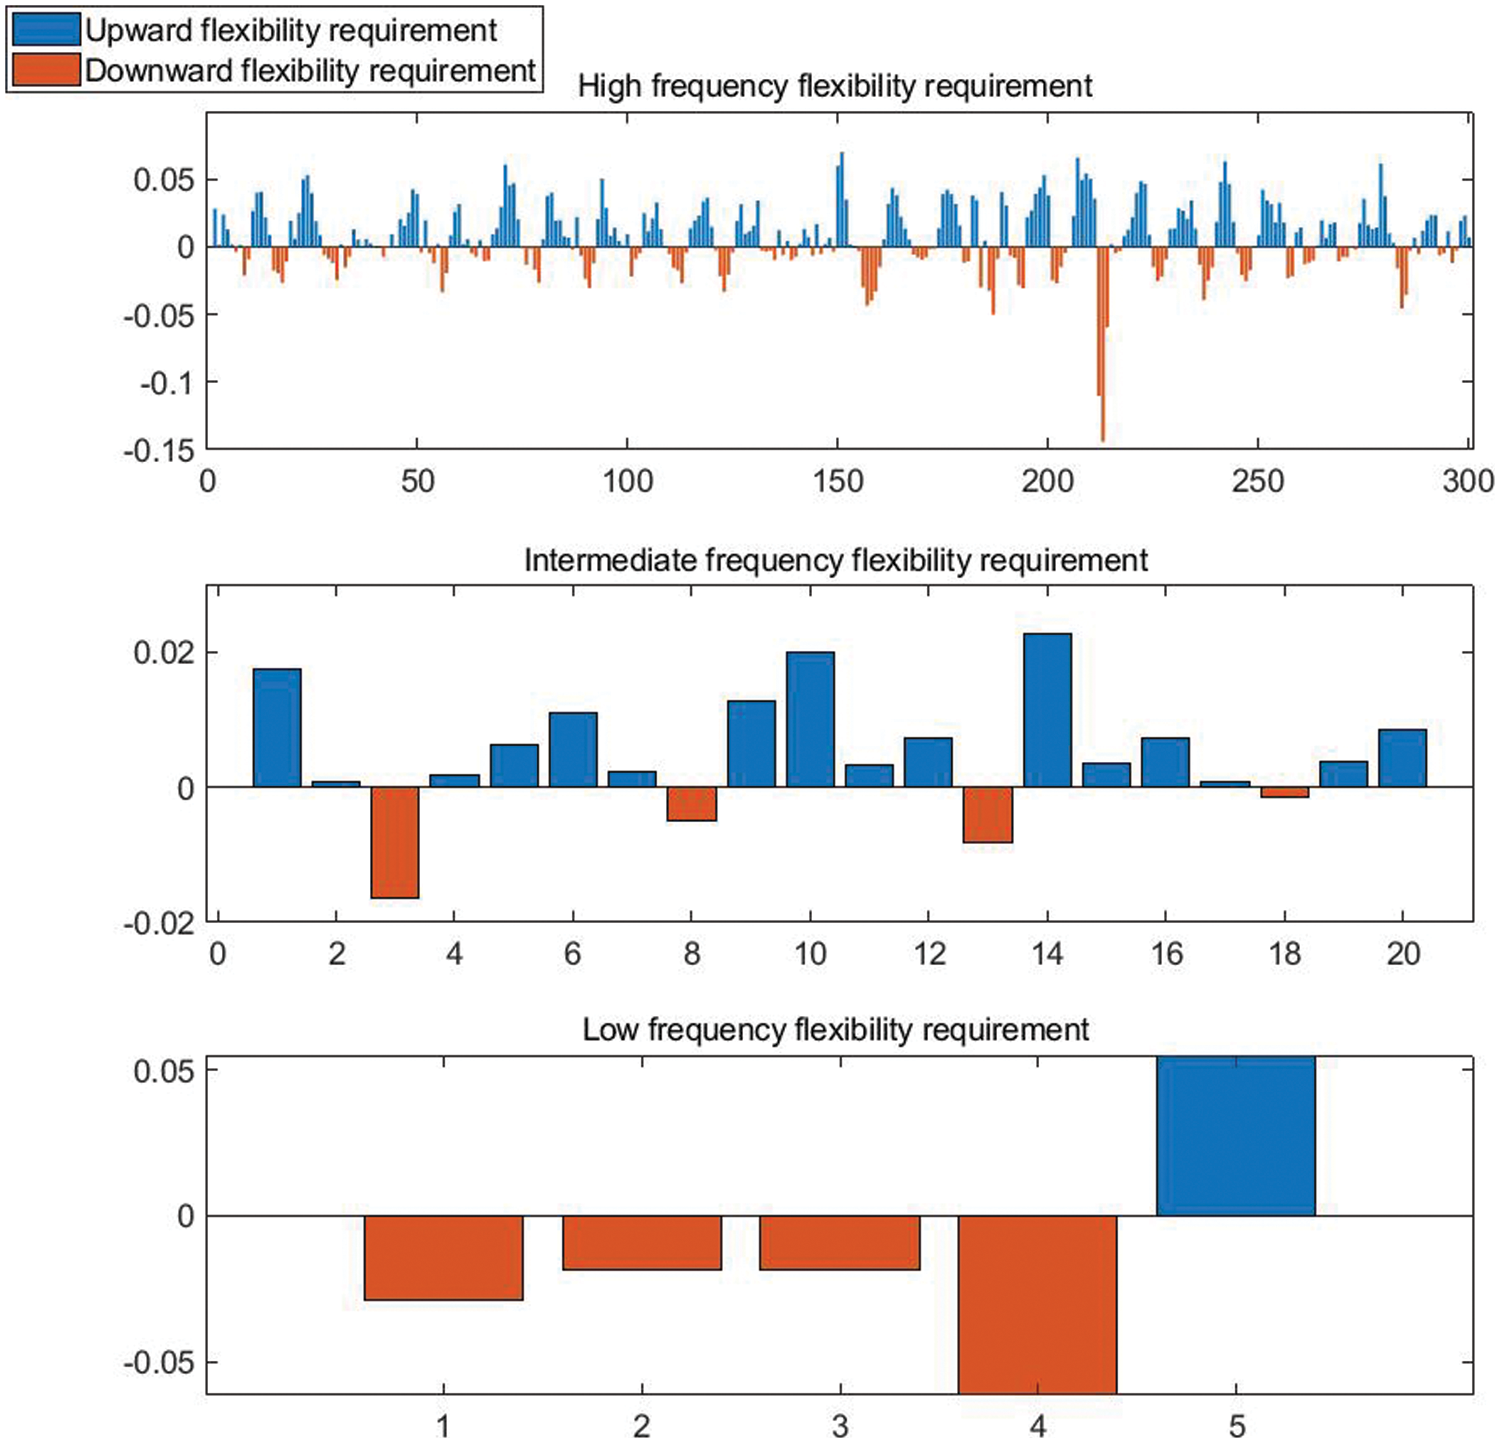
Figure 4: Multi-scale flexibility requirements schematics
3.2 Multi-Timescale Flexible Resource Analysis
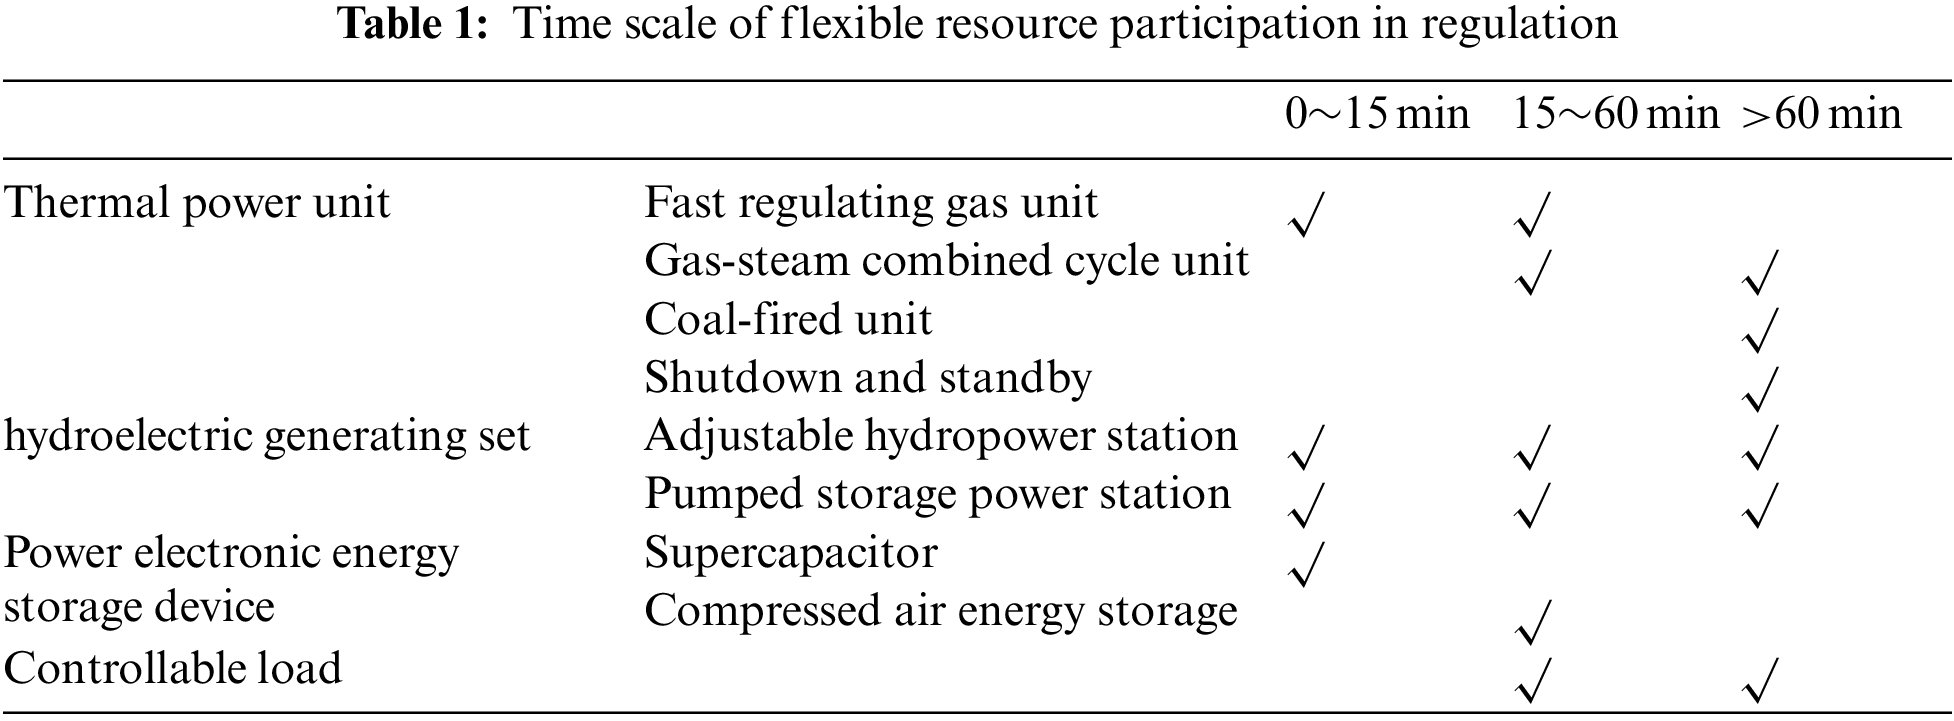
The size of system flexibility resources is relative with fluctuation period, operation state of each unit and output regulation characteristics of the unit itself. The same flexible resource has different output regulation characteristics under different time scales, and the output regulation characteristics of different flexible resources are also different under the same time scale. The regulation capacity models of different types of controllable units in the system under different fluctuation time scales are shown in Table 1.
3.3 Flexibility Analysis Steps
(1) The daily net load curve is forecasted according to the output curves of load, wind power and photovoltaic, and a large number of sample data are simplified into a few representative typical modes.
(2) Based on the multi-scale morphological algorithm, the daily net load curve is decomposed in multiple time scales and divided into net load component curves under multiple fluctuation frequency bands. The upward/downward flexibility requirements of each time scale are obtained by dividing the upward climbing set and downward climbing set through waveform identification.
(3) Analyze the upward/downward flexible resources under different fluctuation time scales according to the operation status, output regulation characteristics and fluctuation period of each controllable unit.
(4) Through the matching analysis of flexible resources and requirements on the same time scale, guidance is provided for multi-timescale energy storage deployment afterwards.
4 Multi-Timescale Energy Storage Deployment
In order to meet the flexibility requirements on multiple time scales, according to the technical characteristics and application scenarios of various energy storage units, energy storage capacity is programmed for pumped storage unit, all vanadium redox flow battery on hourly, 15-minute scales, respectively. A multi-scale energy storage optimal deployment method based on bi-level decision-making is proposed.
4.1 Energy Storage Capacity Deployment Model
In the power and capacity deployment of energy storage system, planning and operation are nested. In addition to the flexibility requirements of the system operation, it is also necessary to consider the economy of deployment results, including energy storage investment cost and system operation cost, so as to achieve balance in the conflict between the two. Therefore, it is necessary to establish a multi-scale energy storage capacity deployment model with double-layer nested optimization.
The outer layer of the model is responsible for making decisions on the power and capacity of the energy storage deployment, considering the impact of the energy storage allocation scheme on the investment cost of the system, the operation cost and lack of flexibility penalty caused in the system operation, in order to optimize the power and capacity deployment of the energy storage system with the goal of optimal economy. The inner layer of the model is the flexible operation layer on multiple time scales. Based on the deployment scheme obtained by the outer layer optimization, the flexible operation of different types of units on each scale of the system is considered, and the results are output to the outer layer to realize the nested optimization of the inner and outer layers. Fig. 5 is the structure diagram of energy storage deployment model.
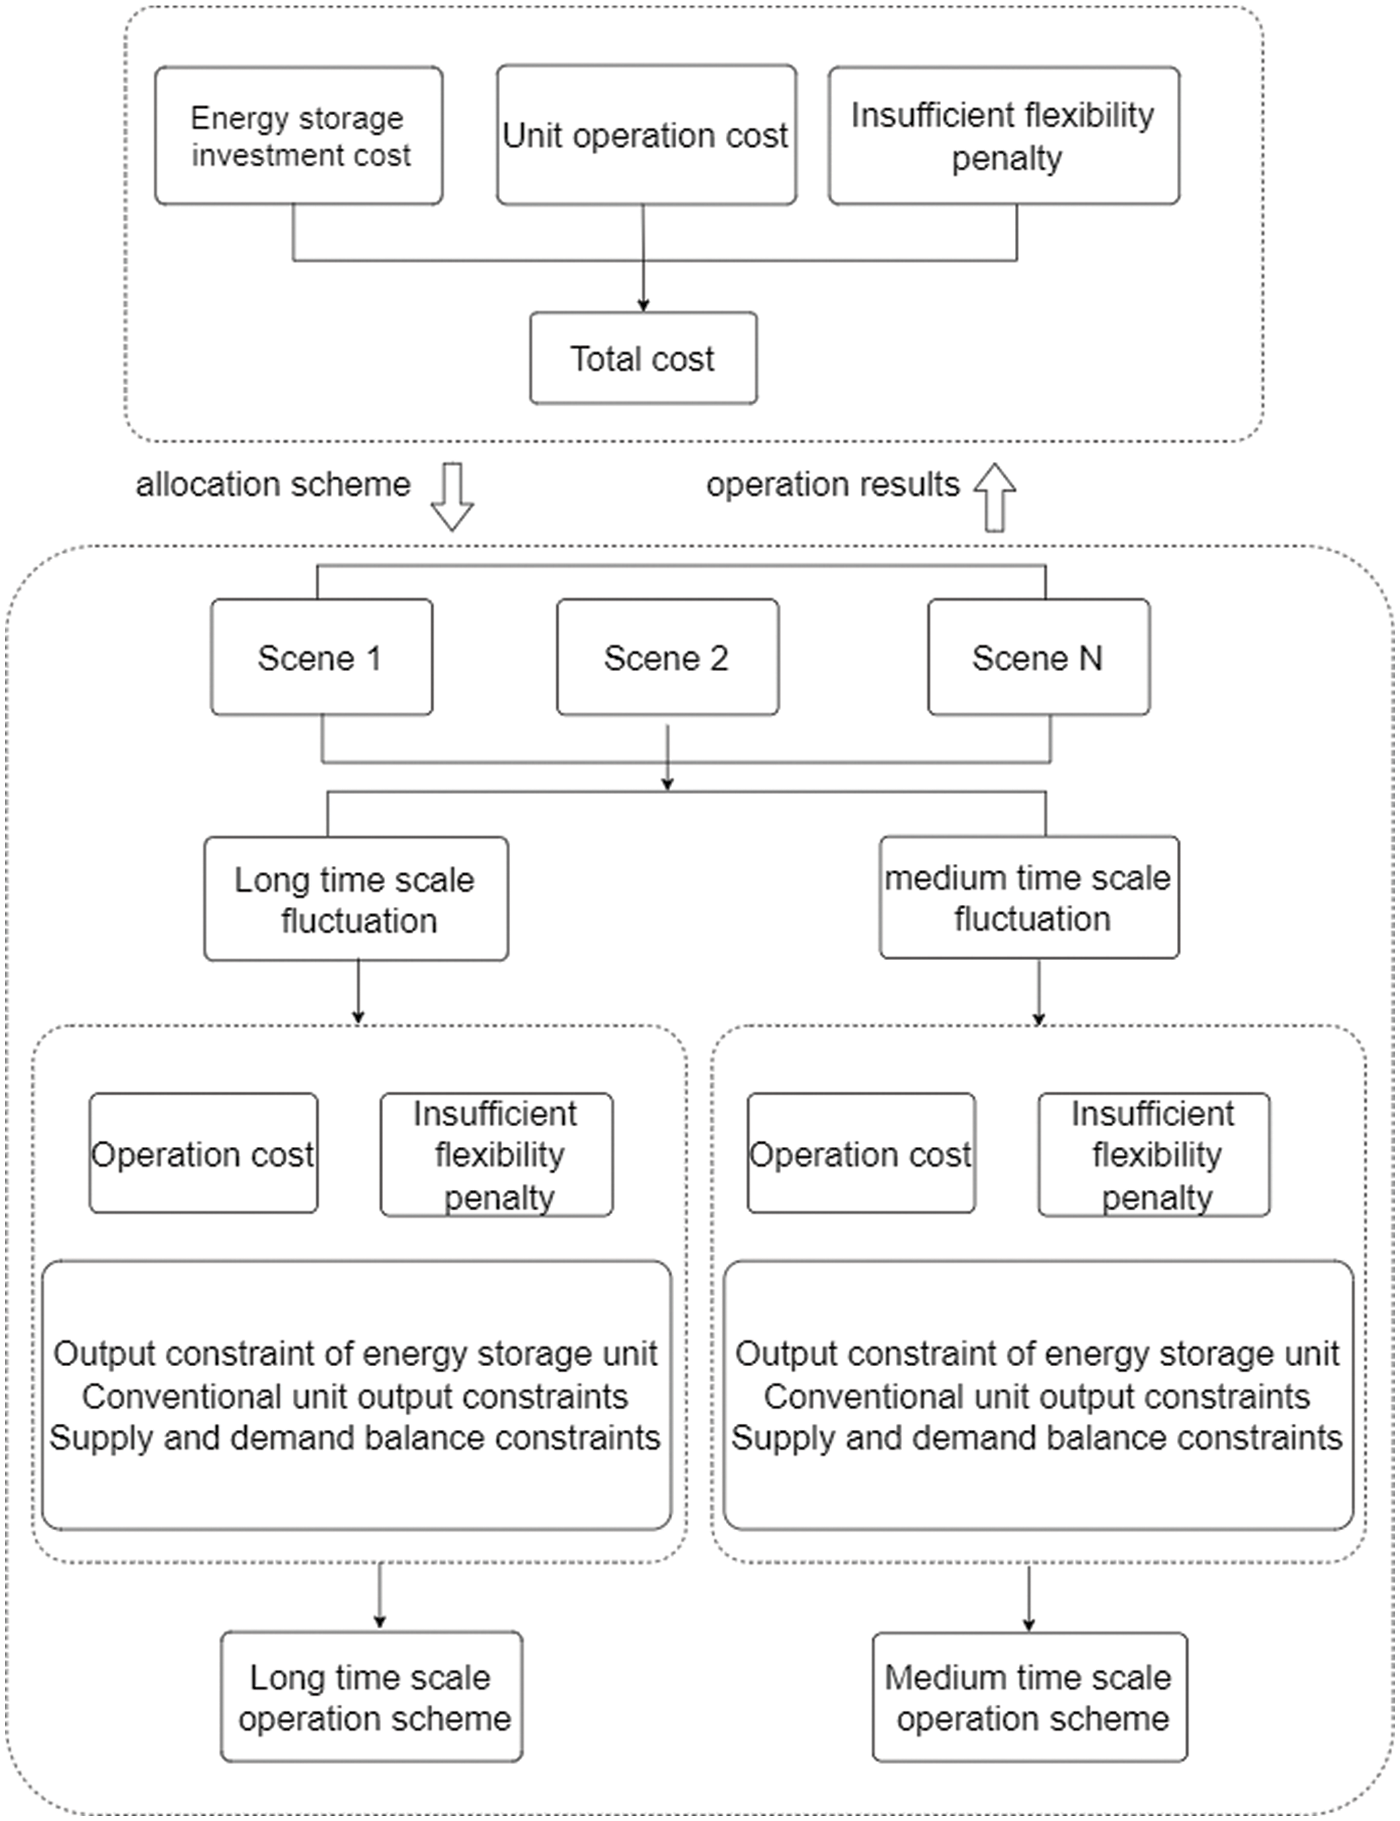
Figure 5: Structure diagram of energy storage deployment model
4.1.1 Outer Layer Optimization Model
The outer model is the planning layer of energy storage deployment. According to the system operation output from the inner optimization model, considering the energy storage investment cost, system unit operation cost and lack of flexibility penalty, the planning problem of energy storage capacity and power allocation is solved with the goal of minimizing the total flexibility investment cost of power system.
Objective function:
where
where
Constraints:
The rated power and rated capacity allocated for each time scale shall be within the upper and lower limits of energy storage output power and output capacity.
4.1.2 Inner Layer Optimization Model
Based on the energy storage allocation scheme on each time scale calculated by the outer model, the inner model optimizes the flexible operation of various types of units in the system on each scale.
In the inner multi-scale optimization model, the units on the short time scale need to adjust their output on the base of long time scale operation scheme, and the unit operation scheme on hourly timescale will affect the upward and downward adjustment space of gas units on 15-minute time scale. Firstly, according to the multi-scale morphological filter, the output curve of new energy is decomposed into two different time scales: 1-hour level, 15-minute level. Then, the scenarios on the hourly timescale are optimized, the operation of flexible units on 15-minute timescale is adjusted on the basis of the units’ operation scheme on hourly timescale. Thus, the optimal operation of multi-scale flexible power supply is realized, and the operation results of each scale are transmitted to the outer layer.
(1) Hourly scale
On the hourly timescale, the system operation with the participation of conventional thermal power unit and pumped storage unit is optimized in order to meet the balance of system supply and demand, improve the economy of system operation.
Constraints of coal-fired and gas unit:
The output of gas unit is constrained by the upper and lower limits of unit output and climbing capacity.
Constraints of energy storage unit:
The output of the energy storage unit is constrained by its stored power and the upper and lower limits of charge and discharge.
Constraints of insufficient flexibility:
When the upward flexible regulation capacity of the system power supply is insufficient to track the downward fluctuation of new energy output, cut off the power load of the system to maintain the balance between supply and demand of the system, which results in corresponding punishment for insufficient upward flexibility. When the downward flexible adjustment ability of the system power supply is insufficient to meet the requirements of rapid load reduction, the supply and demand balance of the system is maintained by cutting off the wind and photovoltaic power, causing the corresponding punishment for insufficient downward flexibility.
Constraint of electric power balance:
The sum of the load output, wind power and photovoltaic power is equal to the sum of the conventional unit output, pumped storage unit output, load shedding power, wind power and photovoltaic power.
(2) 15-minute scale
Based on the power operation scheme of hourly timescale and according to the net load fluctuation on 15-minute time scale, the regulated output of 15-minute flexibility unit including gas unit and all vanadium redox flow battery storage device is optimized.
Constraints of gas unit:
The output of gas unit is constrained by the upper and lower limits of unit output and climbing capacity.
Constraints of energy storage unit:
The output of the energy storage unit is constrained by its stored power, the upper and lower limits of charge and discharge.
Constraints of insufficient flexibility:
Constraint of electric power balance:
The sum of
5.1 Flexibility Demand Analysis of a Typical Day
The net load curve of a typical day is forecasted based on Bayesian deep neural network, and the mathematical morphology algorithm is used to decompose the net load fluctuation of different frequency bands, as shown in Fig. 6. Extract the upward and downward flexibility requirements under different fluctuation rates. Fig. 7 shows the resulting low-frequency requirements.
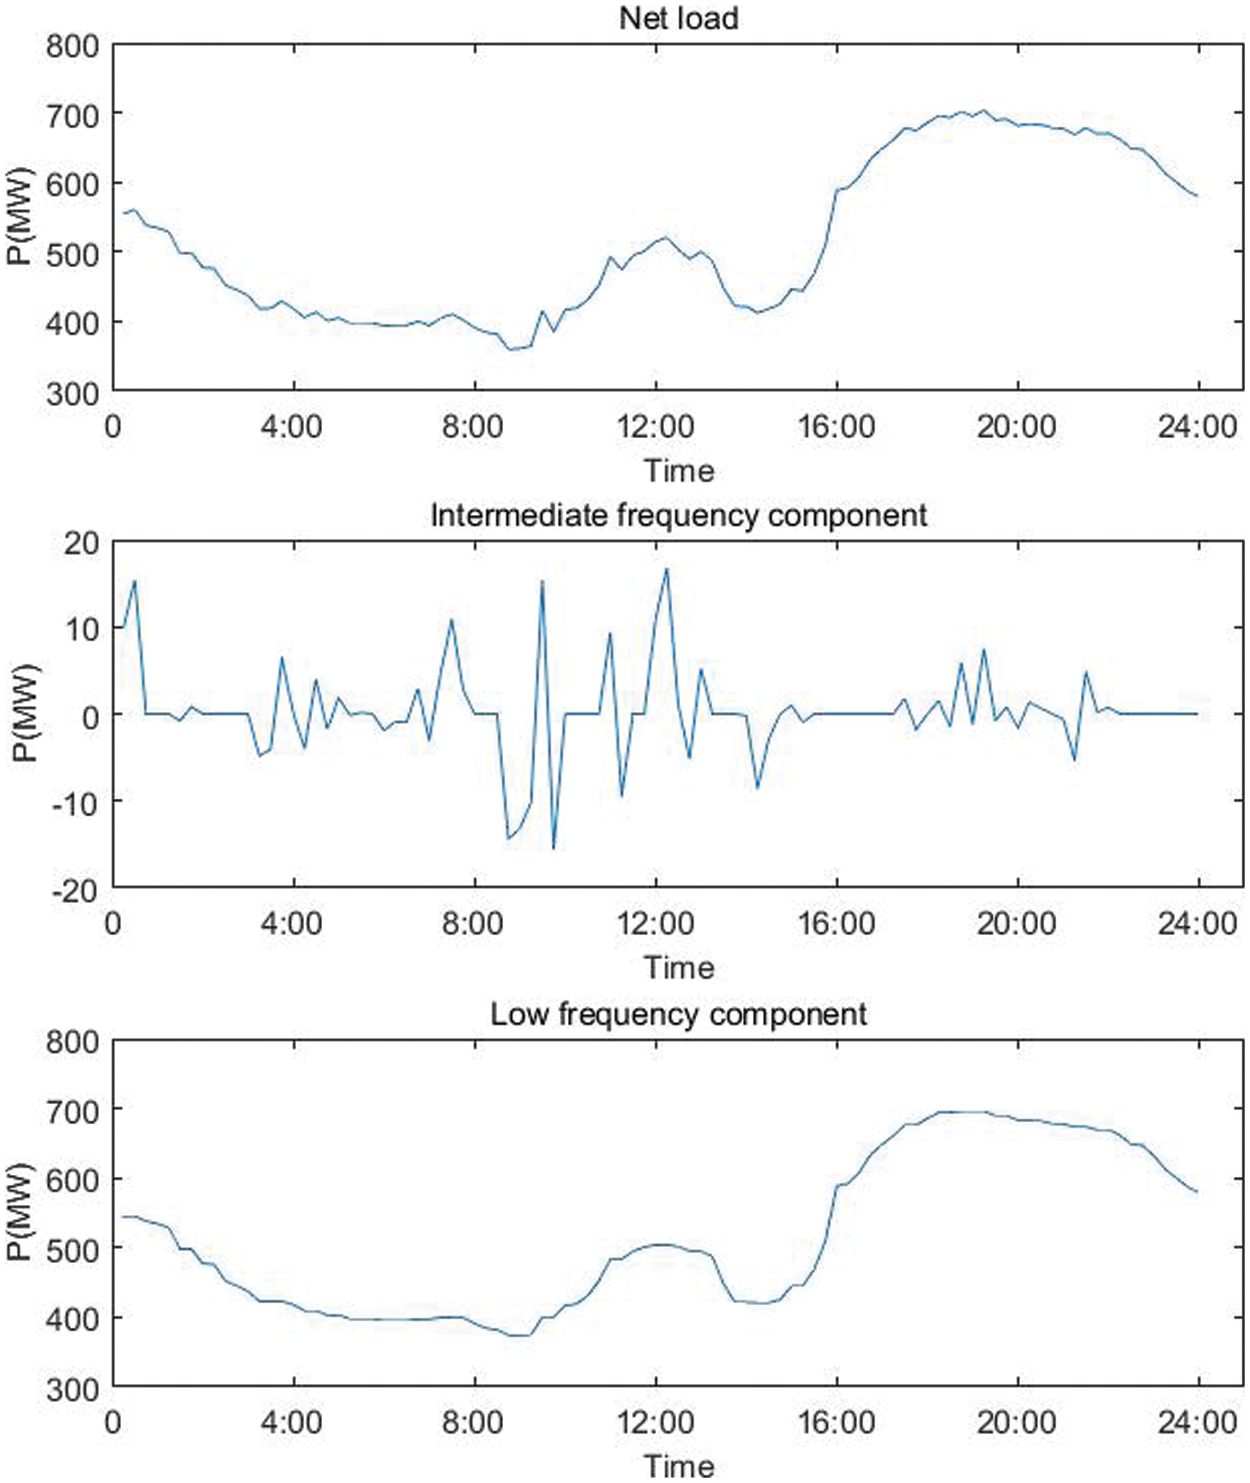
Figure 6: Multi-scale morphological decomposition of typical daily net load curve
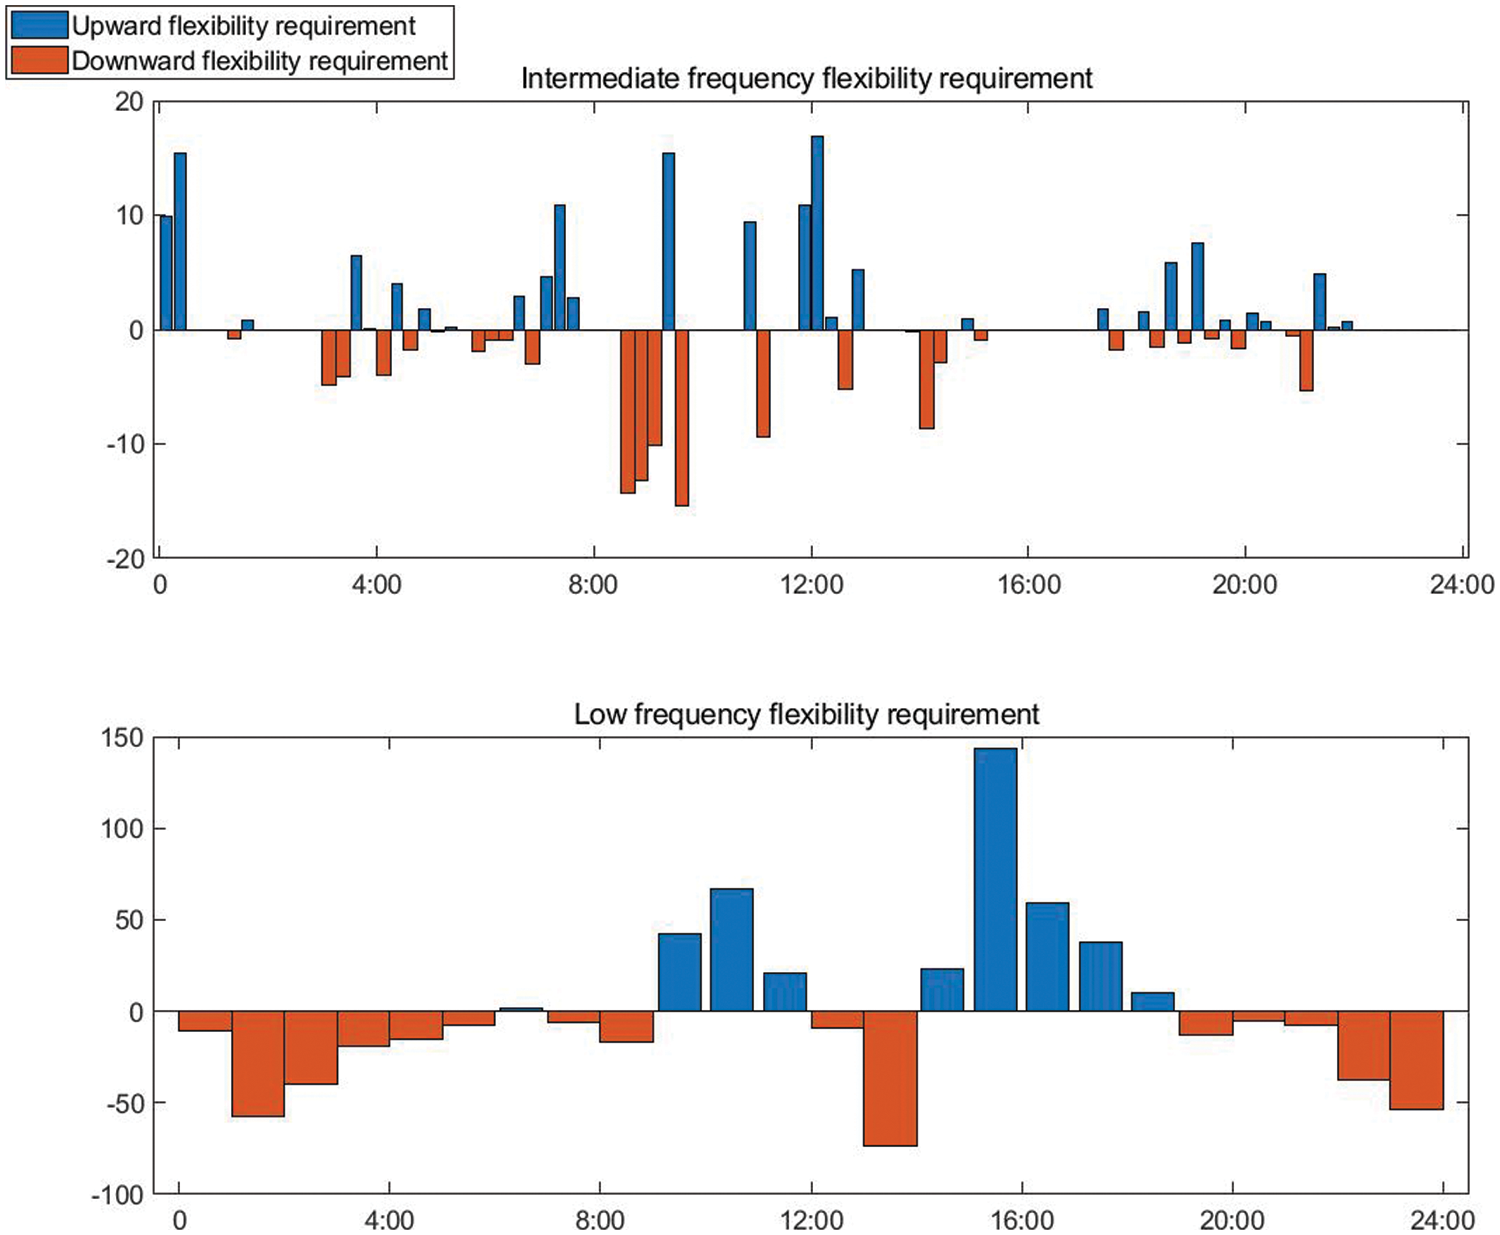
Figure 7: Intermediate and low frequency flexibility requirements of typical day
On the basis of flexibility demand analysis and according to the technical characteristics of various energy storage units, the energy storage units are divided into two types of flexible regulation units acting on the system's flexibility requirements of different time scales, namely, 1-hour timescale flexible regulation units represented by pumped storage units and 15-minute time scale flexible regulation units represented by all vanadium redox flow batteries, The flexible supply-demand balance of the system on the scale of 1 h and 15 min is achieved through the optimal deployment of multi-scale energy storage.
5.2 Energy Storage Deployment Analysis
Although both thermal power unit and pumped storage unit can realize flexible adjustment of various time scales within a day, there are great differences between them. First, thermal power units include gas-fired unit and coal-fired unit. Coal fired thermal power unit accounts for a large proportion in China's major power grids. Therefore, as the main power supply, it undertakes the peak shaving task of the power system. The gas unit has high flexibility and usually participates in the flexibility adjustment of medium and short time scales within hours. The coal-fired unit after flexibility transformation can participate in the flexibility adjustment of hourly time scale. It takes about 2 h for a coal-fired thermal power unit to start in hot state. The pumped storage unit starts for about tens of seconds to several minutes at a time. The hot start-up of combined cycle units in gas-fired thermal power unit takes 1 h, and the hot start-up of pure gas-fired unit takes about 30 min. It takes about 2 h for coal-fired thermal power units from grid connection to full load. After the pumped storage unit is started, it only takes a few minutes to run from zero load to full load. It takes about half an hour for gas-fired thermal power units to go from grid connection to full load. Pumped storage unit has low loss and strong adaptability, and its participation in peak shaving has more advantages than coal-fired thermal power unit. Although the proportion of pumped storage units and gas-fired thermal power units is small at present, their wider application is the development direction in the future.
As a high-quality clean energy, natural gas is obviously superior to coal-fired power generation in terms of carbon emission. Compared with coal-fired units, natural gas power generation has high start-up success rate, good power generation quality, high electric energy conversion rate, fast electric regulation reaction speed and low carbon emission. When the power generation cost is reduced, it may replace coal-fired units as the main peak shaving resources in our province. However, restricted by the high price of natural gas, the price of natural gas power generation is significantly higher than that of coal and other power generation types. Under the same generation hours and peak shaving demand, the regulation cost per kilowatt and average annual investment cost of natural gas power generation are the highest relative to pumped storage and electrochemical energy storage. Considering natural gas units in the hybrid energy storage configuration scheme of power system is more conducive to achieve the low-carbon goal and further improve the peak shaving capacity of the system.
Pumped storage and electrochemical energy storage are high-quality peak shaving resources through night storage and day generation. Pumped storage technology is mature, flexible and reliable, with daily regulation capacity and full power response in minutes. It has the characteristics of large construction capacity, strong regulation capacity, long service life and stable operation. As the most commonly used peak shaving power supply at present, pumped storage unit can flexibly adjust the water volume of reservoir according to the load change, realize the function of peak shaving and valley filling, and provide corresponding flexible resources according to its operation state at each time scale in a day. The research and application of electrochemical energy storage are also relatively mature. Its full power response is in the millisecond level, with fast frequency modulation speed, high regulation accuracy, high charge and discharge efficiency, short construction cycle and flexible configuration. It can stabilize load fluctuation and improve power quality, and can be used for flexible regulation in the medium frequency band.
In the operation of power system, the application scenarios of 15-minute scale and hourly scale are more practical. Therefore, this paper analyzes the optimal deployment of energy storage based on the intermediate frequency and low frequency components of net load curve. Combined with the unit scale, unit output characteristics, energy storage technical characteristics and whether the practical application is mature, the coordination of three flexible resources of thermal power unit, pumped storage unit and battery energy storage are mainly considered in case study. The power supply structure of conventional thermal power, wind power and photovoltaic in the case study is shown in Table 2. Related parameters in case study is shown in Table 3.
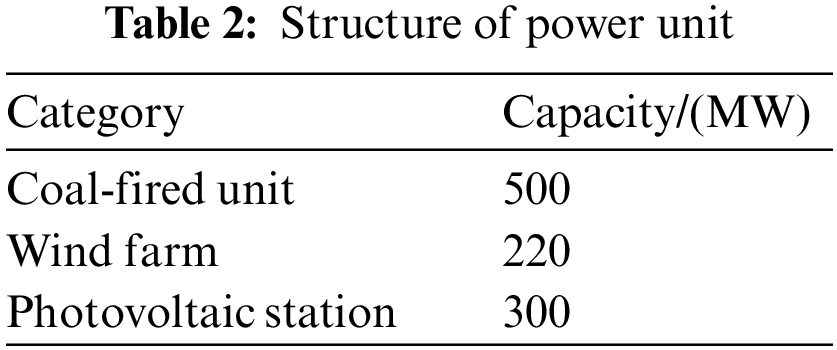
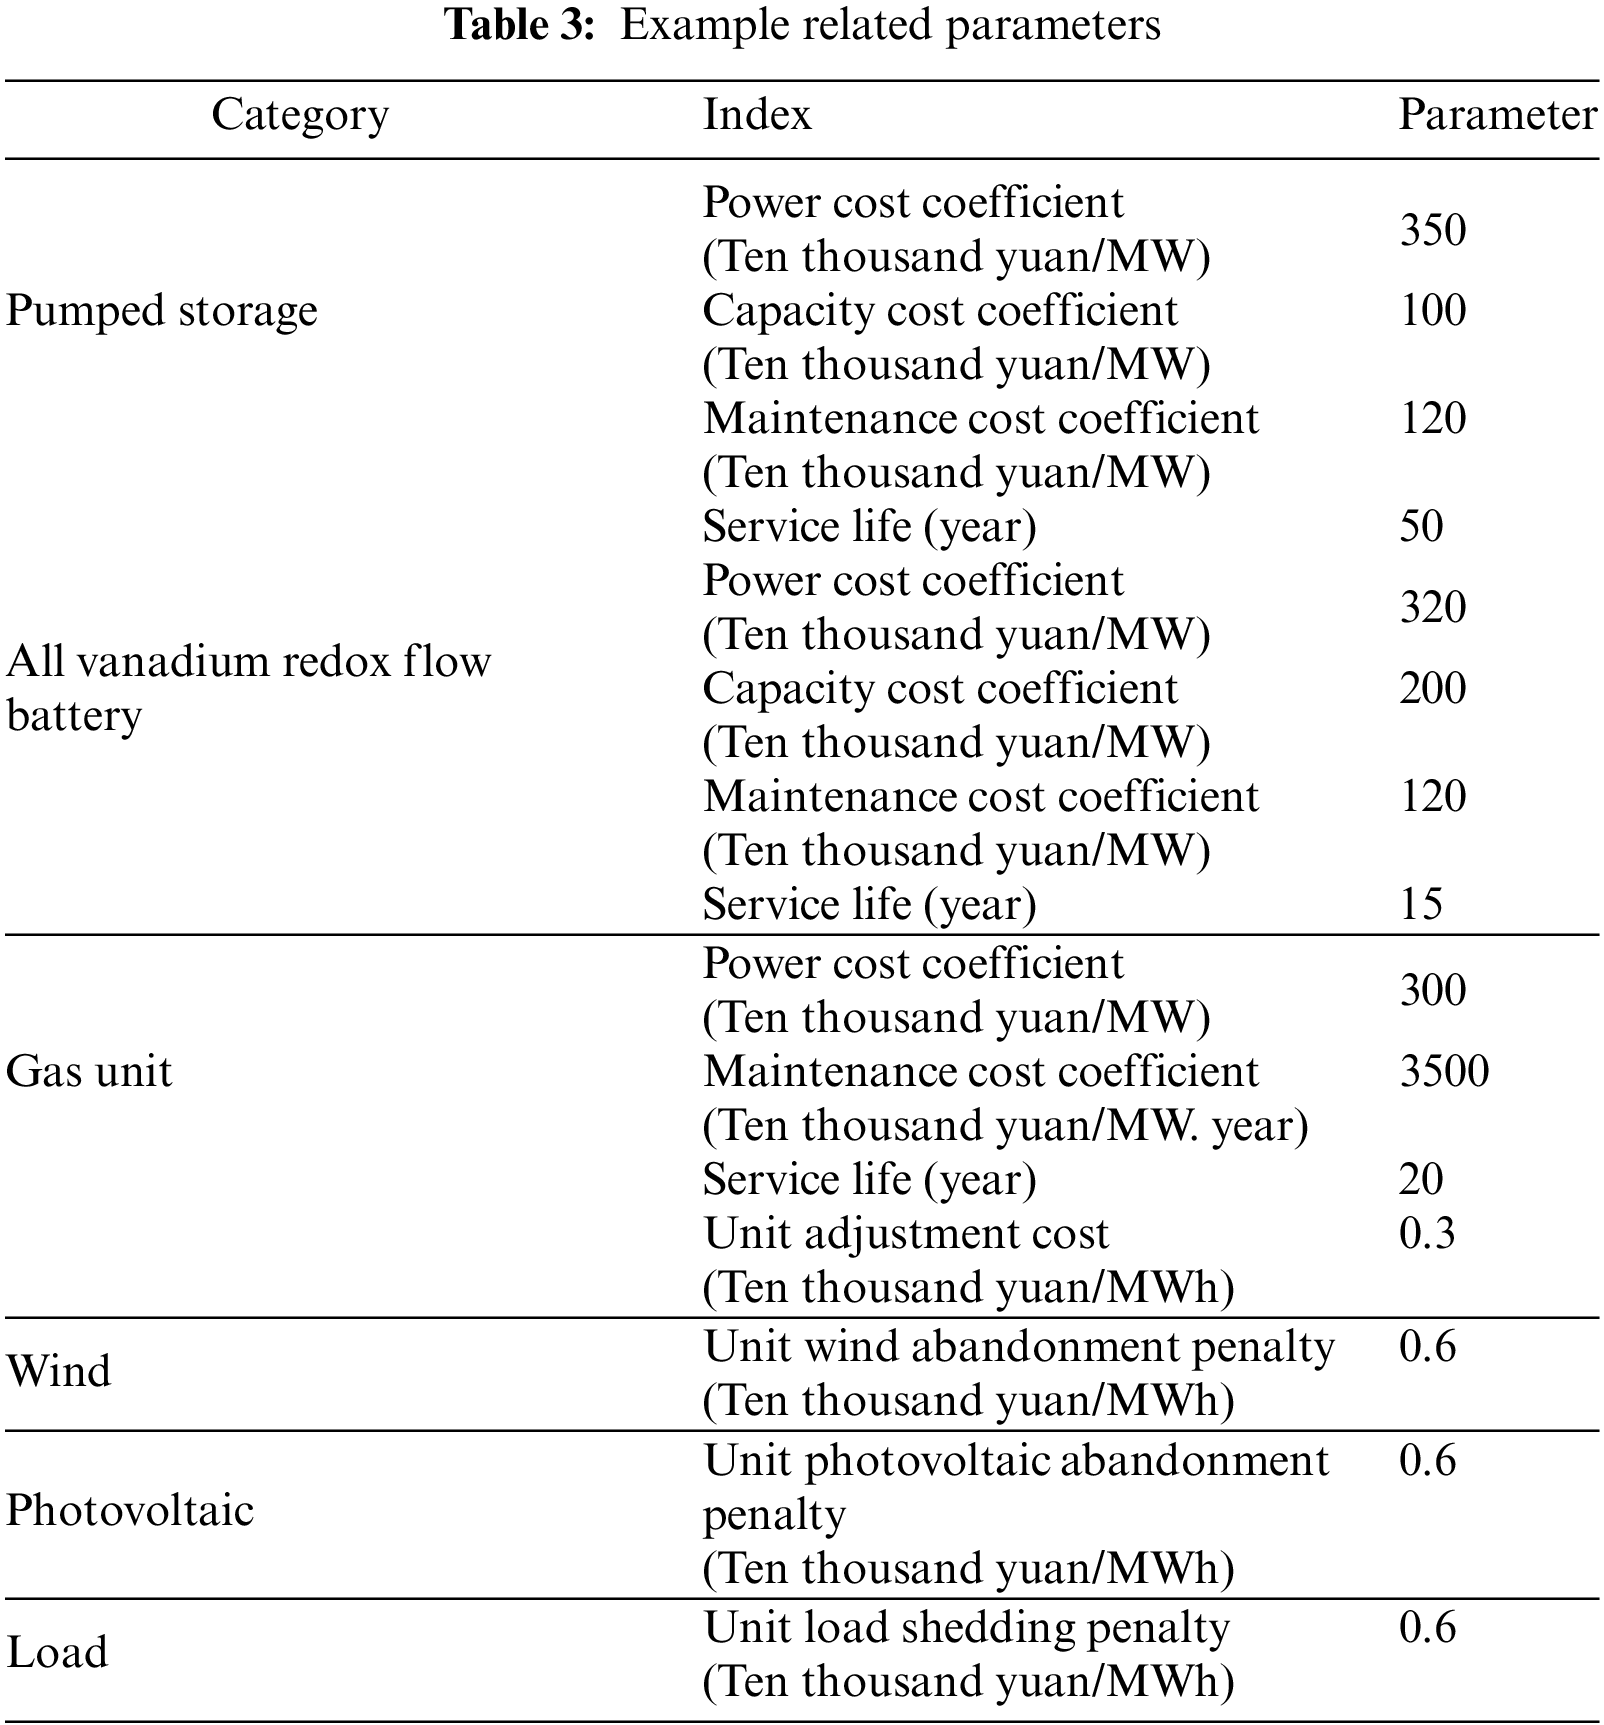
Table 4 shows the optimal deployment results of hybrid energy storage.
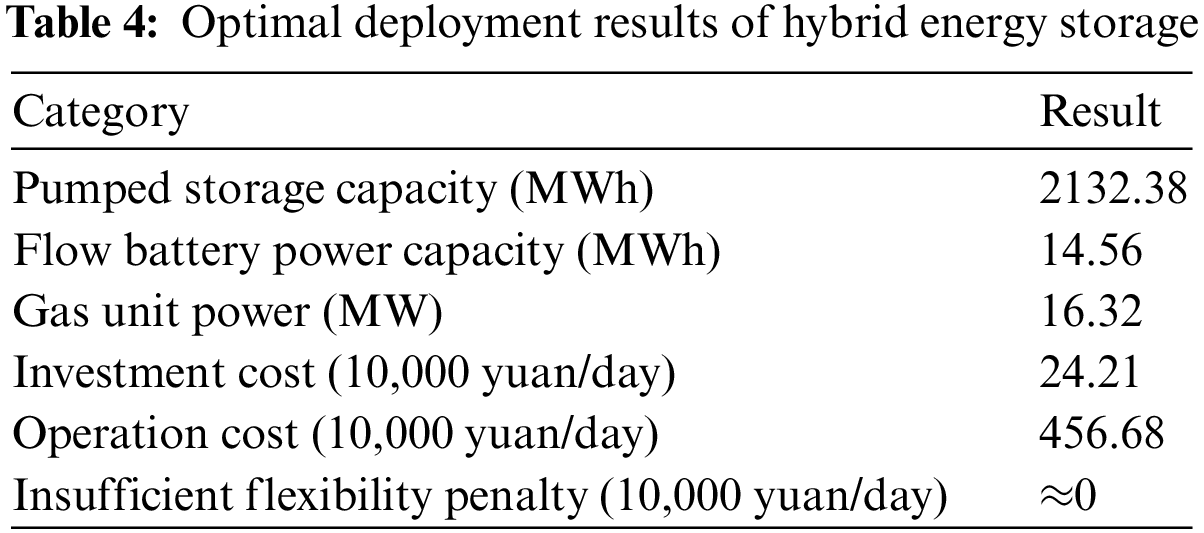
The daily average output fluctuation of wind power has the characteristic of inverse peak regulation, and the downhill section of photovoltaic noon peak has the characteristic of inverse peak regulation. Due to the joint access of wind power and photovoltaic, the two characteristics are superimposed, which greatly increases the peak regulation demand of the system. Therefore, the deployed capacity of pumped storage units on the hourly scale is large. For fluctuations on the 15-minute scale, flexible adjustment is accomplished by configuring all vanadium redox flow battery. In terms of investment cost, large scale of pumped storage units leads to high investment cost. In order to reduce the allocation demand of pumped storage units, the impact of wind and photovoltaic power on system peak shaving can be improved by optimizing the access ratio of wind and photovoltaic power, and other flexible resources such as controllable load can also be introduced for collaborative regulation. The optimal deployment results of single energy storage are shown in Table 5.
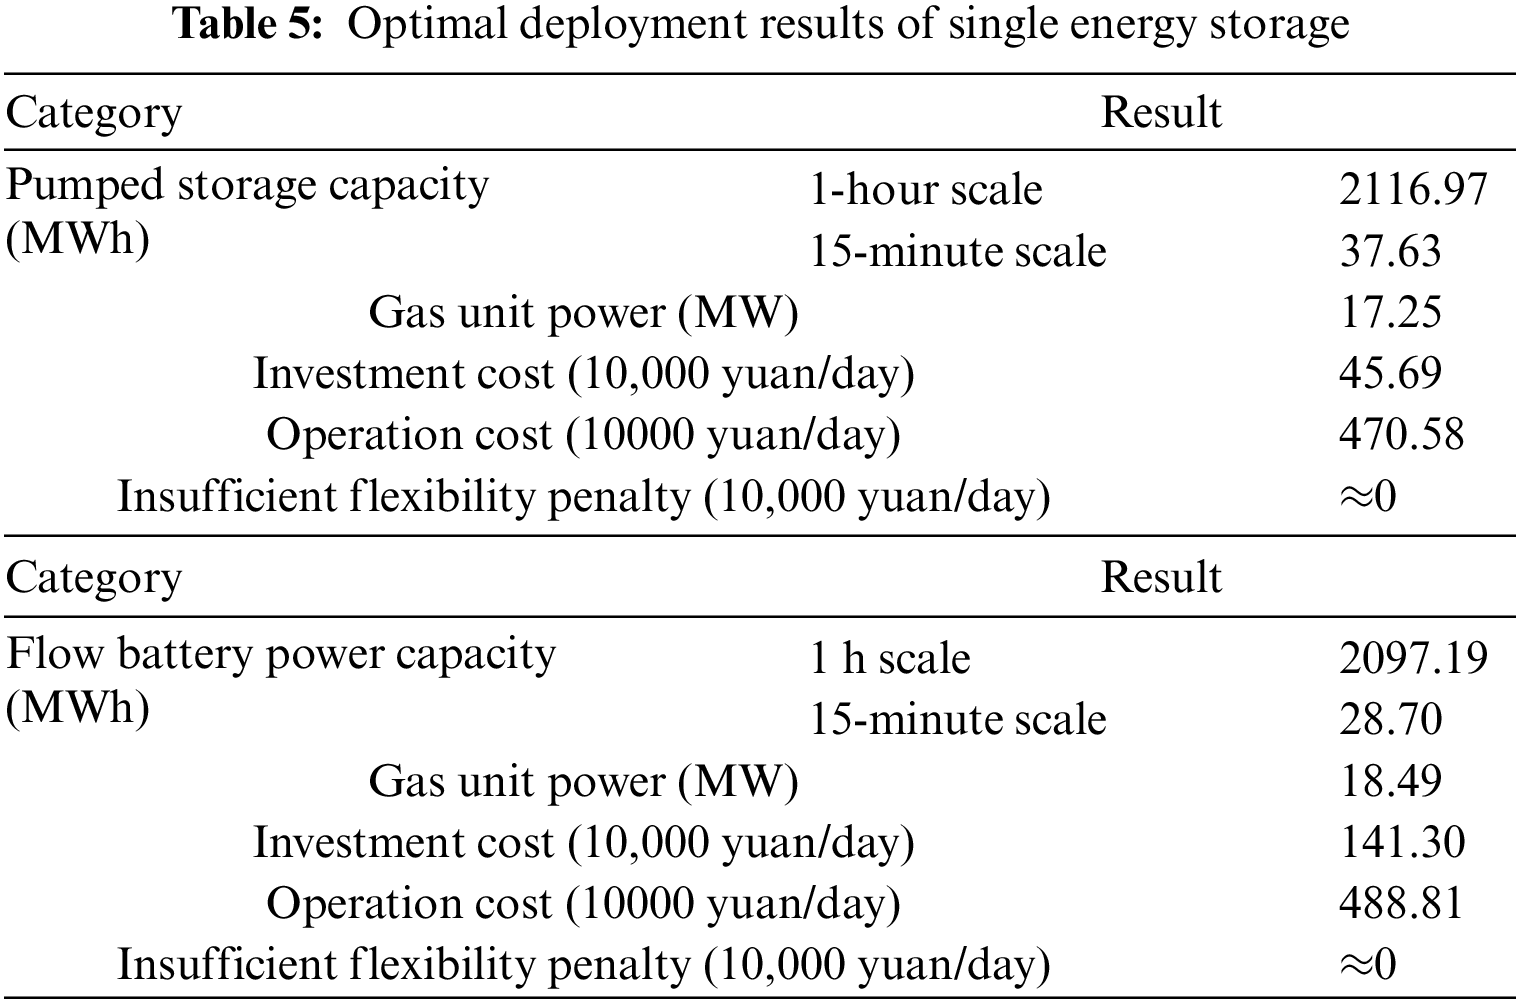
In the single storage scheme of pumped storage unit, the configured power in each scale is close to that in the hybrid energy storage scheme, which can meet the flexibility requirements of the system in each scale and reduce the occurrence of wind, photovoltaics and load rejection. However, the system investment cost increases compared with the hybrid energy storage scheme. Due to frequent regulation of pumped storage unit on a short timescale, it is operation life is significantly reduced, which increases the average daily investment cost of the pumped storage unit, so that the total investment cost is greater than the result of hybrid energy storage. In the single storage scheme of vanadium flow battery, due to the large requirements for energy storage capacity and the high cost of unit capacity and power, the investment of energy storage unit is significantly increased. Moreover, in fact the flow battery unit cannot meet flexibility requirements with weak regulation ability on the hourly scale. Additionally, it's service life is short. Therefore, the comparison of examples reflects that according to the output characteristics of energy storage, the use of hybrid energy storage can not only ensure the flexibility of the system, but also reduce the energy storage deployment cost and improve the economy of the system.
Combined with the peak and valley distribution of typical load curve, the controllable load is adjusted in different periods. During 1:00–9:00, the unit adjustment cost is 300 yuan/MWh; During the peak hours of 11:00–13:00 and 17:00–22:00, the unit adjustment cost is 300 yuan/MWh. Because different controllable loads have different response times and durations, the response loads on hourly and 15-minute time scales account for 6% and 3% of the maximum total load respectively. The energy storage allocation results with the participation of controllable load are shown in Table 6.
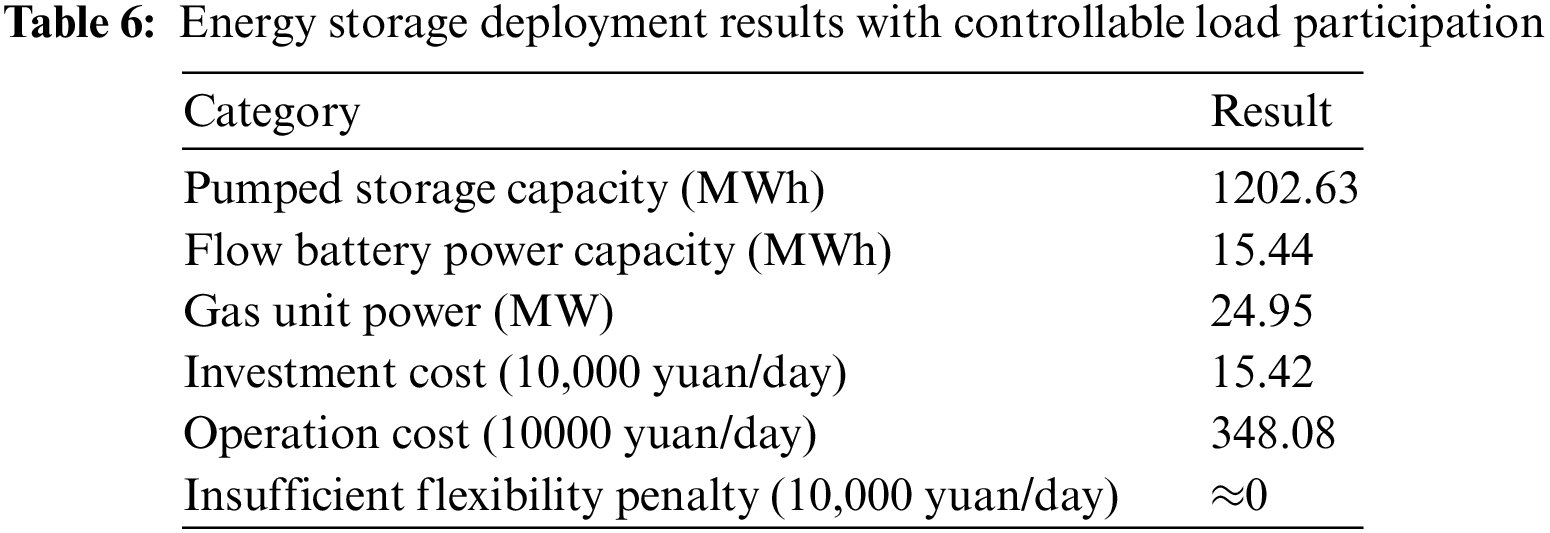
Added the controllable load, energy storage capacity of each scale is reduced, indicating that controllable load participates in the peak shaving task and reduces the demand for energy storage deployment. During the downward climbing period of load in the early morning, the output of thermal unit is limited by its climbing constraints, and part of the downward climbing load is borne by the controllable load. In the evening peak period, the system alleviates the upward climbing pressure of thermal unit and pumped storage unit by reducing part of the controllable load. Therefore, the flexible regulation of the controllable load in multiple periods reduces the peak shaving pressure of the system. The addition of controllable load provides a relatively economic choice for system peak shaving.
Based on the output characteristics and complementary characteristics of wind power and photovoltaic, this article forecasts net load through a Bayesian deep neural network, and proposes a power system flexibility evaluation method considering multi-scale decomposition of flexibility demand and a bi-level energy storage deployment optimization model. The multi-scale output characteristics, flexibility evaluation and energy storage deployment of new energy are considered, and the following valuable conclusions are drawn.
Due to the different fluctuation characteristics of wind and photovoltaics output on each time scale, high-penetration renewable energy has multi-timescale effects on the flexibility of the power system. The multi-scale morphological algorithm can accurately obtain separated multi-scale components in flexibility scale division, which is conducive to the determination of flexibility requirement in a specific fluctuation period. Considering the impact of multi-timescale flexibility demand caused by multi-timescale output of wind and photovoltaic power, a power system flexibility demand evaluation method based on multi-scale morphology is proposed to effectively distinguish multi-timescale flexibility requirement.
According to the multi-scale characteristics of flexibility demand in power system with renewable energy, considering the economy of energy storage deployment and the flexibility of system operation, a multi-scale energy storage deployment model based on bi-level decision-making is established. This model can balance flexibility requirements and flexibility resources on each time scale according to the situation of wind and photovoltaic power output in the system, and improve the flexibility of power supply.
Funding Statement: This research was supported by the National Natural Science Foundation of China (Grant No. 52107129).
Conflicts of Interest: The authors declare that they have no conflicts of interest to report regarding the present study.
References
1. Energy Research Institute of national development and Reform Commission (2015). Research on the development scenario and path of China's 2050 high proportion renewable energy. [Google Scholar]
2. National Energy Administration (2016). 13th Five-Year Plan for Renewable Energy Development. [Google Scholar]
3. Lu, S., Zhou, B., Rao, H., Zhao, W., Yao, W. (2018). Discussion on China's prospective power supply structure under the condition of high proportion photovoltaic power generation grid connection. Proceedings of the CSEE, 38(S1), 39–44. DOI 10.13334/j.0258-8013.pcsee.172360. [Google Scholar] [CrossRef]
4. Xue, Y., Lei, X., Xue, F. (2014). Comment on the impact of wind power uncertainty on power system. Proceedings of the CSEE, 34(29), 5029–5040. DOI 10.13334/j.0258-8013.pcsee.2014.29.004 [Google Scholar] [CrossRef]
5. Lannoye, E., Flynn, D., O'malley, M. (2012). Evaluation of power system flexibility. IEEE Transactions on Power Systems, 27(2), 922–931. DOI 10.1109/TPWRS.2011.2177280. [Google Scholar] [CrossRef]
6. Nosair, H., Bouffard, F. (2015). Flexibility envelopes for power system operational planning. IEEE Transactions on Sustainable Energy, 6(3), 800–809. DOI 10.1109/TSTE.2015.2410760. [Google Scholar] [CrossRef]
7. Li, H., Lu, Z., Qiao, Y., Zeng, P. (2015). Evaluation of power system operation flexibility for large-scale wind power grid connection. Power System Technology, 39(6), 1672–1678. DOI 10.13335/j.1000-3673.pst.2015.06.032. [Google Scholar] [CrossRef]
8. Zhan, X. (2020). Research on multi-scale power flexibility evaluation and energy storage configuration of high proportion renewable energy grid. South China University of Technology. DOI 10.27151/d.cnki.ghnlu.2020.001167. [Google Scholar] [CrossRef]
9. Zhang, L., Xu, J., Yang, J., Yang, D. (2008). Adaptive multiscale morphological analysis and its application in bearing fault diagnosis. Journal of University of Science and Technology Beijing, 2008(4), 441–445. DOI 10.13374/j.issn1001-053x.2008.04.047. [Google Scholar] [CrossRef]
10. Cao, F., Zhang, L. (2007). Determination of pumped-storage plant capacity with peak-regulation proportion. Electric Power Automation Equipment, 2007(6), 47–50. DOI 10.3969/j.issn.1006-6047.2007.06.011. [Google Scholar] [CrossRef]
11. Tao, Q., Sang, B., Ye, J., Xue, J. (2016). Optimal configuration method of distributed energy storage system in high photovoltaic permeability distribution network. High Voltage Engineering, 42(7), 2158–2165. DOI 10.13336/j.1003-6520.hve.20160713017. [Google Scholar] [CrossRef]
12. Chen, G., Yuan, Y., Fu, Z. (2014). Application of energy storage cells to stabilize the fluctuation of photovoltaic power generation. Proceedings of the CSU-EPSA, 26(2), 27–31. DOI 10.3969/j.issn.1003-8930.2014.02.005. [Google Scholar] [CrossRef]
13. Shen, Z., Pei, W., Deng, W. (2015). Optimal allocation of wind farm energy storage capacity considering the influence of battery life and operation control strategy. High Voltage Engineering, 41(7), 2236–2244. DOI 10.13336/j.1003-6520.hve.2015.07.017. [Google Scholar] [CrossRef]
14. You, Y., Liu, D., Zhong, Q., Yu, N. (2014). Multi objective optimal allocation of energy storage system in active distribution network. Automation of Electric Power Systems, 38(18), 46–52. DOI 10.7500/AEPS20130722009. [Google Scholar] [CrossRef]
15. Energiewende, A. (2017). Flexibility in the thermal power plants-with a focus on existing coal-fired power plants. Berlin, Germany. [Google Scholar]
16. Dougal, R. A., Liu, S., White, R. E. (2002). Power and life extension of battery ultracapacitor hybrids. IEEE Transactions on Components and Packaging Technologies, 25(1), 120–131. DOI 10.1109/6144.991184. [Google Scholar] [CrossRef]
17. Yang, T., Song, Z., Lou, S., Wu, Z. (2018). Optimization of composite energy storage capacity for improving wind power permeability. Power System Technology, 42(5), 1488–1494. DOI 10.13335/j.1000-3673.pst.2017.2072. [Google Scholar] [CrossRef]
Cite This Article
 Copyright © 2023 The Author(s). Published by Tech Science Press.
This work is licensed under a Creative Commons Attribution 4.0 International License , which permits unrestricted use, distribution, and reproduction in any medium, provided the original work is properly cited.
 Downloads
 Citation Tools